Article

A Facile Method Using a Flux to Improve Quantum Efficiency of Submicron Particle Sized Phosphors for Solid-State Lighting Applications

1
Materials Science and Engineering Program, University of California, San Diego, 9500 Gilman Dr., La Jolla, CA 92093, USA
2
Department of Mechanical and Aerospace Engineering, University of California, San Diego, 9500 Gilman Dr., La Jolla, CA 92093, USA
3
Center for Nanoscience and Nanotechnology, 22860 Ensenada, Mexico
4
Department of Chemical Engineering, University of California, San Diego, 9500 Gilman Dr., La Jolla, CA 92093, USA
*
Author to whom correspondence should be addressed.
Ceramics 2018, 1(1), 38-53; https://doi.org/10.3390/ceramics1010005
Submission received: 17 May 2018 / Revised: 2 June 2018 / Accepted: 6 June 2018 / Published: 8 June 2018

Abstract

:
This work successfully verified that the addition of a flux (NH4F, NH4Cl, and H3BO3) during synthesis has an impact on the crystallite size and quantum efficiency of submicron-sized particles of CaMgSi2O6:Eu2+ phosphors. The addition of NH4F or NH4Cl increased the crystallite size in the submicron-sized particles, yielding an increase in emission intensity and quantum efficiency. On the other hand, the use of the H3BO3 flux crystallized a secondary phase, SiO2, and changed the lattice parameters, which degraded the luminescent properties. In addition, an excessive amount of NH4Cl was examined, resulting in nucleation of a secondary phase, CaSiO3, which changed the lattice parameters with no improvement in luminescent properties. These results demonstrate that the addition of a flux could be a method to improve the quantum efficiency of submicron-sized particles composed of nanocrystallites; however, a judicious choice of the flux composition and amount has to be carefully considered.

1. Introduction

Powder phosphors produced by the conventional solid-state reaction method have been widely researched for application in near UV-emitting LEDs (nUV-LEDs) [1,2]. This method produces micron-sized powders that have higher quantum efficiencies than smaller-sized powders [3,4], whereas chemical synthesis methods produce submicron-sized powders composed of nanocrystallites. Particle size and crystallite size should be differentiated to understand the quantum efficiency of phosphors. A powder particle can be a single crystal or consist of crystallites, the crystallite size is typically measured by X-ray diffraction or transmission electron microscopy, whereas the particle size is typically measured by dynamic light scattering or scanning electron microscopy. In the remote phosphor configuration, the phosphor particles are on a substrate that is suspended above a nUV-LEDs, as opposed to the conventional configuration where the phosphors are embedded in a polymer around a blue-emitting LED. In addition, in the remote configuration, the packing density of the large particles is low, which generates substantial light scattering [5]. To overcome this issue, phosphors with a small, narrow particle size distribution are required. If the particle radii are <~400 nm, these particles will negligibly scatter visible and near UV radiation, because particle size is smaller than the wavelength of the radiation. However, phosphor particles in the submicron-size regime with nano-sized crystallites have poor quantum efficiency compared to micrometer-sized, single crystal phosphor particles [2,6].
One method that is used to improve the crystallinity and quantum efficiency of micrometer-sized particles is to use a flux [7,8,9]. A flux material is an inert high-temperature solvent used to accelerate crystallite growth. Generally, 0.5 wt.%~10 wt.% of a flux is used [8,10], forming a thin layer of molten material around crystals during the annealing process and facilitating a high diffusivity path through the flux [10]. Crystals grow in the molten salt solvents, thus normally called flux growth. The process is a well-known method for crystal growth in materials [1,11,12]. A flux is typically used in preparing phosphor powders through a solid-state reaction method, producing regular-shaped particles and enlarged crystallites, which cause the emission intensity to be enhanced [7,8,9,13,14,15,16,17]. However, this process is rarely researched for nanocrystalline, submicrometer-sized phosphors prepared by wet chemical processes [18,19,20,21]. Table 1 shows the effect of various flux compositions on phosphor properties for application in nUV-LED lighting [7,8,9,13,14,15,16,17,18,19,20,21]. In each case, the phosphor properties (e.g., quantum efficiency, particle size and surface smoothness) were enhanced with the addition of a flux. In fact, after adding a flux, aluminates and oxides showed enlarged particles and smooth particle surfaces [7,8,15,18], silicates and oxy-nitrides have larger crystallite sizes and regular particle morphology [14,16,19,20]. Most importantly, these phosphors all have enhanced emission intensity or quantum efficiencies with the addition of a flux.
A flux is typically mixed with reactants [7,8,14,15,16,19] or as-synthesized product [20] before an annealing step; thus, is present as the molten phase during the post-synthesis annealing process. Since the flux material should be evaporated after annealing to avoid formation of impurities or second phases in the final product, the melting and boiling temperatures should be considered in relationship to the annealing conditions (temperature, atmosphere), when selecting a flux material. The criteria for selecting a flux are: (1) a low melting temperature, so that it is a liquid during the annealing process [9]; (2) a boiling temperature lower than the annealing temperature, so that the flux can be evaporated to avoid impurity or a second phase formation [13]. Fluxes having a higher boiling temperature than the annealing temperature had been used in most of the previous literature (Table 1); and (3) the difference in ionic radii of the flux and the phosphor elements must be more than 30% to avoid doping of the flux elements in the phosphors [22]. Chiang et al. [7] reported a formation of a second phase of BaAl2O4 in Y2.95Ce0.05Al5O12 with a BaF flux. This suggests that some fluxes can remain after the reaction, producing by-products.
Dai et al. [9] discussed the effect of various fluxes (NH4Cl, NH4F, H3BO3, LiF, and NaF) on the emission intensity of Y1.55Eu(III)0.45Ti2O7 phosphors with an orange-red emission under near UV light for display devices such as high-resolution and field emission displays, as well as high-power white light-emitting diodes. It was found that uniform micrometer-sized (~4 µm) particles formed with NaF and LiF fluxes, and the maximum emission intensity was achieved with NaF flux, while a narrow size distribution of the particles was not achieved with NH4Cl, NH4F, or H3BO3 fluxes. Additionally, Zhang et al. [8] examined the influence of different concentrations of BaF2 flux on the formation of Ca0.99Ce0.01Sc2O4 with green emission prepared by a solid-state reaction. After introducing BaF2, a higher particle growth rate, larger particle sizes, and more narrow particle size distribution were verified, which resulted in improved emission intensity. The emission intensity increased with the increase of the concentration of BaF2 and the maximum emission intensity corresponded to 0.5 wt.% of BaF2. The emission intensity decreased when the concentration of BaF2 was higher than 0.5 wt.%, which was attributed to particle agglomeration. Wang et al. [20] examined the effect of Li2CO3 and K2CO3 fluxes on the formation of Ca0.68Mg0.2Eu0.12SiO3 prepared by a co-precipitation method. The crystallite size increased from ~93 nm to 99 nm (6% of Li2CO3) or to 100 nm (5% of K2CO3), and the quantum efficiencies were improved (from 12% to 27% with Li2CO3 flux and to 31% with K2CO3 flux).
In this work, blue-emitting Ca0.94Eu0.06MgSi2O6 powders were synthesized through a co-precipitation method [23,24]. The powders were annealed with three different fluxes (NH4F, NH4Cl, or H3BO3). In our previous report [24], the Ca0.94Eu0.06MgSi2O6 powders formed submicrometer-sized particles having blue color with x = 0.14 and y = 0.05 on the CIE diagram, similar to those defined by the National Television System Committee color (0.14, 0.08), but the quantum efficiency was found to be low (Φ, ~5%). A low Φ is a drawback of nanocrystalline-sized phosphors; therefore, the main goal of this study was to improve the Φ using several different types of flux materials. NH4F, NH4Cl, and H3BO3 were selected as flux materials from the reported flux candidates [7,8,9,13,14,15,16,17,18,19,20] due to their low melting and boiling temperatures (Table 2), which are expected to decompose or evaporate during annealing process. Additionally, the large (>30%) ionic radii difference between the flux and the phosphor components indicates that flux contamination of the phosphor is unlikely to occur.

2. Experimental Procedure

2.1. Reagents

All chemicals were used without further purification and included tetraethyl orthosilicate (TEOS, 99.9%, Sigma Aldrich, St. Louis, MO, USA), Mg(NO3)2·6H2O (98.3%, Fisher Scientific, Hampton, NH, USA), Ca(NO3)2·4H2O (99.0%, Macron Fine Chemicals, Center Valley, PA, USA), Eu2O3 (99.99%, Alfa Aesar, Haverhill, MA, USA), nitric acid (69.3%, Fisher Scientific, Hampton, NH, USA), citric acid (C6H8O7·H2O, ACS reagent grade, Macron Fine Chemicals, Center Valley, PA, USA), ethylene glycol (C2H6OH, certified, Fisher Scientific, Hampton, NJ, USA), polyethylene glycol (PEG, C2H4O·nH2O, molecular weight = 20,000 g/mol, Sigma Aldrich, St. Louis, MO, USA), ammonium hydroxide (28~30%, BDH Aristar Plus, Center Valley, PA, USA), NH4F (96%, Alfa Aesar, Haverhill, MA, USA), NH4Cl (ACS reagent grade, Macron Fine Chemicals, Center Valley, PA, USA), and H3BO3 (99.5%, Sigma Aldrich, St. Louis, MO, USA).

2.2. Preparation of Ca0.94Eu0.06MgSi2O6 with and without a Flux

The co-precipitation method was used to synthesize the powders by following previously reported procedures [23,24]. The concentration of 6 at.% Eu2+ activator was chosen as it is reported to have the highest photoluminescence (PL) emission intensity [24]. Tetraethyl orthosilicate (2.23 mL) was added to ethanol (20 mL) with several drops of nitric acid and deionized water while stirring for 30 min. Meanwhile, Eu2O3 (0.0015 mol) was dissolved in nitric acid (0.4 mL) solution to form aqueous Eu(NO3)3 solution. Mg(NO3)2·6H2O (0.005 mol) and Ca(NO3)2·4H2O (0.0047 mol) were dissolved in deionized water with stirring. After the two nitrate solutions became transparent, all three solutions (tetraethyl orthosilicate, Eu(NO3)2, and Mg(NO3)2 with Ca(NO3)2) were mixed together and then stirred for 1 h. Subsequently, ammonium hydroxide was added dropwise into the solution to reach a pH of 10 and initiate precipitation. White precipitates were formed, and the suspension was stirred for 8 h. Next, NH4F, NH4Cl, or H3BO3 was added to the solution at amounts of 2 wt.%, 6 wt.%, or 10 wt.% of Ca0.94Eu0.06MgSi2O6. The conversion of wt.% to mol.% for each flux is shown in Table 3. The solutions were then centrifuged and dried at 80 °C for 12 h. Finally, a post-synthesis annealing step was performed at 1100 °C for 2 h in air and then at 1100 °C for 4 h in a 5% H2/95% N2 atmosphere to transform Eu3+ to Eu2+.

2.3. Characterization

The powders were analyzed by X-ray diffraction (XRD) on a D2 Phaser (Bruker, Karlsruhe, Germany) using CuKα radiation and a step size of 0.014° over a 2θ range of 20 to 80°. The crystallite sizes, lattice parameters, and ratio of the phases presented were calculated by Rietveld refinement using the TOPAS 4.2 software (Bruker). The sizes of the powders were examined by dynamic light scattering (DLS) on a Nanotrac Wave II system (Microtrac Inc., York, PA, USA) [25,26,27]. Particles were distributed in an aqueous solution by sonication in a water bath for DLS experiments. A field emission scanning electron microscope (FESEM, XL30, Philips, Amsterdam, Netherlands) at 10 keV was used to image the powders to confirm sizes and determine morphology. Samples were coated with iridium at 85 µA for 10 s before imaging. Energy dispersive spectroscopic analysis (EDS) was performed with a scanning electron microscope (Apreo SEM, FEI, Hillsboro, OR, USA) to analyze the concentration of elements. Absolute quantum efficiency (Φ) measurements were performed using an integrating sphere system, with sodium salicylate (Φ = 44%) as a reference standard. PL emission and excitation spectra were acquired with a fluorescence spectrophotometer (Hitachi F-7000, Hitachi High-Technologies Corporation, Tokyo, Japan) using λ = 350 nm excitation wavelength (pulse = 0.025 s). This excitation wavelength was selected as it produced the highest PL emission intensity for Ca0.94Eu0.06MgSi2O6 [24].

3. Results and Discussion

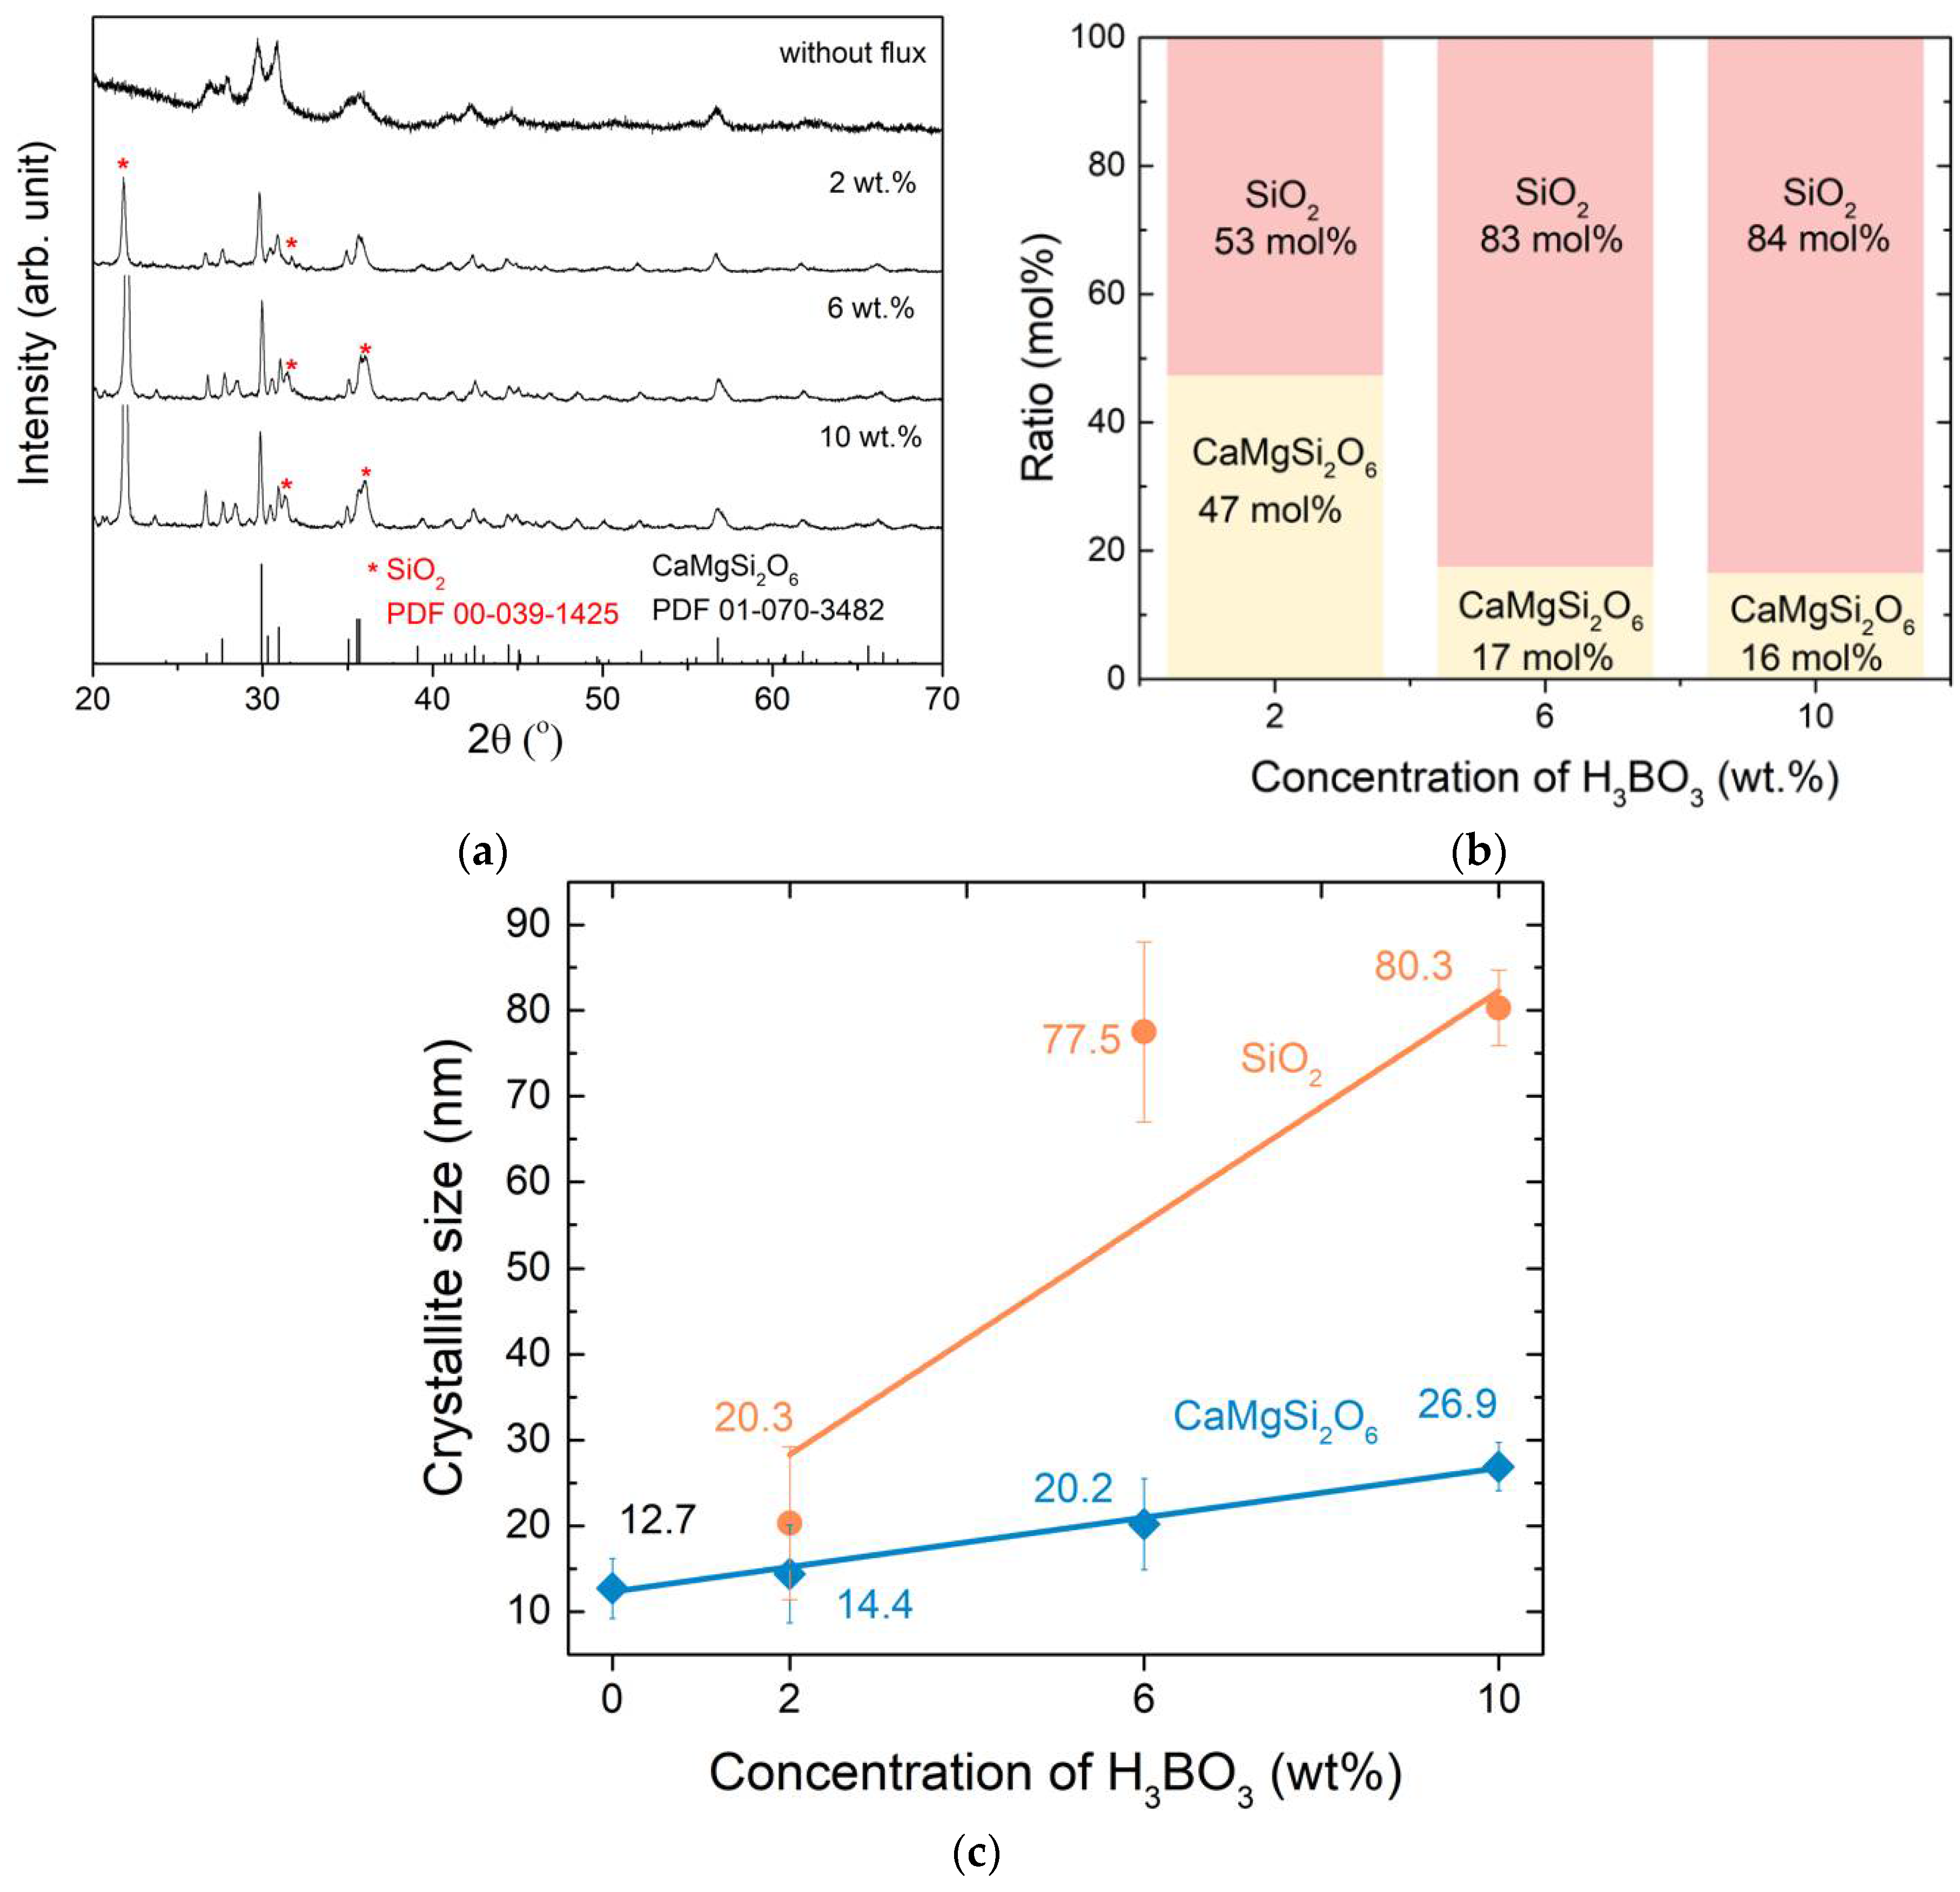
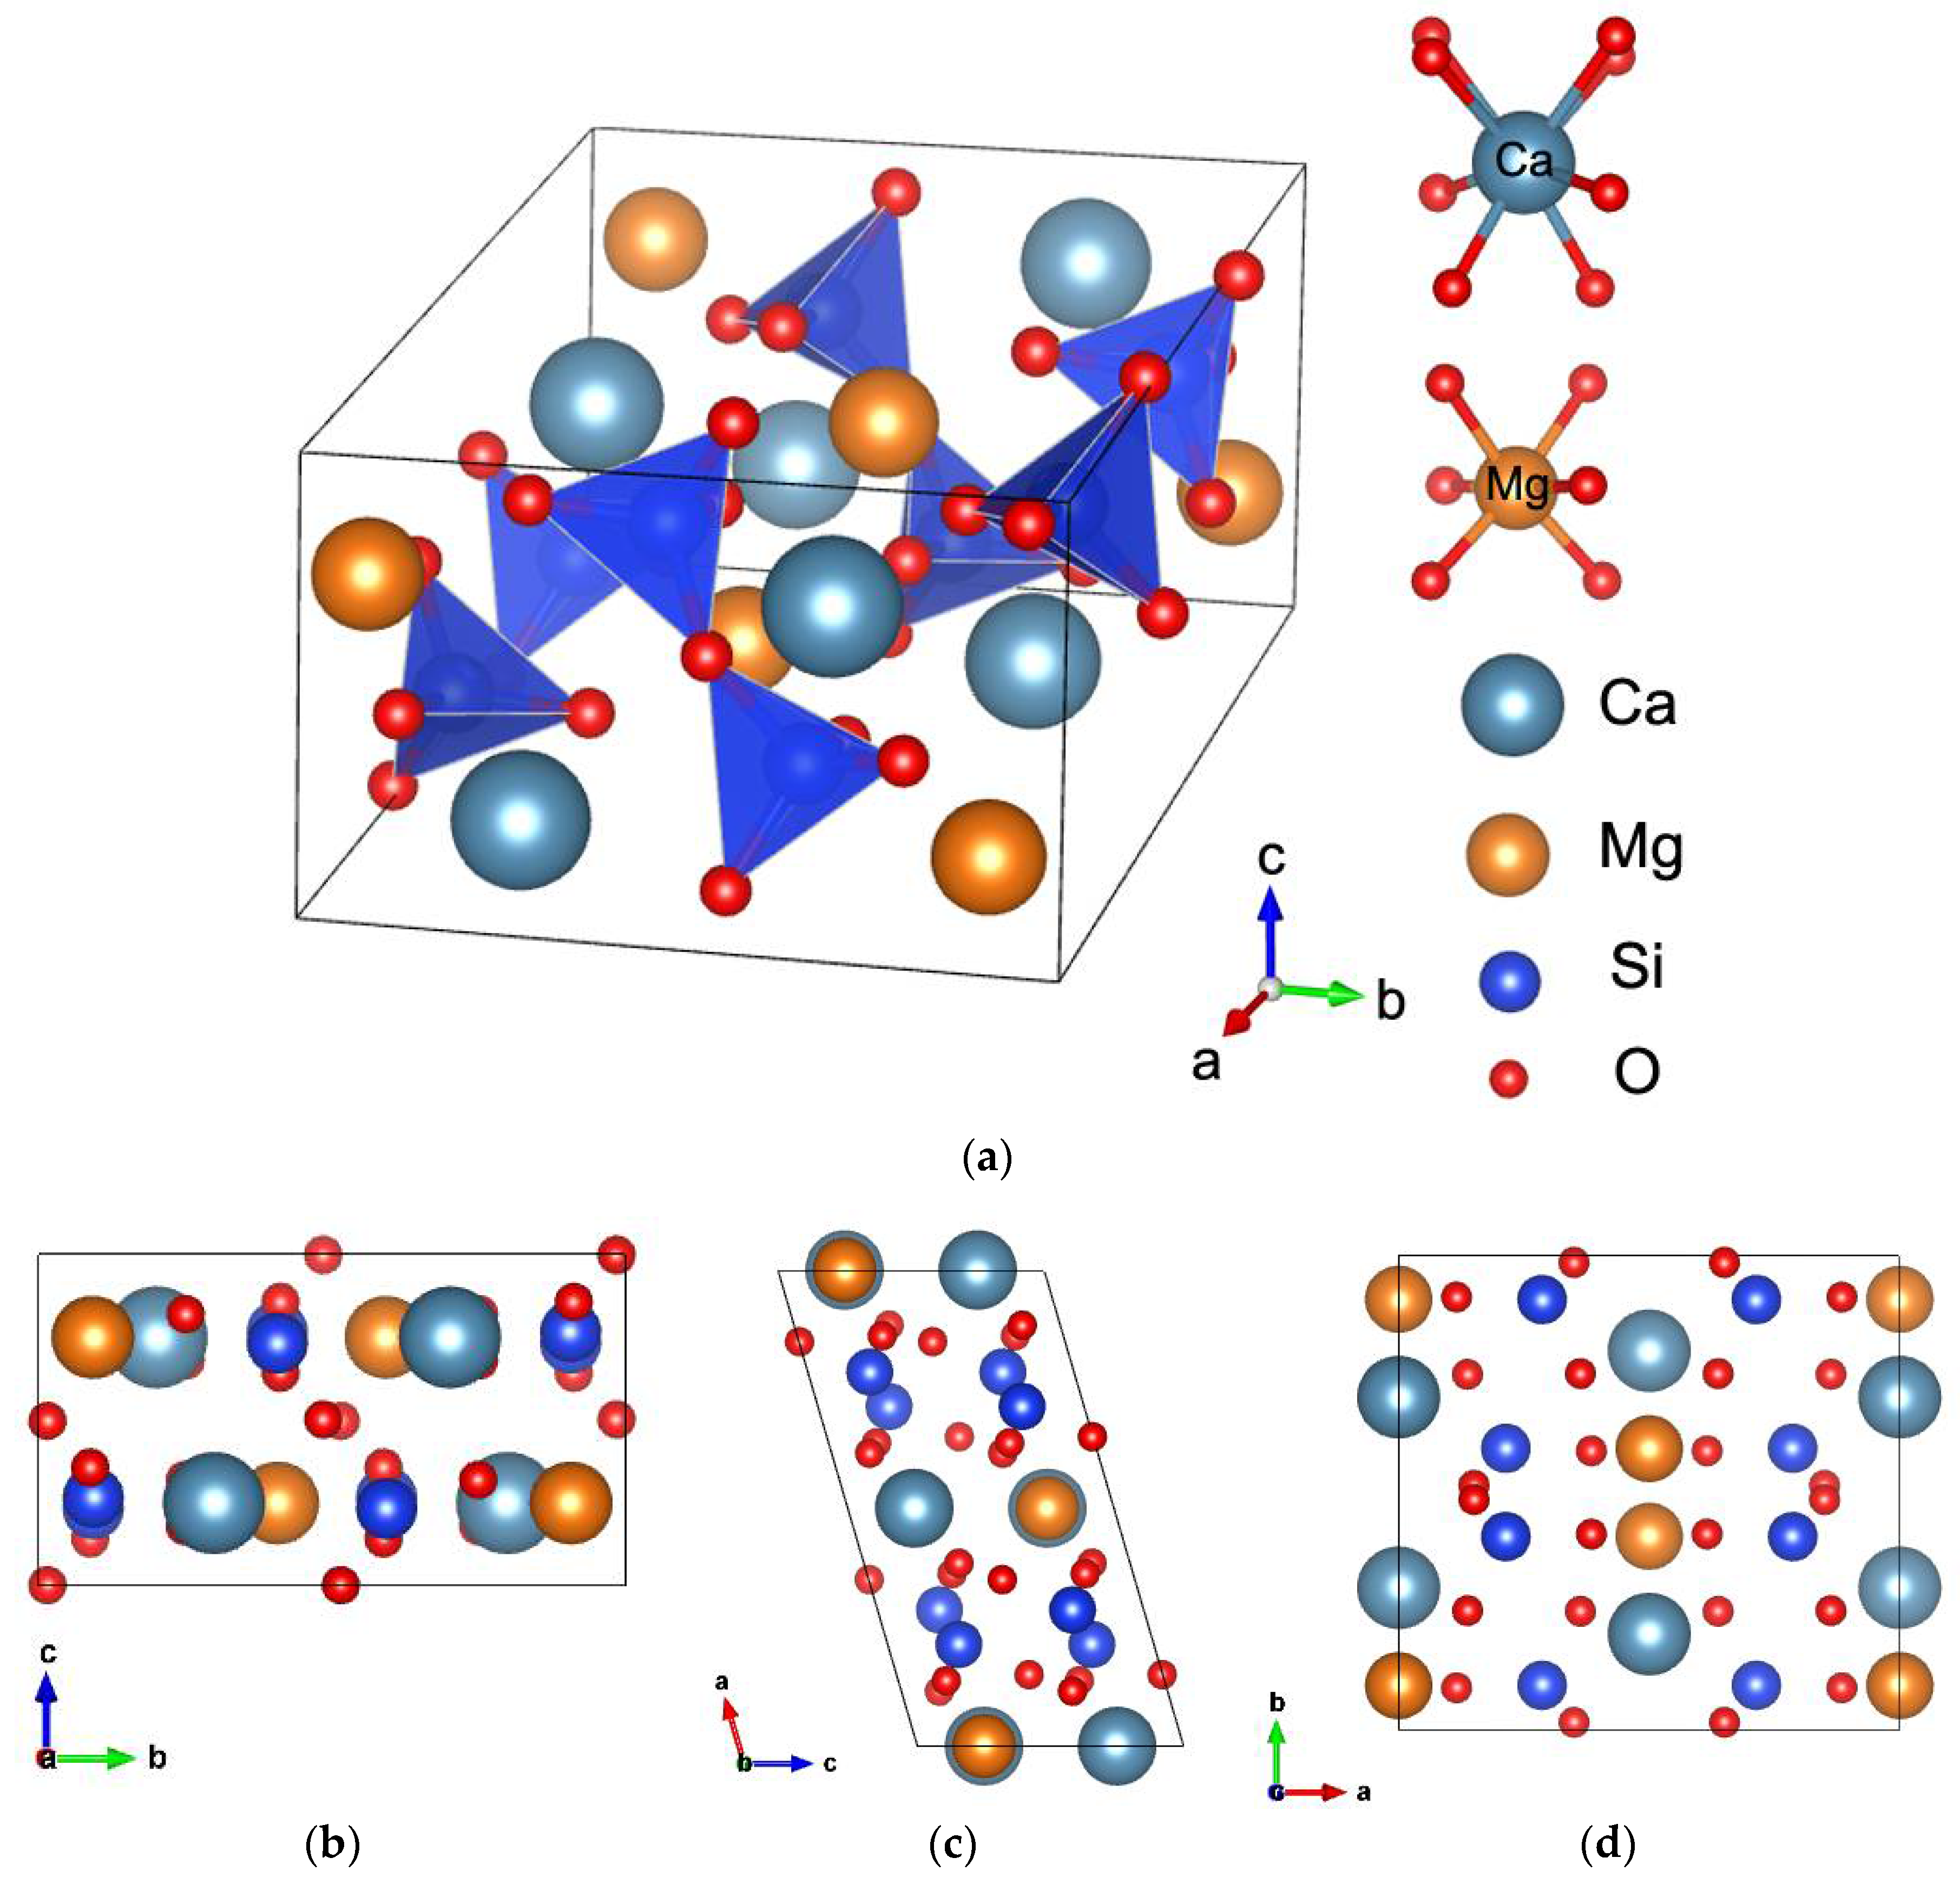
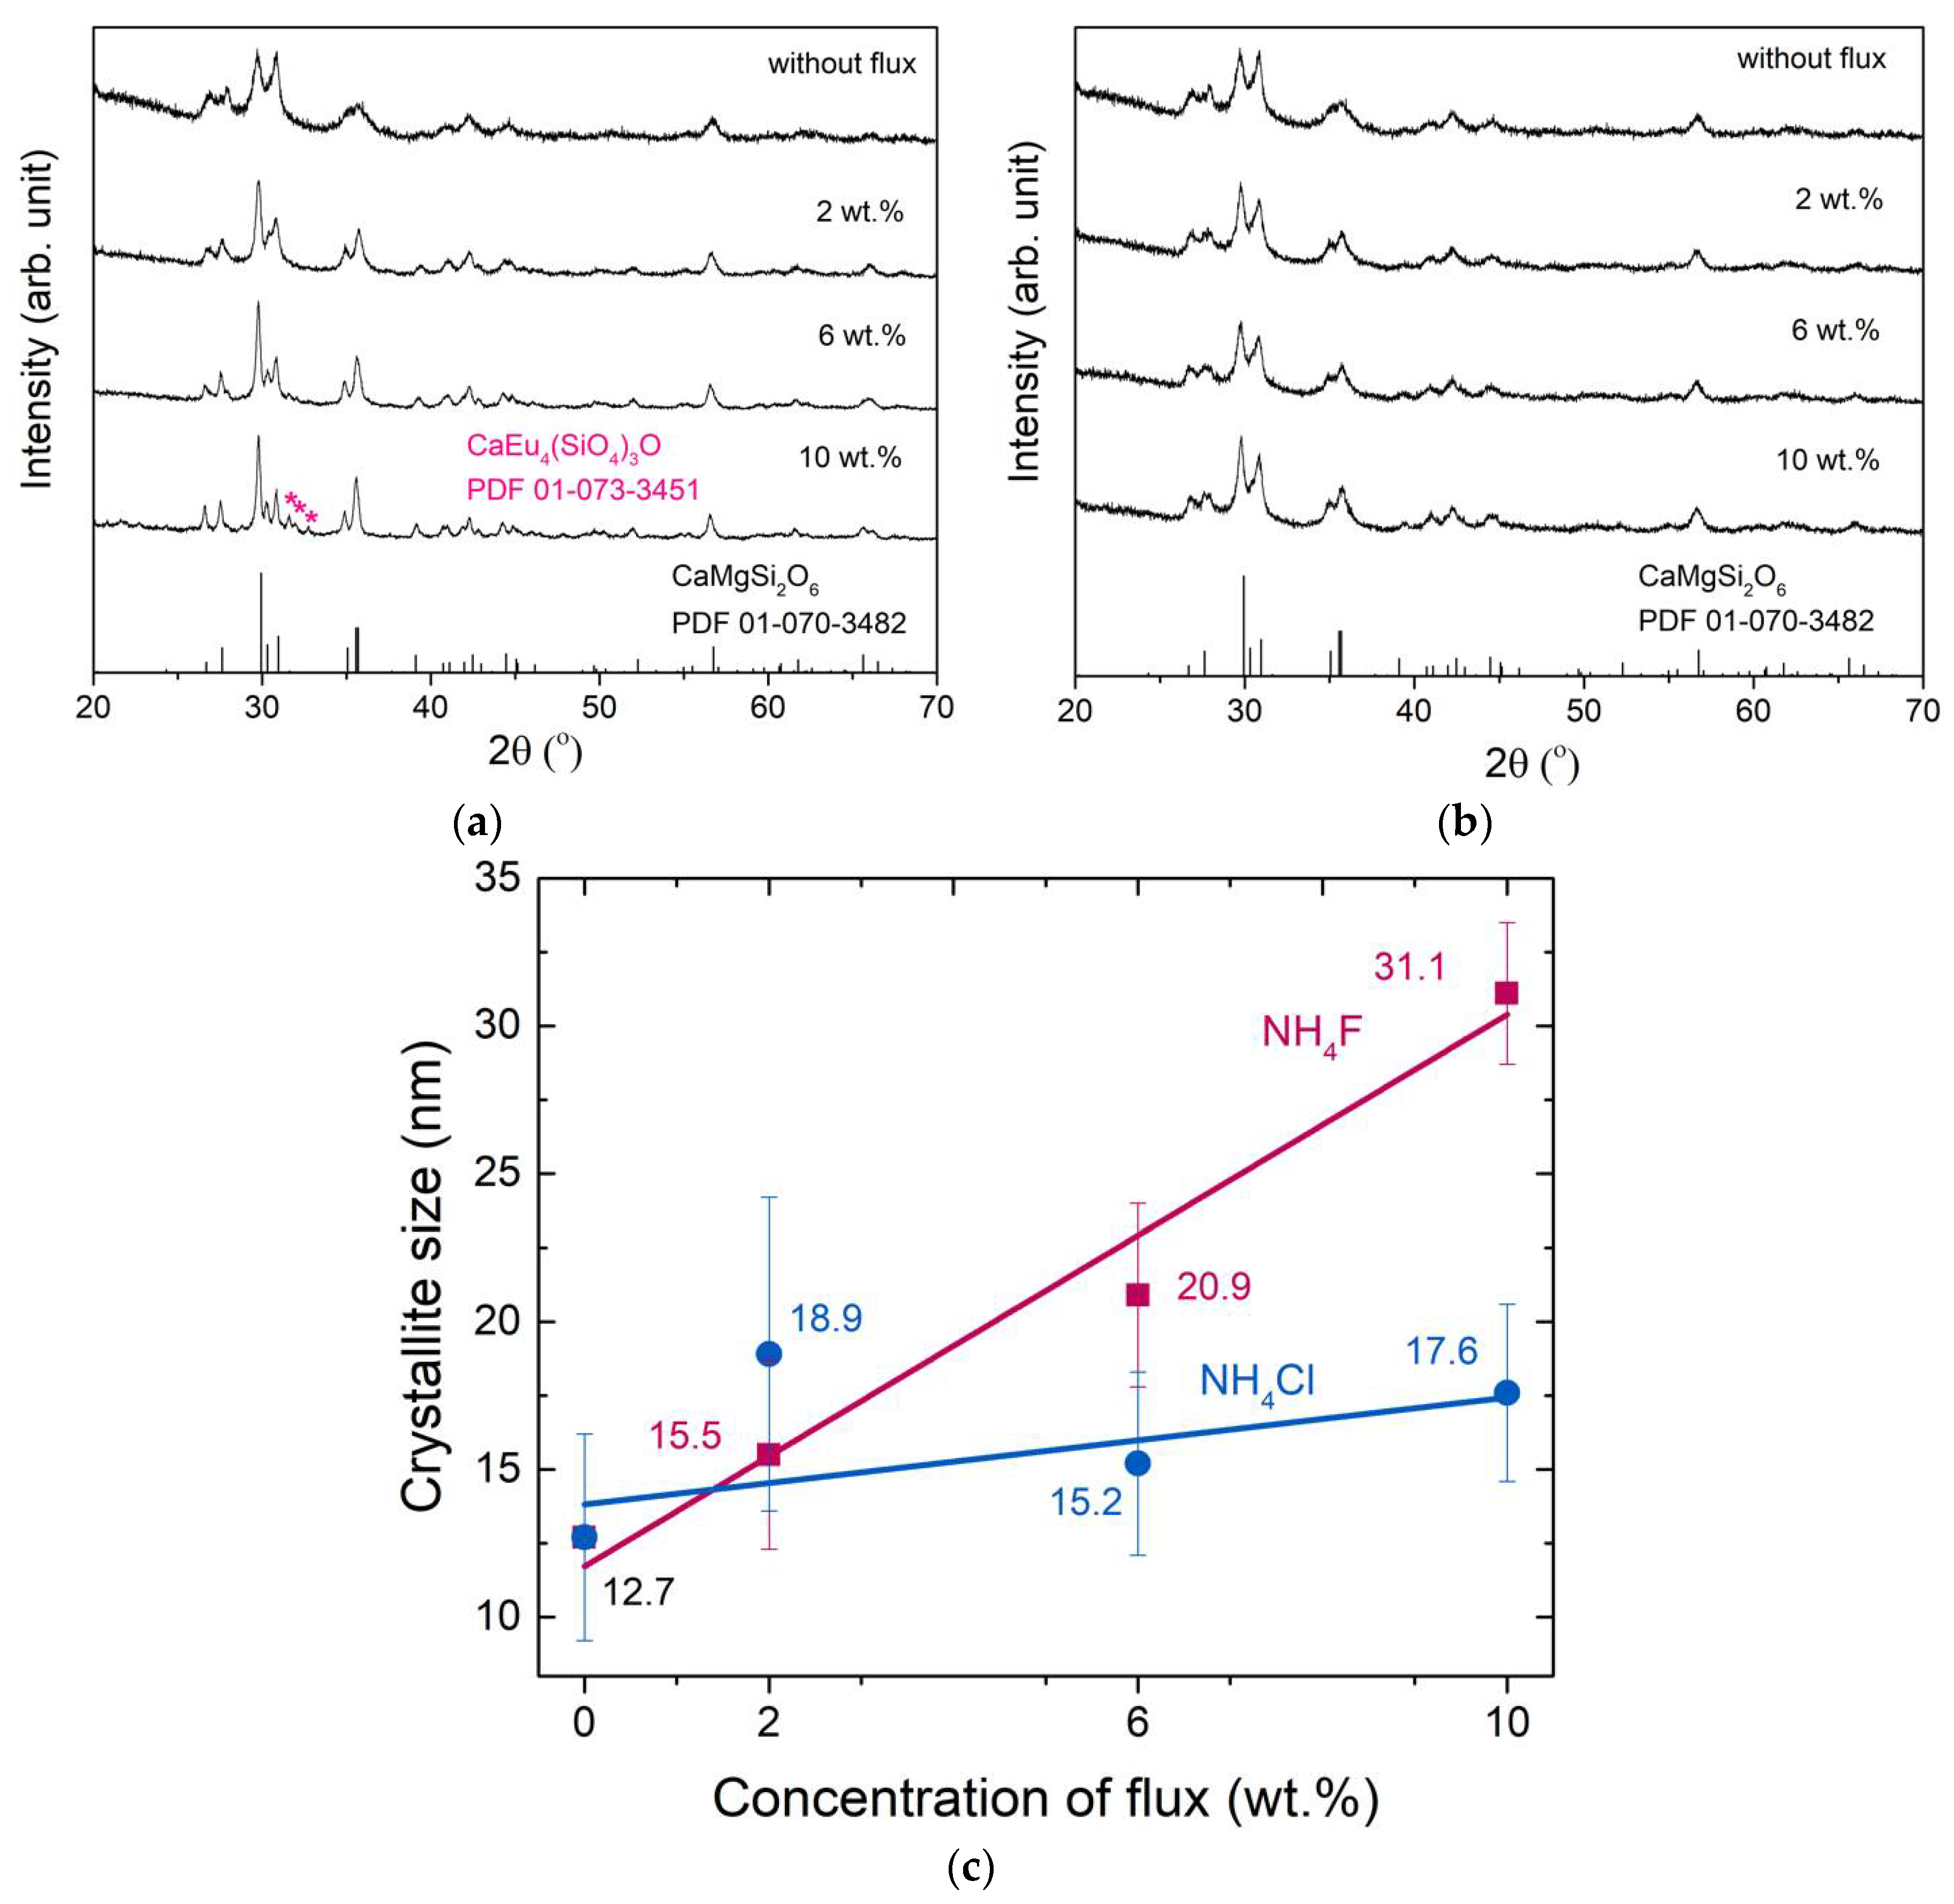
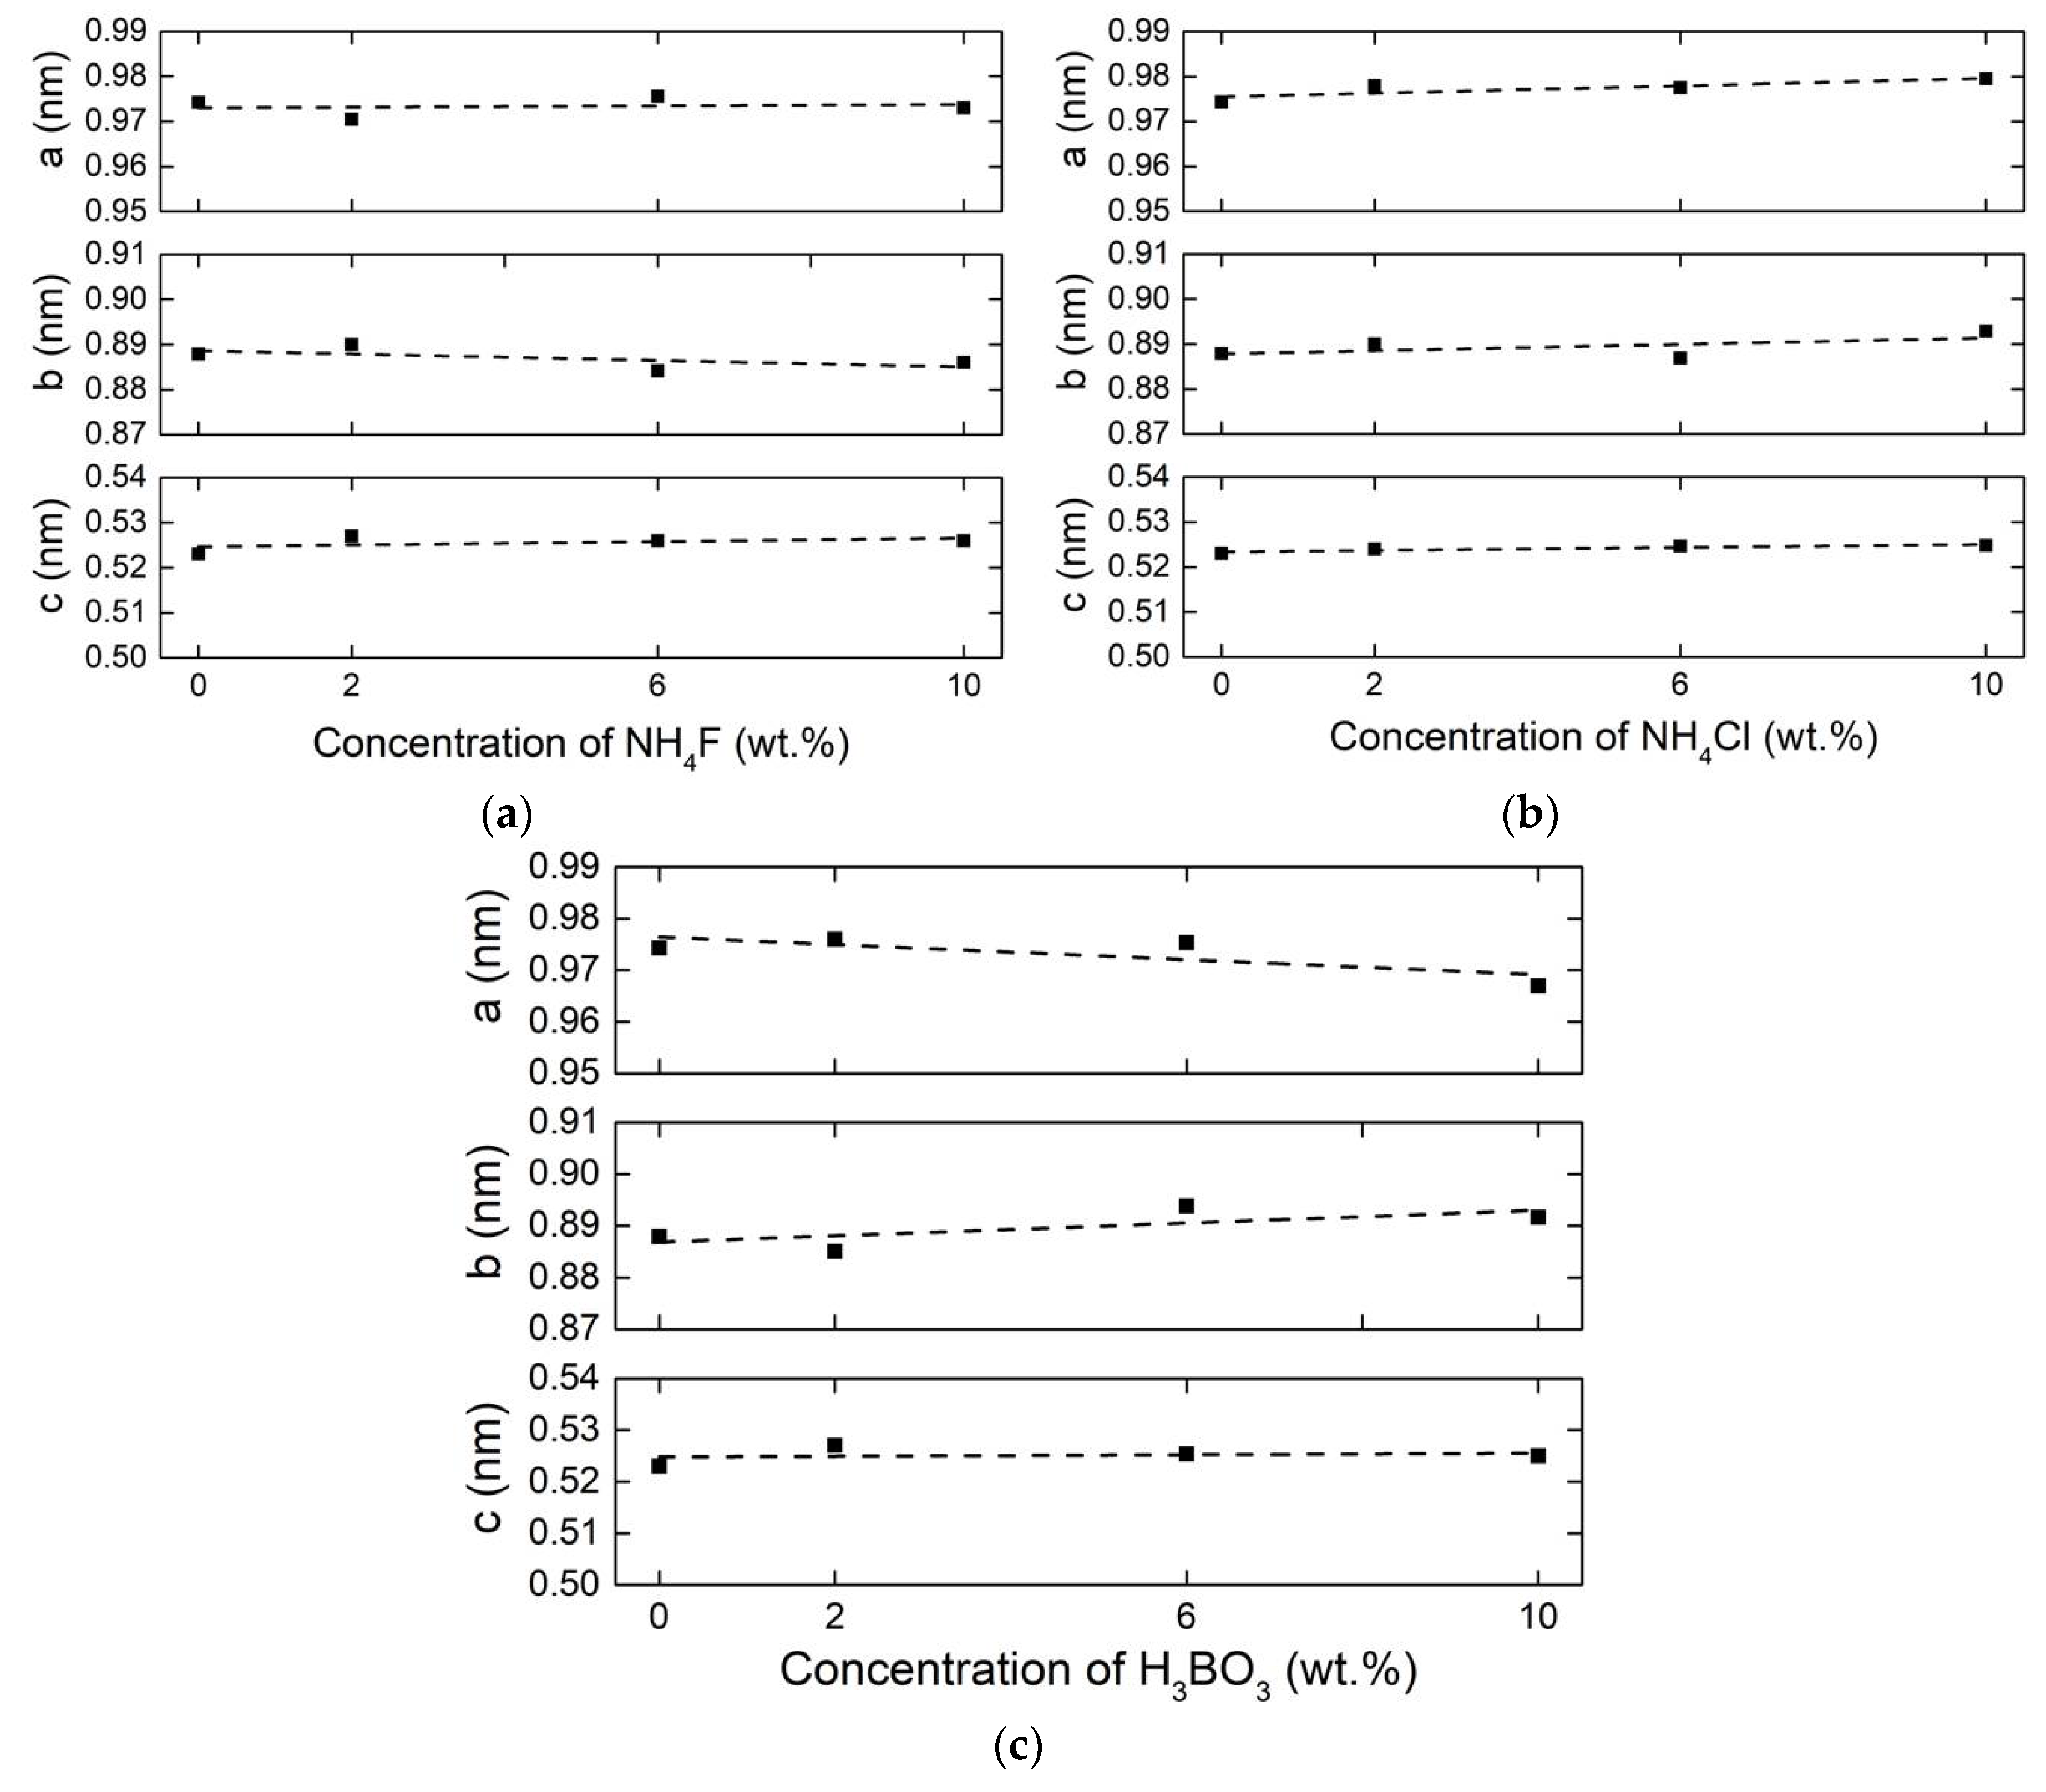
3.1. Crystal Structure and Lattice Parameters

Figure 1 shows the crystal structure of CaMgSi2O6. Also known as diopside, it has a monoclinic crystal structure with space group C2/c. The lattice parameters are a = 0.9743 nm, b = 0.8879 nm, c = 0.5230 nm, and β = 105.53° [24]. The coordination numbers for Ca2+, Mg2+, and Si4+ of 8, 6, and 4, respectively. The ionic radii of the ions are listed in Table 4. The radii differences between ions in CaMgSi2O6 and the flux are Mg2+-B3+ = 90%, Si4+-B3+ = 81%, O2−-F = 5% (4-coordinated, 6-coordinated), O2−-Cl = 26% (6-coordinated). The F from NH4F and Cl from NH4Cl are likely to be composed to HF (g) and HCl (g) during the annealing process (Table 2) although the radii difference between O2− and F/or Cl is less than 30%. H+ may occupy interstitial sites in the lattice because of its small size. Eu3+ (0.107 nm for 8-coordinated) is expected to occupy the Ca2+ sites due to the radii size similarity (5% difference) before reduction annealing and transforms to Eu2+ after reduction.
XRD patterns of Ca0.94Eu0.06MgSi2O6 with and without NH4F and NH4Cl fluxes are shown in Figure 2. The peak widths narrowed with an increase in the concentration of NH4F (Figure 2a), indicating an increase in crystallite size. Several small peaks from CaEu4(SiO4)3O were recorded for 10 wt.% NH4F. CaEu4(SiO4)3O was previously identified in Ca0.94Eu0.06MgSi2O6 under annealing temperature of 1247 °C [29], which is a higher temperature than used in the present study, with no flux. As shown previously, a flux can decrease the temperature for the crystallization of phosphor materials [7,13], so that excessive NH4F may lead to the new formation of CaEu4(SiO4)3O at the lower temperature by reducing the corresponding formation temperature. For the diffraction patterns from the powders prepared using NH4Cl flux, shown in Figure 2b, the peak width also slightly narrowed with the increase of concentration of NH4Cl. However, this narrowing is less pronounced in comparison with the NH4F, indicating that the crystallite sizes with NH4F flux were larger. The crystallite sizes for different concentrations of NH4F and NH4Cl fluxes are shown in Figure 2c. For the NH4F flux, the crystallite size increased from roughly 13 nm with no flux to about 31 nm with 10 wt.% NH4F. The maximum crystallite size for NH4Cl flux was about 19 nm with 2 wt.% NH4Cl. Different diffusion rates of the reactants through a flux may explain why the material produced with NH4F flux shows enlarged crystallite sizes compared to that made with NH4Cl flux. Ions move through liquid flux during the annealing process with a diffusion coefficient expressed by D = (1/f)·kT, where f is the frictional coefficient, k is the Boltzmann’s constant, and T is the absolute temperature. The frictional coefficient can be expressed by f = πμr, where μ is viscosity and r is the radius of the ion. Therefore, a relationship D ∝ 1/r is found. F (0.119 nm) is smaller than Cl (0.167 nm), therefore NH4F may act as a more effective flux compared to NH4Cl from the point of view of enhanced diffusivity, assuming equivalent viscosities.
With the H3BO3 flux, SiO2 impurities were detected, as shown in the XRD patterns in Figure 3a. Even though B3+ and Si4+ have quite different ionic radii (0.026 nm and 0.011 nm) [30], a substitution of B3+on Si4+ sites on the tetrahedral site has been previously reported [31,32] although there is a charge difference between B3+ and Si4+. Marler et al. [31] reported synthetic tourmaline (olenite) to replace partial silicon ions with excessive boron ions; and the difference in charge between Si4+ and B3+ was compensated by protons leading to the unusually high water content. Xia et al. [32] studied La5(Si2−xB1−x)(O13−xNx):Ce3+ by replacing partially B3+ - O2− by the Si4+ - N3−; and the charge difference from the replacement of B3+ by Si4+ was compensated by the substitution of O2− by N3−. In the current study, the charge difference from the partial replacement of Si4+ by B3+ could be compensated to produce oxygen vacancies due to no other ion replacements.
With an assumption that B ions partially replace the Si ions, the corresponding chemical reaction is:
CaMgSi2O6 + xH3BO3 → CaMg(Si1−x/2Bx/2)2O6 + xSiO2 + xH2O + x/2H2.
As the amount of H3BO3 increased (2–10 wt.%), the corresponding amount of SiO2 increased (53–84 mol.%, Figure 3b). The crystallite size of the phosphor increased from ~13 nm to ~27 nm, while for SiO2 it increased from 20 nm to 80 nm (Figure 3c).
The calculated lattice parameters of Ca0.94Eu0.06MgSi2O6 with and without each flux are shown in Figure 4. The lattice parameters of powders prepared with NH4F and NH4Cl (Figure 4a,b) were identical to the phosphors prepared without flux, indicating that these two fluxes did not affect the crystal structure of the resultant materials. In contrast, with H3BO3 flux, the b and c parameters did not show significant change, while a decreased from 0.9743 nm to 0.9670 nm. This is presumably due to the substitution of B3+ (0.011 nm) with Si4+ (0.036 nm) sites, causing the lattice parameter to decrease. Vegard’s law [33], which is an empirical rule based on a linear relationship found between lattice parameters and the size of the constituent elements. The formation of ½O vacancies from the charge difference between Si4+ and B3+ can affect the lattice parameters. Therefore, the relationship between the initial lattice parameter and the one with B3+ is a = a 0 x ( r S i r B ) 1 2 x r O , where a is the lattice parameter (0.9670 nm) with 10 wt.% B3+ addition, a0 is the initial lattice parameter (0.9743 nm), x is the partial substitution of B on Si, r S i , r B , r O are the radii of Si4+, B3+, and O2−, respectively. The x value obtained is 0.09, which is smaller than the molar fraction of H3BO3 added (0.28 converted from 10 wt.% H3BO3). The excess B3+ was not detected in the XRD patterns (detection limit of 3 ~ 5 wt.%). Therefore, due to the low boiling temperatures, it likely does not remain in the resultant powder. The change of lattice parameter a, while parameters b and c remain unchanged, can be explained by the ion arrangement. Along the [100] and [001] directions (see Figure 1b,d), there are two Si4+ along the a-axis, four along the b-axis, and three along c-axis. The fractions of one Si4+ along the a-, b-, and c-axes are 0.50, 0.25, and 0.33, respectively. The fraction of Si4+ along the a-axis is the largest, so that the replacement of Si4+ is affected more along this axis, resulting in a decrease of a with an addition of 10 wt.% H3BO3. Another possible reason for a change in lattice parameter of Ca0.94Eu0.06MgSi2O6 is H+ dissolved in interstitial sites, but this would cause an increase of lattice parameters, which was not observed.

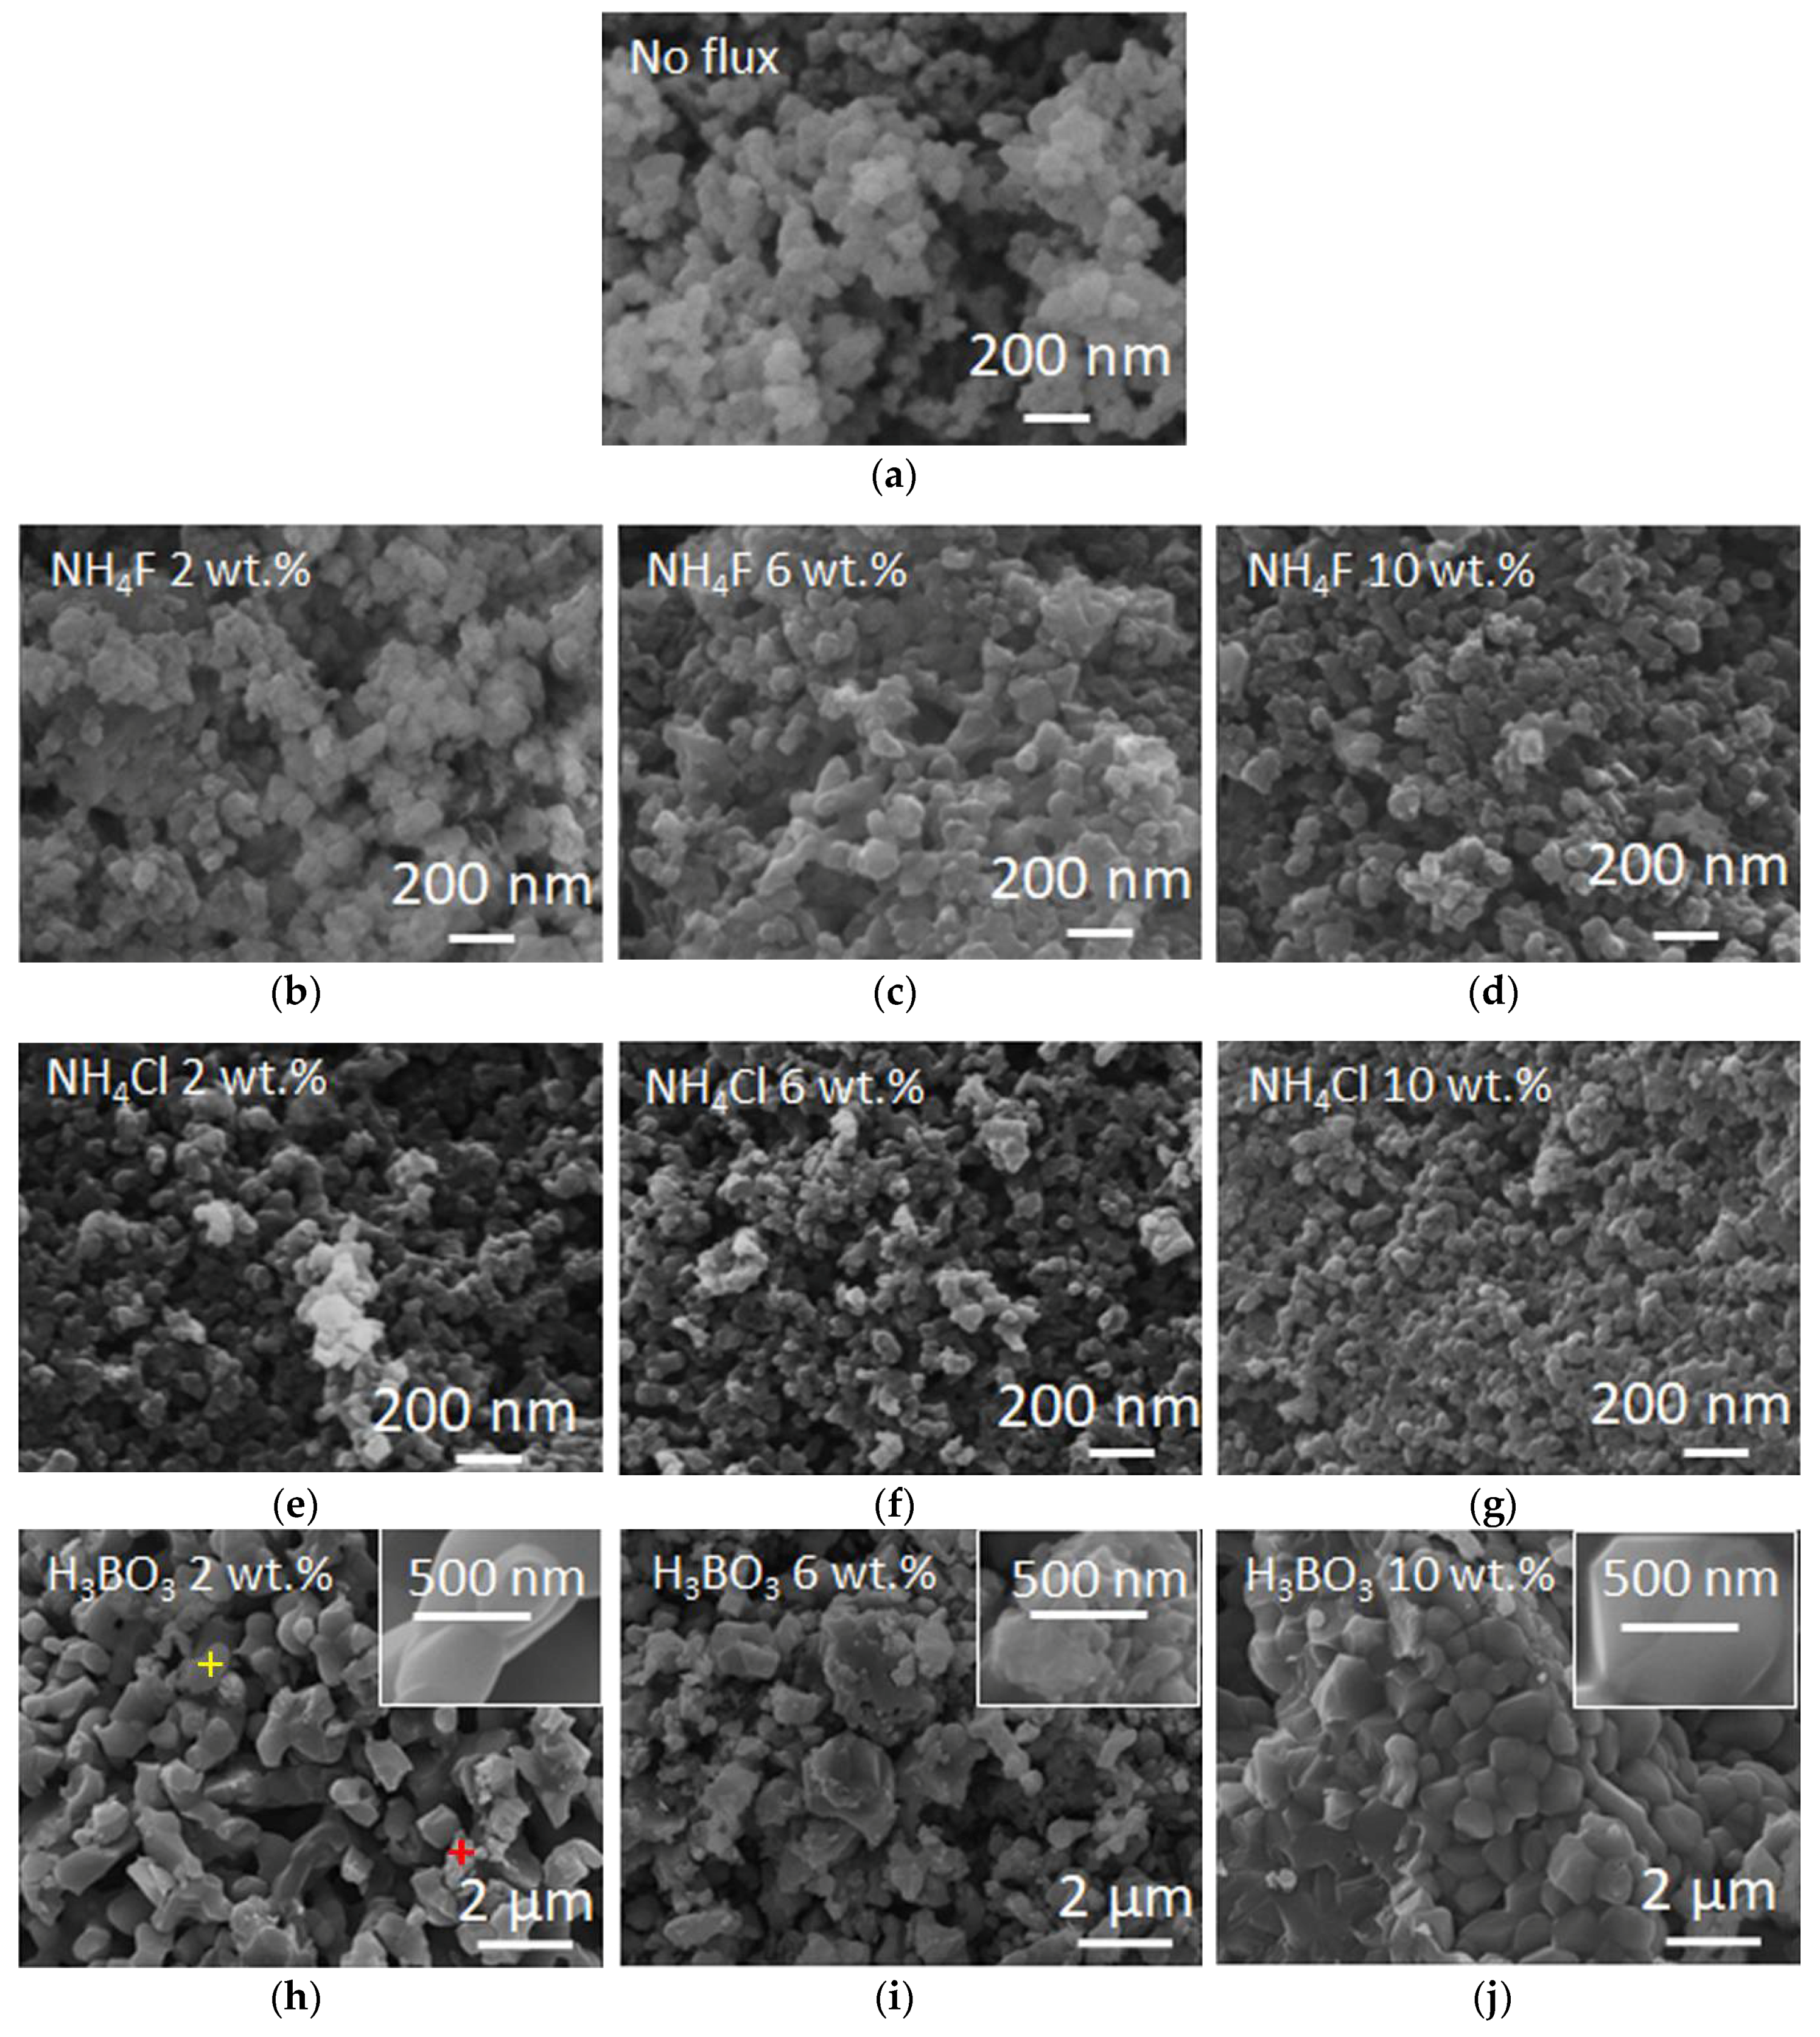
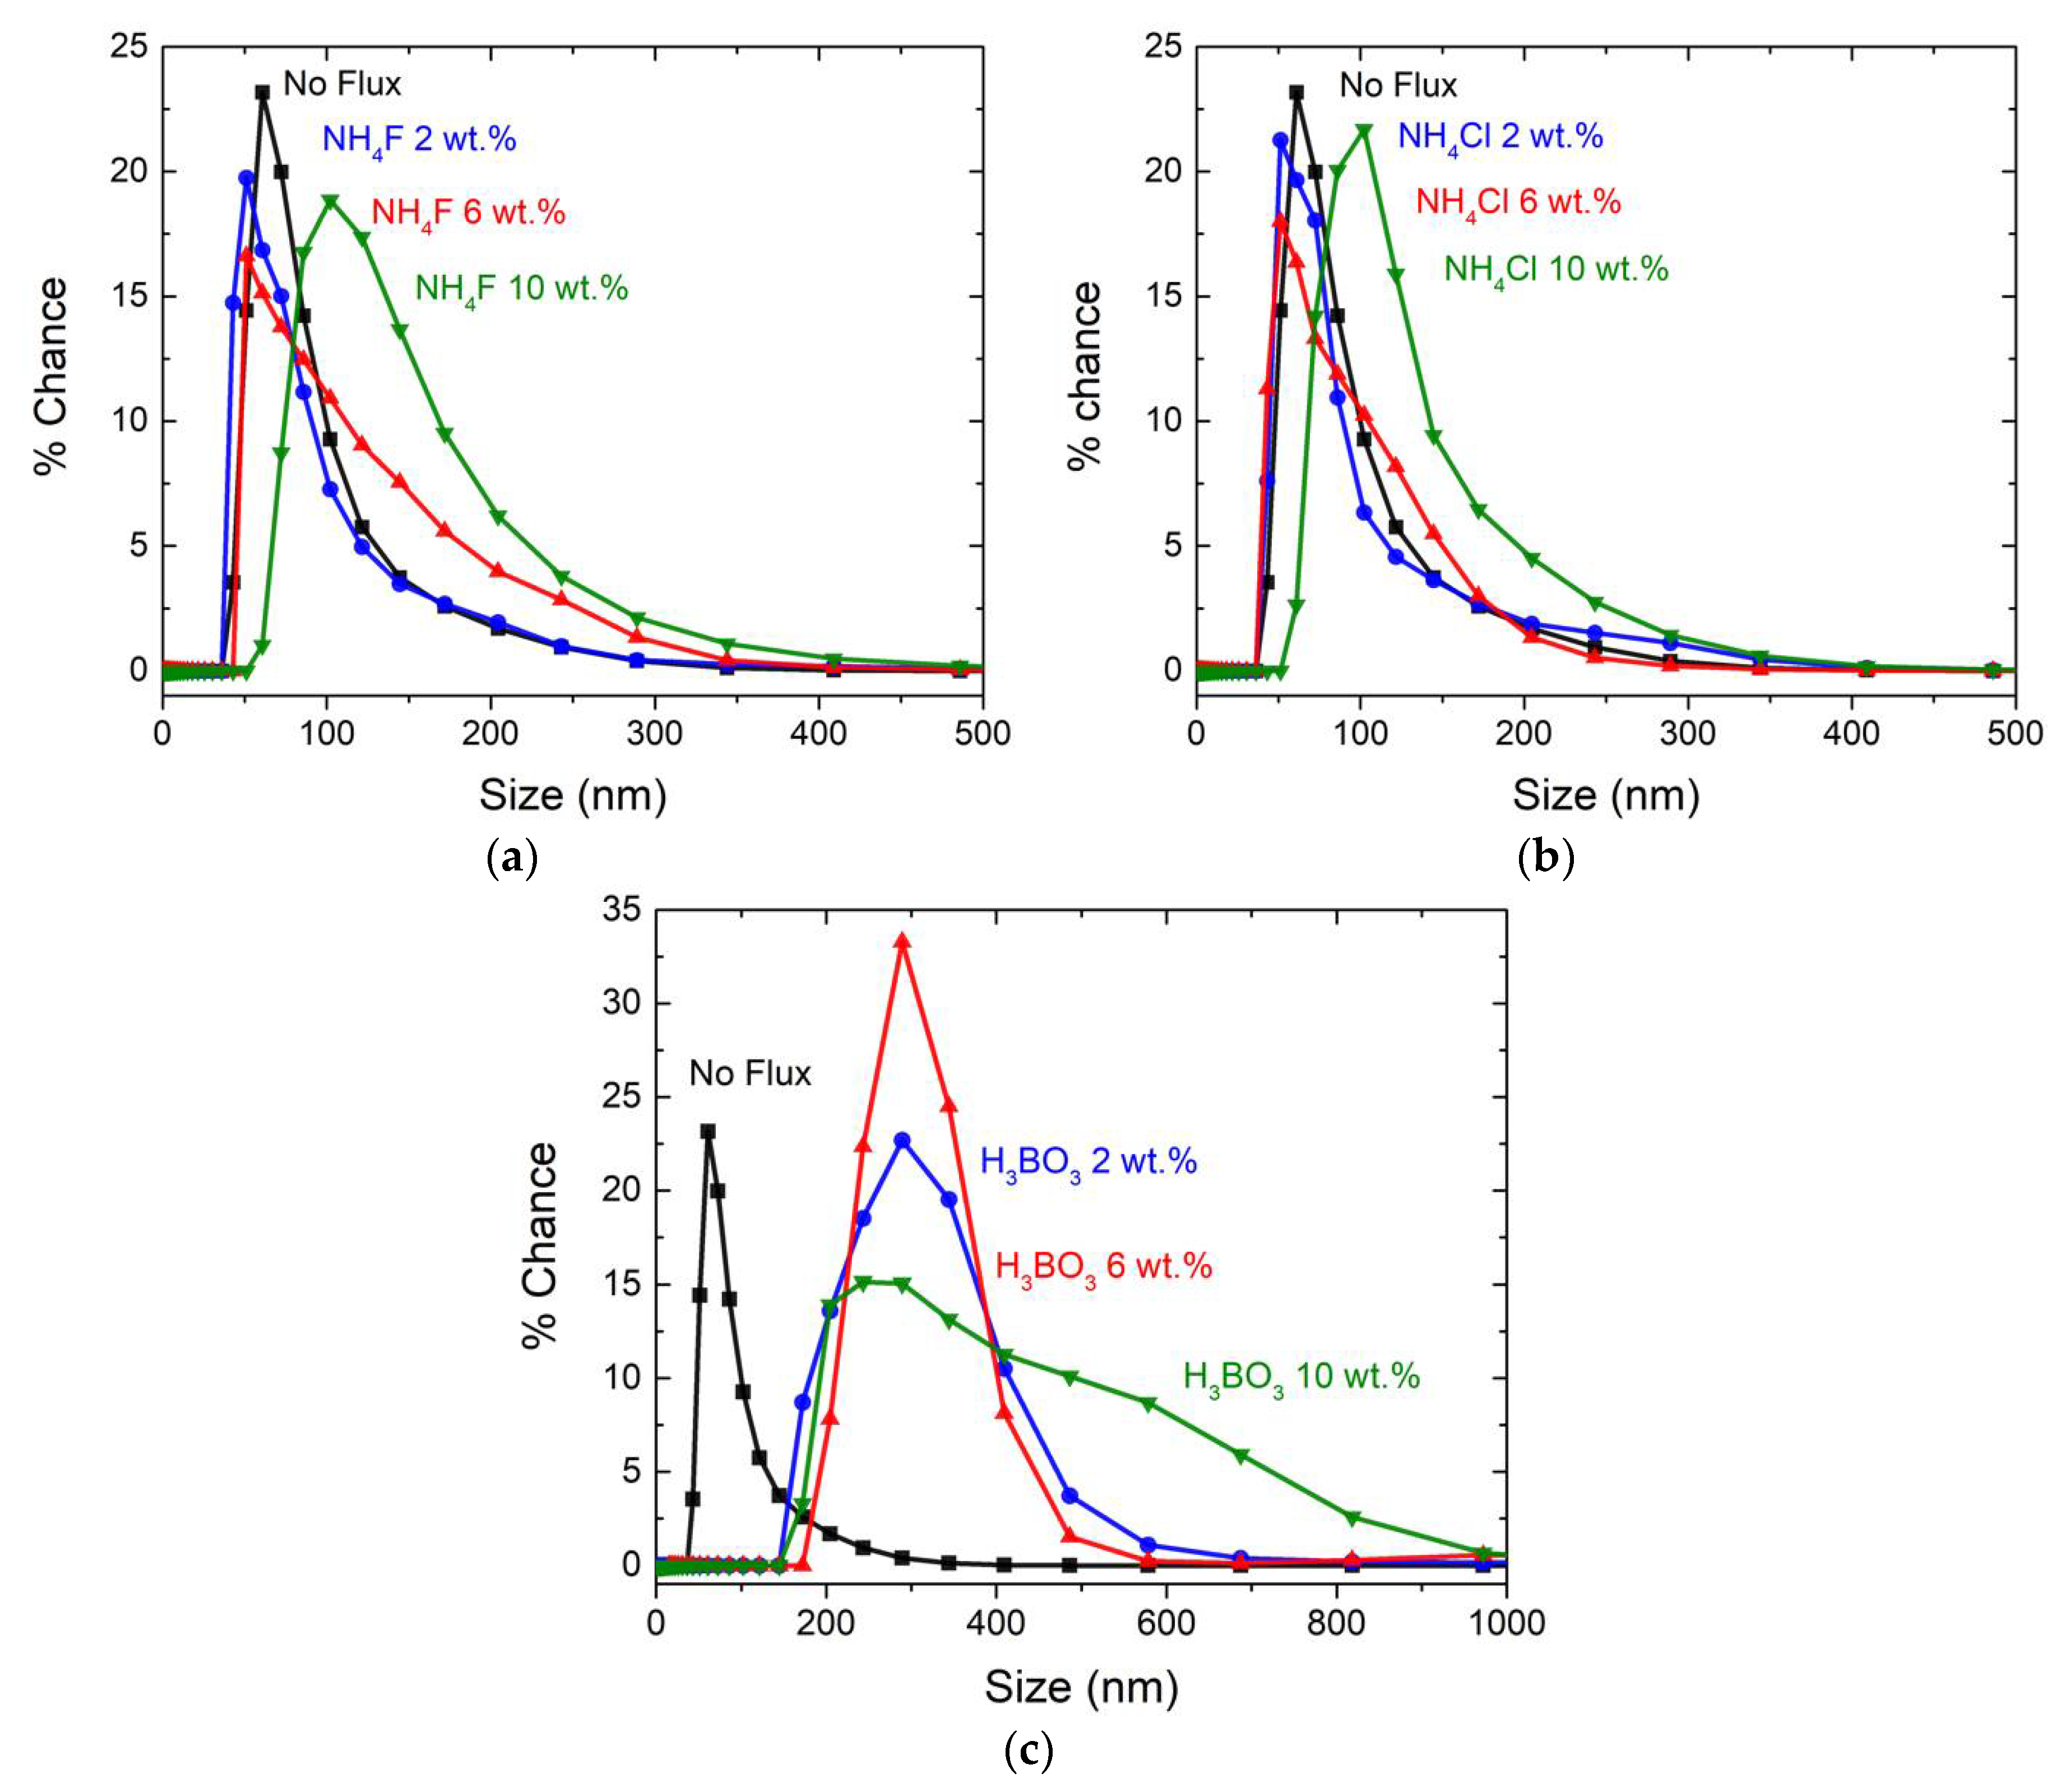
3.2. Scanning Electron Microscopy and Dynamic Lighting Scattering Analysis

SEM images of Ca0.94Eu0.06MgSi2O6 are shown in Figure 5a for no flux, Figure 5b–d for NH4F flux addition, Figure 5e–g for NH4Cl flux addition, and Figure 5h–j for H3BO3 flux addition. For NH4F or NH4Cl fluxes, the particle sizes and morphologies were similar to those without a flux. However, the particles with the H3BO3 flux were aggregated, and the particle sizes were irregular. From EDS analysis, the ratio of Ca:Mg:Si:O was 1:1:7:13 in the large particles (yellow point in Figure 5h), where the amounts of Si and O are two to three times more than those of CaMgSi2O6 (Ca:Mg:Si:O = 1:1:2:6). In the small particles (red point in Figure 5h), the ratio of Ca:Mg:Si:O was 1:1:3:5, which is closer to that of CaMgSi2O6. Although the results from EDS are considered more accurate for polished surfaces than the powders, the ratio of Ca, Mg, Si, O demonstrated differences between small and large particles. Also, given that the EDS analysis penetrates 1–2 µm below the surface [34], CaMgSi2O6 could be detected under the SiO2 particles, which could be the reason EDS analysis showed a small amount of Ca and Mg, when presumably large SiO2 particles were analyzed. Therefore, large particles can be considered as SiO2 and the aggregated, small particles as CaMgSi2O6.
From the DLS analysis (Figure 6), the average particle sizes were 83 nm for powders without flux. With the NH4F flux, the average particles sizes were 80 nm (2 wt.%), 100 nm (6 wt.%), and 133 nm (10 wt.%), respectively. For the NH4Cl flux, the corresponding particle sizes were found to be 84 nm (2 wt.%), 82 nm (6 wt.%), and 118 nm (10 wt.%). Overall, this indicates that particles were still submicron-sized with the addition of flux. However, some studies reported uniformly shaped and enlarged particles with up to 14 wt.% of flux addition [8,14,15,19]. For the H3BO3 flux, the average particle sizes were 307 nm (2 wt.%), 318 nm (6 wt.%), and 375 nm (10 wt.%), which resulted from an increase in the amount of the SiO2 particles.

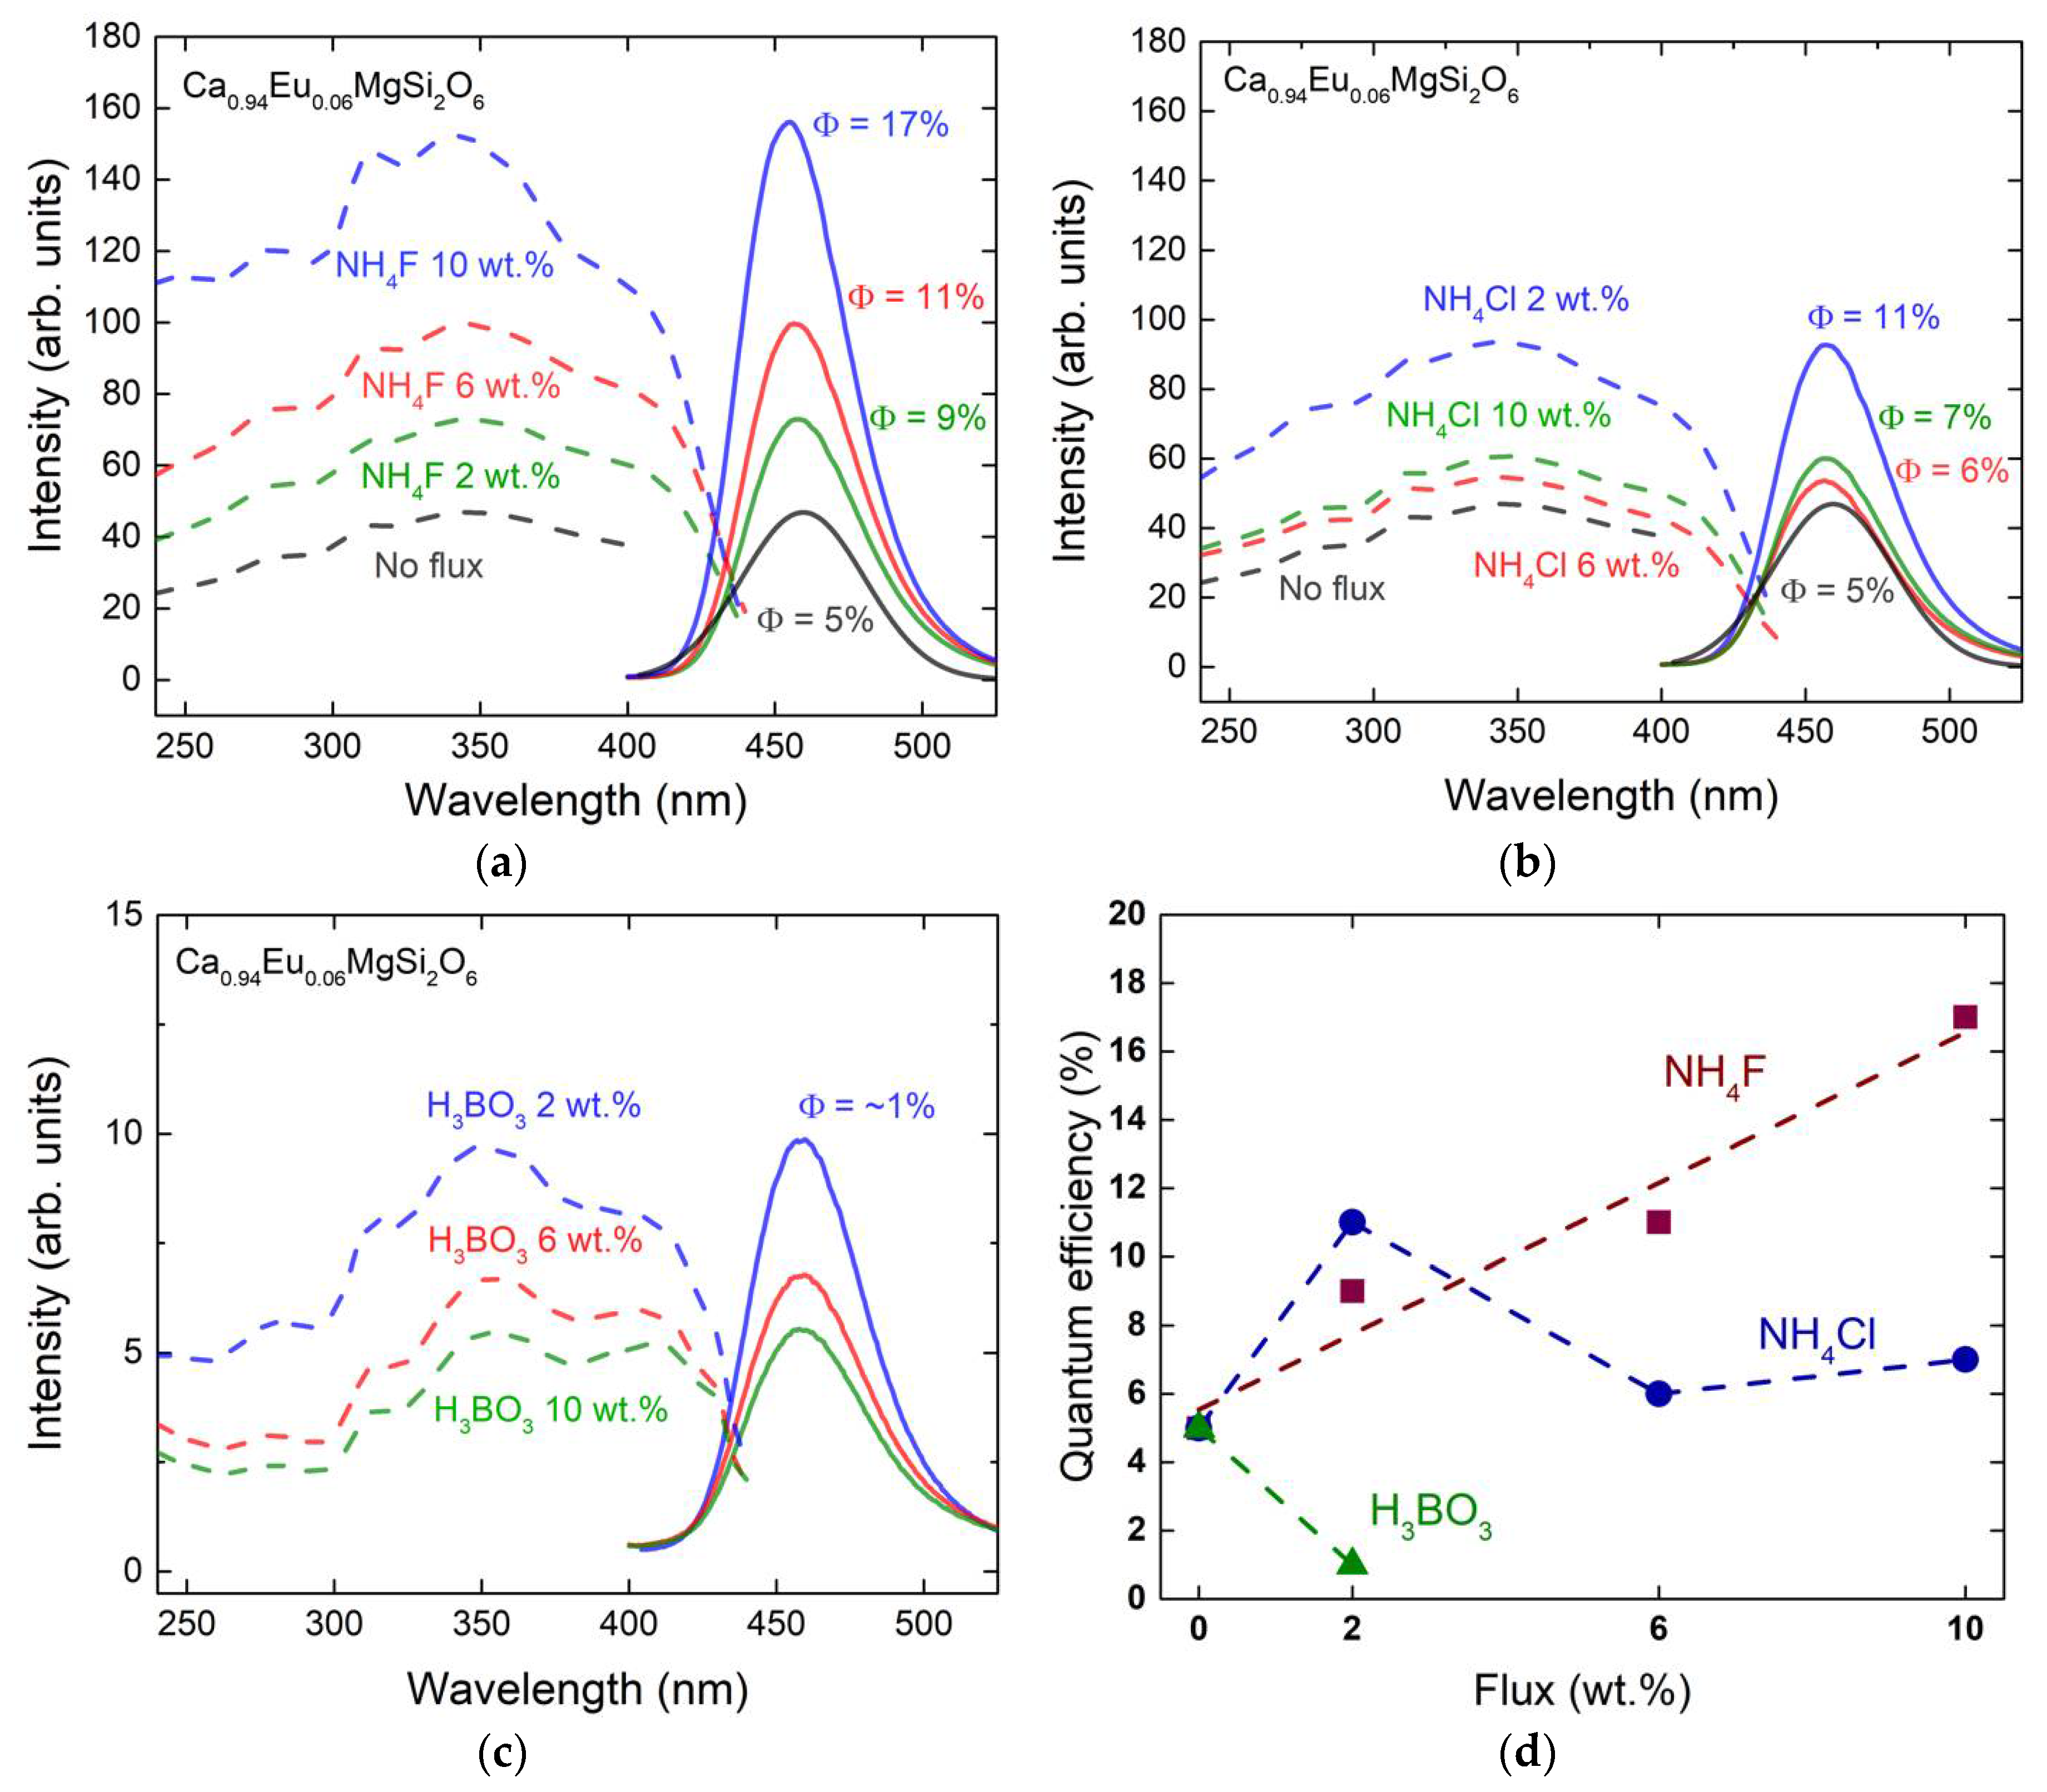
3.3. Photoluminescence Spectra and Quantum Efficiency

The PL excitation (PLE) was monitored at 458 nm, and the PL emission spectra were obtained under λex = 350 nm as an excitation wavelength. Although the Eu ions were introduced from a strong nitric acid solution during the synthetic process, this acid may cause traces of transition metal ions impurities (Cr, Cu, Pb, Ni, Zn, Au, Ti). However, these are negligible due to the very low concentration in the whole solution (<0.01 ppm). If all transition metals are present in the phosphor powders, the concentration would be ~0.1 ppb, which would not influence the luminescence properties. Figure 7a–c shows the PLE spectra (dashed lines) with a broadband absorption in the near UV region from 200 nm to 400 nm, with a maximum at 350 nm, which is attributed to the allowed transition of Eu2+. The PL emission (solid lines) shows a spectrum with a maximum at 458 nm, which corresponds to the parity allowed 4f65d1 → 4f7 transition of Eu2+. In Figure 7a, the absorption and emission intensities, together with the quantum efficiency (Φ), increased with the increase of the amount of NH4F. A maximum Φ of 17% was found at 11 wt.% of NH4F. For the NH4Cl flux (Figure 7b), the quantum efficiency increased from 5% to 11% when 2 wt.% of NH4Cl was added. For the amounts of NH4Cl > 2 wt.%, Φ decreased. As shown in Figure 7c, Φ with H3BO3 was very low, ~1%, because of the significant amount of SiO2 in the sample, as was confirmed by the XRD (Figure 3b). Figure 7d is a plot of Φ as a function of the amount of flux for all three fluxes used in the current study. A cumulative analysis of Figure 2c and Figure 7d demonstrates that the change in the crystallite sizes of the materials produced with NH4F and NH4Cl fluxes, directly relates to the change in their corresponding quantum efficiencies [35]. For 0–10 wt.% of NH4F, the average crystallite size increased from 13 nm to 31 nm, and the corresponding quantum efficiencies improved from 5% to 17%. Similarly, for 0 wt.%, 2 wt.%, 6 wt.%, and 10 wt.%, of the NH4Cl flux, the average crystallite sizes were 13 nm, 19 nm, 15 nm, 18 nm, respectively, and the corresponding quantum efficiencies showed similar trend. In constant, with 0–10 wt.% of H3BO3, the crystallite size increased from ~13 nm to ~27 nm, but the quantum efficiency was low due to the presence of a large fraction of the secondary phase, SiO2.

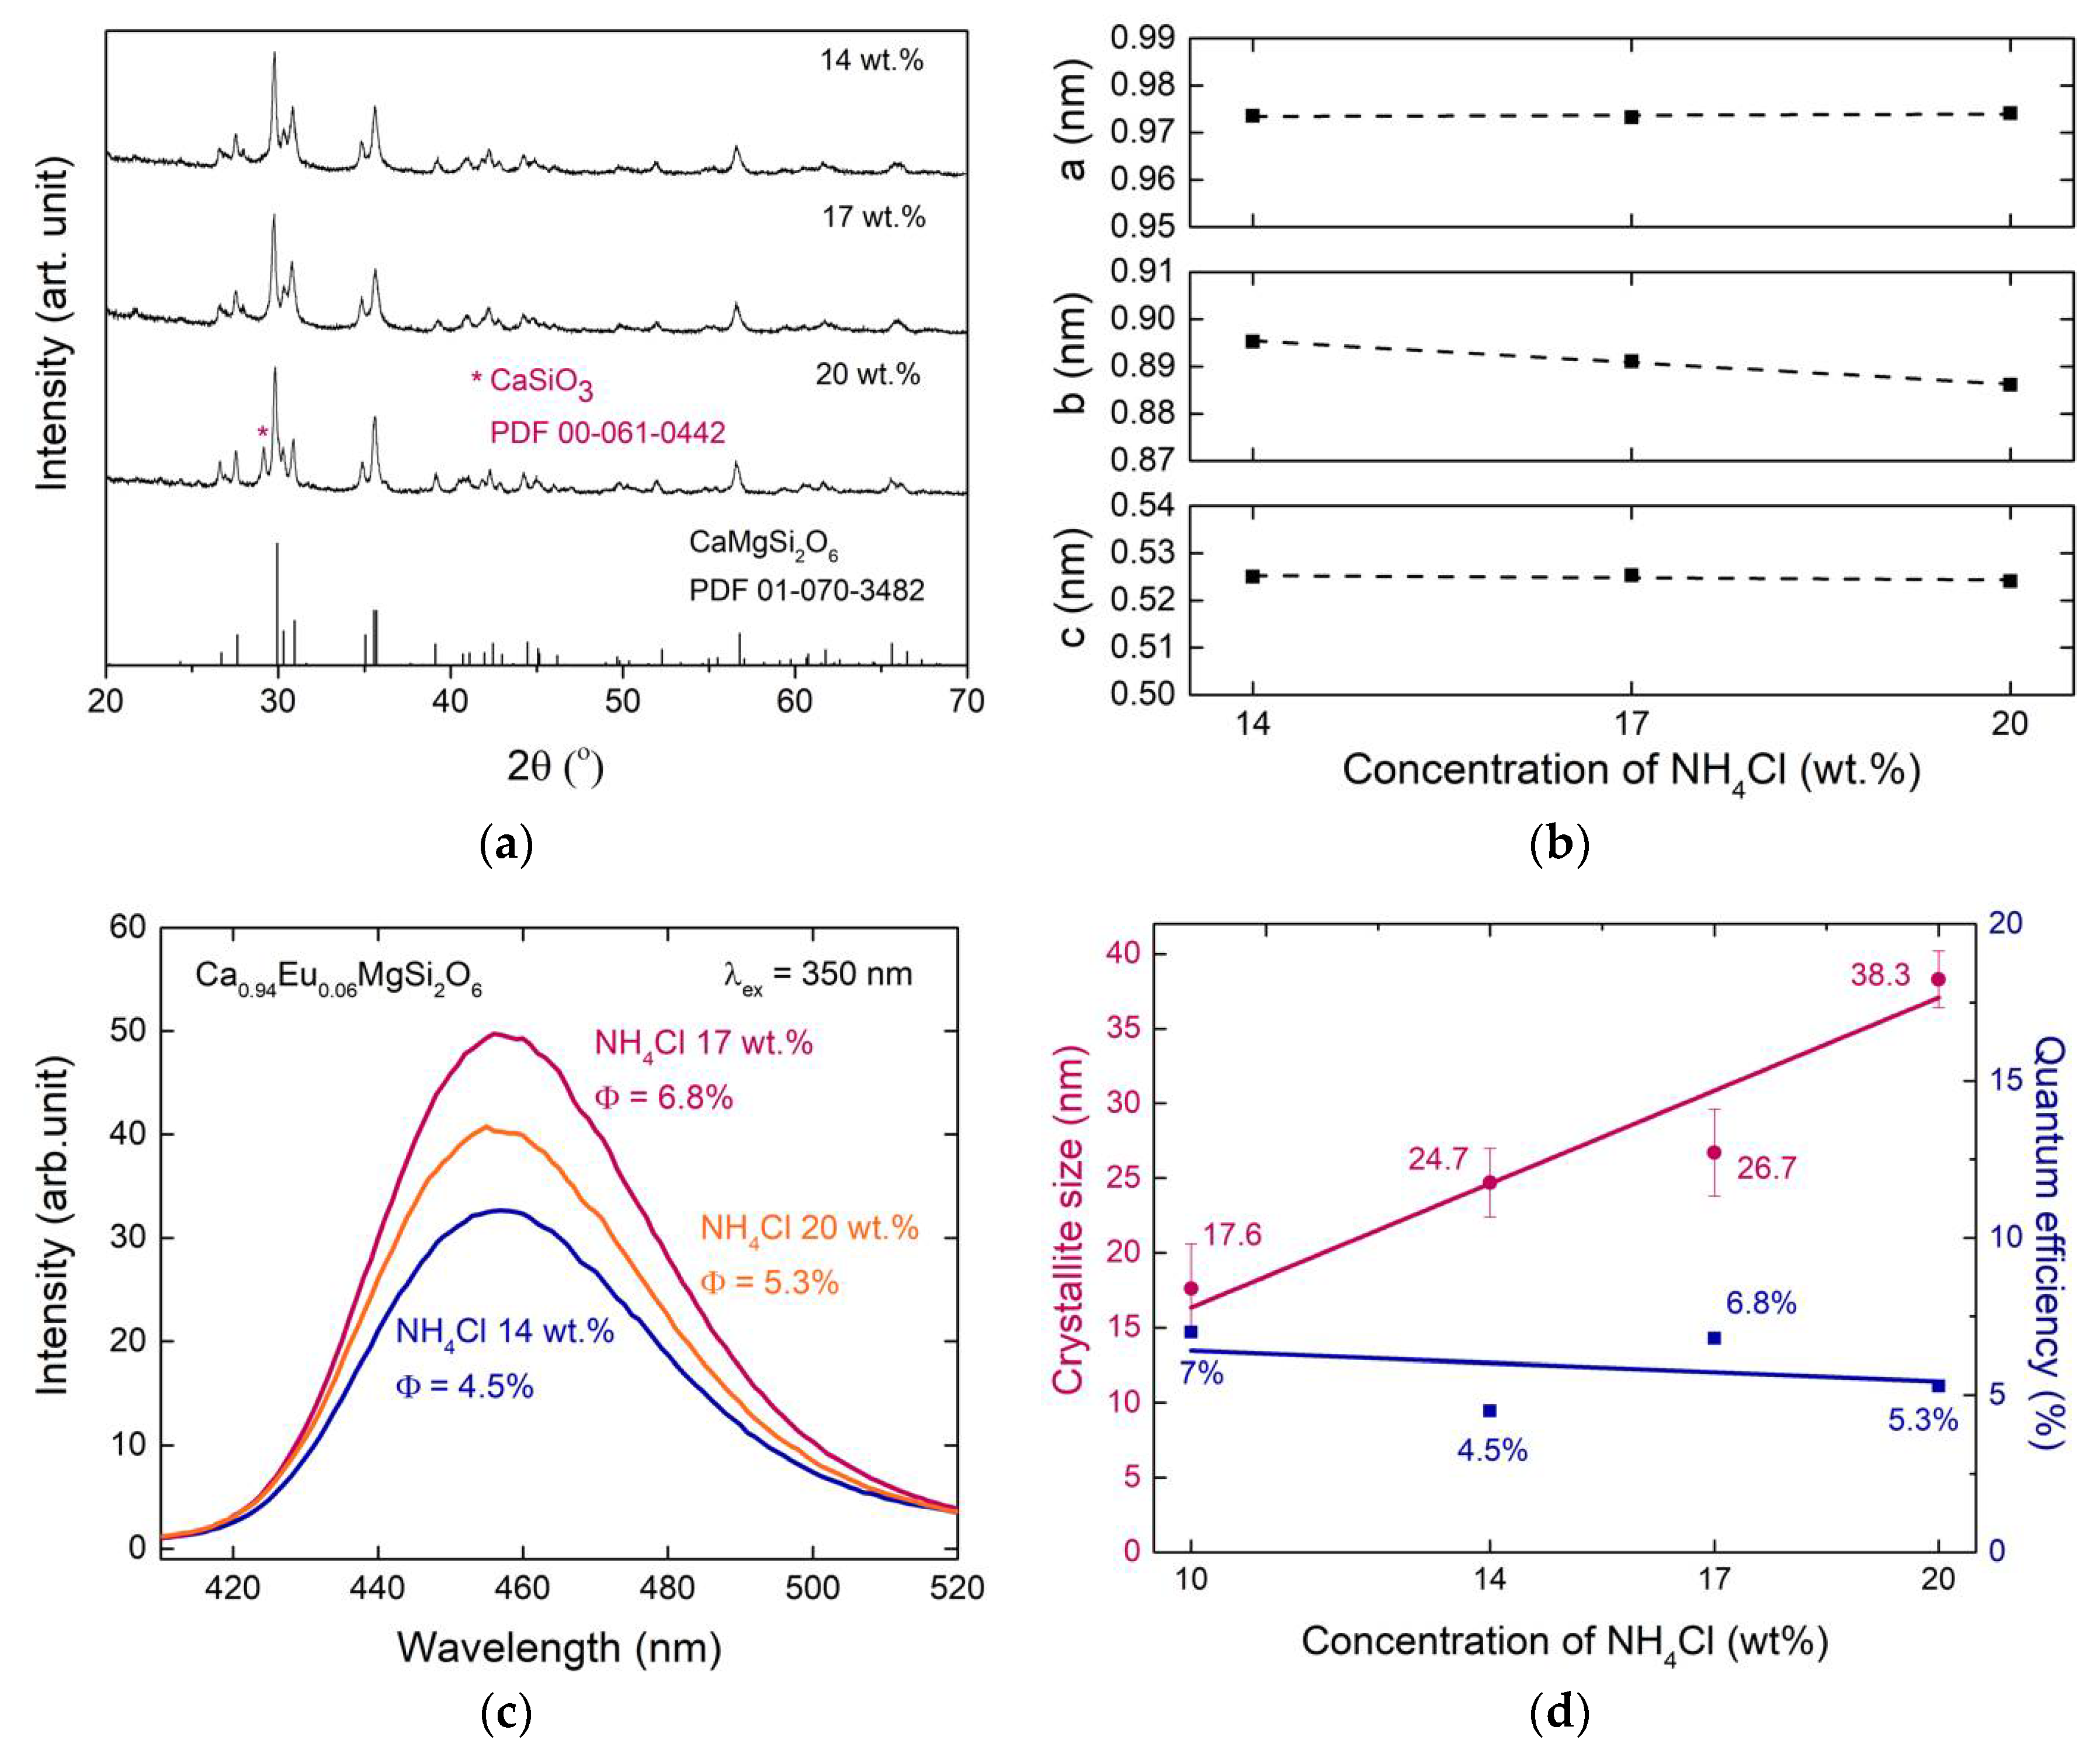
3.4. Effect of High Concentration of NH4Cl

Increased amount of NH4Cl was examined to determine if the high concentration of this particular flux resulted in the formation of second phase, a change in crystal structure, or further improvement of Φ while phosphors with NH4F and H3BO3 already consist of secondary phases below 10 wt.% of the flux. Figure 8a shows the XRD patterns of CaMgSi2O6 produced with 14, 17, and 20 wt.% of NH4Cl flux. There were no secondary phases with 14 and 17 wt.%, but CaSiO3 was detected for 20 wt.% of NH4Cl. The lattice parameters a and c were not affected, but b decreased from 0.8867 nm (for 14 wt.%) to 0.8852 nm (for 20 wt.%) (Figure 8b). Given that the radii difference between Cl and O2− is 26%, excessive Cl may substitute for O2− and produce a charge imbalance. This could cause cation defects and/or the creation of secondary phases such as CaSiO3. MgSiO3 could also potentially be produced due to the substitution O2− by Cl, but it was not detected by XRD. Vegard’s law can also be applied to the b–axis change, with an assumption that there are vacancy defects of ½ Ca2+, ½ Mg2+ or ¼ Si4+ due to the charge difference between O2− and Cl. To obtain the maximum difference between b and b0, Ca2+ vacancies were assumed. The lattice parameter change is b = b 0 1 2 x r C a x ( r O r C l ) , where b is the lattice parameter (0.8852 nm) with 20 wt.% Cl additions, b0 is the initial lattice parameter with no flux (0.8900 nm), x is the partial substitution of Cl on O2−, and r C a , r S i , r O , r C l are radii of Ca2+, Si4+, O2−, and Cl, respectively. The obtained x value is 0.32, which is smaller than the molar fraction of Cl in CaMgSi2O6 (0.50, converted from 20 wt.% NH4Cl). The remaining Cl is likely from the excessive addition of NH4Cl. The crystal structure along the [001] (Figure 1d) and [010] (Figure 1c) directions shows one Ca2+ and one Mg2+ along the a- and c-axes and two Ca2+ and two Mg2+ along the b-axis, resulting in the fraction of Mg2+ and Ca2+ along the b-axis being twice higher than that along the a- and c-axes. Therefore, the b-axis was altered more than the a- and c-axes.
The PL emission spectra and Φs with additional NH4Cl flux are shown in Figure 8c. The Φs were not significantly changed with an increase in the amount of NH4Cl. A comparison between crystallite size and Φs with the amount of NH4Cl flux is shown in Figure 8d. The maximum Φ corresponded to 2 wt.%; over 2 wt.% Φ initially decreased and eventually leveled off. However, the crystallite sizes increased with an increase in the concentration of the flux. This implies that the flux, although increasing the crystallite size, also changed lattice parameters resulting in no enhancement of Φ due to the inappropriate amount of flux addition.

4. Conclusions

The crystallite size and quantum efficiency of blue-emitting Ca0.94Eu0.06MgSi2O6 submicrometer-sized phosphors prepared by the co-precipitation method were altered with the addition of a flux, NH4F, NH4Cl, or H3BO3. The particle sizes both with and without fluxes (NH4F or NH4Cl) were submicrometer-sized (~100 nm). A direct correlation between crystallite sizes of the materials produced with NH4F or NH4Cl fluxes and their corresponding quantum efficiencies was verified. For the NH4F flux, the crystallite size increased from 13 nm (no flux) to 31 nm (10 wt.% flux). The corresponding quantum efficiencies improved from 5% (no flux) to 17% (10 wt.% flux), correlating with the increase in crystallite size. For the NH4Cl flux, the crystallite sizes increased to 18 nm with 10 wt.% from 13 nm with no flux, with a corresponding increase in quantum efficiency from 5% to 11%. This demonstrates that NH4Cl is not an effective flux, likely due to its lower liquid diffusion coefficient compared to NH4F. Additionally, it was shown that further increasing the amount of the NH4Cl flux (14–20 wt.%) only slightly improved the corresponding quantum efficiency. The H3BO3 flux produced a substantial amount of SiO2 as a secondary phase, which negatively affected the quantum efficiency of the resultant material. From lattice parameter measurements, it is shown that the phosphor was contaminated with boron ions, and silicon was leached out of the lattice.
In summary, it is shown that the poor quantum efficiency of submicron-sized phosphors can be improved by using NH4F flux for CaMgSi2O6:Eu2+, but the flux composition and amount must be carefully assessed to evaluate the presence of secondary phases.

Author Contributions

Conceptualization, J.H. and J.M.; Methodology, J.H., C.Z.; Software, J.H.; Validation, E.N., O.A.G., and J.M.; Formal Analysis, J.H., E.N., R.E.R., and J.M.; Investigation, J.M.; Resources, O.A.G., G.A.H., J.M.; Data Curation, J.H., E.N., J.M.; Writing-Original Draft Preparation, J.H.; Writing-Review & Editing, E.N., O.A.G., and J.M.; Visualization, J.H.; Supervision, J.M.; Project Administration, J.M.; Funding Acquisition, J.M.

Funding

This research was funded by [the National Science Foundation, Ceramics Program] grant number [Grant DMR-1411192].

Acknowledgments

This work is supported by the National Science Foundation, Ceramics Program Grant DMR-1411192. This work was performed in part at the San Diego Nanotechnology Infrastructure (SDNI) of UCSD, a member of the National Nanotechnology Coordinated Infrastructure, which is supported by the National Science Foundation (Grant ECCS-1542148).

Conflicts of Interest

The authors declare no conflicts of interest.

References

  1. Blasse, G.; Grabmaier, B.C. Luminescent Materials; Springer: Berlin/Heidlberg, Germany, 1994. [Google Scholar]
  2. Han, J.K.; Choi, J.I.; Piquette, A.; Hannah, M.; Anc, M.; Galvez, M.; Talbot, J.B.; McKittrick, J. Phosphor development and integration for near-UV LED solid state lighting. ECS J. Solid State Sci. Technol. 2012, 2, R3138–R3147. [Google Scholar] [CrossRef]
  3. Luo, H.; Liu, J.; Zheng, X.; Han, L.; Ren, K.; Yu, X. Enhanced photoluminescence of Sr3SiO5:Ce3+ and tuneable yellow emission of Sr3SiO5:Ce3+, Eu2+ by Al3+ charge compensation for W-LEDs. J. Mater. Chem. 2012, 22, 15887–15893. [Google Scholar] [CrossRef]
  4. Lee, S.H.; Choi, J.I.; Kim, Y.J.; Han, J.K.; Ha, J.; Novitskaya, E.; Talbot, J.B.; McKittrick, J. Comparison of luminescent properties of Y2O3:Eu3+ and LaPO4:Ce3+, Tb3+ phosphors prepared by various synthetic methods. Mater. Charact. 2015, 103, 162–169. [Google Scholar] [CrossRef]
  5. Terraschke, H.; Wickleder, C. UV, blue, green, yellow, red, and small: Newest developments on Eu-doped nanophosphors. Chem. Rev. 2015, 115, 11352–11378. [Google Scholar] [CrossRef] [PubMed]
  6. Jung, K.Y.; Lee, C.H.; Kang, Y.C. Effect of surface area and crystallite size on luminescent intensity of Y2O3:Eu phosphor prepared by spray pyrolysis. Mater. Lett. 2005, 59, 2451–2456. [Google Scholar] [CrossRef]
  7. Chiang, C.H.; Liu, T.H.; Lin, H.Y.; Kuo, H.Y.; Chu, S.Y. Effects of flux additives on the characteristics of Y2.95Al5O12:0.05Ce3+ phosphor: Particle growth mechanism and luminescence. J. Appl. Phys. 2013, 114, 243517. [Google Scholar] [CrossRef]
  8. Zhang, Q.; Ni, H.; Wang, L.; Xiao, F. Effects of BaF2 flux on the synthesis of green emitting phosphor CaSc2O4:Ce3+. ECS J. Solid State Sci. Technol. 2014, 4, R23–R26. [Google Scholar] [CrossRef]
  9. Dai, P.; Zhang, X.; Sun, P.; Yang, J.; Wang, L.; Yan, S.; Liu, Y.; Ballato, J. Influence of flux on morphology and luminescence properties of phosphors: A case study on Y1.55Ti2O7:0.45Eu3+. J. Am. Ceram. Soc. 2012, 95, 1447–1453. [Google Scholar] [CrossRef]
  10. Lee, G.-H.; Yoon, C.; Kang, S. Role of flux in the production process of red phosphors for white LEDs. J. Mater. Sci. 2008, 43, 6109–6115. [Google Scholar] [CrossRef]
  11. Pamplin, B.R. Crystal Growth, 2nd ed.; Pergamon Press: Beccles/London, UK, 1980. [Google Scholar]
  12. Stoll, S.L.; Stacy, A.M. Single-crystal growth, alkali metal ordering, and superconductivity in La2−xMxCuO4 (M = Na, K). Inorg. Chem. 1994, 33, 2761–2765. [Google Scholar] [CrossRef]
  13. Chen, Y.B.; Gong, M.L.; Cheah, K.W. Effects of fluxes on the synthesis of Ca3Sc2Si3O12:Ce3+ green phosphors for white light-emitting diodes. Mater. Sci. Eng. B Adv. Funct. Solid State Mater. 2010, 166, 24–27. [Google Scholar] [CrossRef]
  14. Tang, J.Y.; He, Y.M.; Hao, L.Y.; Xu, X.; Agathopoulos, S. Fine-sized BaSi3Al3O4N5:Eu2+ phosphors prepared by solid-state reaction using BaF2 flux. J. Mater. Res. 2013, 28, 2598–2604. [Google Scholar] [CrossRef]
  15. Wang, X.; Li, J.H.; Shi, P.L.; Guan, W.M.; Zhang, H.Y. High dispersibility and enhanced luminescence properties of BaMgAl10O17:Eu2+ phosphors derived from molten salt synthesis. Opt. Mater. 2015, 46, 432–437. [Google Scholar] [CrossRef]
  16. Liu, J.Q.; Wang, X.J.; Xuan, T.T.; Wang, C.B.; Li, H.L.; Sun, Z. Lu3(Al,Si)5(O,N)12:Ce3+ phosphors with broad emission band and high thermal stability for white LEDs. J. Lumin. 2015, 158, 322–327. [Google Scholar] [CrossRef]
  17. Dong, K.; Li, Z.L.; Xiao, S.G.; Xiang, Z.F.; Zhang, X.A.; Yang, X.L.; Jin, X.L. Yellowish-orange luminescence in Sr8Al12O24S2:Eu2+ phosphor. J. Alloys Compd. 2012, 543, 105–108. [Google Scholar] [CrossRef]
  18. Lee, S.H.; Jung, D.S.; Han, J.M.; Koo, H.Y.; Kang, Y.C. Fine-sized Y3Al5O12:Ce phosphor powders prepared by spray pyrolysis from the spray solution with barium fluoride flux. J. Alloys Compd. 2009, 477, 776–779. [Google Scholar] [CrossRef]
  19. Kang, H.S.; Kang, Y.C.; Jung, K.Y.; Park, S.B. Eu-doped barium strontium silicate phosphor particles prepared from spray solution containing NH4Cl flux by spray pyrolysis. Mater. Sci. Eng. B Solid State Mater. Adv. Technol. 2005, 121, 81–85. [Google Scholar] [CrossRef]
  20. Wang, J.S.; Zhu, D.-C.; Zheng, Q.; Han, T. Effect of flux on the composition and luminescent properties of Ca0.68Mg0.2SiO3:0.12Eu3+ red phosphor. J. Lumin. 2016, 179, 183–188. [Google Scholar] [CrossRef]
  21. Zhang, B.; Feng, L.; Qiang, Y. Preparation and photoluminescence properties of the Sr1.56Ba0.4SiO4:0.04Eu2+ phosphor. J. Lumin. 2012, 132, 1274–1277. [Google Scholar] [CrossRef]
  22. Pires, A.M.; Davolos, M.R. Luminescence of europium (III) and manganese (II) in barium and zinc orthosilicate. Chem. Mater. 2001, 13, 21–27. [Google Scholar] [CrossRef]
  23. Pawar, A.U.; Jadhav, A.P.; Pal, U.; Kim, B.K.; Kang, Y.S. Blue and red dual emission nanophosphor CaMgSi2O6:Eun+; crystal structure and electronic configuration. J. Lumin. 2012, 132, 659–664. [Google Scholar] [CrossRef]
  24. Ha, J.; Wang, Z.; Novitskaya, E.; Hirata, G.A.; Graeve, O.A.; Ong, S.P.; McKittrick, J. An integrated first principles and experimental investigation of the relationship between structural rigidity and quantum efficiency in phosphors for solid state lighting. J. Lumin. 2016, 179, 297–305. [Google Scholar] [CrossRef]
  25. Cahill, J.T.; Ruppert, J.N.; Wallis, B.; Liu, Y.; Graeve, O.A. Development of mesoporosity in scandia-stabilized zirconia: Particle size, solvent, and calcination effects. Langmuir 2014, 30, 5585–5591. [Google Scholar] [CrossRef] [PubMed]
  26. Graeve, O.A.; Fathi, H.; Kelly, J.P.; Saterlie, M.S.; Sinha, K.; Rojas-George, G.; Kanakala, R.; Brown, D.R.; Lopez, E.A. Reverse micelle synthesis of oxide nanopowders: Mechanisms of precipitate formation and agglomeration effects. J. Colloid Interface Sci. 2013, 407, 302–309. [Google Scholar] [CrossRef] [PubMed]
  27. Saterlie, H.S.M.S.; Kavlicoglu, B.; Liu, Y.; Graeve, O.A. Surfactant effects on dispersion characteristics of copper-based nanofluids: A dynamic light scattering study. Chem. Mater. 2012, 24, 3299–3306. [Google Scholar] [CrossRef]
  28. Momma, K.; Izumi, F. VESTA: A three-dimensional visualization system for electronic and structural analysis. J. Appl. Crystallogr. 2008, 41, 653–658. [Google Scholar] [CrossRef]
  29. Knyazev, A.V.; Bulanov, E.N.; Korshunov, A.O.; Krasheninnikova, O.V. Synthesis and thermal expansion of some lanthanide-containing apatites. Inorg. Mater. 2013, 49, 1133–1137. [Google Scholar] [CrossRef]
  30. Shannon, R.D. Revised effective ionic radii and systematic studies of interatomie distances in halides and chaleogenides. Acta Crystallogr. Sect. A Cryst. Phys. Diffr. Theor. Gen. Crystallogr. 1976, 32, 751–767. [Google Scholar] [CrossRef]
  31. Marler, B.; Borowski, M.; Wodara, U.; Schreyer, W. Synthetic tourmaline (olenite) with excess boron replacing silicon in the tetrahedral site: II. Structure analysis. Eur. J. Mineral. 2002, 14, 763–771. [Google Scholar] [CrossRef]
  32. Xia, Z.; Molokeev, M.S.; Im, W.B.; Unithrattil, S.; Liu, Q. Crystal structure and photoluminescence evolution of La5(Si2+xB1−x)(O13−xNx):Ce3+ solid solution phosphors. J. Phys. Chem. C 2015, 119, 9488–9495. [Google Scholar] [CrossRef]
  33. Denton, A.R.; Ashcroft, N.W. Vegard’s law. Phys. Rev. A 1991, 43, 3161–3164. [Google Scholar] [CrossRef] [PubMed]
  34. Prencipe, D.D.I.; Zani, A.; Rizzo, D.; Passoni, M. Energy dispersive X-ray spectroscopy for nanostructured thin film density evaluation. Sci. Technol. Adv. Mater. 2015, 16, 025007. [Google Scholar] [CrossRef] [PubMed]
  35. Dantelle, G.; Salaün, M.; Bruyère, R.; Kodjikian, S.; Ibanez, A. Luminescent coatings prepared from optimized YAG:Ce nanoparticles. Thin Solid Films 2017, 643, 36–42. [Google Scholar] [CrossRef]
Figure 1. The crystal structure of CaMgSi2O6: (a) 3-D unit cell representation; (b) along the [100]; (c) along the [010]; and (d) along the [001] drawn by VESTA (Visualization for Electronic and Structural Analysis) [28].
Ceramics 01 00005 g001
Figure 2. X-ray diffraction patterns of Ca0.94Eu0.06MgSi2O6 with a flux of (a) NH4F and (b) NH4Cl. (c) Calculated crystallite sizes of Ca0.94Eu0.06MgSi2O6 with NH4F and NH4Cl fluxes.
Ceramics 01 00005 g002
Figure 3. (a) X-ray diffraction patterns of Ca0.94Eu0.06MgSi2O6 with H3BO3 flux; (b) Calculated molar ratios of the phases present and (c) calculated crystallite sizes.
Ceramics 01 00005 g003
Figure 4. Calculated lattice parameters of Ca0.94Eu0.06MgSi2O6 from the X-ray diffraction results with a flux of (a) NH4F; (b) NH4Cl; and (c) H3BO3.
Ceramics 01 00005 g004
Figure 5. Scanning electron microscopy images of Ca0.94Eu0.06MgSi2O6. Without any flux (a) taken from [24]. With NH4F flux (b) 2 wt.%, (c) 6 wt.%, and (d) 10 wt.%. With NH4Cl flux: (e) 2 wt.%, (f) 6 wt.%, and (g) 10 wt.%. With H3BO3 flux: (h) 2 wt.%, (i) 6 wt.%, (j) 10 wt.%.
Ceramics 01 00005 g005
Figure 6. The distributions of particle sizes of Ca0.94Eu0.06MgSi2O6 with fluxes (a) NH4F; (b) NH4Cl and (c) H3BO3 analyzed by dynamic light scattering analysis.
Ceramics 01 00005 g006
Figure 7. Photoluminescence excitation (dashed line monitored at 458 nm) and emission (solid line, λex = 350 nm) spectra of Ca0.94Eu0.06MgSi2O6 with (a) NH4F (no flux, 2 wt.%, 6 wt.%, and 10 wt.%); (b) NH4Cl (no flux, 2 wt.%, 6 wt.%, and 10 wt.%); (c) H3BO3 (2 wt.%, 6 wt.%, and 10 wt.%). Φ = quantum efficiency; (d) The relationship between quantum efficiency and the amount of flux.
Ceramics 01 00005 g007
Figure 8. Effect of additional NH4Cl flux (14 wt.%, 17 wt.%, and 20 wt.%) on CaMgSi2O6:Eu2+. (a) X-ray diffraction patterns; (b) calculated lattice parameters of CaMgSi2O6:Eu2+; (c) photoluminescence emission spectra (λex = 350 nm) and quantum efficiencies (d) calculated crystallite sizes (pink color) and quantum efficiencies (blue color) from 0 to 20 wt.% NH4Cl.
Ceramics 01 00005 g008
Table 1. Reported results of the addition of flux on phosphor preparation. Tm = melting temperature, Tb = boiling temperature, Φ = quantum efficiency.
Flux/Tm/Tb (°C)Phosphor CompositionSynthesis MethodAnnealing Temperature (°C)ResultsRef.
CaF2/1418/2533(Ca0.99Ce0.01)3Sc2Si3O12Solid state reaction1100–1450Reduced impurities, decreased formation temperature, no reported crystallite size and Φ, emission intensity increased 2×, narrow particles distribution, removed flux by sublimation after reaction[13]
BaF2/1368/2260Y2.965Ce0.035Al5O12Spray pyrolysis1300–1600Enlarged, regular morphology, and non-aggregated particles, no reported crystallite size and Φ, emission intensity increased 1.4×[18]
Y2.95Ce0.05Al5O12Solid state reaction1000–1500Able to reduce annealing temperature BaAl2O4, byproduct from BaF2 Spherical shape and smooth surface Φ external) increased 1.3× over commercial sample[7]
Ba0.85Eu0.15Si3Al3O4N5Solid state reaction1550Enlarged crystallite size (no specific number) and particles size, narrow particles distribution, emission intensity increased slightly, no reported Φ[14]
Ca0.99Ce0.01Sc2O4Solid state reaction1550 and 1450Φ external) increased 1.1×, no reported crystallite size, enlarged and regular particles[8]
LiF/845/1673Ba0.9Eu0.1Mg0.98Mn0.02Al10O17Molten salt synthesis1100–1400Particles size enlarged, Li+ into the host lattice analyzed by lattice parameter, no report crystallite size from XRD, no reported Φ, emission intensity increased 2×[15]
NaF/993/1695Lu2.925Ce0.075Al4.79Si0.21O11.79N0.21Solid state reaction1500Emission intensity increased 1.3×, regular morphology of particles, no report crystallite size and Φ[16]
NaF/993/1695
LiF/845/1675
H3BO3/171/300
NH4F/100/decomposes
Y1.55Eu0.45Ti2O7Solid state reaction1350Crystallite size enlarged (no specific number), emission intensity increased 11× (NaF), 9× (LiF), 5× (H3BO3), 2.5× (NH4F), 39% of Φ (NaF), no reported Φ without flux, enlarged particles size[9]
NH4Cl/338/decomposesBa1.488Sr0.5Eu0.012SiO4Spray pyrolysis900–1400Enlarged particles, enlarged crystallite size (no specific number), no reported Φ, emission intensity increased 1.3×, optimum annealing temperature decreased [19]
K2CO3/891/decomposesCa0.68Eu0.12Mg0.2SiO3Co-precipitation1200Charge compensation, crystallite size increased 1.1×, Φ increased 2.5×, no phase composition change, no reported particles size[20]
Li2CO3/734/1310(Sr0.92Eu0.08)8Al12O24S2Solid state reaction900Improved purity, but still impurities remained. No report crystallite size and Φ[17]
SrCl2/874/1250Sr1.56Eu0.04Ba0.4SiO4Combustion800–950Crystallite size increased (no specific number), emission intensity increased 2.7×, no reported Φ, similar particles size[21]
Table 2. Melting and boiling temperature of the fluxes.
FluxMelting Point (°C)Boiling Point (°C)
NH4F100Decomposition *
NH4Cl338Decomposition **
H3BO3171300 ***
* NH4F (s) → NH3 (g) + HF(g) > 100 °C, ** NH4Cl (s) → NH3 (g) + HCl (g) > 338 °C, *** H3BO3 (s) → B2O3 (s) + H2O > 235 °C.
Table 3. Conversion of wt.% to mol.% for each flux in the solid phosphor powders.
wt.% FluxNH4F (mol.%)NH4Cl (mol.%)H3BO3 (mol.%)
21287
6282219
10403128
Table 4. The ionic radii (nm) of ions of in CaMgSi2O6 and fluxes, NH4F, NH4Cl, H3BO3.
Ions4-Coordinated6-Coordinated8-Coordinated
Ca2+--0.112
Mg2+-0.072-
Si4+0.026--
O2−0.1380.1400.142
B3+0.0110.027-
F0.1310.133-
Cl-0.181-

