Alumina Porous Ceramics Obtained by Freeze Casting: Structure and Mechanical Behaviour under Compression

 ,
,
Abstract
:1. Introduction
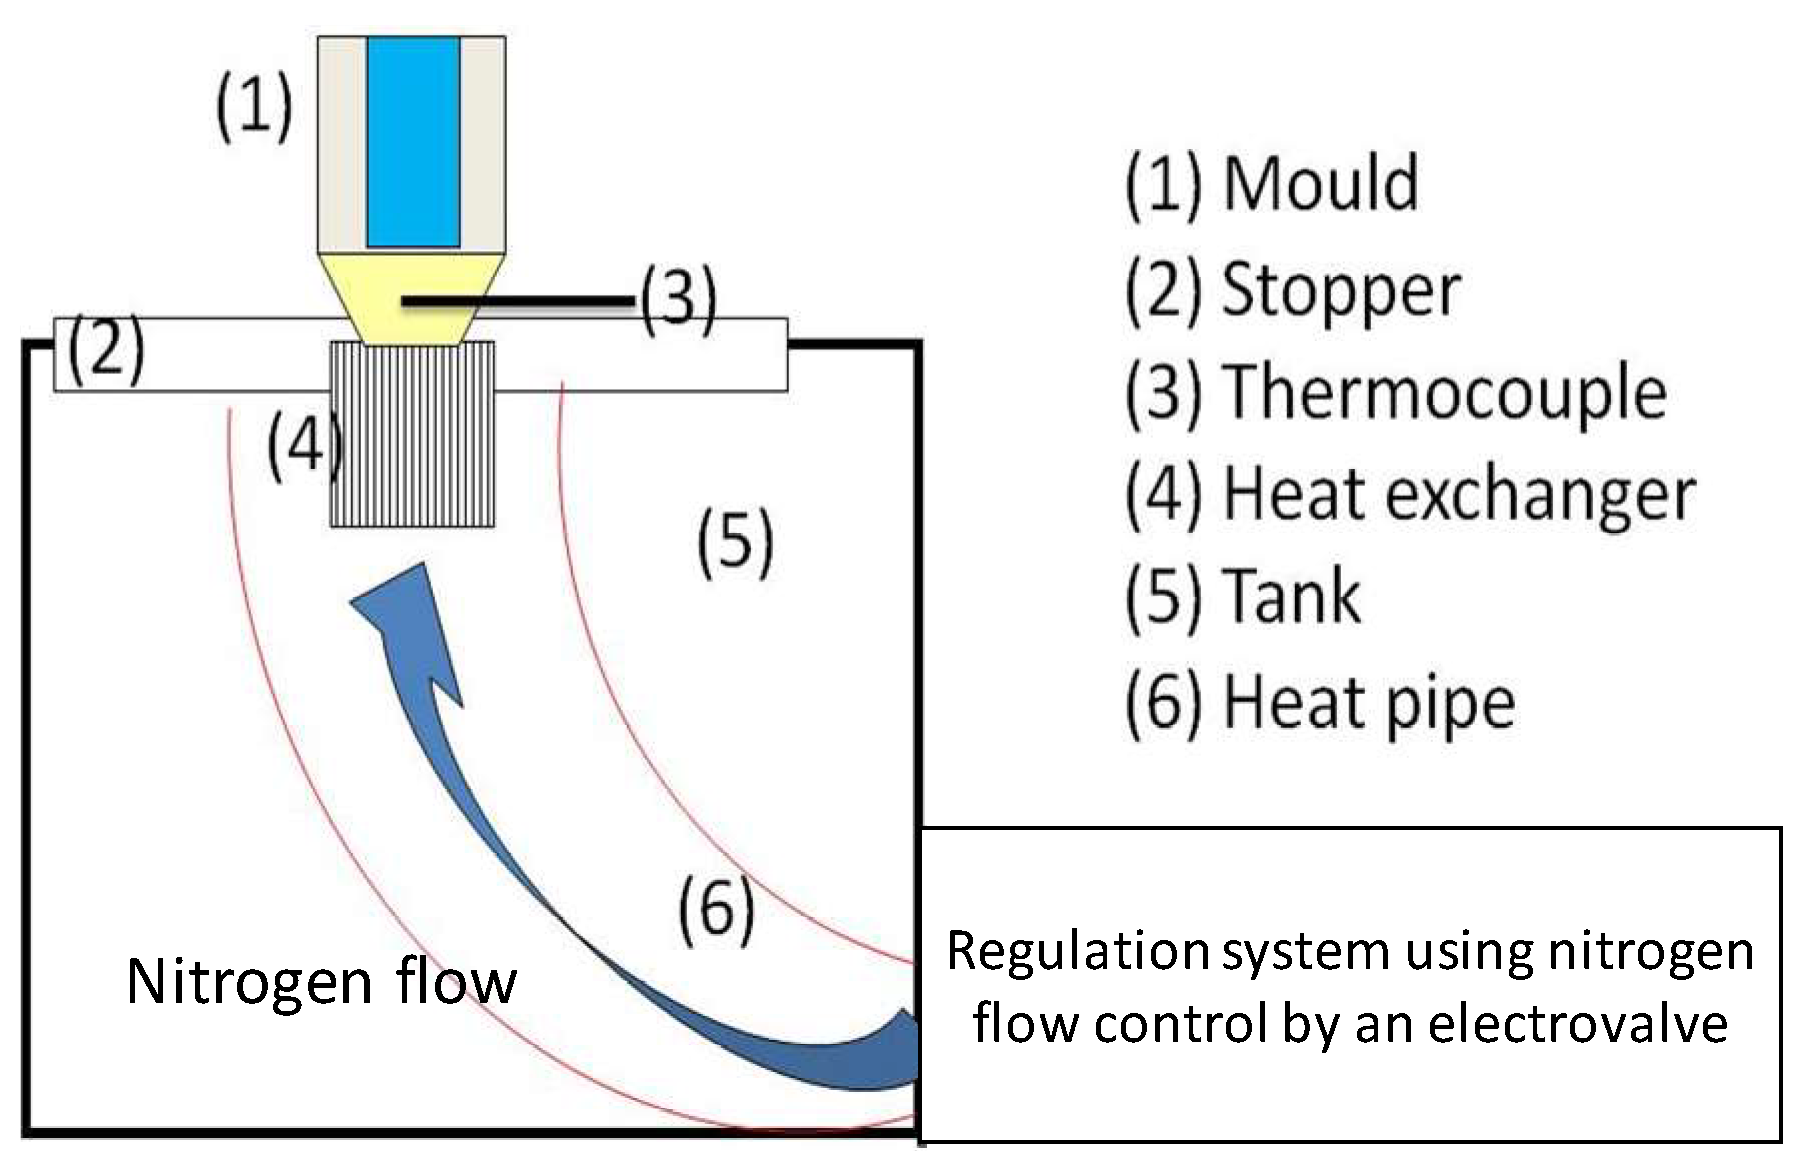
2. Materials and Methods
3. Results
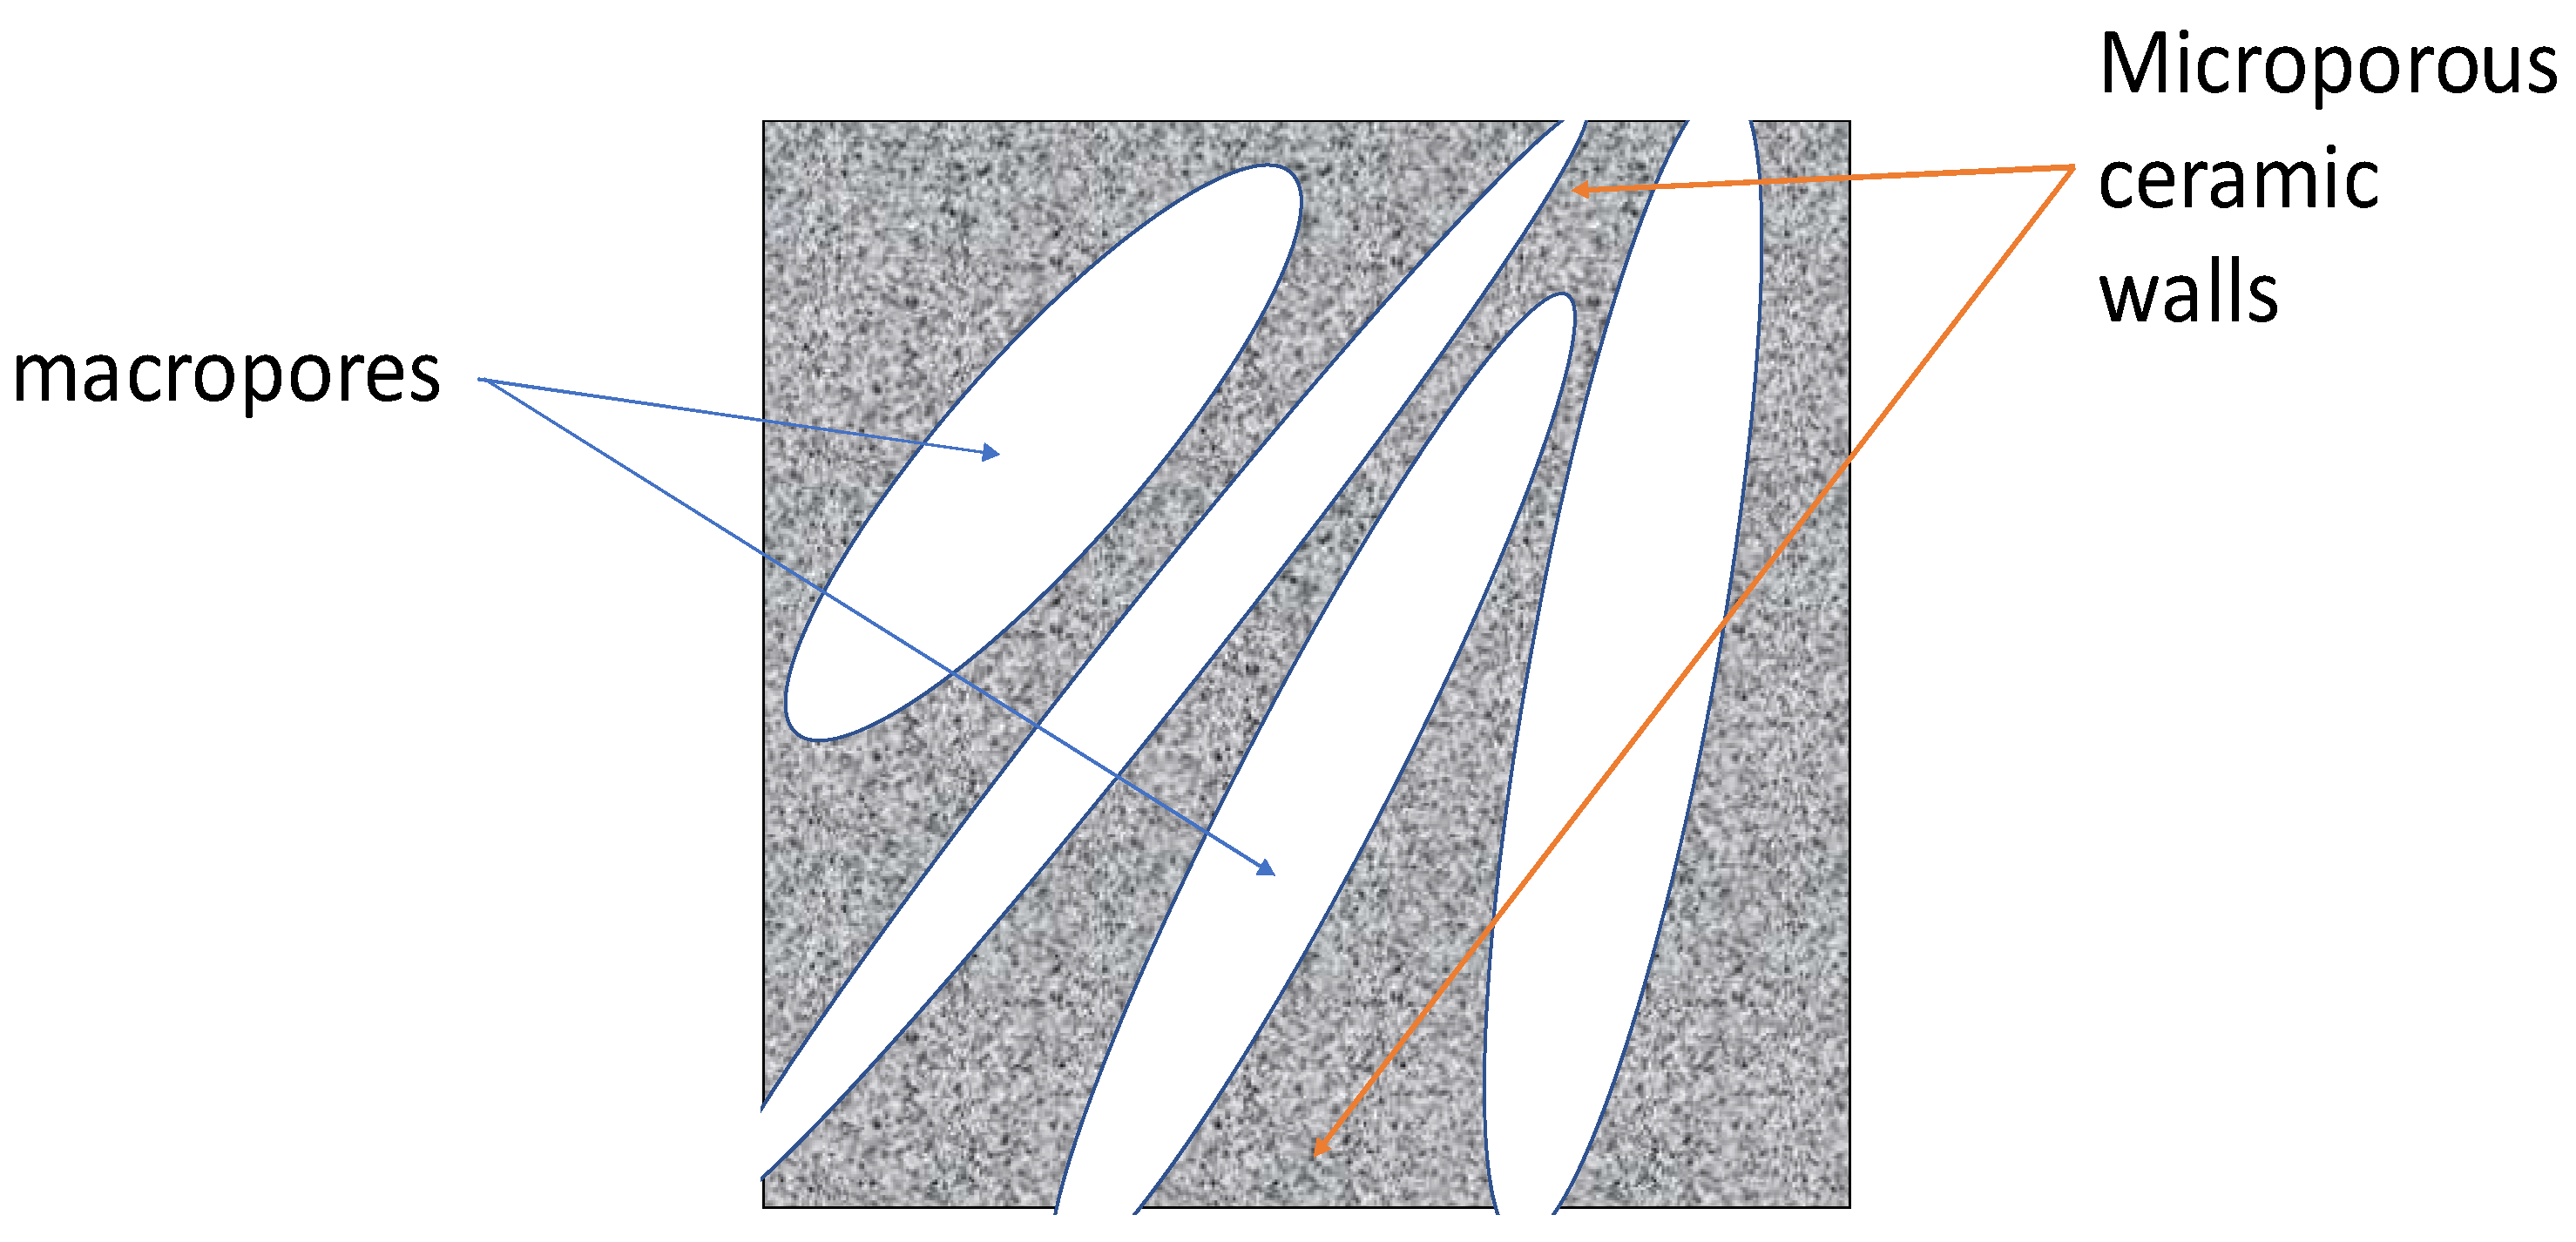
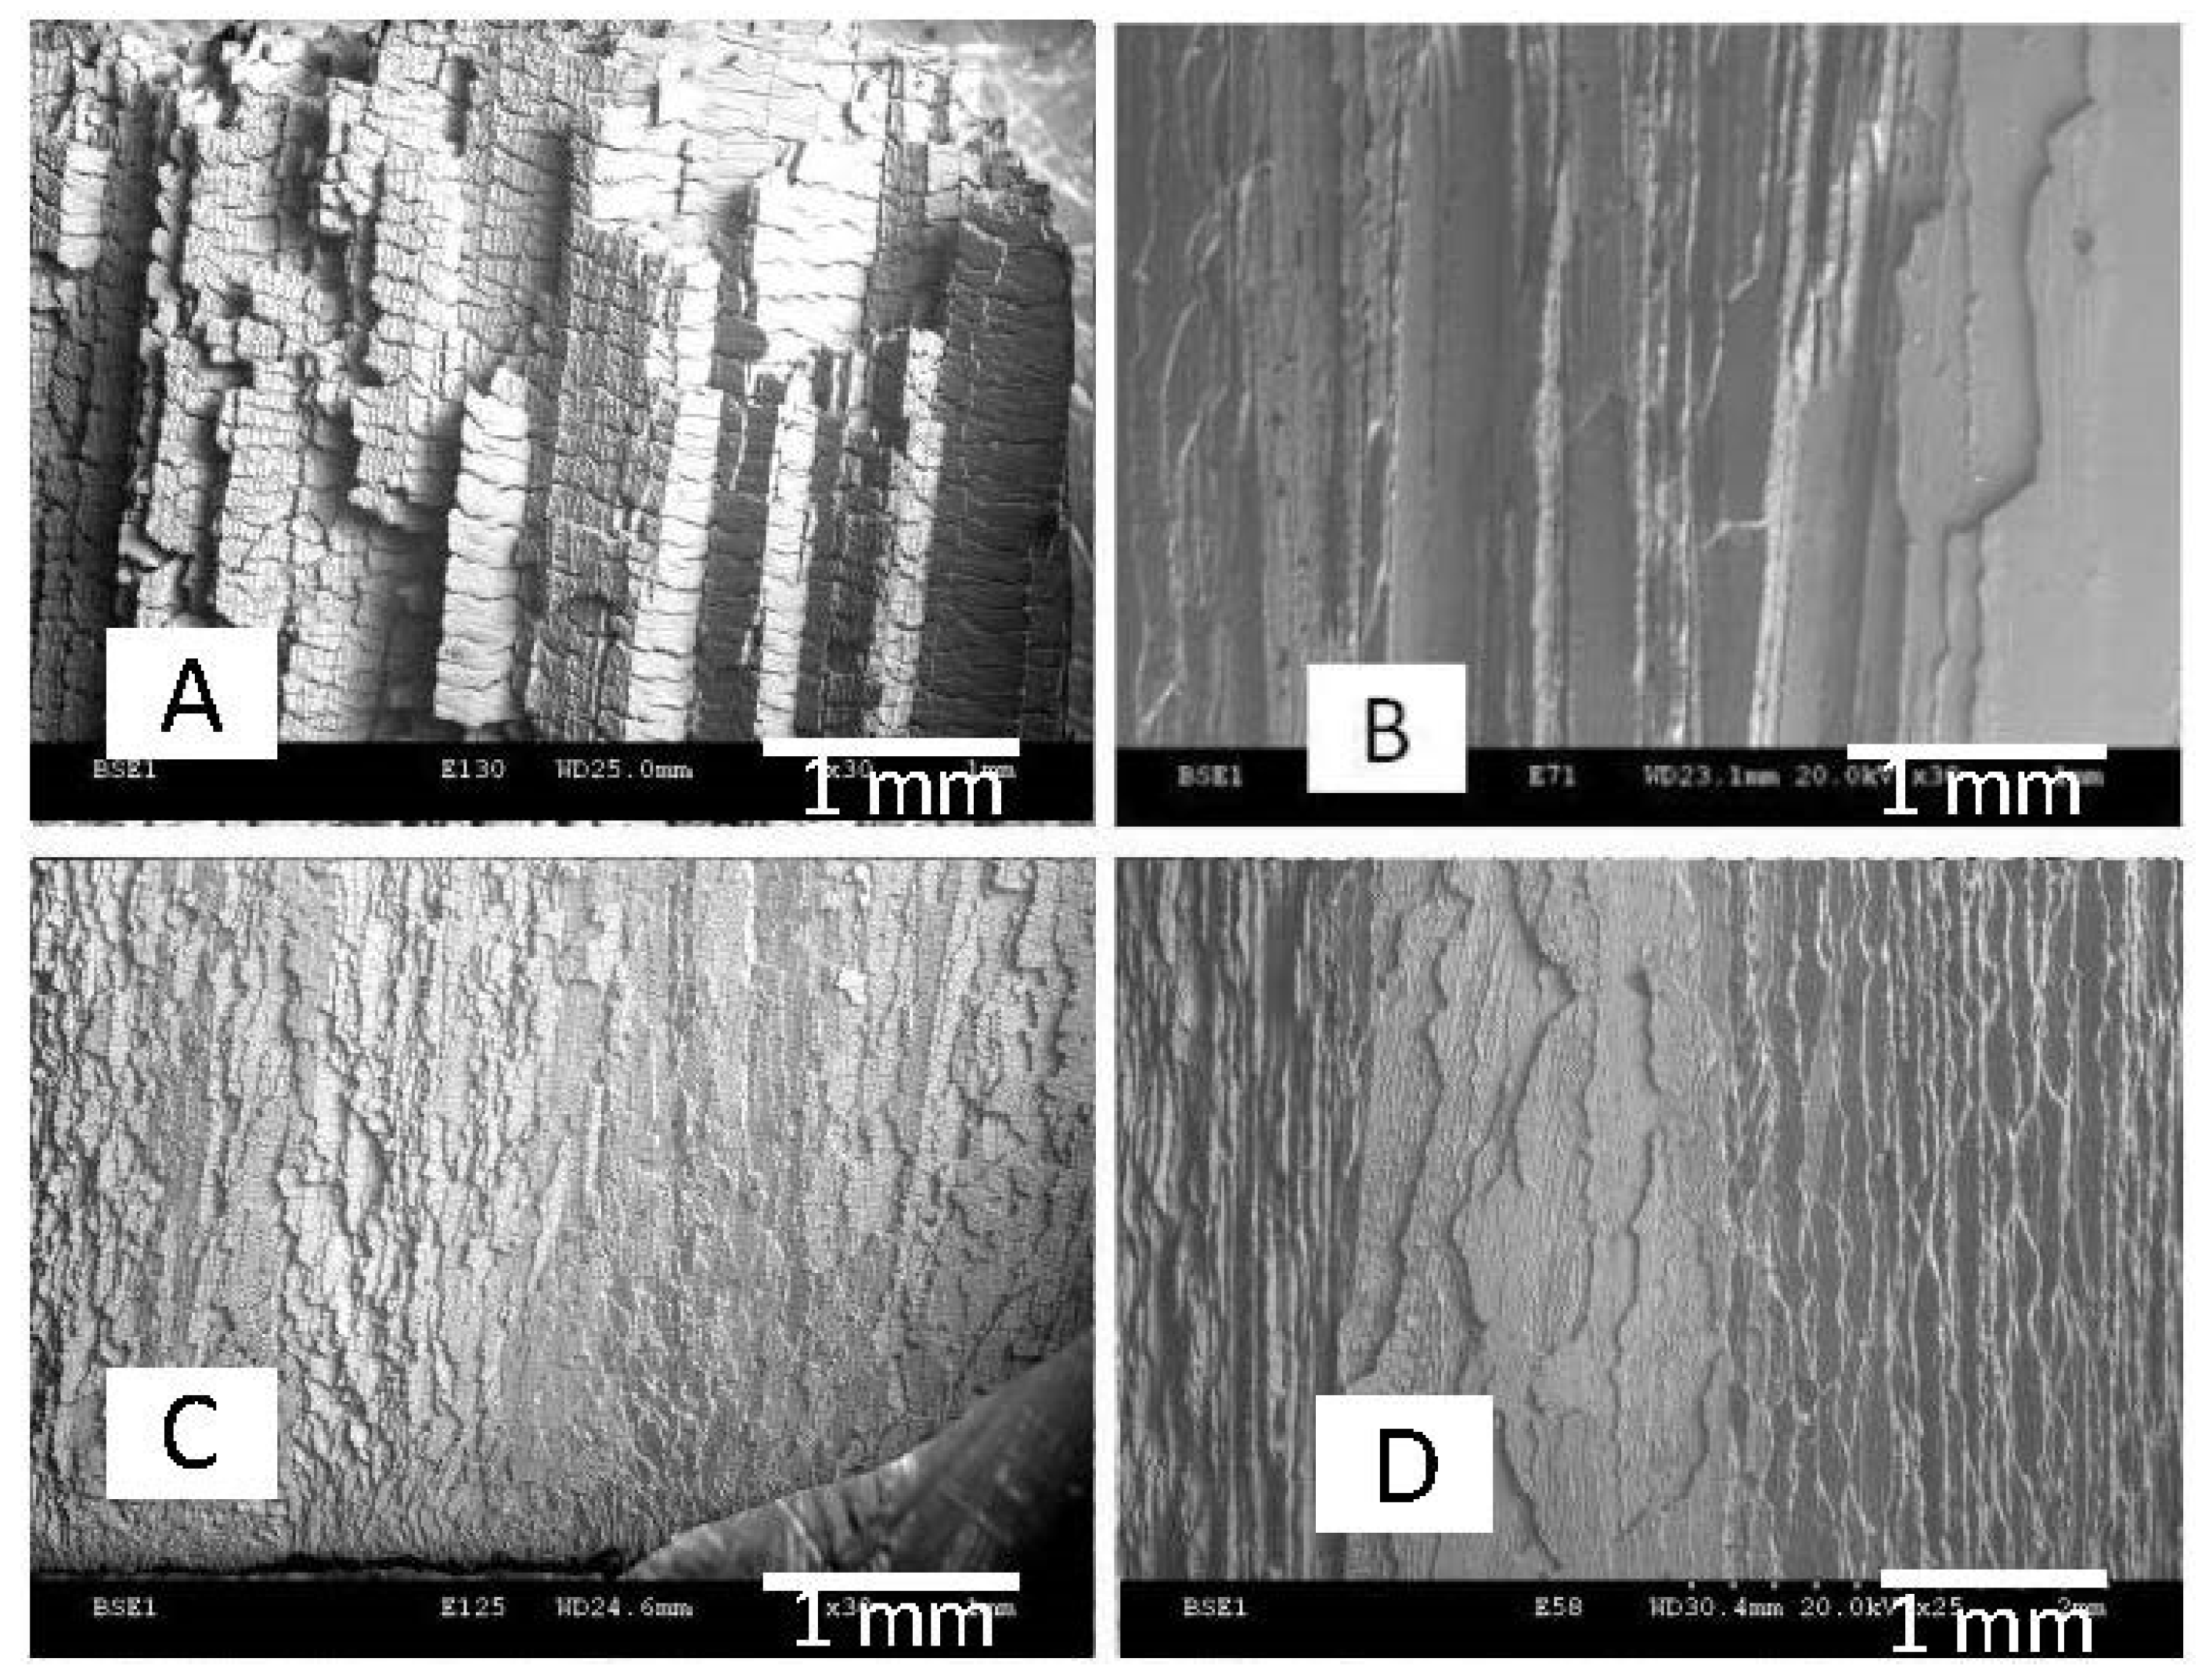
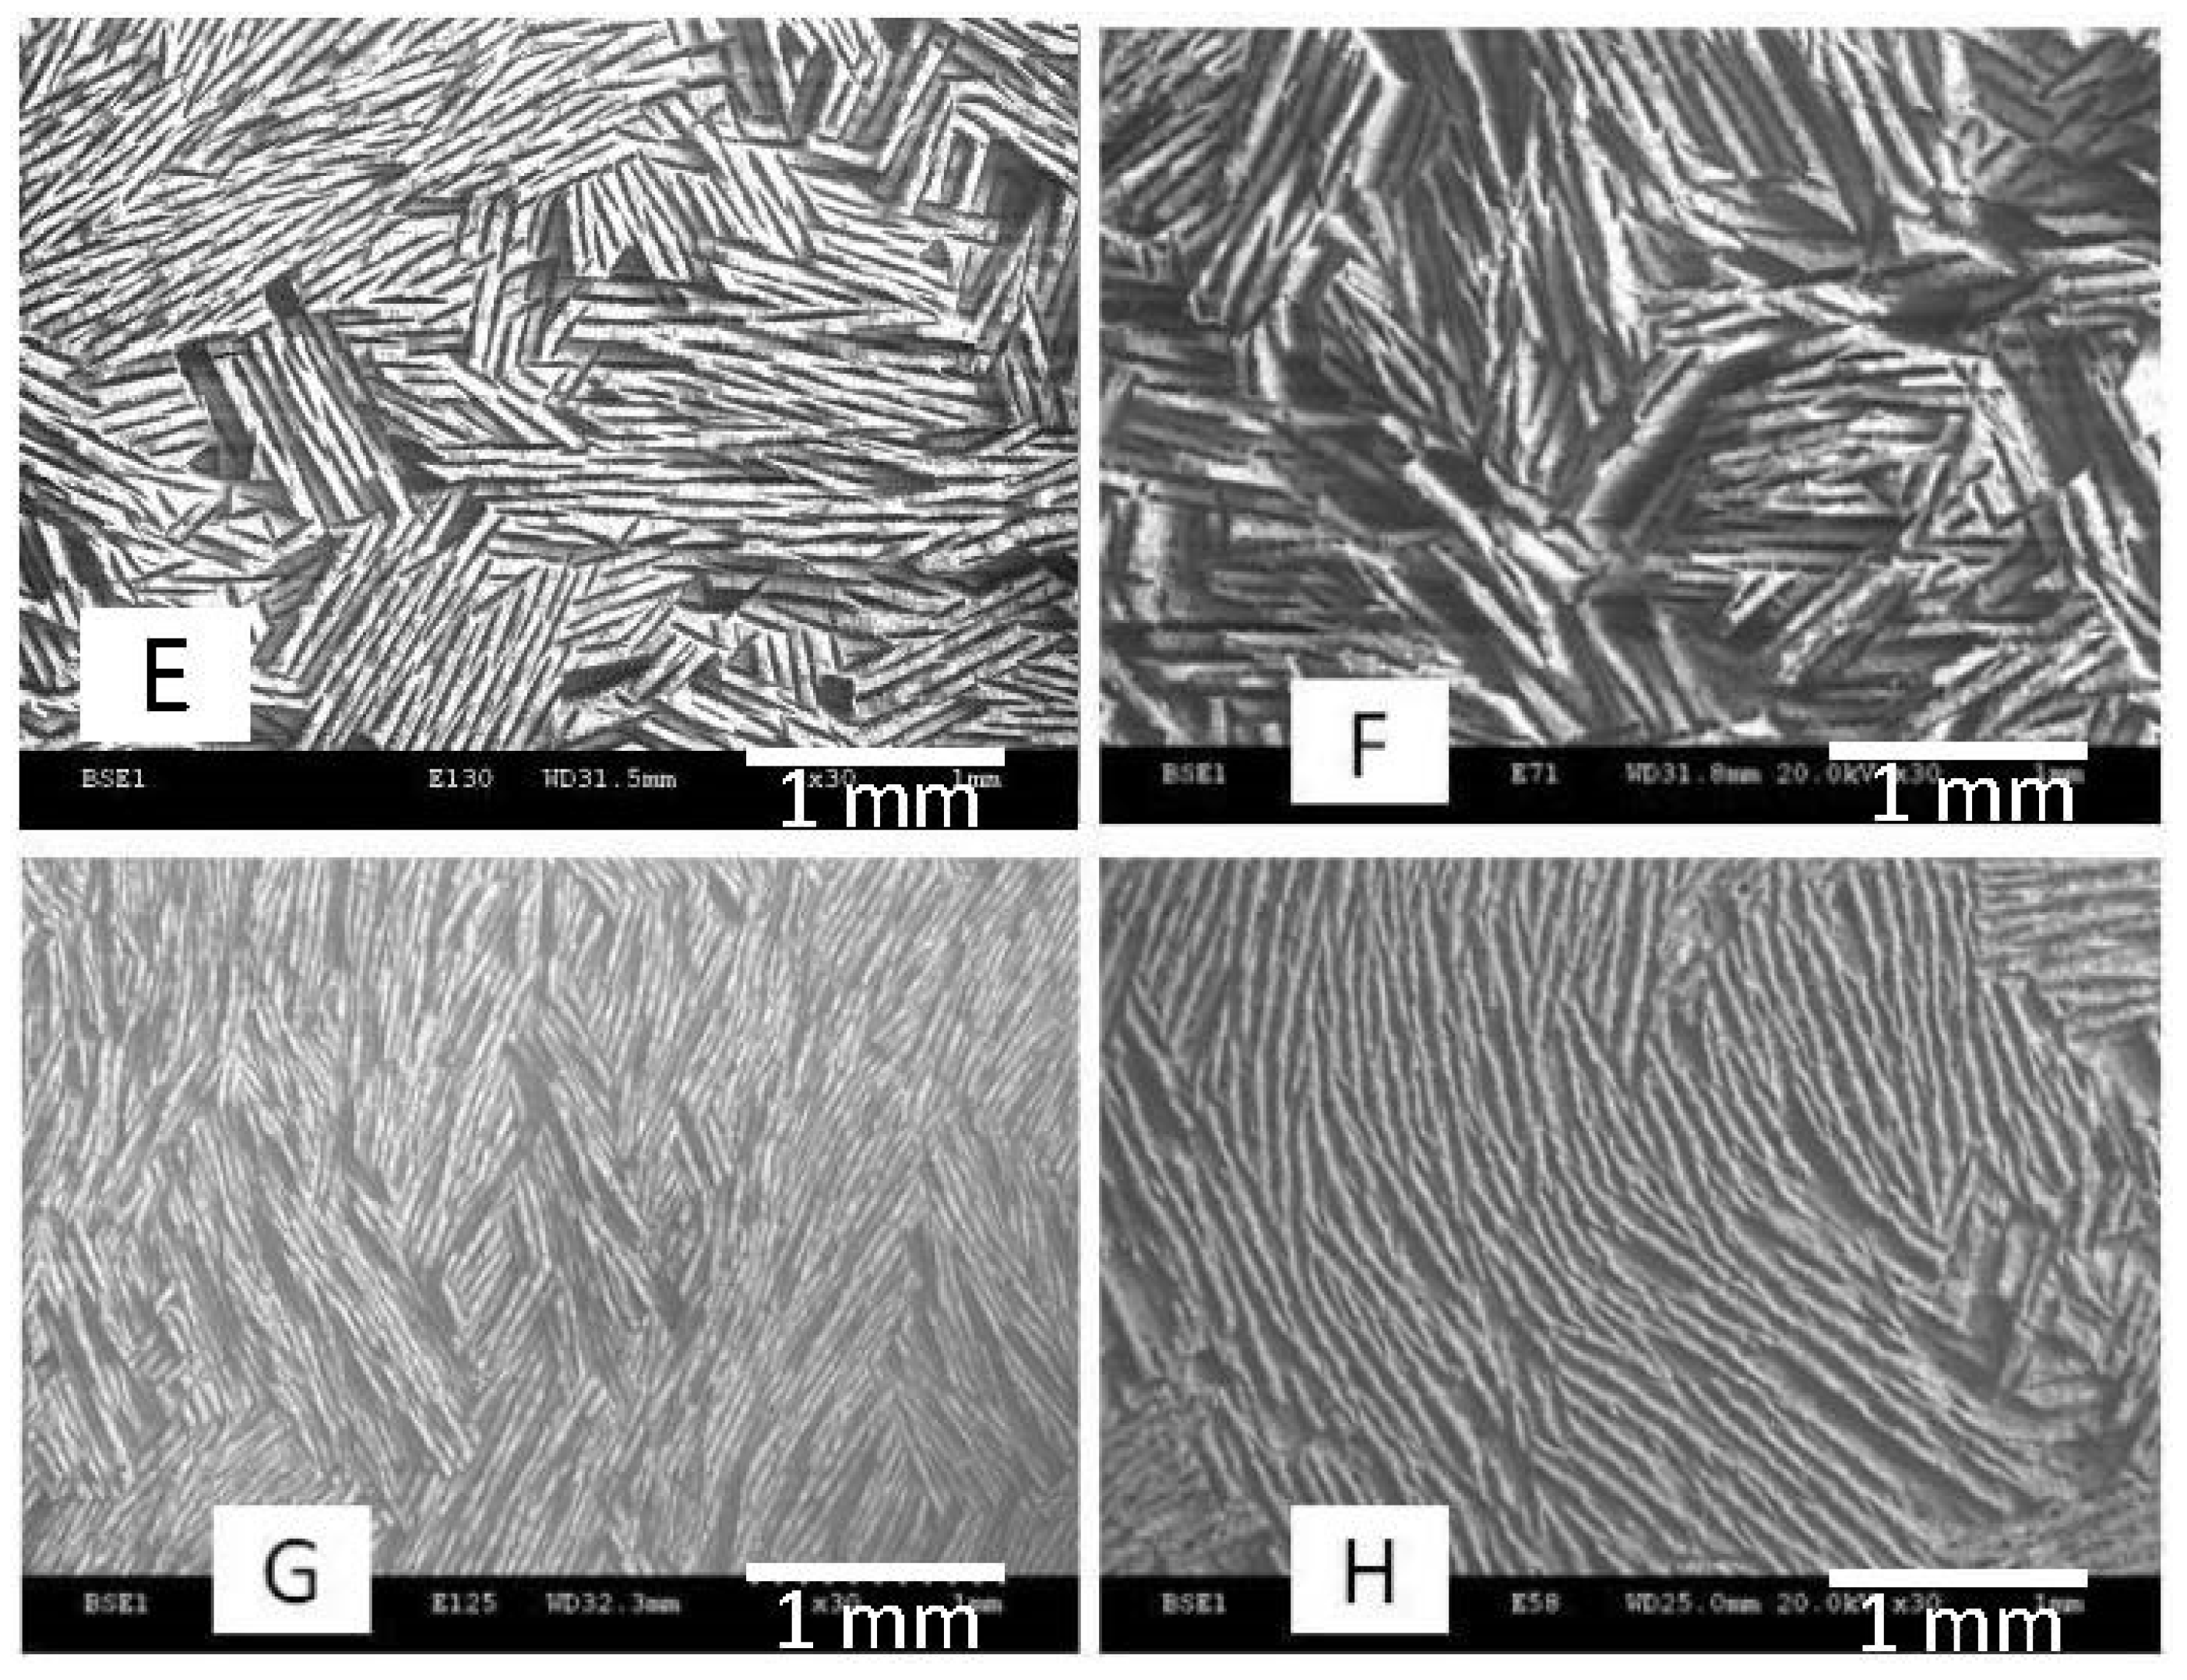
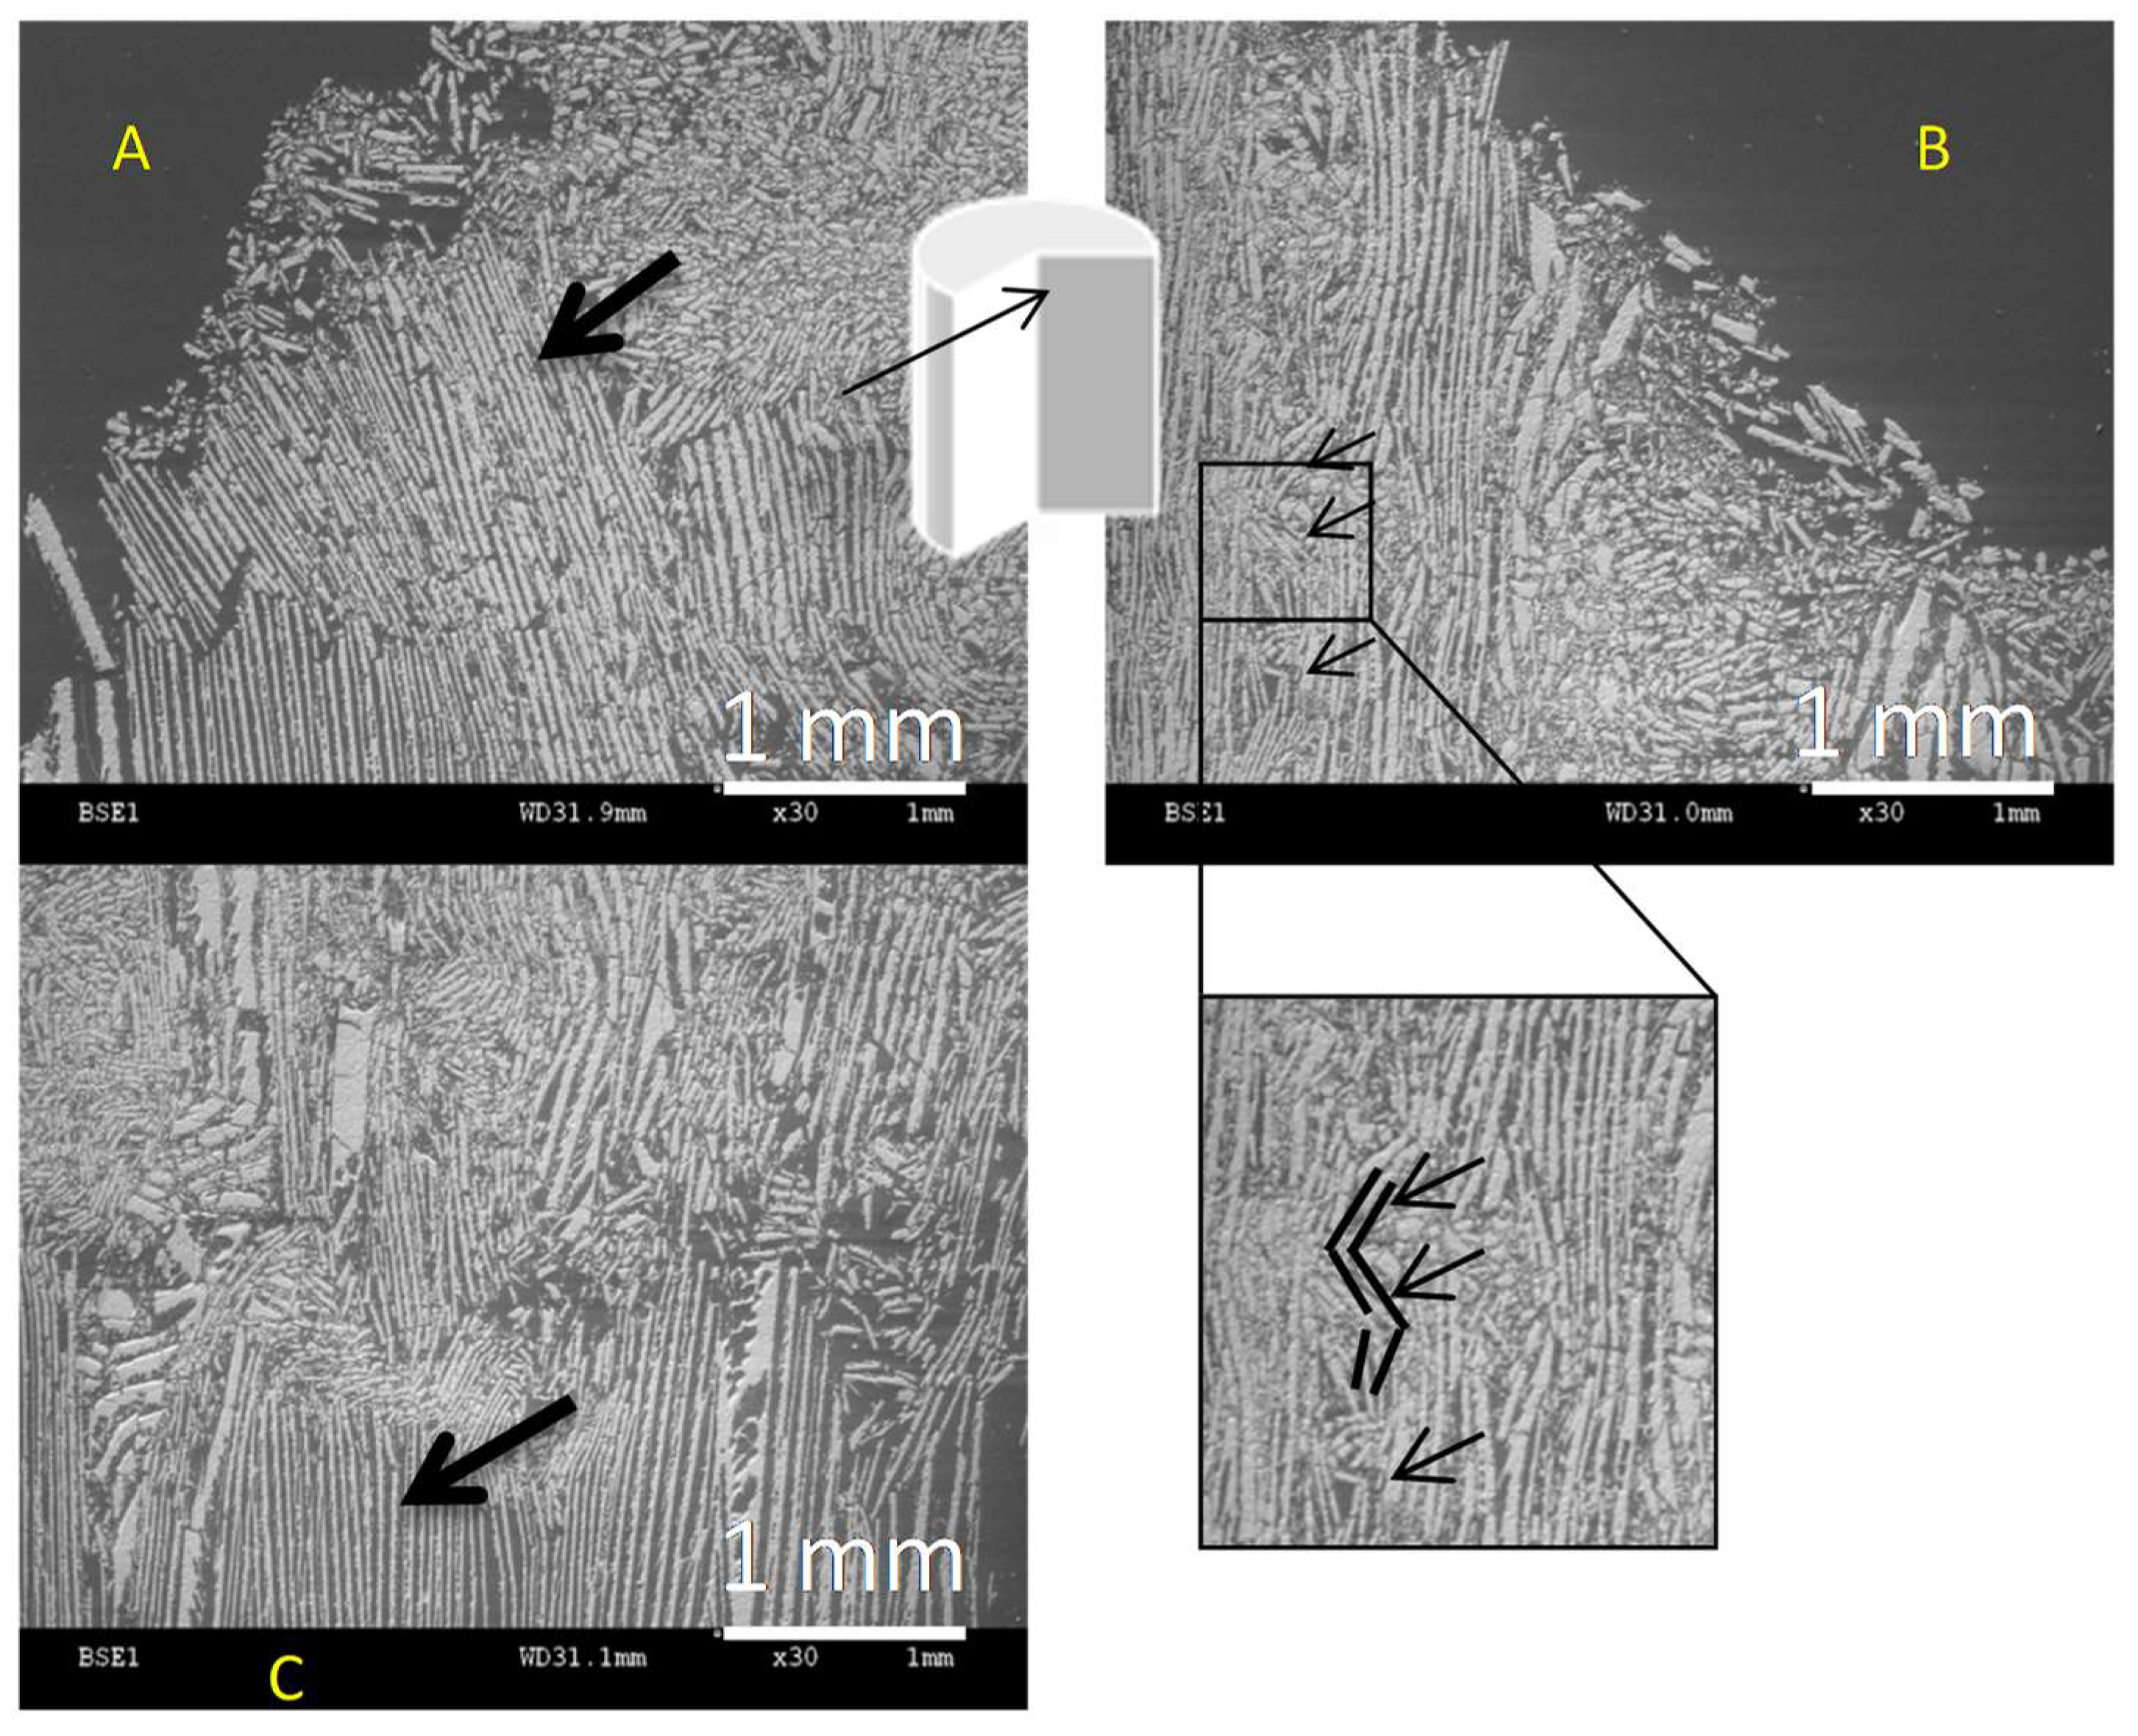
3.1. Microstructure
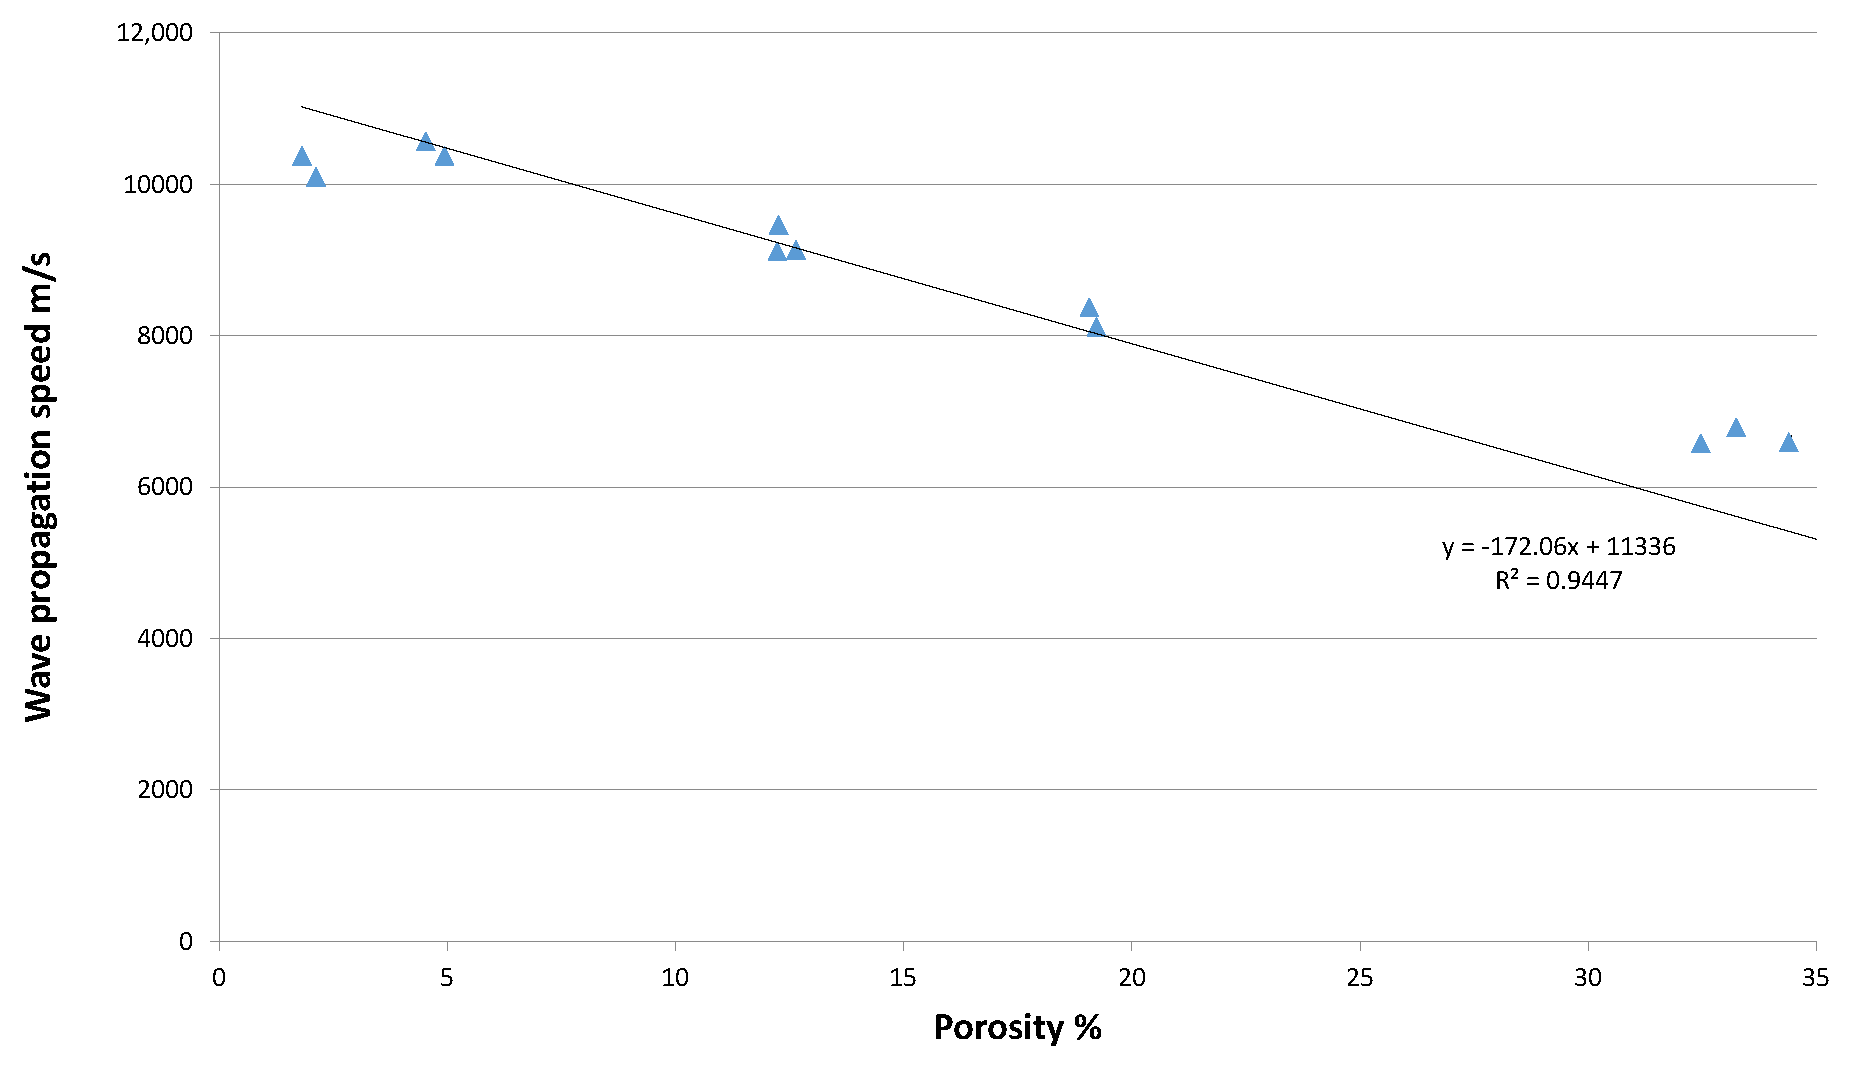
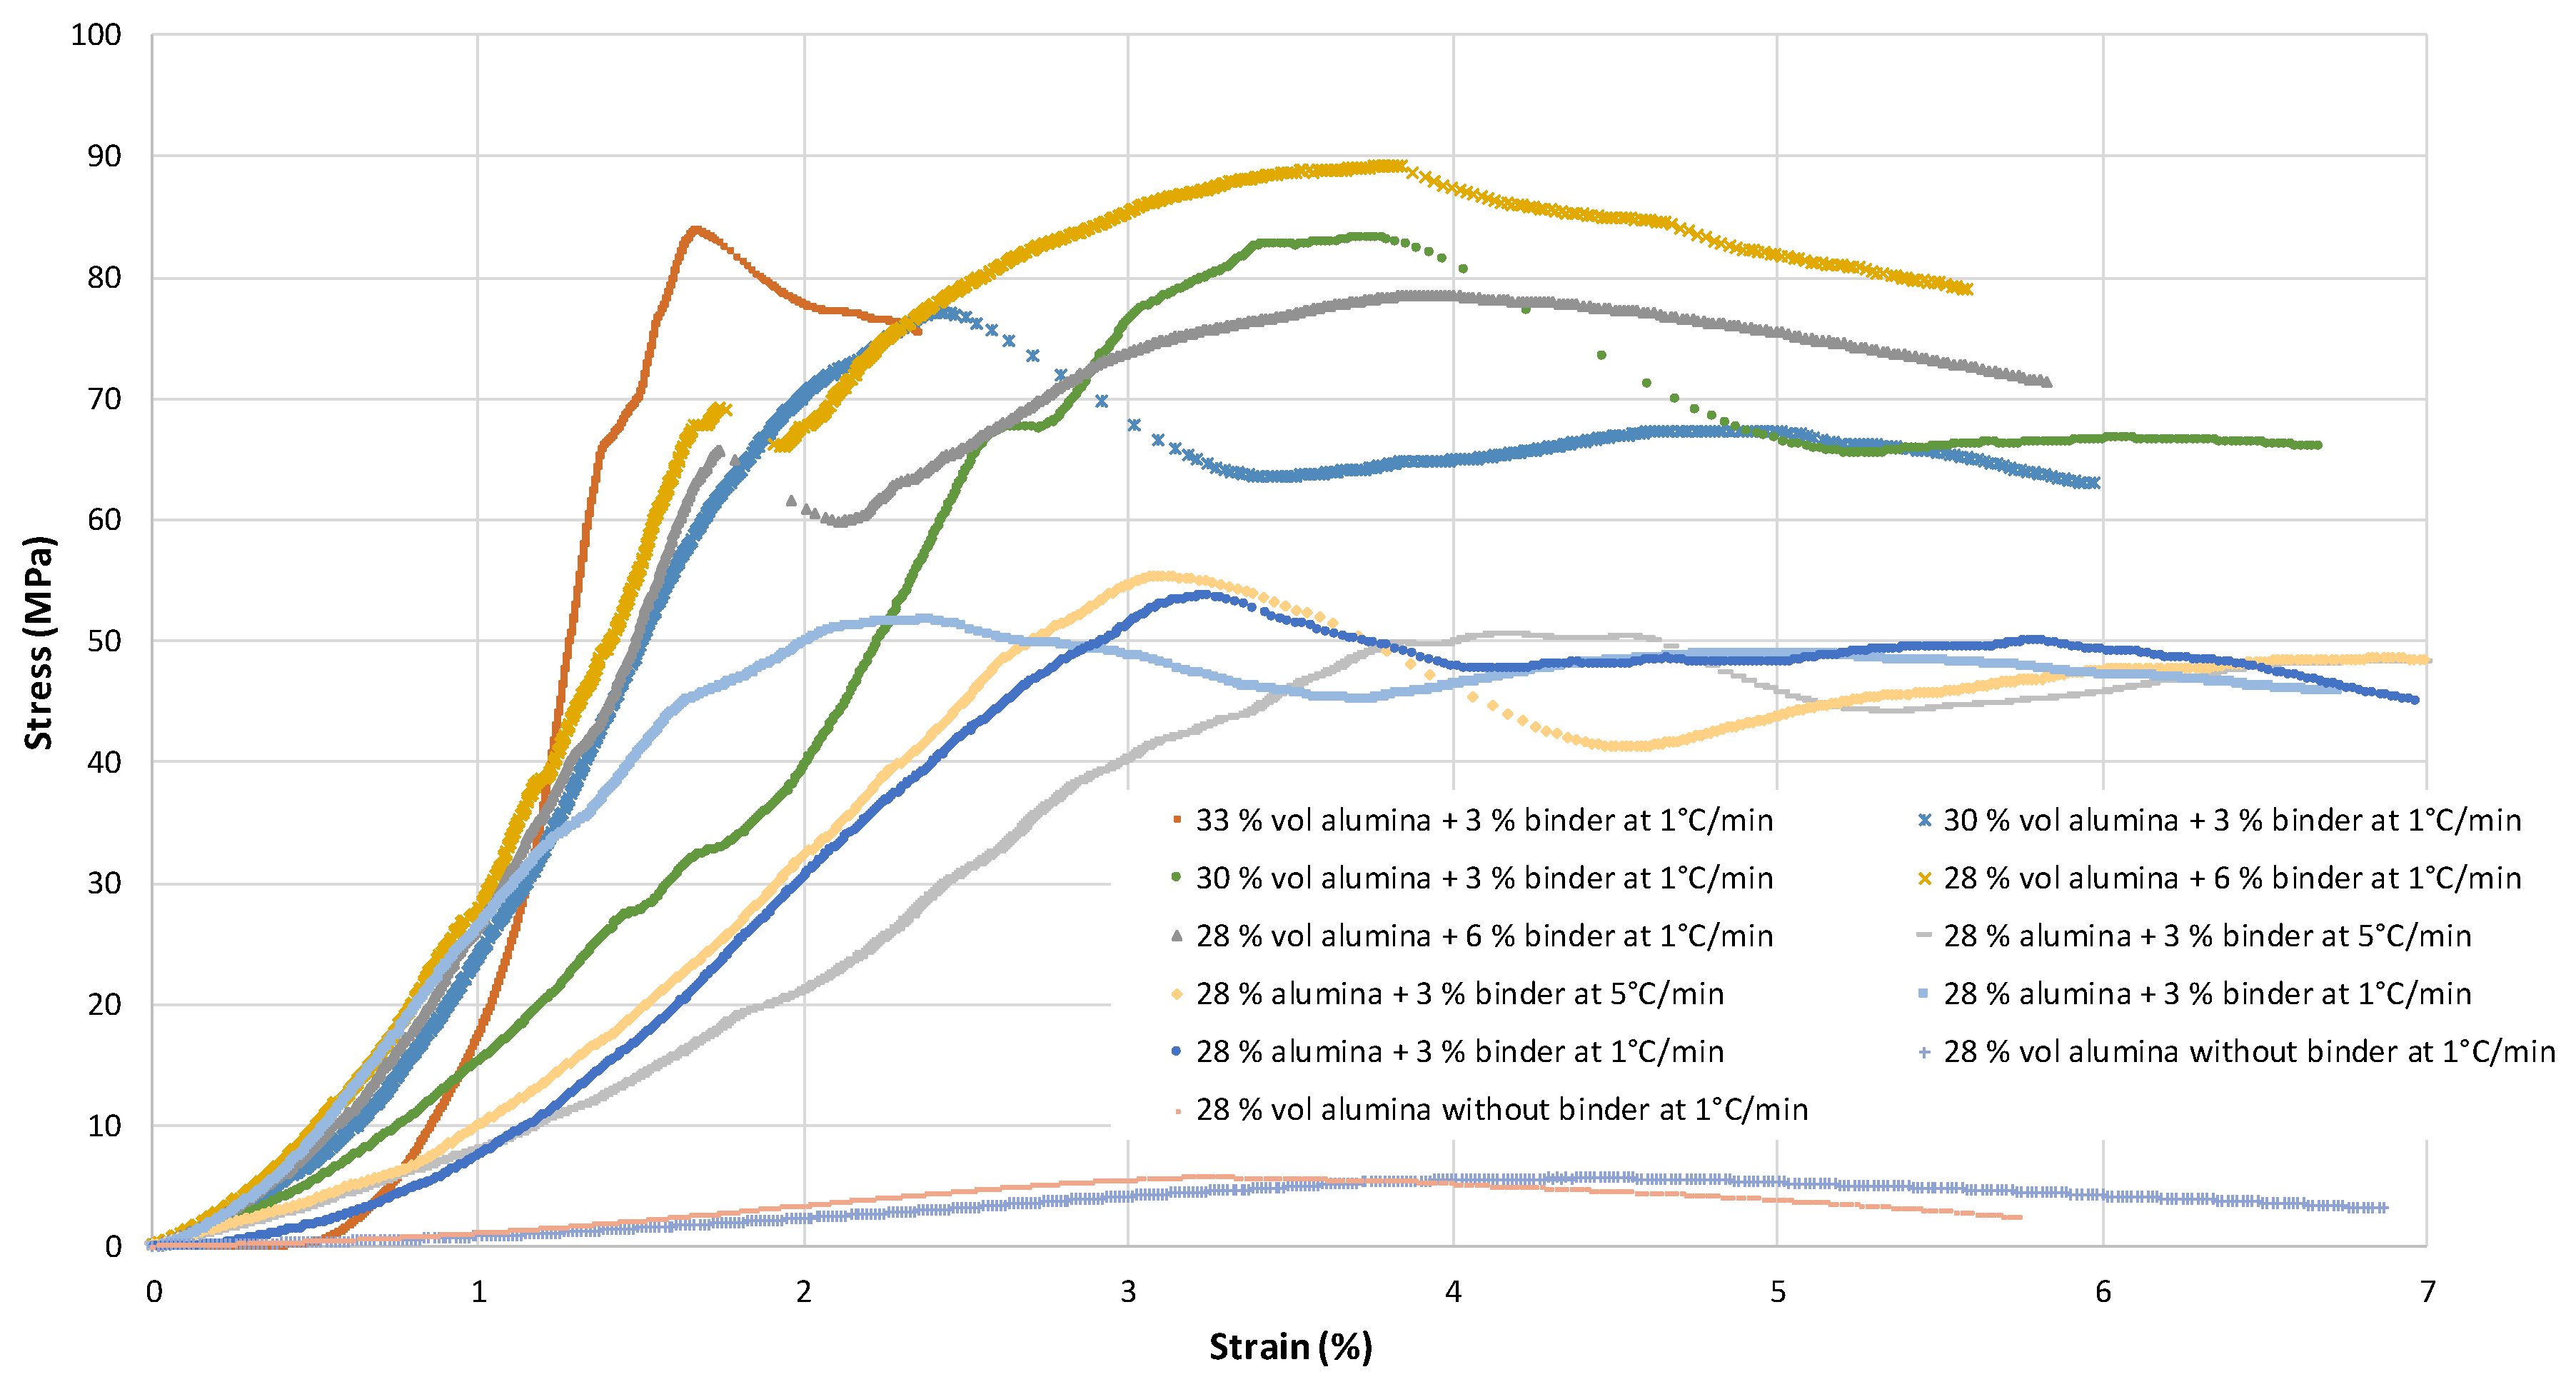
3.2. Mechanical Characterisation
4. Discussion
4.1. Deformation Behaviour
4.2. Deformation Behaviour
5. Conclusions
- -
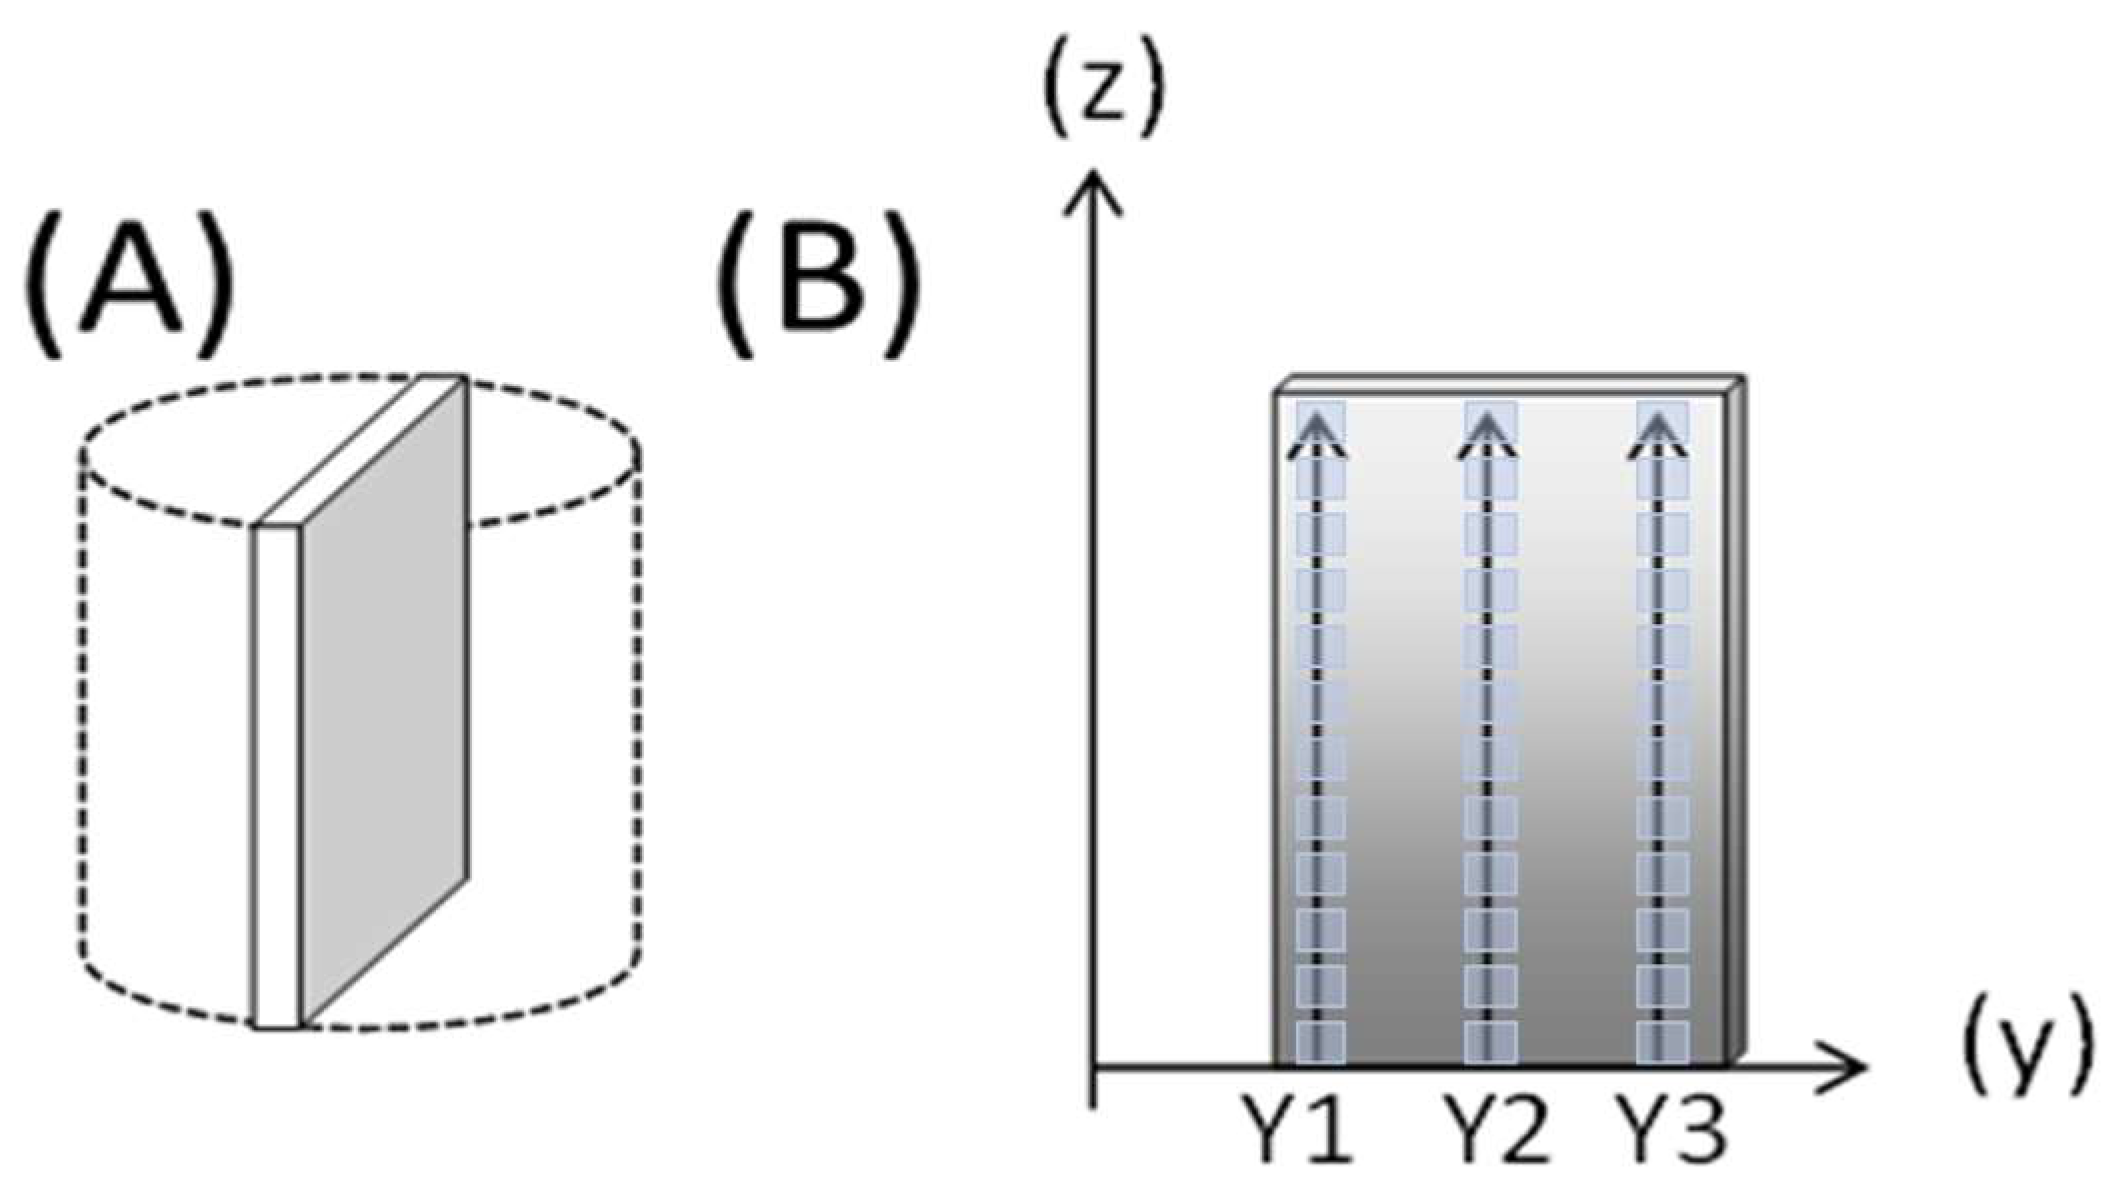
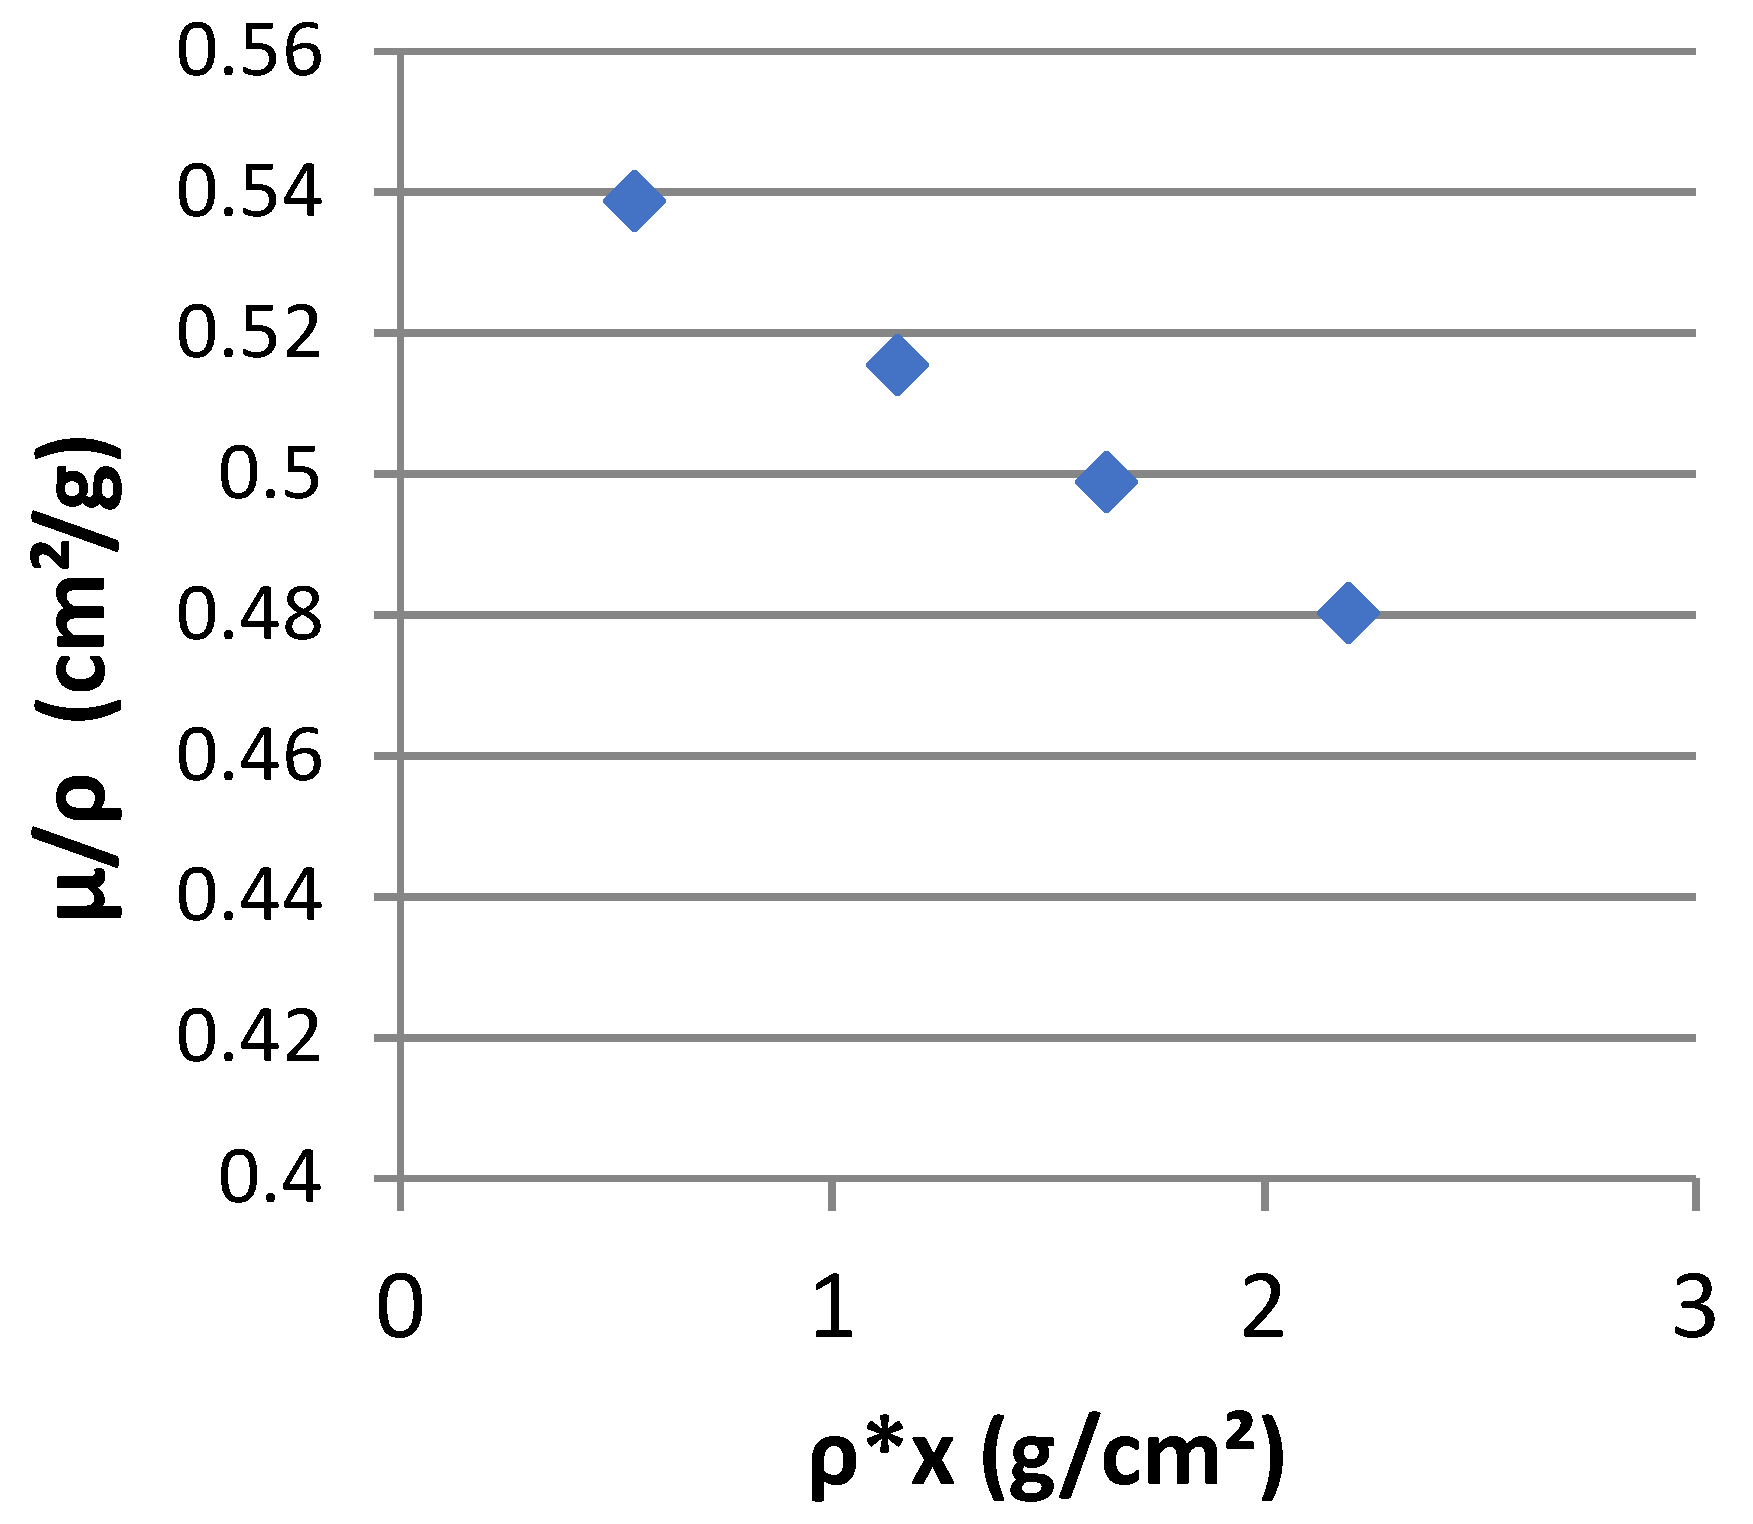
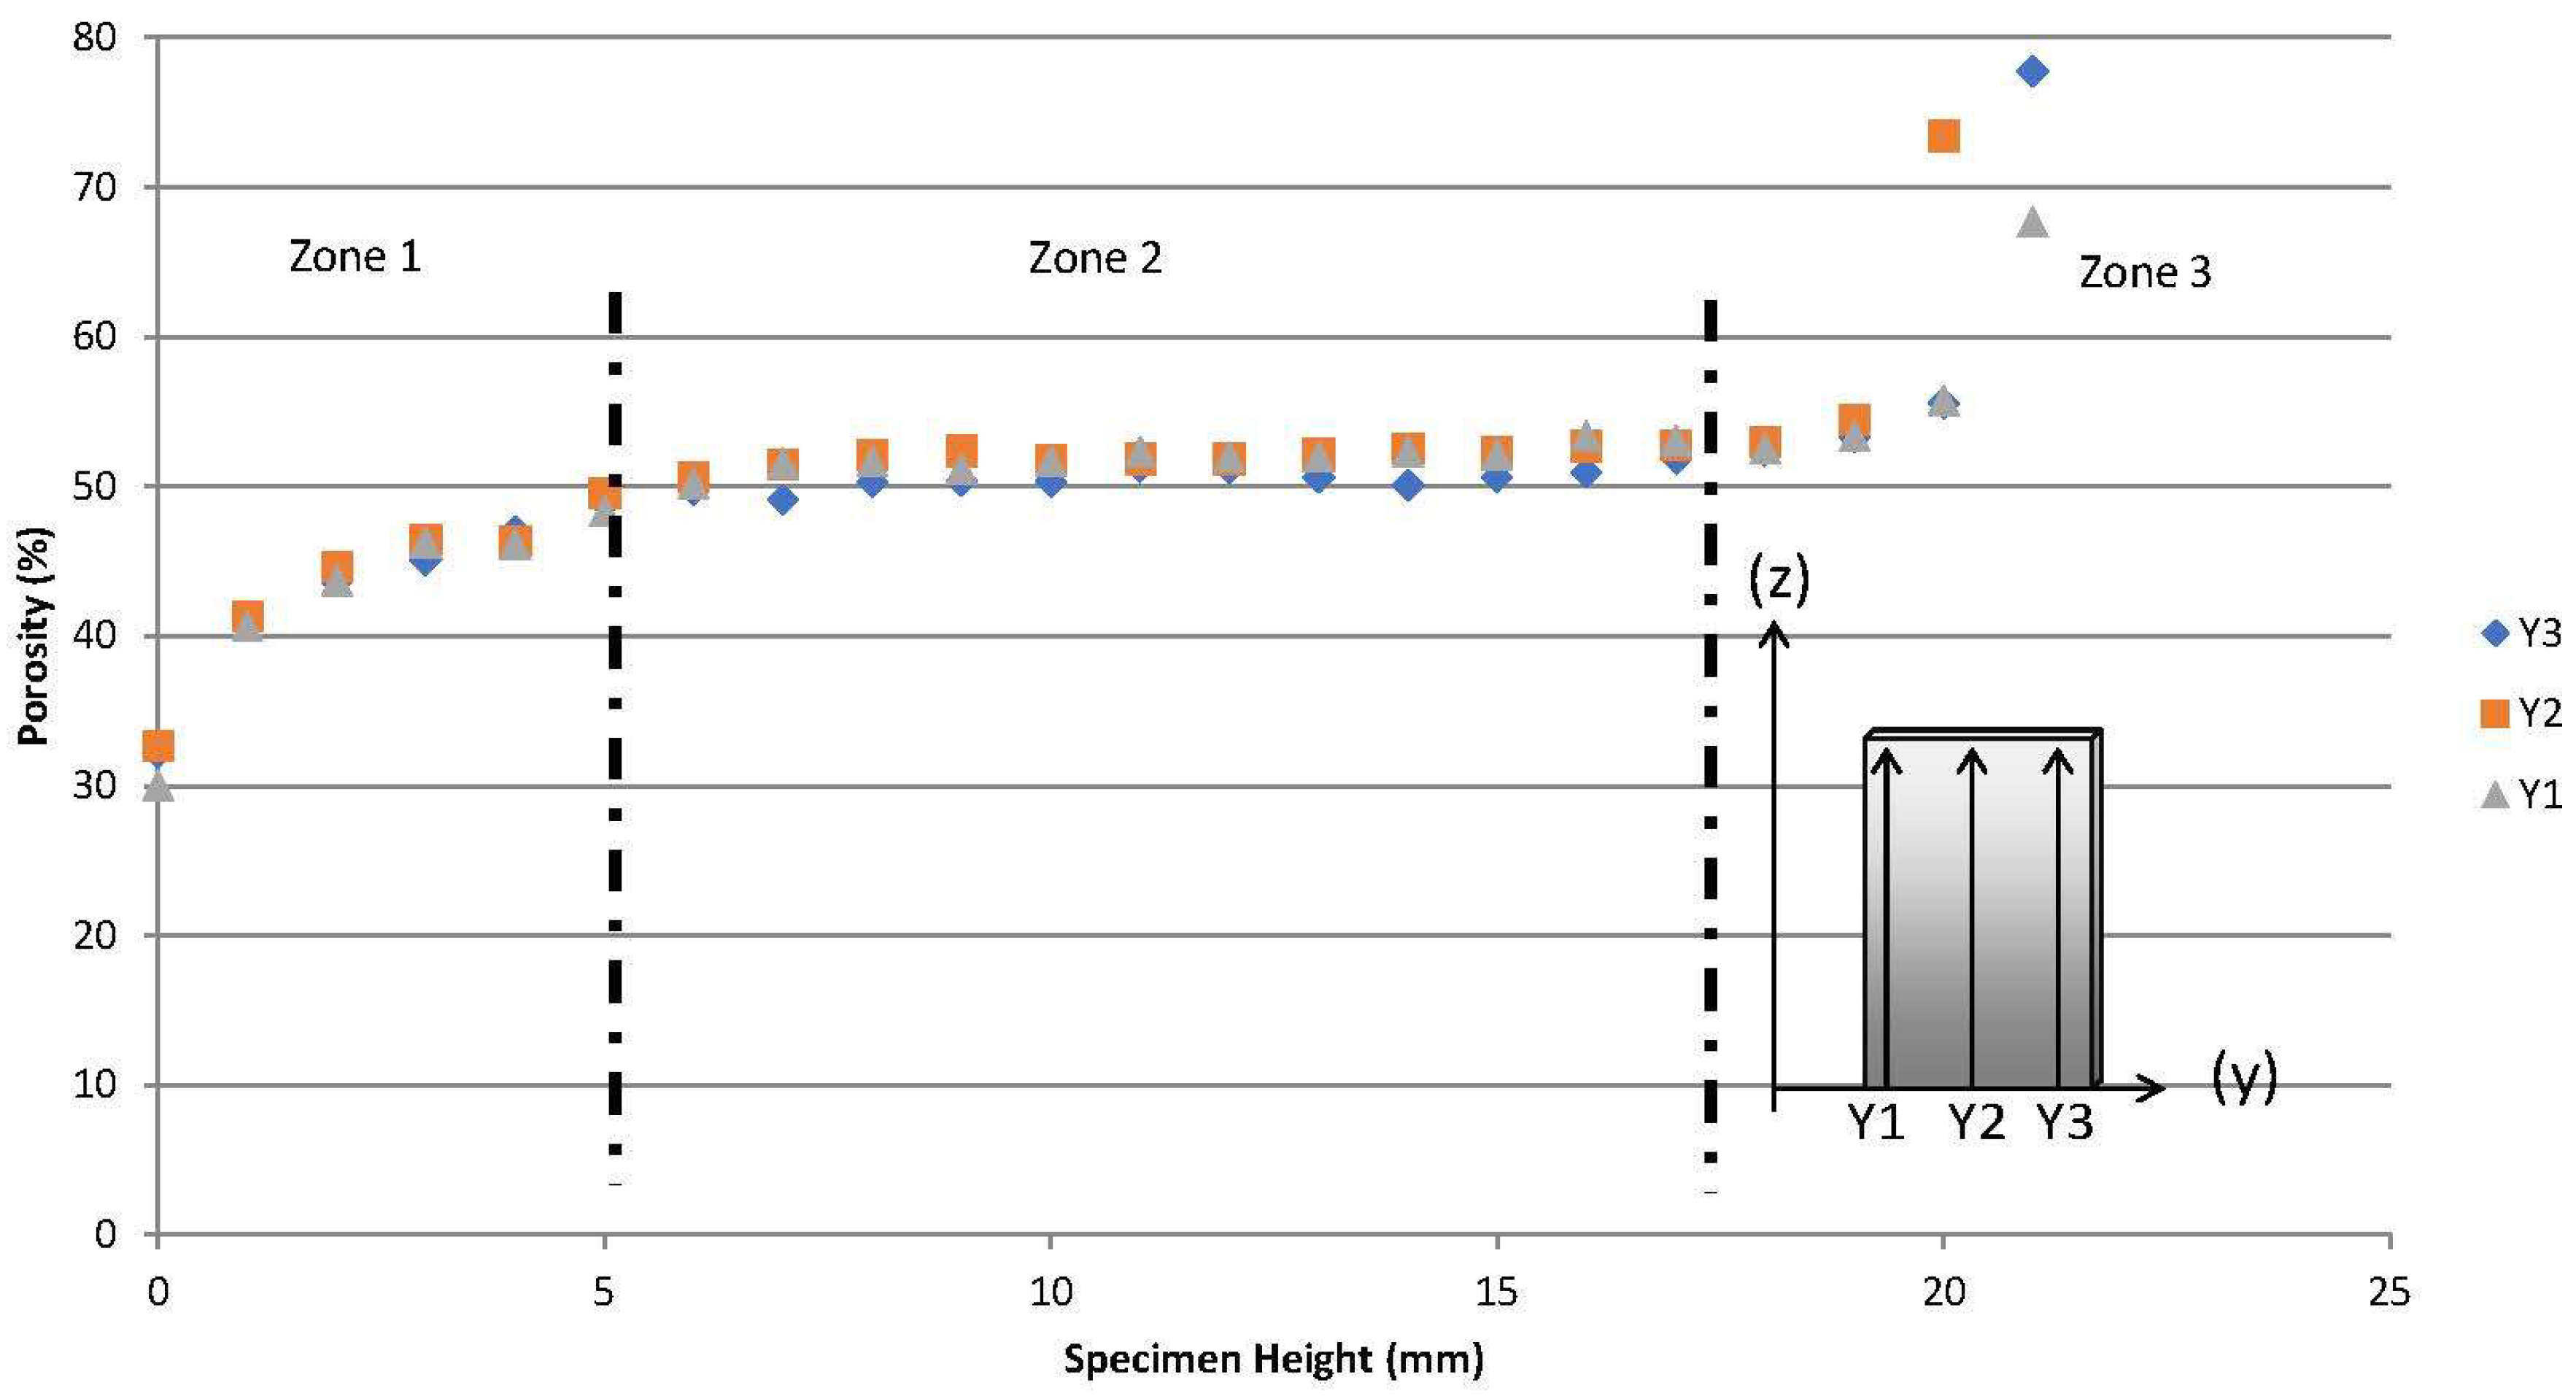
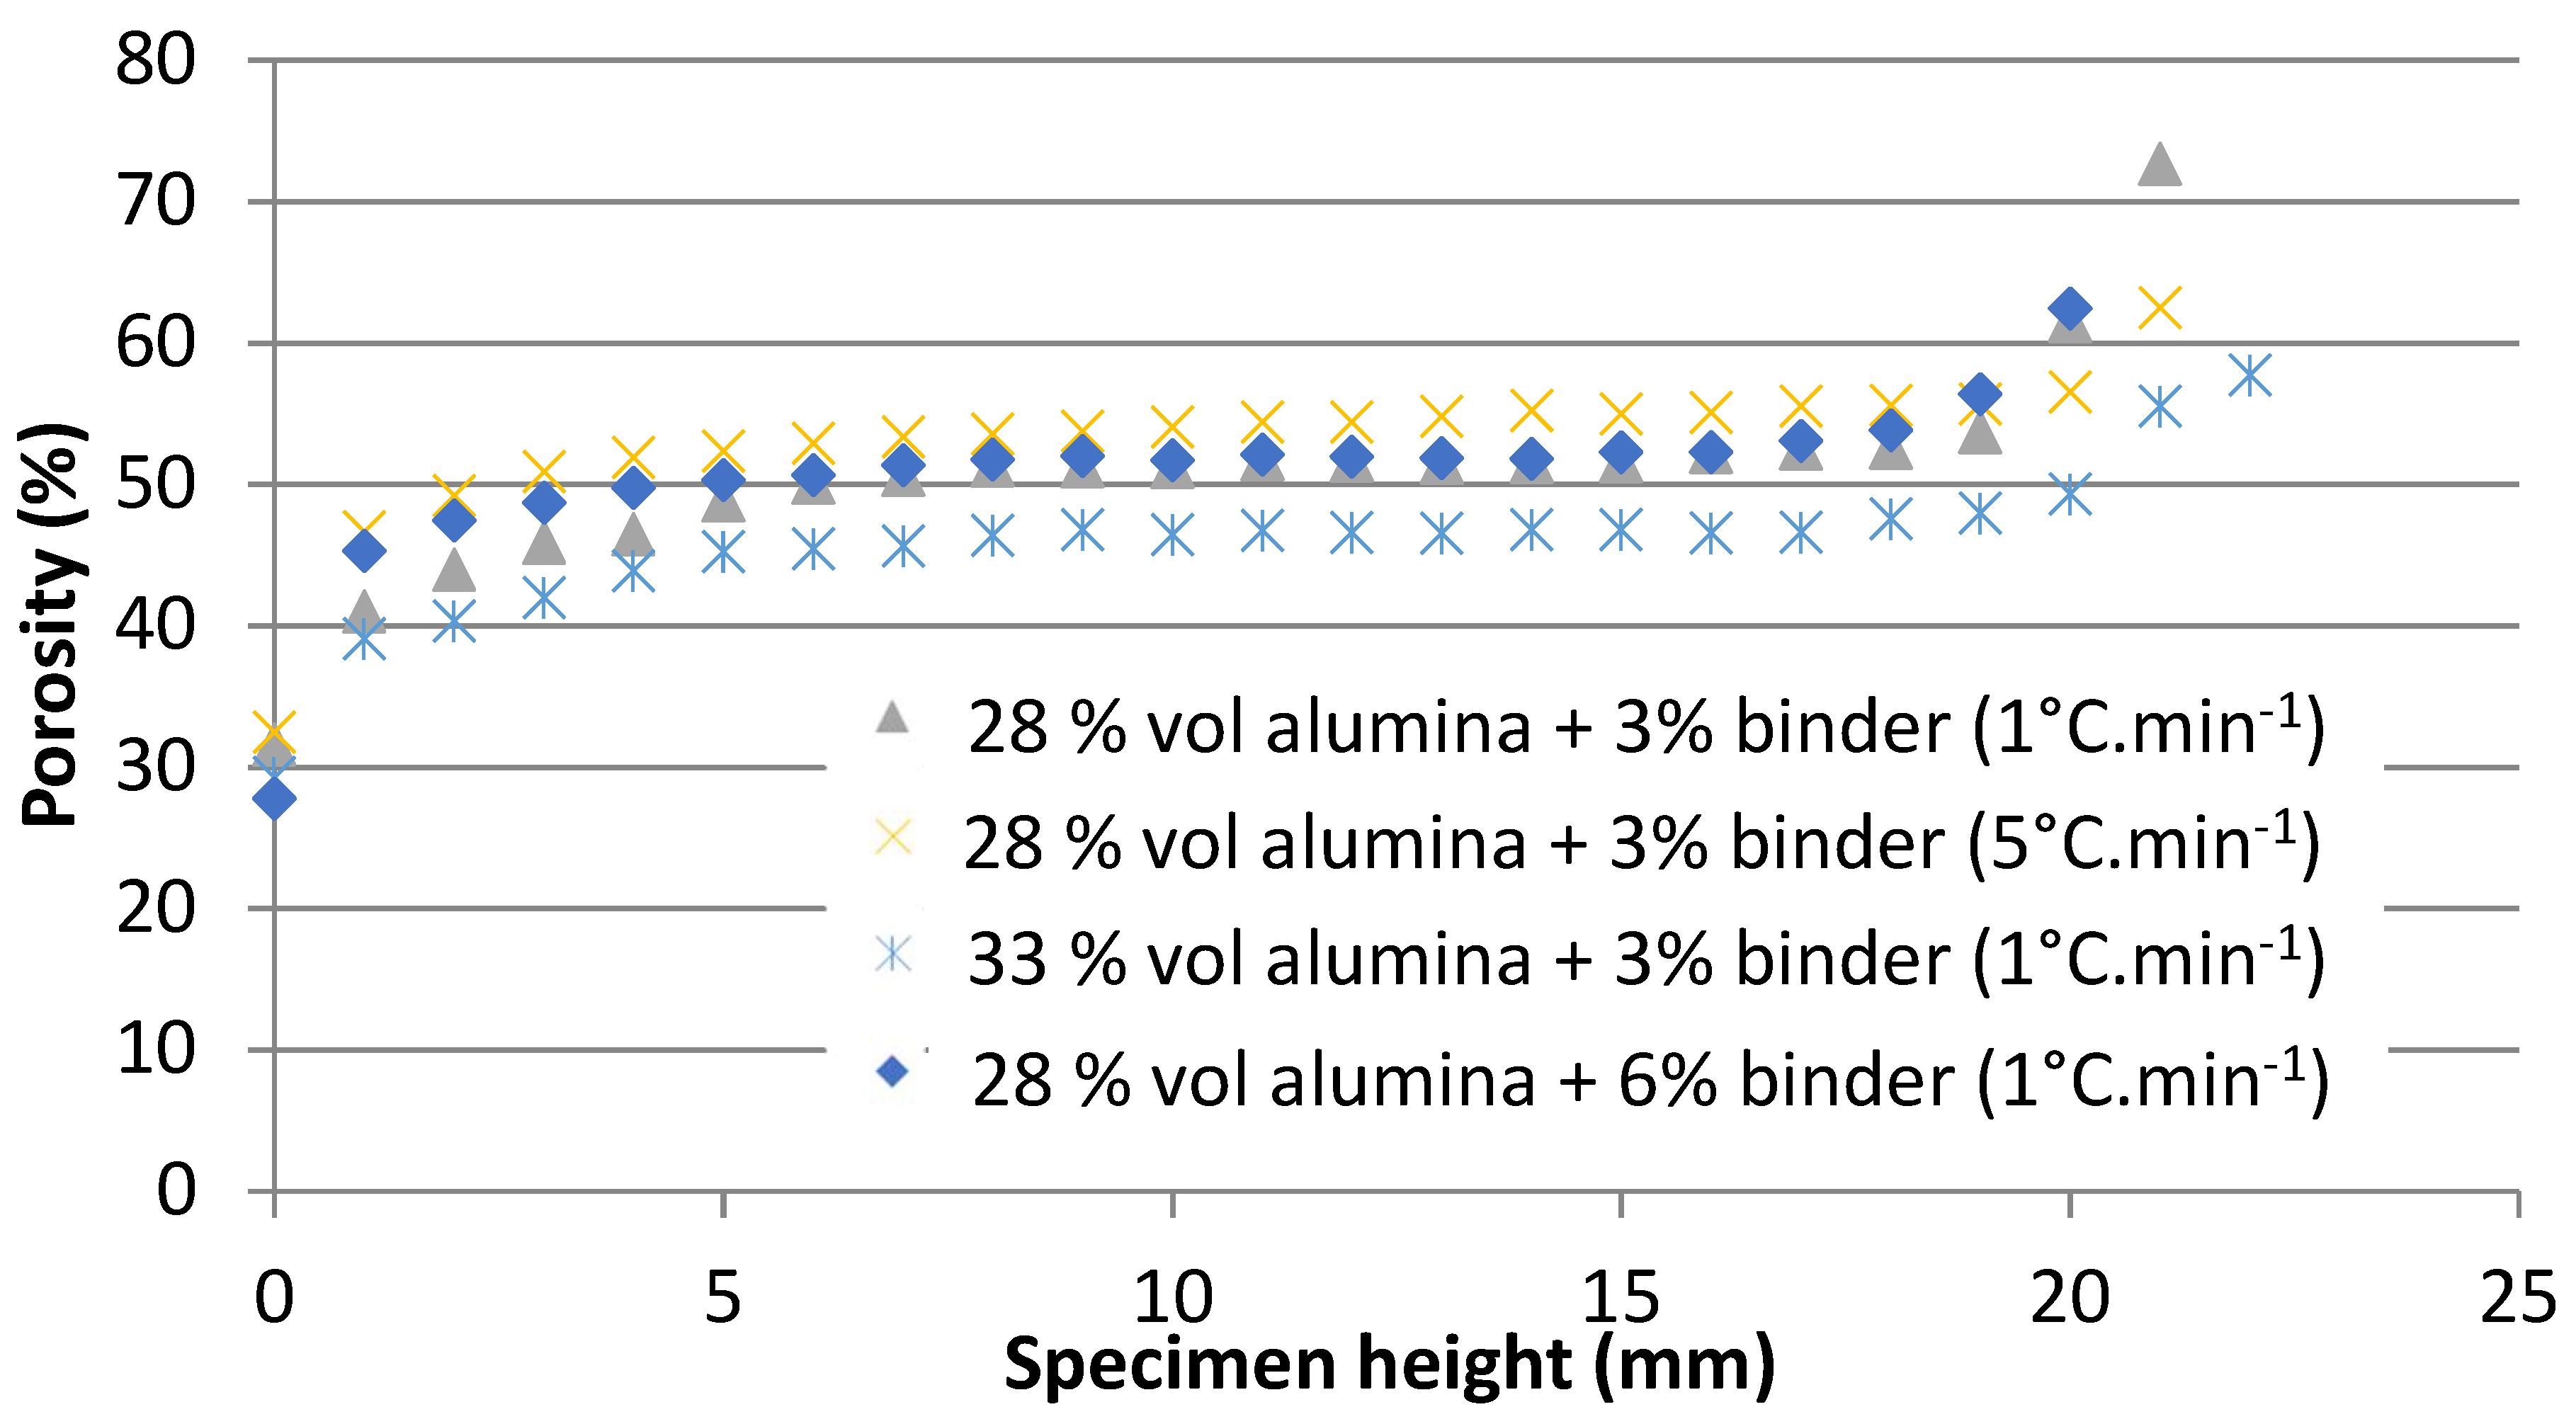
- A porosity gradient through the height of the specimen of about 40% between the bottom and top part of the specimen, which was determined by X-ray radiography.
- -
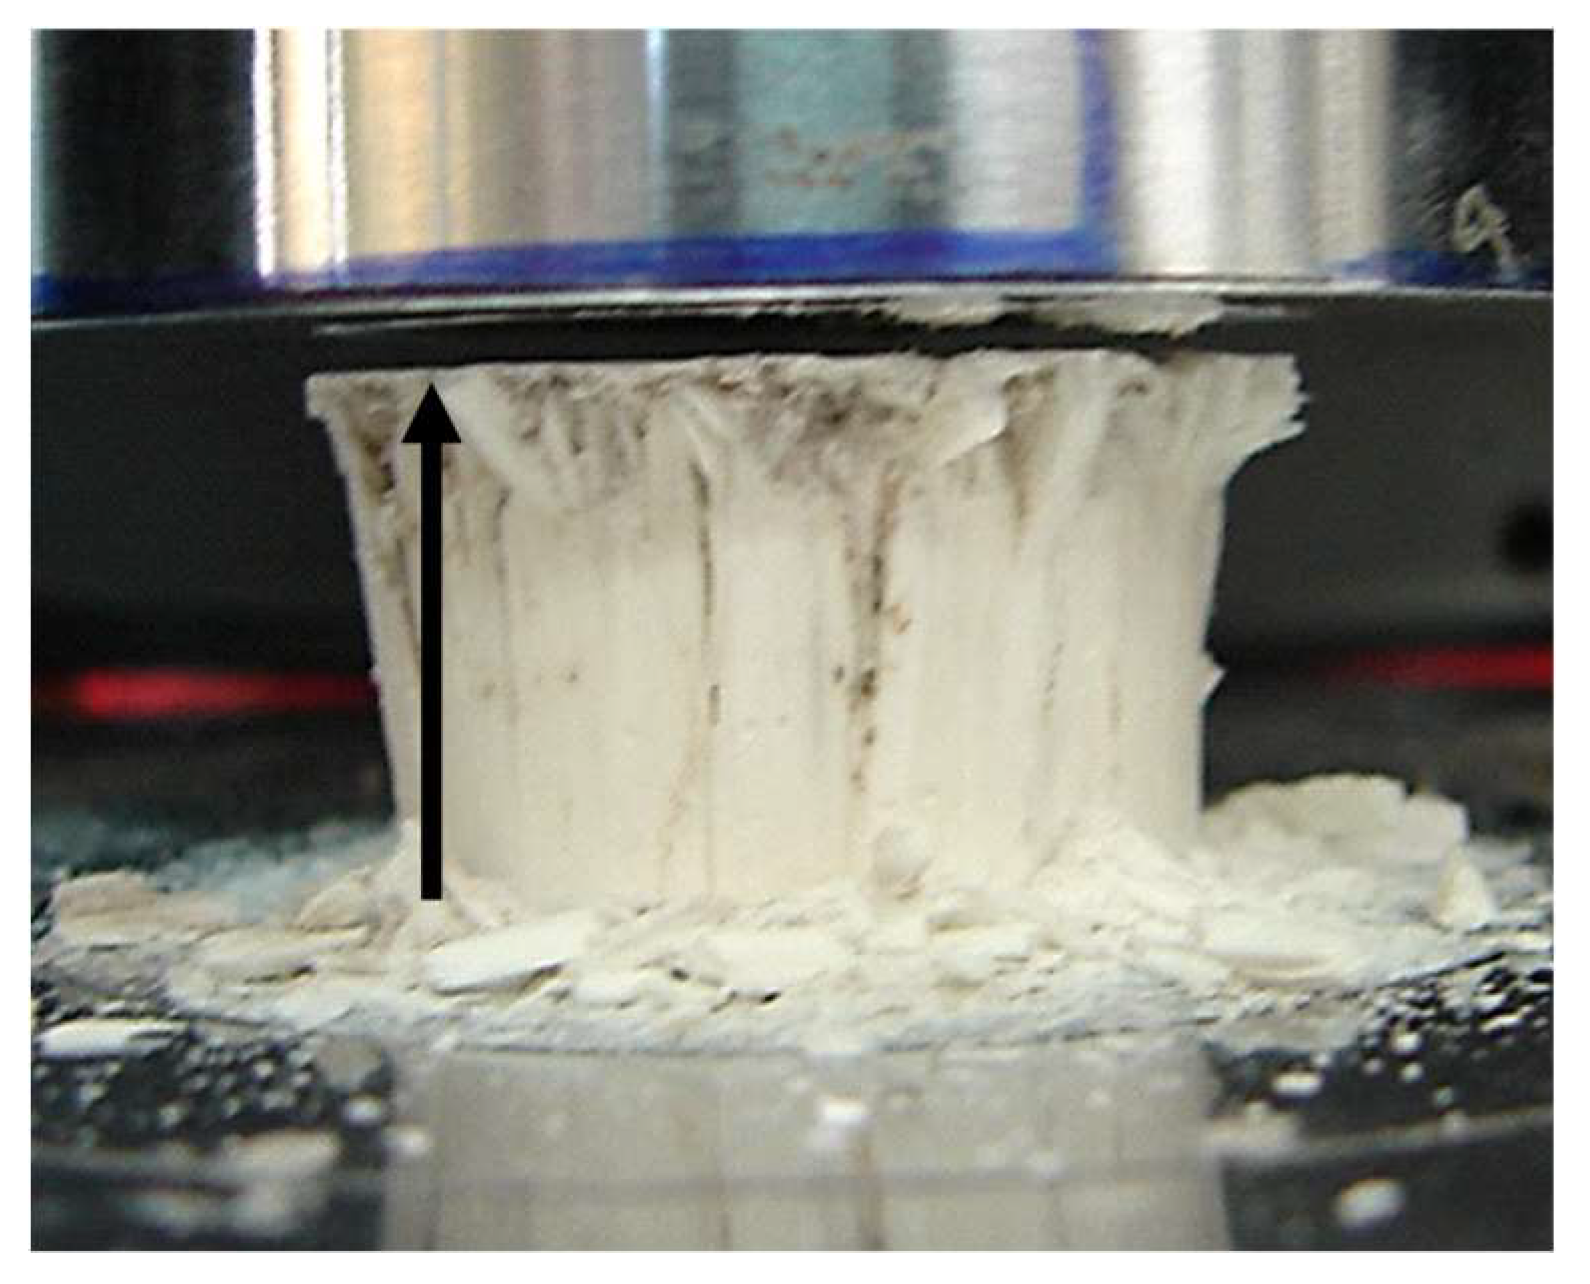
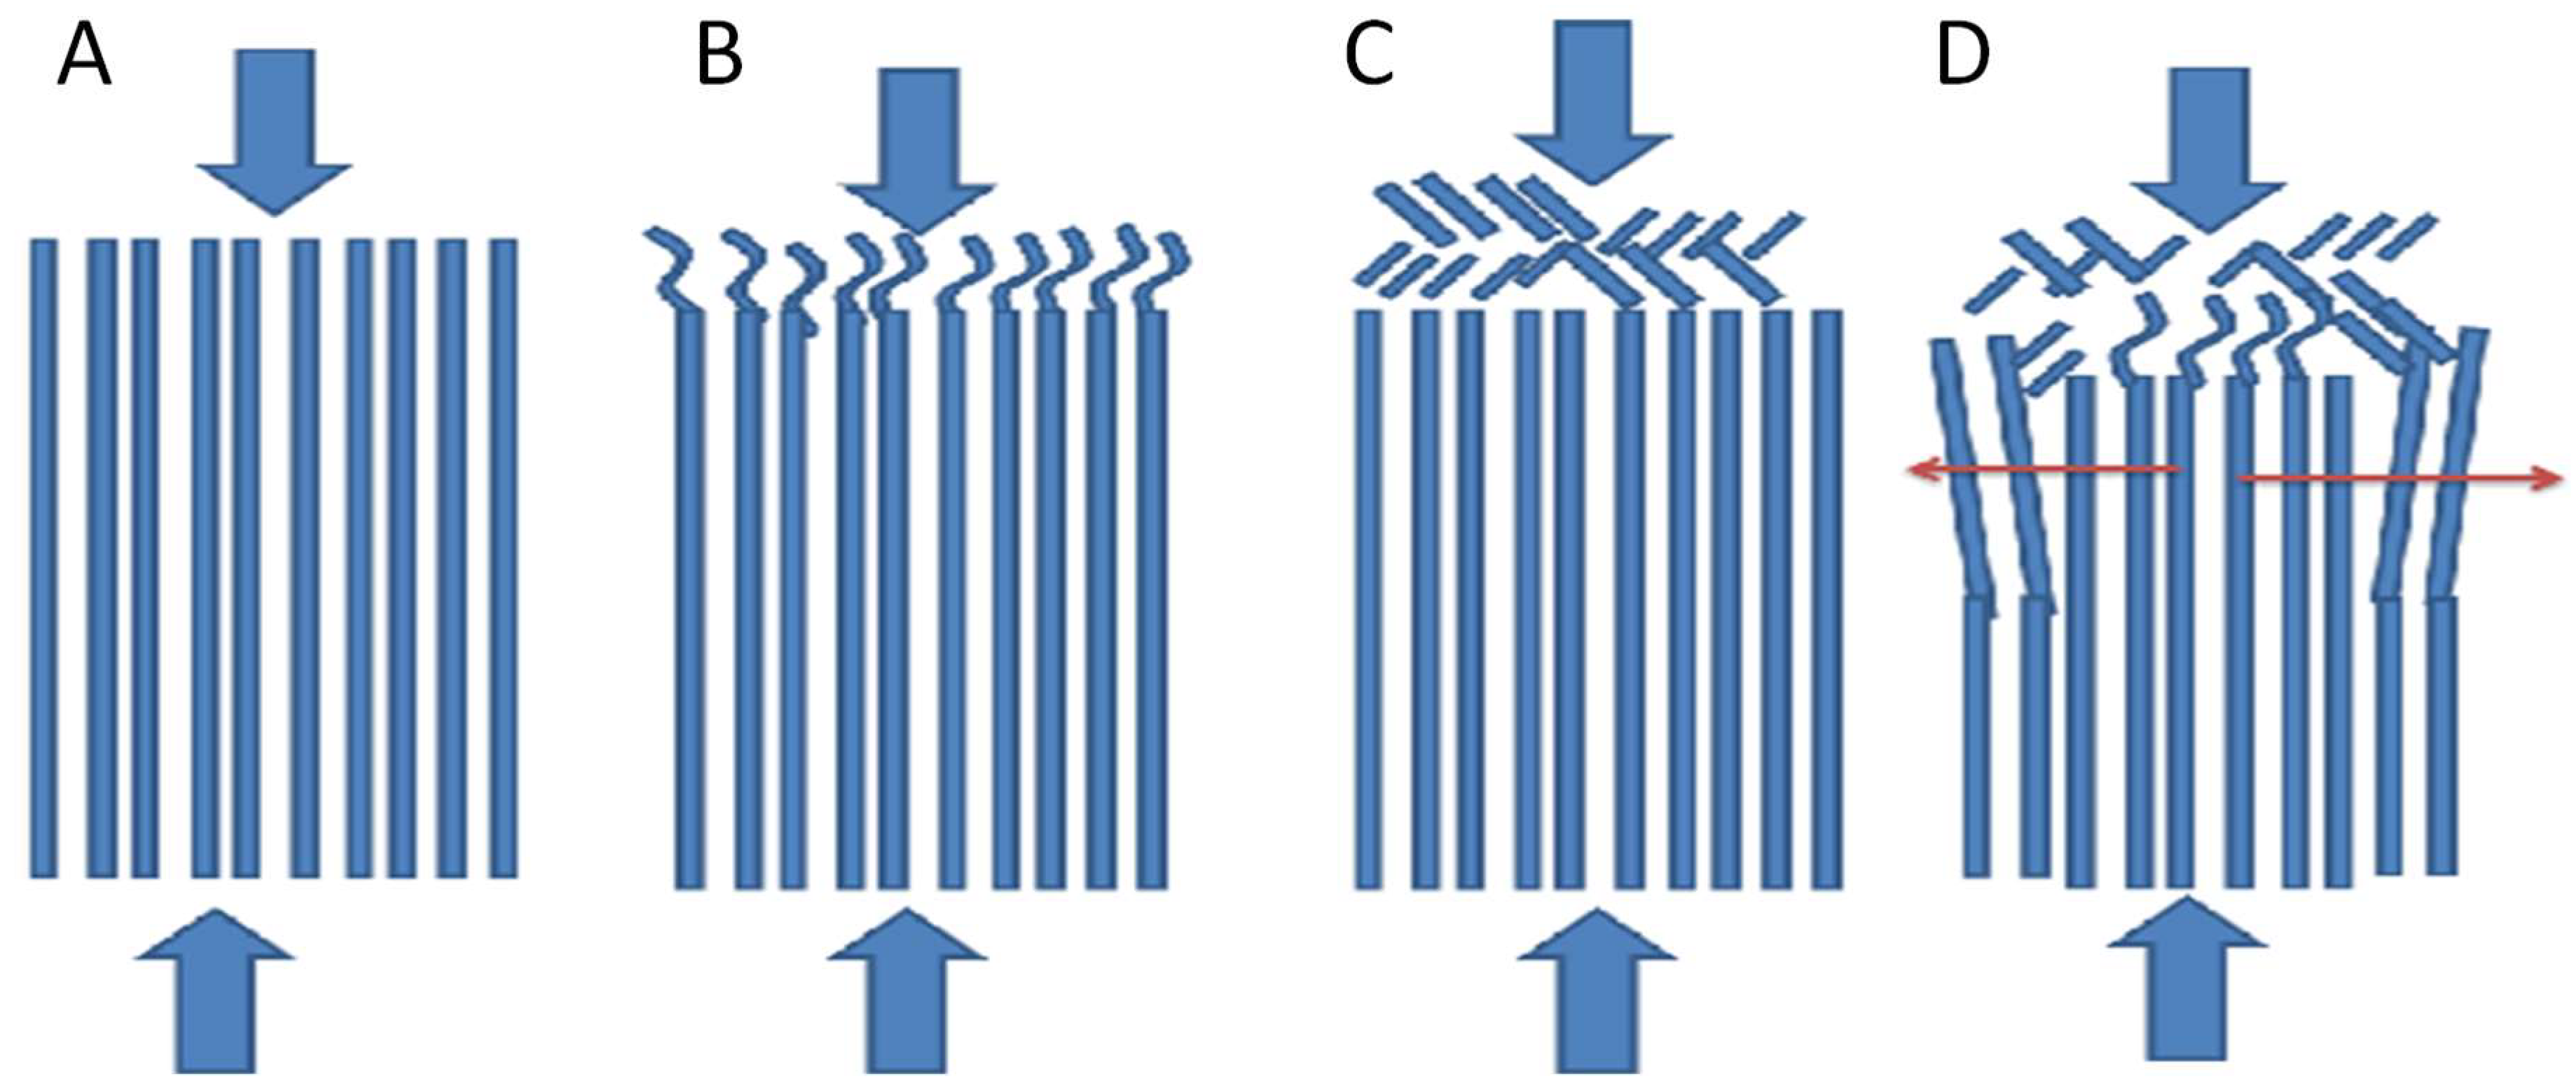
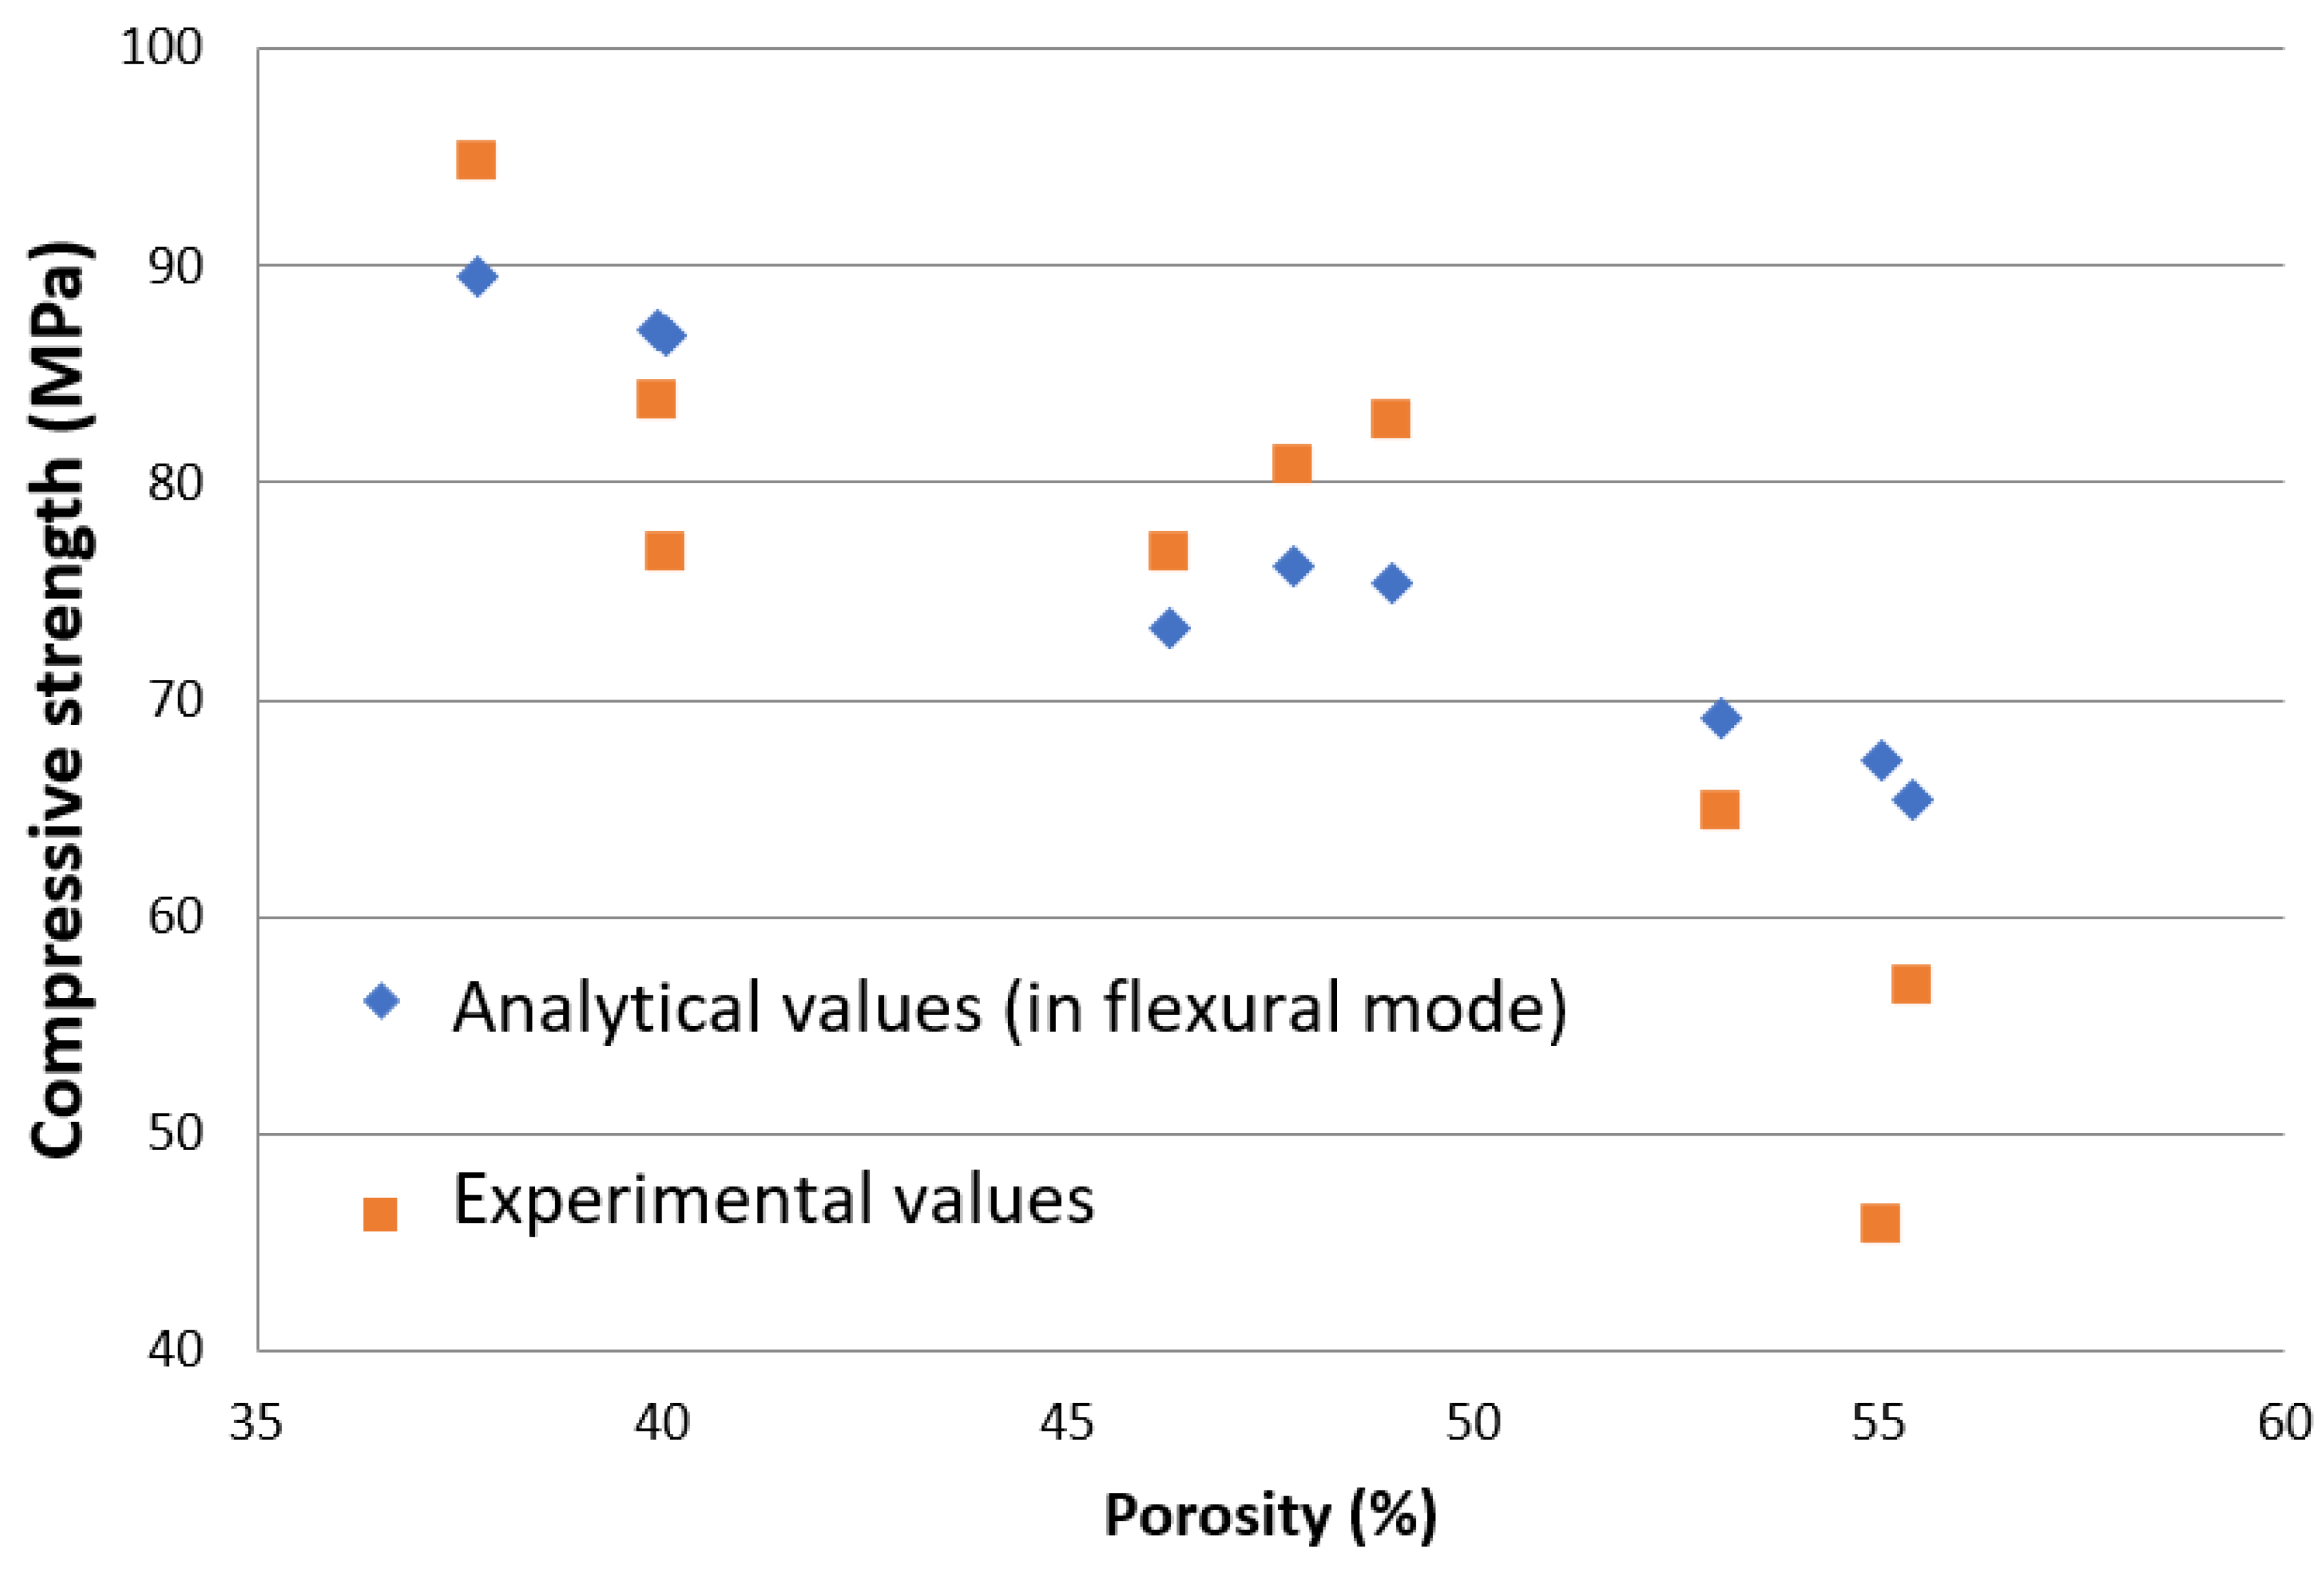
- The flexural rupture mode of the lamellae during the compressive test.
Author Contributions
Funding
Acknowledgments
Conflicts of Interest
References
- Xing, Z.; Li, J.; Wang, Q.; Zhou, W.; Tian, G.; Pan, K.; Tian, C.; Zou, J.; Fu, H. A Floating Porous Crystalline TiO2 Ceramic with Enhanced Photocatalytic Performance for Wastewater Decontamination. Eur. J. Inorg. Chem. 2013, 13, 2411–2417. [Google Scholar] [CrossRef]
- Meurice, E.; Bouchart, F.; Hornez, J.C.; Leriche, A.; Hautcoeur, D.; Lardot, V.; Cambier, F.; Fernandes, M.H.; Monteiro, F. Osteoblastic cells colonization inside beta-TCP macroporous structures obtained by ice-templating. J. Eur. Ceram. Soc. 2016, 36, 2895–2901. [Google Scholar] [CrossRef]
- Guo, R.; Wang, C.A.; Yang, A. Effects of pore size and orientation on dielectric and piezoelectric properties of 1–3 type porous PZT ceramics. J. Eur. Ceram. Soc. 2011, 31, 605–609. [Google Scholar] [CrossRef]
- Kouras, N.; Harabi, A.; Bouzerara, F.; Foughal, L.; Policicchio, A.; Stelitano, S.; Galiano, F.; Figoli, A. Macro-porous ceramic support for membranes prepared from quartz sand and calcite mixtures. J. Eur. Ceram. Soc. 2017, 37, 3159–3165. [Google Scholar] [CrossRef]
- Nait-ali, B.; Haberko, K.; Vesteghem, H.; Absi, J.; Smith, D.S. Thermal conductivity of highly porous zirconia. J. Eur. Ceram. Soc. 2006, 26, 3567–3574. [Google Scholar] [CrossRef]
- Chen, Y.; Bunch, J.; Li, T.; Mao, Z.; Chen, F. Novel functionally graded acicular electrode for solid oxide cells fabricated by the freeze-tape-casting process. J. Power Sources 2012, 213, 93–99. [Google Scholar] [CrossRef]
- Ziegler, T.; Neubrand, A.; Piat, R. Multiscale homogenization models for the elastic behaviour of metal/ceramic composites with lamellar domains. Compos. Sci. Technol. 2010, 70, 664–670. [Google Scholar] [CrossRef] [Green Version]
- Colombo, P. Ceramic Foams: Fabrication, Properties, and Applications. Key Eng. Mater. 2002, 206–213, 1913–1918. [Google Scholar] [CrossRef]
- Nakazawa, H.; Yamada, H.; Fujita, T.; Ito, Y. Texture control of clay-aerogel through the crystallization process of ice. Clay Sci. 1987, 6, 269–276. [Google Scholar]
- Deville, S. Freeze casting of porous ceramics: A review of current achievements and issues. Adv. Eng. Mater. 2008, 10, 155–169. [Google Scholar] [CrossRef]
- Waschkies, T.; Oberacker, R.; Hoffmann, M.J. Control of Lamellae Spacing During Freeze Casting of Ceramics Using Double-Side Cooling as a Novel Processing Route. J. Am. Ceram. Soc. 2006, 92, S79–S84. [Google Scholar] [CrossRef]
- De Marcos, A.; Nait-Ali, B.; Tessier-Doyen, N.; Alzina, A.; Pagnoux, C.; Peyratout, C.S. Influence of the ice front velocity and of the composition of suspensions on thermal properties of bentonite materials prepared using freeze-casting process. J. Eur. Ceram. Soc. 2014, 34, 4433–4441. [Google Scholar] [CrossRef]
- Sellinger, A.; Weiss, P.M.; Nguyen, A.; Lu, Y.; Assink, R.A.; Gong, W.; Brinker, C.J. Continuous self-assembly of organic–inorganic nanocomposite coatings that mimic nacre. Nature 1998, 394, 256–260. [Google Scholar] [CrossRef]
- Munch, E.; Franco, J.; Deville, S.; Hunger, P.; Saiz, E.; Tomsia, A.P. Porous Ceramic Scaffolds with Complex Architectures. JOM 2008, 60, 54–58. [Google Scholar] [CrossRef]
- Hunger, P.M.; Donius, A.E.; Wegst, U.G.K. Platelets Self-assemble into Porous Nacre during Freeze Casting. J. Mech. Behav. Biomed. 2013, 19, 87–93. [Google Scholar] [CrossRef] [PubMed]
- Hu, L.; Zhang, Y.; Dong, S.; Zhang, S.; Li, B. In situ growth of hydroxyapatite on lamellar alumina scaffolds with aligned pore channels. Ceram. Int. 2013, 39, 6287–6291. [Google Scholar] [CrossRef]
- Hunger, P.M.; Donius, A.E.; Wegst, U.G.K. Structure–property-processing correlations in freeze-cast composite scaffolds. Acta Biomater. 2013, 9, 6338–6348. [Google Scholar] [CrossRef] [PubMed]
- Zuo, K.H.; Zeng, Y.-P.; Jiang, D. Properties of Microstructure-Controllable Porous Yttria-Stabilized Ziroconia Ceramics Fabricated by Freeze Casting. Int. J. Appl. Ceram. Technol. 2008, 5, 198–203. [Google Scholar] [CrossRef] [Green Version]
- Li, Z.; Zhang, Y.; Zhang, D.; Zhang, X.; Zhou, K. Porous hydroxyapatite ceramics fabricated by an ice-templating method. Scr. Mater. 2011, 64, 426–429. [Google Scholar]
- Zhao, K.; Tang, Y.-F.; Qin, Y.-S.; Wei, J.-Q. Porous hydroxyapatite ceramics by ice templating: Freezing characteristics and mechanical properties. Ceram. Int. 2011, 37, 635–639. [Google Scholar] [CrossRef]
- Hong, C.; Zhang, X.; Han, J.; Du, J.; Zhang, W. Camphene-based freeze-cast ZrO2 foam with high compressive strength. Mater. Chem. Phys. 2010, 119, 359–362. [Google Scholar] [CrossRef]
- Fu, Q.; Rahaman, M.N.; Dogan, F.; Bal, B.S. Freeze Casting of Porous Hydroxyapatite Scaffolds. I. Processing and General Microstructure. J. Biomed. Mater. Res. B 2007, 86, 125–135. [Google Scholar] [CrossRef] [PubMed]
- Fu, Q.; Rahaman, M.N.; Dogan, F.; Bal, B.S. Freeze Casting of Porous Hydroxyapatite Scaffolds. II. Sintering, Microstructure, and Mechanical Behavior. J. Biomed. Mater. Res. B 2007, 86, 514–522. [Google Scholar] [CrossRef] [PubMed]
- Seuba, J.; Deville, S.; Guizard, C.; Stevenson, A.J. Mechanical properties and failure behavior of unidirectional porous ceramics. Sci. Rep. 2016, 6, 24326. [Google Scholar] [CrossRef] [PubMed] [Green Version]
- Zhang, J.; Ashby, M.F. The Out-of-Plane Properties of Honeycombs. Int. J. Mech. Sci. 1992, 34, 475–489. [Google Scholar] [CrossRef]
- Hautcoeur, D.; Lorgouilloux, Y.; Leriche, A.; Gonon, M.; Nait-Ali, B.; Smith, D.S.; Lardot, V.; Cambier, F. Thermal conductivity of ceramic/metal composites from preforms produced by freeze casting. Ceram. Int. 2016, 42, 14077–14085. [Google Scholar] [CrossRef]
- Li, J.-C.; Dunand, D.-C. Mechanical properties of directionally freeze-cast titanium foams. Acta Mater. 2011, 59, 146–158. [Google Scholar] [CrossRef]
- Shanti, N.O.; Araki, K.; Halloran, J.W. Particle Redistribution during Dendritic Solidification of Particle Suspensions. J. Am. Ceram. Soc. 2006, 89, 2444–2447. [Google Scholar] [CrossRef]
- Fukasawa, T.; Ando, M. Synthesis of Porous Ceramics with Complex Pore Structure by Freeze-Dry Processing. J. Am. Ceram. Soc. 2001, 84, 230–232. [Google Scholar] [CrossRef]
- Fukushima, M.; Nakata, M.; Yoshizawa, Y. Fabrication and properties of ultra-highly porous cordierite with oriented micrometer-sized cylindrical pores by gelation and freezing method. J. Ceram. Soc. Jpn. 2008, 116, 1322–1325. [Google Scholar] [CrossRef]
- Deville, S.; Maire, E.; Lasalle, A.; Bogner, A.; Gauthier, C.; Leloup, J.; Guizard, C. Metastable and unstable cellular solidification of colloidal suspensions. Nat. Mater. 2009, 8, 966–974. [Google Scholar] [CrossRef] [PubMed]
- Lasalle, A.; Guizard, C.; Maire, E.; Adrien, J.; Deville, S. Particle redistribution and structural defect development during ice templating. Acta Mater. 2012, 60, 4594–4603. [Google Scholar] [CrossRef] [Green Version]
- Deville, S.; Saiz, E.; Tomsia, A.P. Freeze casting of hydroxyapatite scaffolds for bone tissue engineering. Biomaterials 2006, 27, 5480–5489. [Google Scholar] [CrossRef] [PubMed] [Green Version]
- Pekor, C.M.; Kisa, P.; Nettleship, I. Effect of Polyethylene Glycol on the Microstructure of Freeze-Cast Alumina. J. Am. Ceram. Soc. 2008, 91, 3185–3190. [Google Scholar] [CrossRef]
- Ananth, R.; Gill, W.N. Dendritic growth of an elliptical paraboloid with forced convection in the melt. J. Fluid Mech. 1989, 208, 575–593. [Google Scholar] [CrossRef]
- Zuo, K.H.; Zeng, Y.-P.; Jiang, D. Effect of polyvinyl alcohol additive on the pore structure and morphology of the freeze-cast hydroxyapatite ceramics. Mater. Sci. Eng. C 2010, 30, 283–287. [Google Scholar] [CrossRef]
- Sofie, S.W. Fabrication of Functionally Graded and Aligned Porosity in Thin Ceramic Substrates with the Novel Freeze–Tape-Casting Process. J. Am. Ceram. Soc. 2007, 90, 2024–2031. [Google Scholar] [CrossRef]
- Liu, G.; Zhang, D.; Meggs, C.; Button, T.W. Porous Al2O3–ZrO2 composites fabricated by an ice template method. Scripta Mater. 2010, 62, 466–468. [Google Scholar] [CrossRef]
- Gang, L. Fabrication of Porous Ceramics and Composites by a Novel Freeze Casting Process. Ph.D. Thesis, University of Birmingham, Birmingham, UK, March 2011. [Google Scholar]
- Deville, S.; Maire, E.; Lasalle, A.; Bogner, A.; Gauthier, C.; Leloup, J.; Guizard, C. In Situ X-ray Radiography and Tomography Observations of the Solidification of Aqueous Alumina Particle Suspensions—Part I: Initial Instants. J. Am. Ceram. Soc. 2009, 92, 2489–2496. [Google Scholar] [CrossRef]


| Specimen | Alumina Content (vol. %) | Binder Content (wt. %) | Freezing Rate (K·min−1) | Pore Size (µm) | Lamellar Thickness (µm) | Bulk Density (g·cm−3) | Total Porosity (%) | |
|---|---|---|---|---|---|---|---|---|
| Minor Axis | Major Axis | |||||||
| 28/0/1 | 28 | 0 | 1 | 40 ± 12 | 300 ± 130 | 35 ± 11 | 3.94 ± 0.01 | 57 ± 1 |
| 28/3/1 | 28 | 3 | 1 | 40 ± 7 | 300 ± 100 | 41 ± 15 | 3.95 ± 0.01 | 55 ± 1 |
| 28/3/5 | 28 | 3 | 5 | 28 ± 7 | 190 ± 100 | 30 ± 8 | 3.97 ± 0.01 | 56 ± 1 |
| 28/3/20 | 28 | 3 | 20 | 6 ± 2 | 13 ± 5 | 3 ± 1 | 3.97 ± 0.01 | 54 ± 1 |
| 28/6/1 | 28 | 6 | 1 | 42 ± 15 | 150 ± 100 | 35 ± 15 | 3.96 ± 0.01 | 44 ± 1 |
| 33/0/20 | 33 | 0 | 20 | 13 ± 3 | 100 ± 70 | 20 ± 71 | 3.97 ± 0.01 | 44 ± 1 |
| 33/3/1 | 33 | 3 | 1 | 40 ± 12 | 250 ± 100 | 36 ± 11 | 3.97 ± 0.01 | 40 ± 1 |
| 33/6/1 | 33 | 6 | 1 | 34 ± 9 | 200 ± 200 | 33 ± 12 | 3.96 ± 0.01 | 44 ± 1 |
| Specimen | Apparent Compressive Strength (MPa) | Apparent Elastic Modulus (GPa) |
|---|---|---|
| 28/0/1 | 6 ± 1 | 0.2 ± 0.1 |
| 28/3/1 | 56 ± 9 | 3 ± 1 |
| 28/3/5 | 55 ± 3 | 2 ± 1 |
| 28/3/20 | 111 ± 9 | 6 ± 1 |
| 28/6/1 | 88 ± 8 | 7 ± 2 |
| 33/3/1 | 80 ± 5 | 14 ± 1 |
| Specimen | Wall Porosity Pµ (%) | Microporosity PM (%) |
|---|---|---|
| 28/3/1 | 14 ± 1 | ~6 |
| 30/3/1 | 13 ± 1 | ~6 |
| 33/3/1 | 7.7 ± 0.4 | ~5 |
© 2018 by the authors. Licensee MDPI, Basel, Switzerland. This article is an open access article distributed under the terms and conditions of the Creative Commons Attribution (CC BY) license (http://creativecommons.org/licenses/by/4.0/).
Share and Cite
Hautcoeur, D.; Gonon, M.; Baudin, C.; Lardot, V.; Leriche, A.; Cambier, F. Alumina Porous Ceramics Obtained by Freeze Casting: Structure and Mechanical Behaviour under Compression. Ceramics 2018, 1, 83-97. https://doi.org/10.3390/ceramics1010008
Hautcoeur D, Gonon M, Baudin C, Lardot V, Leriche A, Cambier F. Alumina Porous Ceramics Obtained by Freeze Casting: Structure and Mechanical Behaviour under Compression. Ceramics. 2018; 1(1):83-97. https://doi.org/10.3390/ceramics1010008
Chicago/Turabian StyleHautcoeur, Dominique, Maurice Gonon, Carmen Baudin, Véronique Lardot, Anne Leriche, and Francis Cambier. 2018. "Alumina Porous Ceramics Obtained by Freeze Casting: Structure and Mechanical Behaviour under Compression" Ceramics 1, no. 1: 83-97. https://doi.org/10.3390/ceramics1010008