Switching on the Big Burn of 2017
by
 , , , and
Jennifer K. Balch
1,2,*, 
Tania Schoennagel
2,3,
A. Park Williams
4,
John T. Abatzoglou
5,
Megan E. Cattau
1,
Nathan P. Mietkiewicz
1 and
Lise A. St. Denis
1 1
Earth Lab, Cooperative Institute for Research in Environmental Sciences (CIRES), University of Colorado Boulder, Boulder, CO 80309, USA
2
Department of Geography, University of Colorado Boulder, Boulder, CO 80309, USA
3
Institute of Arctic and Alpine Research (INSTAAR), University of Colorado Boulder, Boulder, CO 80309, USA
4
Lamont-Doherty Earth Observatory, Columbia University, Palisades, NY 10964, USA
5
Department of Geography, University of Idaho, Moscow, ID 83844, USA
*
Author to whom correspondence should be addressed.
Fire 2018, 1(1), 17; https://doi.org/10.3390/fire1010017
Submission received: 11 May 2018
/
Revised: 29 May 2018
/
Accepted: 30 May 2018
/
Published: 5 June 2018
Abstract
:Fuel, aridity, and ignition switches were all on in 2017, making it one of the largest and costliest wildfire years in the United States (U.S.) since national reporting began. Anthropogenic climate change helped flip on some of these switches rapidly in 2017, and kept them on for longer than usual. Anthropogenic changes to the fire environment will increase the likelihood of such record wildfire years in the coming decades. The 2017 wildfires in the U.S. constitute part of a shifting baseline in risks and costs; meanwhile, effective policies have lagged behind, leaving communities highly vulnerable. Policy efforts to build better and burn better, in the U.S. as well as in other nations with flammable ecosystems, will promote adaptation to increasing wildfire in a warming world.
1. What Happened during the 2017 Wildfire Season?
In 2017, the United States (U.S.) experienced its costliest wildfire season ever, with damages exceeding $18 billion, and its third largest fire season—by area burned—in nearly 60 years [1]. This past year witnessed significant wildfire activity in the U.S., Canada, Russia, South America, and Europe. More than 71,000 wildfires in the U.S. consumed more than 40,000 km2 [1]—an area larger than Maryland—and destroyed or damaged more than 12,000 homes and structures. Parts of northern California and the Pacific Northwest had air pollution levels higher than anywhere else on Earth due to wildfires in the U.S. and Canada, and the smoke from these fires traveled across the whole country via the jet stream, affecting air quality thousands of kilometers away [2,3]. At least 200,000 Americans were forced to evacuate, and 66 people lost their lives in the fires or the subsequent mudslides created by denuded slopes.
This big burn of 2017 across the western U.S. (Figure 1) was surprising in that it occurred on the heels of a relatively wet winter and early spring, which typically precede unremarkable fire seasons. To understand the extraordinary turn of events—and how to develop policies to prepare for and prevent similar future disasters—it is important to recognize the underlying factors that produced this catastrophic fire season. In particular, we focus on three “switches” that all had to be in the on position to catalyze a major wildfire season: the ignition switch, the fuel switch, and the aridity switch [4]. In 2017, these switches were all on in the western U.S., and some flipped unusually rapidly and stayed on longer than expected.
Below, we detail how substantial regions of the western U.S. experienced the wettest winter followed by the warmest and driest periods in the observational record (Figure 1). These climate and weather extremes occurred against a backdrop of anthropogenic changes to the fire environment: substantial human-related ignitions, increased fuel loads from a century of fire suppression, climate change, and greater numbers of homes built in flammable landscapes. We then consider what policy switches we need to flip in response, particularly in light of an active 2018 fire season that is already underway in the U.S.
2. The Ignition Switch: In 2017, People Started 89% of Wildfires in the U.S.
Of the wildfires that occurred in the U.S. in 2017, 89% were started by people, burning more than 19,000 km2 (according to government reports executed 1 January 2018). Over the last two decades, people started 85%, 48%, and 53% of the wildfires in California, Oregon, and Montana, respectively [7]. Of the California wildfires that burned over 120 ha in 2017, there are 57 under investigation or with unknown or undetermined cause. Of these, 48 had no observed lightning cloud-ground strikes within five km and in the preceding seven days (National Lightning Detection Network) of the reported ignition location and time, including the most deadly, the most costly, and the largest wildfires (the Tubbs, Atlas, and Thomas fires). While officials make their final designations based on all of the available evidence, humans are the likely cause. Ignitions, mostly human-related, were able to start wildfires when the fuel and aridity switches were already on.
3. The Fuel Switch: An Extreme Wet Winter and Spring Produced Fine Fuels, Amidst a Historical Legacy of Large Fuels
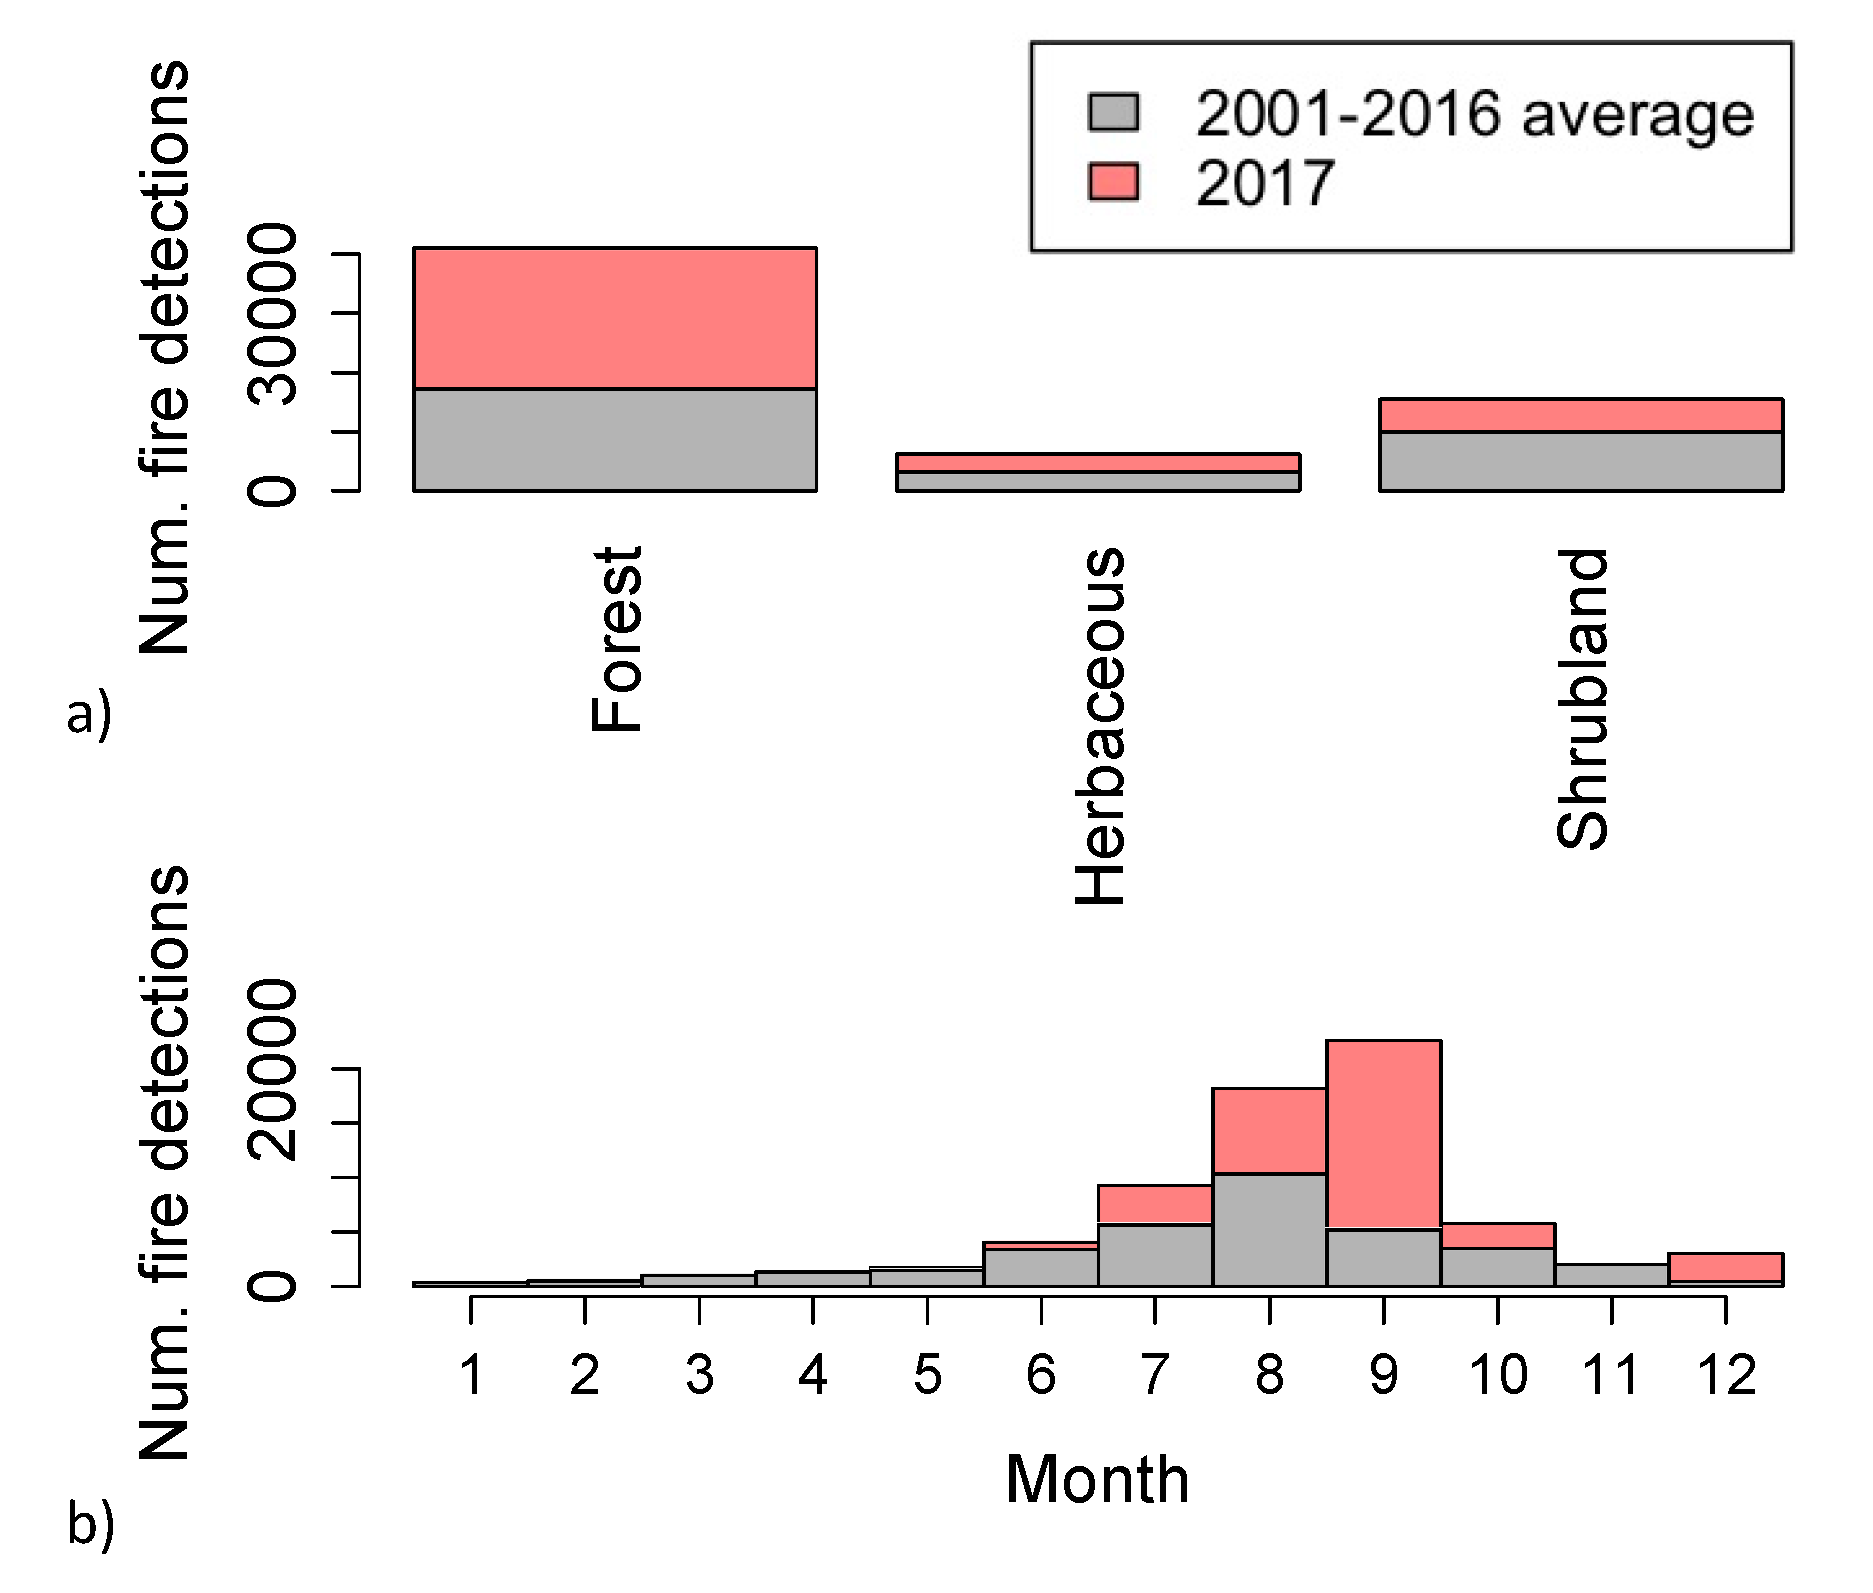
The 2017 fire season was preceded by above-average precipitation during October 2016 through April 2017 across nearly all of the western U.S. (Figure 2). Although it may appear counterintuitive that fires followed a wet winter and spring, cold-season precipitation promotes the growth of fine fuels that can burn during the succeeding warmer months, particularly in shrublands invaded with exotic grasses [8]. Western U.S. forests burned 2.4 times more in 2017, compared with the average for 2001–2016, according to MODIS active fire detections [9] (Figure 3a). Grasslands and shrublands respectively burned two times and 1.6 times more than the average for the previous 16 years (Figure 3a). Further, fire suppression and exclusion in many regions, particularly dry, lower-elevation forests, has increased tree density and fuel loads, resulting in greater fire severity and size [10]. More housing in wildland areas [11] has also made it increasingly difficult to deal with fuels near homes [12] through thinning, treating, or prescribed burns, for a host of reasons that include: variations in perceived wildfire risk, the difficulty and expense of removing and disposing of fuels, concerns about degradation of environmental amenities, and smoke impacts.
4. The Aridity Switch: 2017 Had an Extremely Hot and Dry Summer and Fall
After an extremely wet winter and spring in 2017, portions of the western U.S. experienced among the warmest May–September and driest September–December periods on record (Figure 2). This dried out fuels. In Pacific Northwest forests, abnormal heat in late spring and summer of 2017 led to substantial burning during July and August, and in conjunction with smoke from wildfires, burning in adjacent British Columbia contributed to poor air quality across the region. In the grass and chaparral-dominated areas of coastal California, a fourth switch [4] was turned on that made for extreme fire weather conditions: high winds. The easterly wind events that drove fire spread in October and December in coastal California were particularly strong and persistent, but their timing was not abnormal. Further, the late onset of fall rains left abundant, very dry fuels ready to burn in high winds. The sequence of a wet winter and spring followed by a hot summer and a hot, dry, and windy fall presented a perfect recipe for fire. In the Bay Area, where fires raged in October, the first substantial rain did not occur until 4 November; in contrast, the average onset in San Francisco is 15 October (defined as the mean first date of substantial daily precipitation accumulation (>6.35 mm) after 1 August between 1981–2010). In Southern California, where the Thomas fire burned through December, the first substantial rain did not fall until 8 January; the average onset in Los Angeles is 21 October (defined as above). At the scale of the western U.S., peak fire activity occurred a month later, in September, whereas in the previous 15 years (2001–2016), the average peak occurred in August (Figure 3b).
5. Anthropogenic Climate Change Likely Made the 2017 Wildfire Season Worse, but Natural Variability Played a Key Role
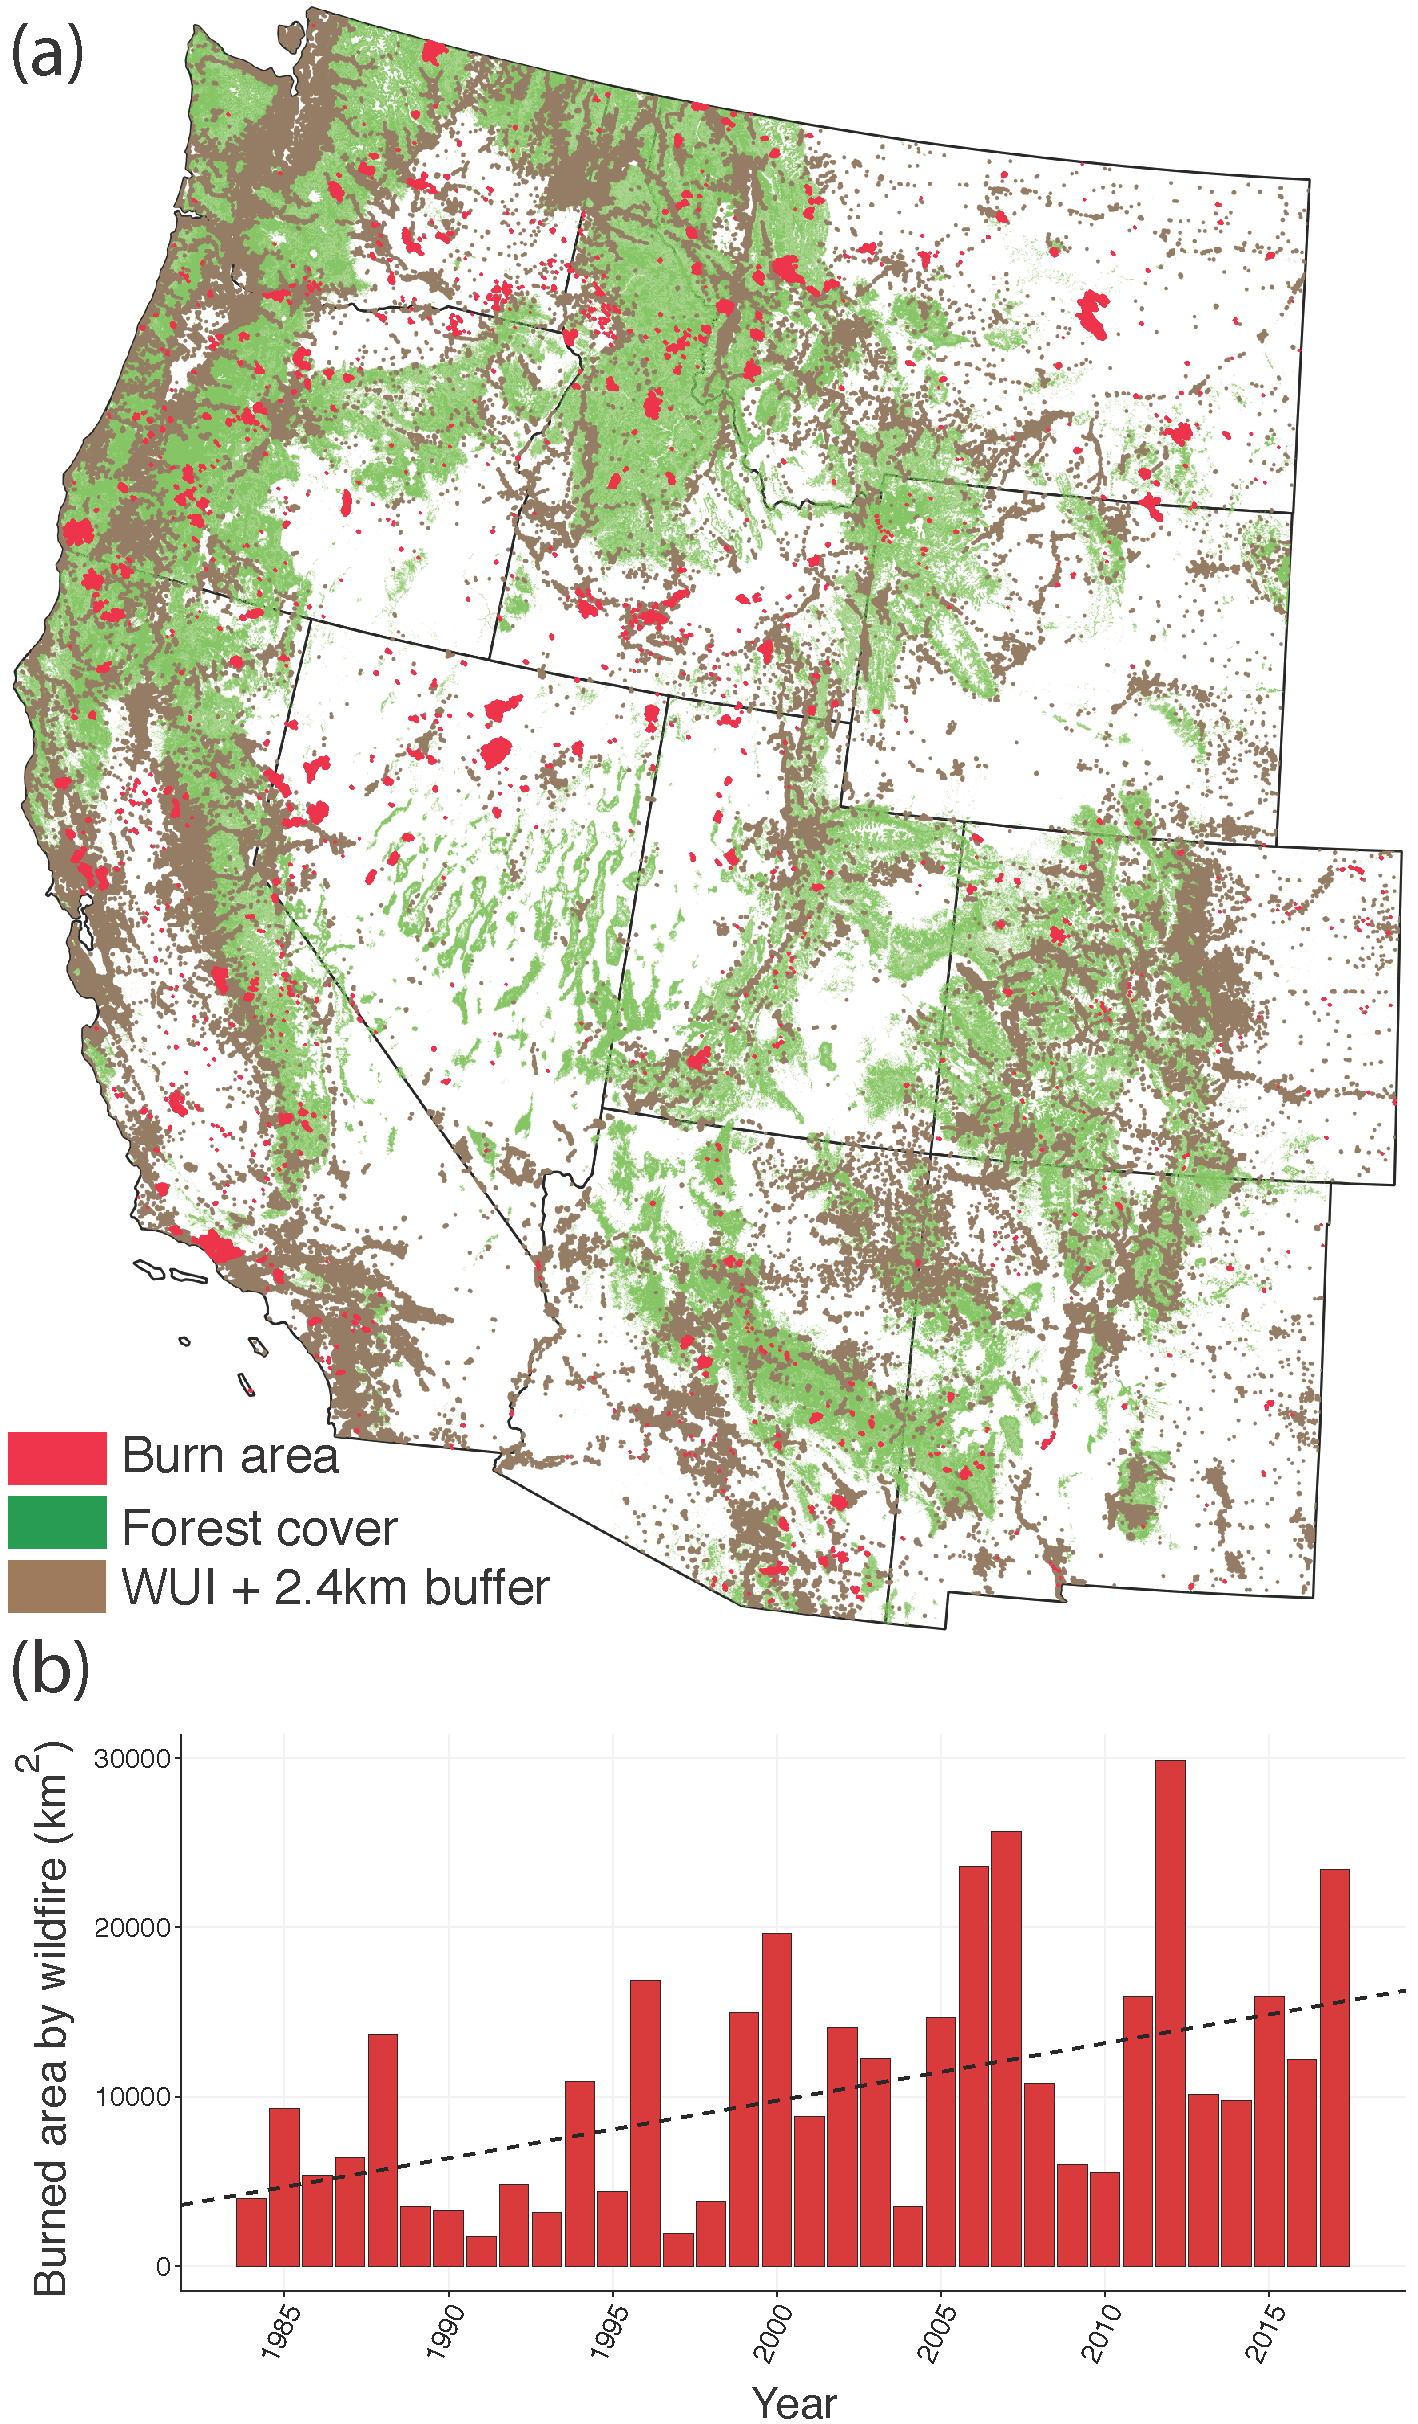
Anthropogenic climate change helped to flip on the aridity switch. Globally, 2017 was among the three warmest years on record. In the western U.S., 2017 was the fifth warmest year since 1895 and several states—including California, Oregon, and Montana—set seasonal records for how hot or dry they were [13]. In the western U.S., temperatures have increased by approximately 1.5 °C since the early 1900s, spring snowpack has declined [14], and fire season length has increased by almost three months [15]. As a consequence, and concurrent with other changes in the fire environment, area burned by large fires (>400 ha) in the western U.S. has increased substantially in the past several decades [16]: by over 350% across all of the ecoregions and by more than 1500% in forests (1984–2017), based on our updated calculations (Figure 1). Further, in western U.S. forests, the annual burned area is twice as large as expected in the absence of anthropogenic climate change [17].
Did anthropogenic climate change also promote the exceptionally wet winter of 2016–2017 that aided fuel growth in coastal California, the low summer precipitation totals in the Northwest U.S., the delayed onset of rains in California the following fall, or the strength and persistence of the easterly wind events that spread the coastal Californian fires in October and December?
Here is what we know from modeled simulations and observations of the effects of anthropogenic climate change on precipitation and winds:
- Models tend to project a decrease in fall precipitation in California, which may be interpreted as promoting a 2017-like delayed onset of cold-season rains [22], but no clear fall trends have yet emerged in the observed record; and
- There has been no trend in the frequency or intensity of Santa Ana wind events in coastal California since records began in the mid-1900s [23].
Observed and modeled trends do not combine to clearly implicate climate change effects on precipitation patterns or wind events in 2017 without a more rigorous detection and attribution effort [24]. What models do provide is a glimpse of future precipitation patterns: more frequent wet winters, lower snowpack, and drier summers and falls are predicted. The year 2017 demonstrates that a sequence of a wet winter followed by dry and windy conditions represents an ideal recipe for wildfire in much of the western U.S. While the precipitation and wind anomalies in 2017 were not definitively promoted by anthropogenic climate change, these events were all super-imposed on a warmer world that is capable of drying fuels more quickly.
6. U.S. Policy Opportunities to Build Better and Burn Better
The 2017 wildfires constitute part of a shifting baseline in risks and costs that firefighters, policymakers, and scientists have acknowledged, but effective policies lag behind, leaving communities highly vulnerable [25]. Recent legislative efforts in the U.S. address some of the policy needs that the 2017 wildfire season exposed, but do not adequately address the fundamental issue of how to sustainably live in increasingly flammable landscapes.
Some of the lessons from 2017 are that we need better wildfire prediction and warning systems. For example, seasonal fire outlooks developed in the late spring of 2017 were for relatively mild fire activity across most of the western U.S., and inadequately predicted the severity of warm, dry conditions that led to the rapid dry-down of fuels. Furthermore, the fatalities from the California wildfires were related, in part, to how quickly the wind-driven fires moved and how a warning and evacuation system did not keep pace. In response, the U.S. Senate introduced the Wildfire Management Technology Advancement Act of 2018 to directly address some of the needs that 2017 exposed. The legislation proposes, in part, to better utilize satellites and drones in fighting wildfires, help communities install systems to speed evacuations, and improve wildfire forecasting, smoke risk predictions, and warning systems.
Commensurate with the large area burned and protection of communities in the wildland–urban interface, the 2017 fire season generated the highest U.S. suppression bill ever at $2.9 billion (B). For the 2017 Thomas fire alone, which was the largest fire in California’s recent history, fire suppression cost over $177M. U.S. federal agencies on average spent over $2B per year fighting wildfires over the last five years. As a consequence, fire suppression costs usurped over 50% of the annual U.S. Forest Service budget in 2016 and 2017, compared with only 16% in 1995. The FY2018 Omnibus Appropriations Bill will help support rising fire suppression costs, in an attempt to reduce ‘fire borrowing’ from the agency’s forest management budgets. The bill funds annual federal wildfire suppression expenditures above the 10-year average in 2015 starting in 2020, and streamlines the environmental reviews of some federal land management activities aimed at reducing wildfire hazards, in the hopes of reducing the great burden of wildfire suppression on federal land-management agencies.
While wildfire prediction, evacuation, and suppression are vital emergency-response measures, more resources need to be dedicated to help recovery efforts after wildfire disasters. In response to the record cumulative damage of billion-dollar climate and weather-related events in 2017 ($309B, CPI-adjusted to present), the U.S. Congress initiated the largest disaster recovery spending bill on record in February. The Bipartisan Budget Act of 2018 committed almost $100B in supplemental funding for recovery from hurricane and wildfire disasters in 2017.
Recovery from wildfire disasters will continue to burden vulnerable communities and taxpayers unless significant investment in wildfire mitigation occurs. The National Institute of Building Sciences estimates that for every $1 spent on wildfire mitigation, society saves $3–4 in wildfire disaster recovery costs [26]. The Bipartisan Budget Act of 2018 allocates $12B to future hurricane and wildfire risks, which is the largest single allocation in the U.S. for hazard mitigation to date. In addition, the FY2018 Omnibus Appropriations Bill allocates $249M to the Federal Emergency Management Agency’s Pre-Disaster Mitigation Grant Program (PDM), which is three times the average annual appropriation to PDM over the past 15 years. However, wildfire mitigation receives a disproportionately small amount of hazard mitigation funding. For example, of the $16B in grants to the U.S. Department of Housing and Urban Development awarded through recent spending measures to support mitigation in areas that experienced Presidentially-declared disasters since 2015, only 0.55%—$88M—was dedicated to areas that experienced wildfire disasters (State of California). However, the National Oceanic and Atmospheric Administration (NOAA) estimates that wildfire disasters accounted for 6% of losses from billion-dollar disasters from 2015 through 2017, totaling $24B in CPI-adjusted losses. For context, about 1.8 million homes in the western U.S. are currently at high to extreme risk of wildfire damage, totaling $500B in property value [27], and almost half of the true costs of wildfires are borne by communities at the local level, including long-term damages such as landscape rehabilitation, lost business and tax revenues, and property or infrastructure repairs [28]. Mitigation policies must better reflect future wildfire risks in order to protect vulnerable communities from burning, not just flooding, as climate changes.
While many of these efforts are laudable, they are not nearly enough in the long-term. The fundamental issue remains for the U.S. and other nations struggling with changing fire regimes: how do we better live in increasingly flammable landscapes?
7. How Do We Better Live in Increasingly Flammable Landscapes?
We need sustained policies that help us coexist with fire [25,29,30,31,32]. First, we need to build better. In the U.S. and elsewhere, we need to incentivize development where the risk of wildfire damage is lower and can actually be defended. Moreover, part of building better is incorporating disaster planning and mitigation activities commensurate with the expected wildfire risk; this includes limiting development in risky areas, and promoting ignition-resistant development and improving evacuation planning during wildfires in existing communities. Further, meteorological feedbacks due to urbanization and resultant “heat-island” effects on fuel aridity should be considered when expanding urban areas into flammable ecosystems [33,34]. Fuel reductions should be prioritized where people live and work and accidental ignitions are inevitable. In the western U.S., very few federal fuel-reduction treatments (<1%) encounter wildfires each year [35]. Due to the stochastic nature of fire starts and the vast area that burns relative to treatable area [25], it is imperative to concentrate efforts to protect communities. Second, we need to burn better, cultivating more controlled fires that reduce fuels and allowing more remote wildfires to burn in ecosystems that evolved with fire. While there are several critical challenges to implementing prescribed burning [36], including smoke management, safe fire weather-burning windows, and drought-stressed plant communities, this would ultimately reduce the likelihood of large, severe fires in the future. Furthermore, we need public education to reduce the number of accidental human-related ignitions and build a public consciousness of the inevitability of fire in ecosystems adapted to it. Third, the U.S. and other major greenhouse-gas emitting nations must address climate change. Wildfire seasons such as the one that the western U.S. experienced in 2017 are increasingly likely with anthropogenic climate change. To ignore the role of a warming climate, and our contribution to it, puts lives and property at great risk from wildfires. Living more sustainably in flammable places, which would make communities less vulnerable, is ultimately the switch that we must turn on.
8. What to Expect in 2018: The Aridity Switch Is already on in Many Parts of the Western U.S.
The southwestern U.S. is, as of May 2018, designated by the U.S. Drought Monitor as abnormally dry and experiencing extreme drought conditions, with large wildfires burning recently in New Mexico and Texas (e.g., the “206” fire burned more than 24,000 ha in mid-April). In the three-month outlook issued in mid-May 2018, NOAA’s National Weather Service Climate Prediction Center expects most of the western U.S. to be abnormally hot and the Pacific Northwest to be abnormally dry during the core fire season from June to August. There is concern that fine grass fuel built up from last year’s wet winter and spring is still available and ready to burn in some ecosystems, and below average snow pack in the southwestern U.S. will lead to earlier onset of flammability in forested montane systems [37]. Above normal significant wildfire activity is expected for the much of the flammable West [37]. As the U.S. begins the 2018 fire season earlier than expected, we must consider and push for policy changes that help our communities adapt to changing fire regimes.
Author Contributions
J.K.B., T.S., A.P.W., and J.T.A. designed research; J.T.A., M.E.C., N.P.M., and L.A.S.D. synthesized, analyzed data, and/or developed figures; and J.K.B., T.S., A.P.W., J.T.A., and M.E.C. wrote the paper.
Acknowledgments
We thank two anonymous reviewers for their comments. This work was funded by the National Aeronautics and Space Administration Terrestrial Ecology Program under Award NNX14AJ14G, the Center for Climate and Life at Columbia University, and Earth Lab through CIRES and the University of Colorado, Boulder’s Grand Challenge Initiative.
Conflicts of Interest
Authors declare no competing interests.
Data and Materials Availability
The MODIS burned area, MODIS active fire, NOAA Climgrid data, and National Land Cover Database used in the analysis are available through public sources. The National Lightning Detection Network data is owned by Vaisala.
References
- National Interagency Fire Center. Total Wildland Fires and Acres (1960–2017); National Interagency Fire Center: Boise, ID, USA, 2017.
- Climate Central. Western Wildfires Undermining Progress on Air Pollution. Available online: http://www.climatecentral.org/news/report-wildfires-undermining-air-pollution-progress-21753 (accessed on 26 May 2018).
- Miller, C.; Irfan, U. Map: See where wildfires are causing record pollution in California. Vox, 12 September 2017. [Google Scholar]
- Bradstock, R.A. A biogeographic model of fire regimes in Australia: Current and future implications. Glob. Ecol. Biogeogr. 2010, 19, 145–158. [Google Scholar] [CrossRef]
- Giglio, L.; Loboda, T.; Roy, D.P.; Quayle, B.; Justice, C.O. An active-fire based burned area mapping algorithm for the MODIS sensor. Remote Sens. Environ. 2009, 113, 408–420. [Google Scholar] [CrossRef]
- Eidenshink, J.; Schwind, B.; Brewer, K.; Zhu, Z.L.; Quayle, B.; Howard, S. A project for monitoring trends in burn severity. Fire Ecol. 2007, 3, 3–21. [Google Scholar] [CrossRef]
- Balch, J.K.; Bradley, B.A.; Abatzoglou, J.T.; Nagy, R.C.; Fusco, E.J.; Mahood, A.L. Human-started wildfires expand the fire niche across the United States. Proc. Natl. Acad. Sci. USA 2017, 114, 2946–2951. [Google Scholar] [CrossRef] [PubMed]
- Balch, J.K.; Bradley, B.A.; D’Antonio, C.M.; Gomez-Dans, J. Introduced annual grass increases regional fire activity across the arid western USA (1980–2009). Glob. Chang. Biol. 2013, 19, 173–183. [Google Scholar] [CrossRef] [PubMed]
- Giglio, L.; Csiszar, I.; Justice, C.O. Global distribution and seasonality of active fires as observed with the Terra and Aqua Moderate Resolution Imaging Spectroradiometer (MODIS) sensors. J. Geophys. Res. Biogeosci. 2006, 111. [Google Scholar] [CrossRef] [Green Version]
- Schoennagel, T.; Veblen, T.T.; Romme, W.H. The interaction of fire, fuels, and climate across rocky mountain forests. Bioscience 2004, 54, 661–676. [Google Scholar] [CrossRef]
- Radeloff, V.C.; Helmers, D.P.; Kramer, H.A.; Mockrin, M.H.; Alexandre, P.M.; Bar-Massada, A.; Butsic, V.; Hawbaker, T.J.; Martinuzzi, S.; Syphard, A.D.; et al. Rapid growth of the US wildland-urban interface raises wildfire risk. Proc. Natl. Acad. Sci. USA 2018, 115, 3314–3319. [Google Scholar] [CrossRef] [PubMed]
- Hjerpe, E.; Kim, Y.-S.; Dunn, L. Forest density preferences of homebuyers in the wildland-urban interface. For. Policy Econ. 2016, 70, 56–66. [Google Scholar] [CrossRef]
- Vose, R.S.; Applequist, S.; Squires, M.; Durre, I.; Menne, M.J.; Williams, C.N., Jr.; Fenimore, C.; Gleason, K.; Arndt, D. Improved historical temperature and precipitation time series for US climate divisions. J. Appl. Meteorol. Climatol. 2014, 53, 1232–1251. [Google Scholar] [CrossRef]
- Mote, P.W.; Li, S.; Lettenmaier, D.P.; Xiao, M.; Engel, R. Dramatic declines in snowpack in the western US. npj Clim. Atmos. Sci. 2018, 1, 2. [Google Scholar] [CrossRef]
- Westerling, A.L. Increasing western US forest wildfire activity: Sensitivity to changes in the timing of spring. Philos. Trans. R. Soc. Lond. B Biol. Sci. 2016, 371, 20150178. [Google Scholar] [CrossRef] [PubMed]
- Dennison, P.E.; Brewer, S.C.; Arnold, J.D.; Moritz, M.A. Large wildfire trends in the western United States, 1984–2011. Geophys. Res. Lett. 2014, 41, 2928–2933. [Google Scholar] [CrossRef]
- Abatzoglou, J.T.; Williams, A.P. Impact of anthropogenic climate change on wildfire across western US forests. Proc. Natl. Acad. Sci. USA 2016, 113, 11770–11775. [Google Scholar] [CrossRef] [PubMed] [Green Version]
- Berg, N.; Hall, A. Increased interannual precipitation extremes over California under climate change. J. Clim. 2015, 28, 6324–6334. [Google Scholar] [CrossRef]
- Swain, D.L.; Langenbrunner, B.; Neelin, J.D.; Hall, A. Increasing precipitation volatility in twenty-first-century California. Nat. Clim. Chang. 2018, 8, 427–433. [Google Scholar] [CrossRef]
- Seager, R.; Neelin, D.; Simpson, I.; Liu, H.; Henderson, N.; Shaw, T.; Kushnir, Y.; Ting, M.; Cook, B. Dynamical and Thermodynamical Causes of Large-Scale Changes in the Hydrological Cycle over North America in Response to Global Warming. J. Clim. 2014, 27, 7921–7948. [Google Scholar] [CrossRef]
- Abatzoglou, J.T.; Rupp, D.E.; Mote, P.W. Seasonal Climate Variability and Change in the Pacific Northwest of the United States. J. Clim. 2014, 27, 2125–2142. [Google Scholar] [CrossRef] [Green Version]
- Melillo, J.M.; Richmond, T.; Yohe, G.W. Climate Change Impacts in the United States: The Third National Climate Assessment; U.S. Global Change Research Program: Washington, DC, USA, 2014; p. 841.
- Abatzoglou, J.T.; Kolden, C.A. Relationships between climate and macroscale area burned in the western United States. Int. J. Wildland Fire 2013, 22, 1003–1020. [Google Scholar] [CrossRef]
- Diffenbaugh, N.S.; Singh, D.; Mankin, J.S.; Horton, D.E.; Swain, D.L.; Touma, D.; Charland, A.; Liu, Y.; Haugen, M.; Tsiang, M.; et al. Quantifying the influence of global warming on unprecedented extreme climate events. Proc. Natl. Acad. Sci. USA 2017, 114, 4881–4886. [Google Scholar] [CrossRef] [PubMed] [Green Version]
- Schoennagel, T.; Balch, J.K.; Brenkert-Smith, H.; Dennison, P.E.; Harvey, B.J.; Krawchuk, M.A.; Mietkiewicz, N.; Morgan, P.; Moritz, M.A.; Rasker, R.; et al. Adapt to more wildfire in western North American forests as climate changes. Proc. Natl. Acad. Sci. USA 2017, 114, 4582–4590. [Google Scholar] [CrossRef] [PubMed]
- Multihazard Mitigation Council. Natural Hazard Mitigation Saves: 2017 Interim Report; National Institute of Building Sciences: Washington, DC, USA, 2017. [Google Scholar]
- Botts, H.; Jeffery, T.; Lindfors, Z. CoreLogic Wildfire Hazard Risk Report; CoreLogic: Irvine, CA, USA, 2016; Available online: http://arcg.is/0iGDSD (accessed on 26 May 2018).
- Headwaters Economics. The Full Community Costs of Wildfire; Headwaters Economics: Bozeman, MT, USA, 2018; p. 44. [Google Scholar]
- Moritz, M.A.; Batllori, E.; Bradstock, R.A.; Gill, A.M.; Handmer, J.; Hessburg, P.F.; Leonard, J.; McCaffrey, S.; Odion, D.C.; Schoennagel, T.; et al. Learning to coexist with wildfire. Nature 2014, 515, 58–66. [Google Scholar] [CrossRef] [PubMed]
- Toman, E.; Stidham, M.; McCaffrey, S.; Shindler, B. Social Science at the Wildland-Urban Interface: A Compendium of Research Results to Create Fire-Adapted Communities; General Technical Report NRS NRS-GTR-111; U.S. Department of Agriculture, Forest Service, Northern Research Station: Newton Square, PA, USA, 2013; p. 75.
- Calkin, D.E.; Cohen, J.D.; Finney, M.A.; Thompson, M.P. How risk management can prevent future wildfire disasters in the wildland-urban interface. Proc. Natl. Acad. Sci. USA 2014, 111, 746–751. [Google Scholar] [CrossRef] [PubMed]
- Smith, A.M.; Kolden, C.A.; Paveglio, T.B.; Cochrane, M.A.; Bowman, D.M.; Moritz, M.A.; Kliskey, A.D.; Alessa, L.; Hudak, A.T.; Hoffman, C.M.; et al. The science of firescapes: Achieving fire-resilient communities. Bioscience 2016, 66, 130–146. [Google Scholar] [CrossRef] [PubMed]
- Williams, A.P.; Schwartz, R.E.; Iacobellis, S.; Seager, R.; Cook, B.I.; Still, C.J.; Husak, G.; Michaelsen, J. Urbanization causes increased cloud-base height and decreased fog in coastal southern California. Geophys. Res. Lett. 2015, 42, 1527–1536. [Google Scholar] [CrossRef]
- Williams, A.P.; Gentine, P.; Moritz, M.A.; Roberts, D.A.; Abatzoglou, J.T. Effect of reduced summer cloud shading on evaporative demand and wildfire in coastal southern California. Geophys. Res. Lett. 2018, in press. [Google Scholar] [CrossRef]
- Barnett, K.; Parks, S.A.; Miller, C.; Naughton, H.T. Beyond fuel treatment effectiveness: Characterizing Interactions between fire and treatments in the US. Forests 2016, 7, 237. [Google Scholar] [CrossRef]
- Ryan, K.C.; Knapp, E.E.; Varner, J.M. Prescribed fire in North American forests and woodlands: History, current practice, and challenges. Front. Ecol. Environ. 2013, 11, e15–e24. [Google Scholar] [CrossRef]
- National Interagency Fire Center (NIFC). National Significant Wildland Fire—Potential Outlook; Issued 1 May 2018; NIFC: Boise, ID, USA, 2018.
Figure 1.
(a) 2017 burned area for the western United States (U.S.) (based on the Moderate Resolution Imaging Spectroradiometer (MODIS) burned area product (MCD64A1) for 2017 [5]); (b) annual burned area from large wildfires (>400 ha) in the western U.S. from 1984–2017, and Theil-Sen estimated trend (dashed line). Annual burned area is based on the Monitoring Trends in Burn Severity product (MTBS) for 1984–2015 [6], with modeled values for 2016 and 2017. Generalized linear models were fit using trends in the MODIS burned area product from 2001–2017, given trends in the MTBS product to predict modeled values for 2016 and 2017. All of the trend lines were statistically significant (p < 0.0001).

Figure 2.
Categorical percentiles of (a) October 2016–April 2017 precipitation; (b) May–September 2017 temperature; and (c) September–December 2017 precipitation; based on National Oceanic and Atmospheric Administration (NOAA) Climgrid data, relative to the 1895–2017 period of record. Nine percent of the western U.S. (west of 103 degrees) had their wettest October–April on record (42% in the top decile); 9% of the western U.S. also had its warmest May–August on record (57% in the top decile). Thirty-three percent of the western U.S. had both a top decile October–April precipitation total and a top decile May–September temperature.
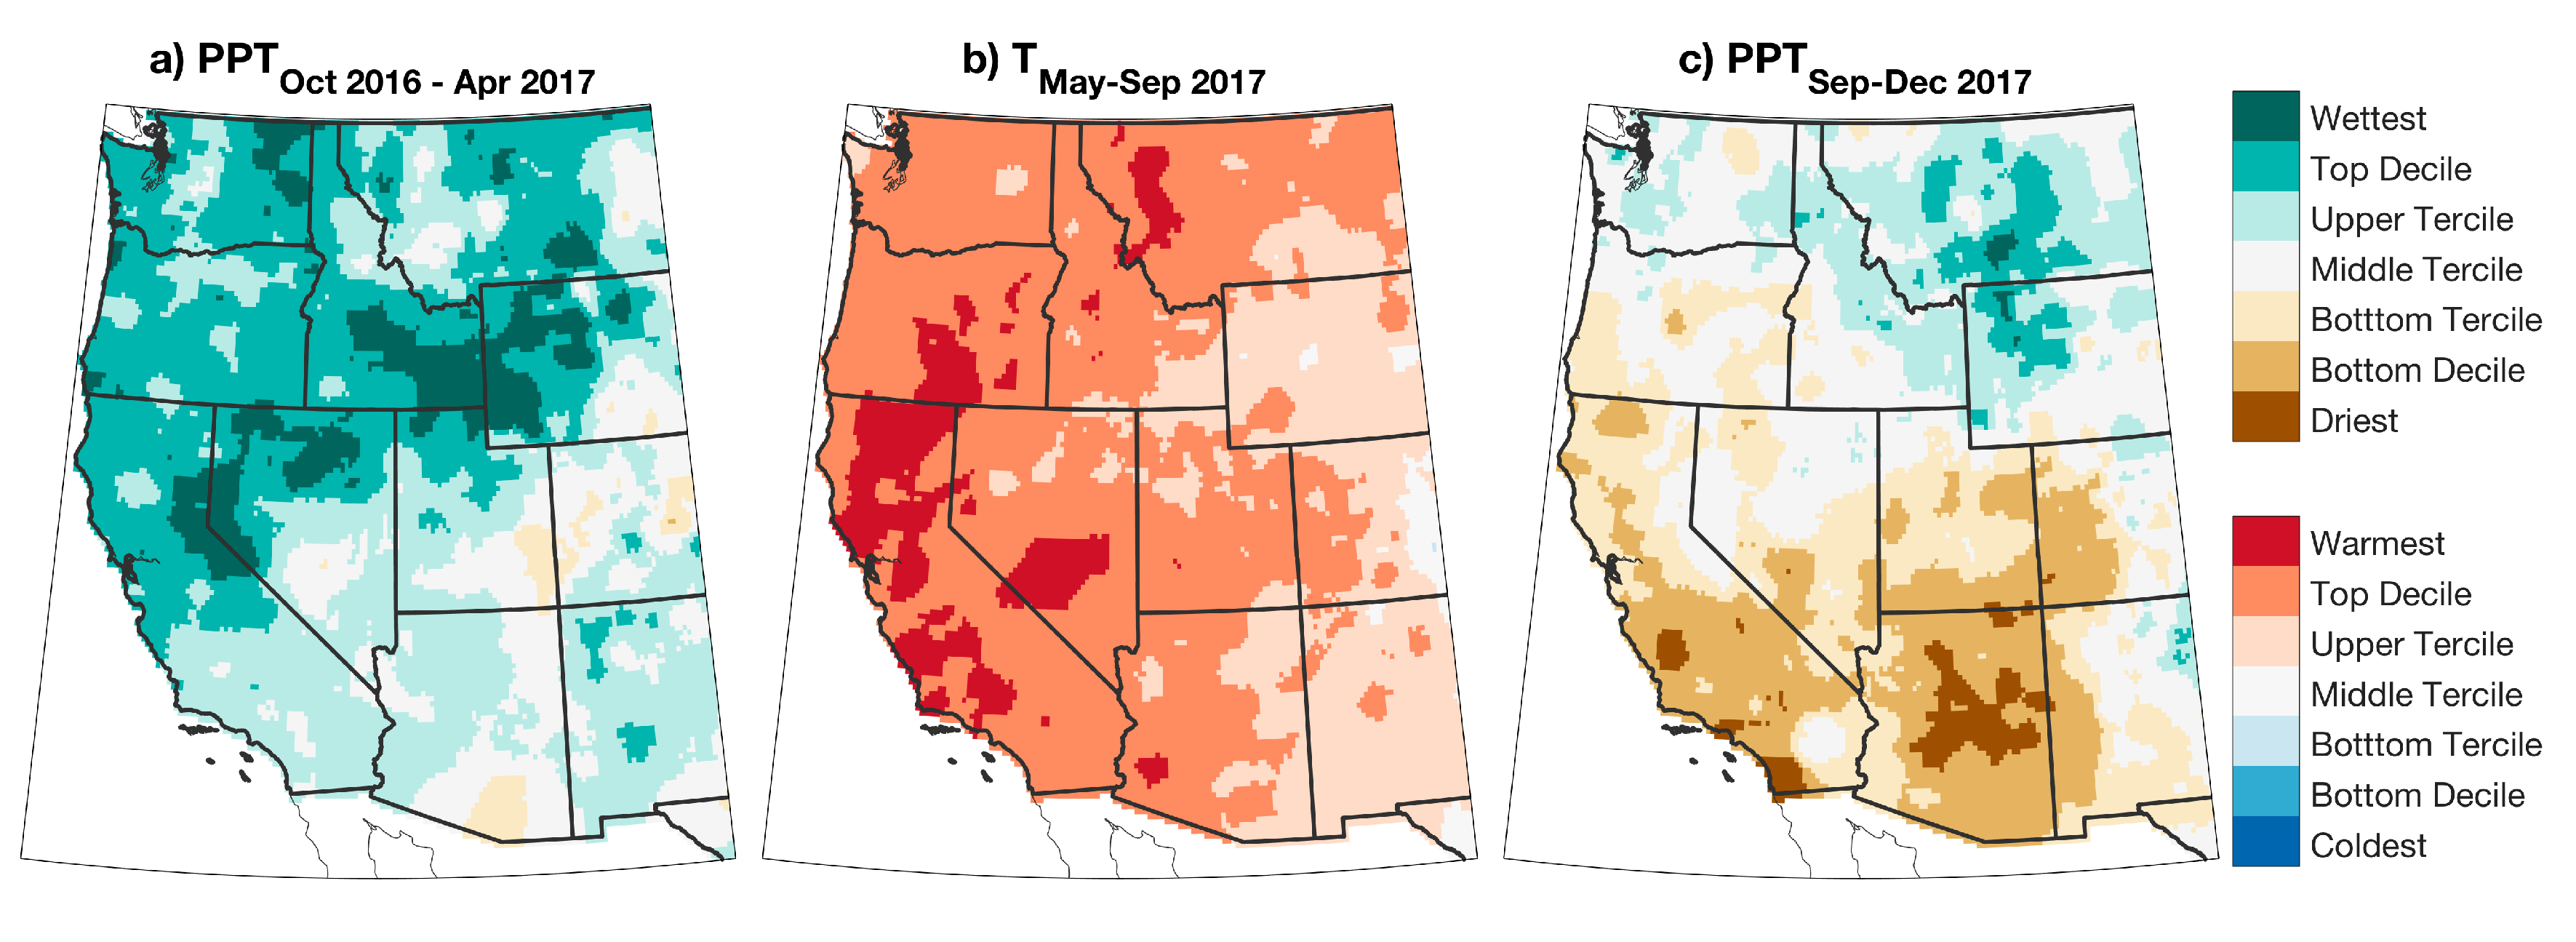
Figure 3.
Histogram of fire activity (based on MODIS active fire detections) in 2017 for the western U.S. based on (a) landcover type burning (National Land Cover Database) and (b) month of burn, compared with the average between 2001–2016.
Figure 3.
Histogram of fire activity (based on MODIS active fire detections) in 2017 for the western U.S. based on (a) landcover type burning (National Land Cover Database) and (b) month of burn, compared with the average between 2001–2016.

© 2018 by the authors. Licensee MDPI, Basel, Switzerland. This article is an open access article distributed under the terms and conditions of the Creative Commons Attribution (CC BY) license (http://creativecommons.org/licenses/by/4.0/).
Share and Cite
MDPI and ACS Style
Balch, J.K.; Schoennagel, T.; Williams, A.P.; Abatzoglou, J.T.; Cattau, M.E.; Mietkiewicz, N.P.; St. Denis, L.A. Switching on the Big Burn of 2017. Fire 2018, 1, 17. https://doi.org/10.3390/fire1010017
AMA Style
Balch JK, Schoennagel T, Williams AP, Abatzoglou JT, Cattau ME, Mietkiewicz NP, St. Denis LA. Switching on the Big Burn of 2017. Fire. 2018; 1(1):17. https://doi.org/10.3390/fire1010017
Chicago/Turabian StyleBalch, Jennifer K., Tania Schoennagel, A. Park Williams, John T. Abatzoglou, Megan E. Cattau, Nathan P. Mietkiewicz, and Lise A. St. Denis. 2018. "Switching on the Big Burn of 2017" Fire 1, no. 1: 17. https://doi.org/10.3390/fire1010017