Limits on the Reconstruction of a Single Dark Energy Scalar Field Potential from SNe Ia Data


1
A. I. Alikhanian National Science Laboratory, Yerevan Physics Institute, Alikhanyan broth. 2, 0036 Yerevan, Armenia
2
Programa de Pós-Graduação em Física, Universidade Federal do Maranhão (UFMA), São Luís 65085-580, Maranhão, Brazil
3
Institut Für Theoretische Physik, Ruprecht-Karls-Universität Heidelberg, Philosophenweg 16, 69120 Heidelberg, Germany
*
Author to whom correspondence should be addressed.
†
These authors contributed equally to this work.
Particles 2018, 1(1), 23-35; https://doi.org/10.3390/particles1010003
Submission received: 27 January 2018
/
Revised: 16 February 2018
/
Accepted: 22 February 2018
/
Published: 28 February 2018
(This article belongs to the Special Issue Selected Papers from “The Modern Physics of Compact Stars and Relativistic Gravity 2017”)
Abstract
:In this paper we perform a reconstruction of the scalar field potential responsible for cosmic acceleration using SNe Ia data. After describing the method, we test it with real SNe Ia data—Union2.1 and JLA SNe datasets. We demonstrate that with the current data precision level, the full reconstruction is not possible. We discuss the problems which arise during the reconstruction process and the ways to overcome them.
1. Introduction
Since the discovery of the accelerated expansion of the universe in 1998 [1,2], scientists face new problems in fundamental physics, since general relativity (GR) cannot accommodate accelerated expansion without a cosmological constant, whose theoretical difficulties are well-known [3,4,5]. Many theories and methods have been proposed to solve this puzzle. Among them, we mention phantom cosmology [6], tachyonic matter [7], braneworld scenarios [8], scalar-tensor theories [9], f(R)-gravity [10,11], holographic gravity [12,13], Chaplygin gas [14,15,16,17], models with extra (i.e., more than four) dimensions [18], neutrinos of varying mass [19,20] and many others. Among them, there are also models with fluid-based approaches (e.g., [21]) or Cardassian cosmology [22,23,24]. The next step, naturally, is to find the true theory which will best explain the experimental data. To do this, we must start to look for it in the most general way. One of the analytical general approaches is Horndeski’s theory [25], which builds the most general ghost free Lagrangian scalar field. This class of models is however too large to be reconstructed without a priori assumptions. This kind of work has been done before; however, in most cases, the previous attempts have employed a parameterization with a small number of free parameters (see, e.g., [26,27,28,29]). There are also many model independent attempts for the Dark Energy reconstruction; some of them can be found the the following publications [30,31,32,33,34,35,36,37,38,39]. In this paper, we employ instead a fully non-parametric reconstruction of the scalar field potential. Unfortunately, our conclusion is that the present accuracy of data is insufficient to allow for such a reconstruction. It is worth mentioning another non-parametric reconstruction method, which is, again, not fully general but depends on the choice of covariance function, the so-called Gaussian process (see [40]).
The structure of the manuscript is as follows. in Section 2, we present the principle and formulae for the Dark Energy potential reconstruction from the supernovae type Ia (SNe Ia) data. The main data analysis and reconstruction as well as the errors analysis is performed in Section 3. Discussion and Conclusions, where we discuss the reasons and a way to improve the method, are provided correspondingly in Section 4 and Section 5. We show that the lack of statistical data and accuracy does not allow us to apply the method effectively. However, with some improvement and better data, this analysis may be irreplaceable because of its generality. We used in this work only Ia type SNe data as a first step, however, baryonic acoustic oscillations (BAO) as well as perturbations using the cosmic microwave background (CMB) data can also be added. These will be taken into account in our next papers.
2. Potential Reconstruction Technique
As we mentioned in the Introduction, we restore the scalar field potential in the most general form, thus no assumptions and priors are made about its functional form. Then, the procedure of the recovery is as follows: as input data, we have distance modulus with its error for each ith supernova at redshift (possibly with error , depending on the data). To smooth the individual values of the distance modulus, we bin the supernovae. We use two main binning methods: binning with equal and with equal (number of supernovae), as well as their combination, if necessary. It is worth mentioning that we have used the maximum number in bin such as more number of SNe in each bin does not improve the result and keeps the statistic acceptable. Both these methods have their advantages and disadvantages, and in due time we shall discuss them.
Assuming Gaussian nature of the SNe errors, we determine the mean value for the distance modulus in each bin as an average over the individual values and the error as , where is the number of supernovae in jth bin. We also define —the error in z—as the half-width of the bin (in the case we have for each individual supernova, the definition for the error in binned z becomes more complicated). For equal z binning, it gives the same value for but, for alternative binning, it will be different, so we keep this notation for the general case.
The process of binned data is as follows: first we transform the distance modulus and its error into the comoving distance :
We proceed further to , which is defined as . In practice, for simplicity and to avoid losing too much data, we use one-step differentiation scheme. Then, the value and the error take the form
For equal z binning, all are equal to each other, but, in the general case, this is not true, so we keep the general form of the errors expression. Similar to the procedure described above, we calculate the derivative of with respect to z:
Now, with both (see Equation (2)) and (see Equation (3)) calculated, we can recover the potential and the kinetic part . The equations for them and their errors are the following:
Equations (4) and (5) give us the dimensionless potential and the scalar field, and , respectively; the latter (if positive) could be integrated to get (with an additive constant). Finally, eliminating z from and in Equations (4) and (5), we reconstruct (again, up to additive constant). For simplicity, we use the rectangle method for integration, so the error propagation for the remaining steps is as follows:
It is worth mentioning that the described procedure is quite similar to the approach employed by the cosmography (see [41] for review; [42,43,44,45] for the effects on GR level; [46] for extended gravity; [47] for gravity; and [48,49] for gravity). In turn, this is quite close to CDM approach and we discuss the similarities of these methods in the Discussion Section.
3. Reconstruction Procedure by Using Real SNe Ia Data
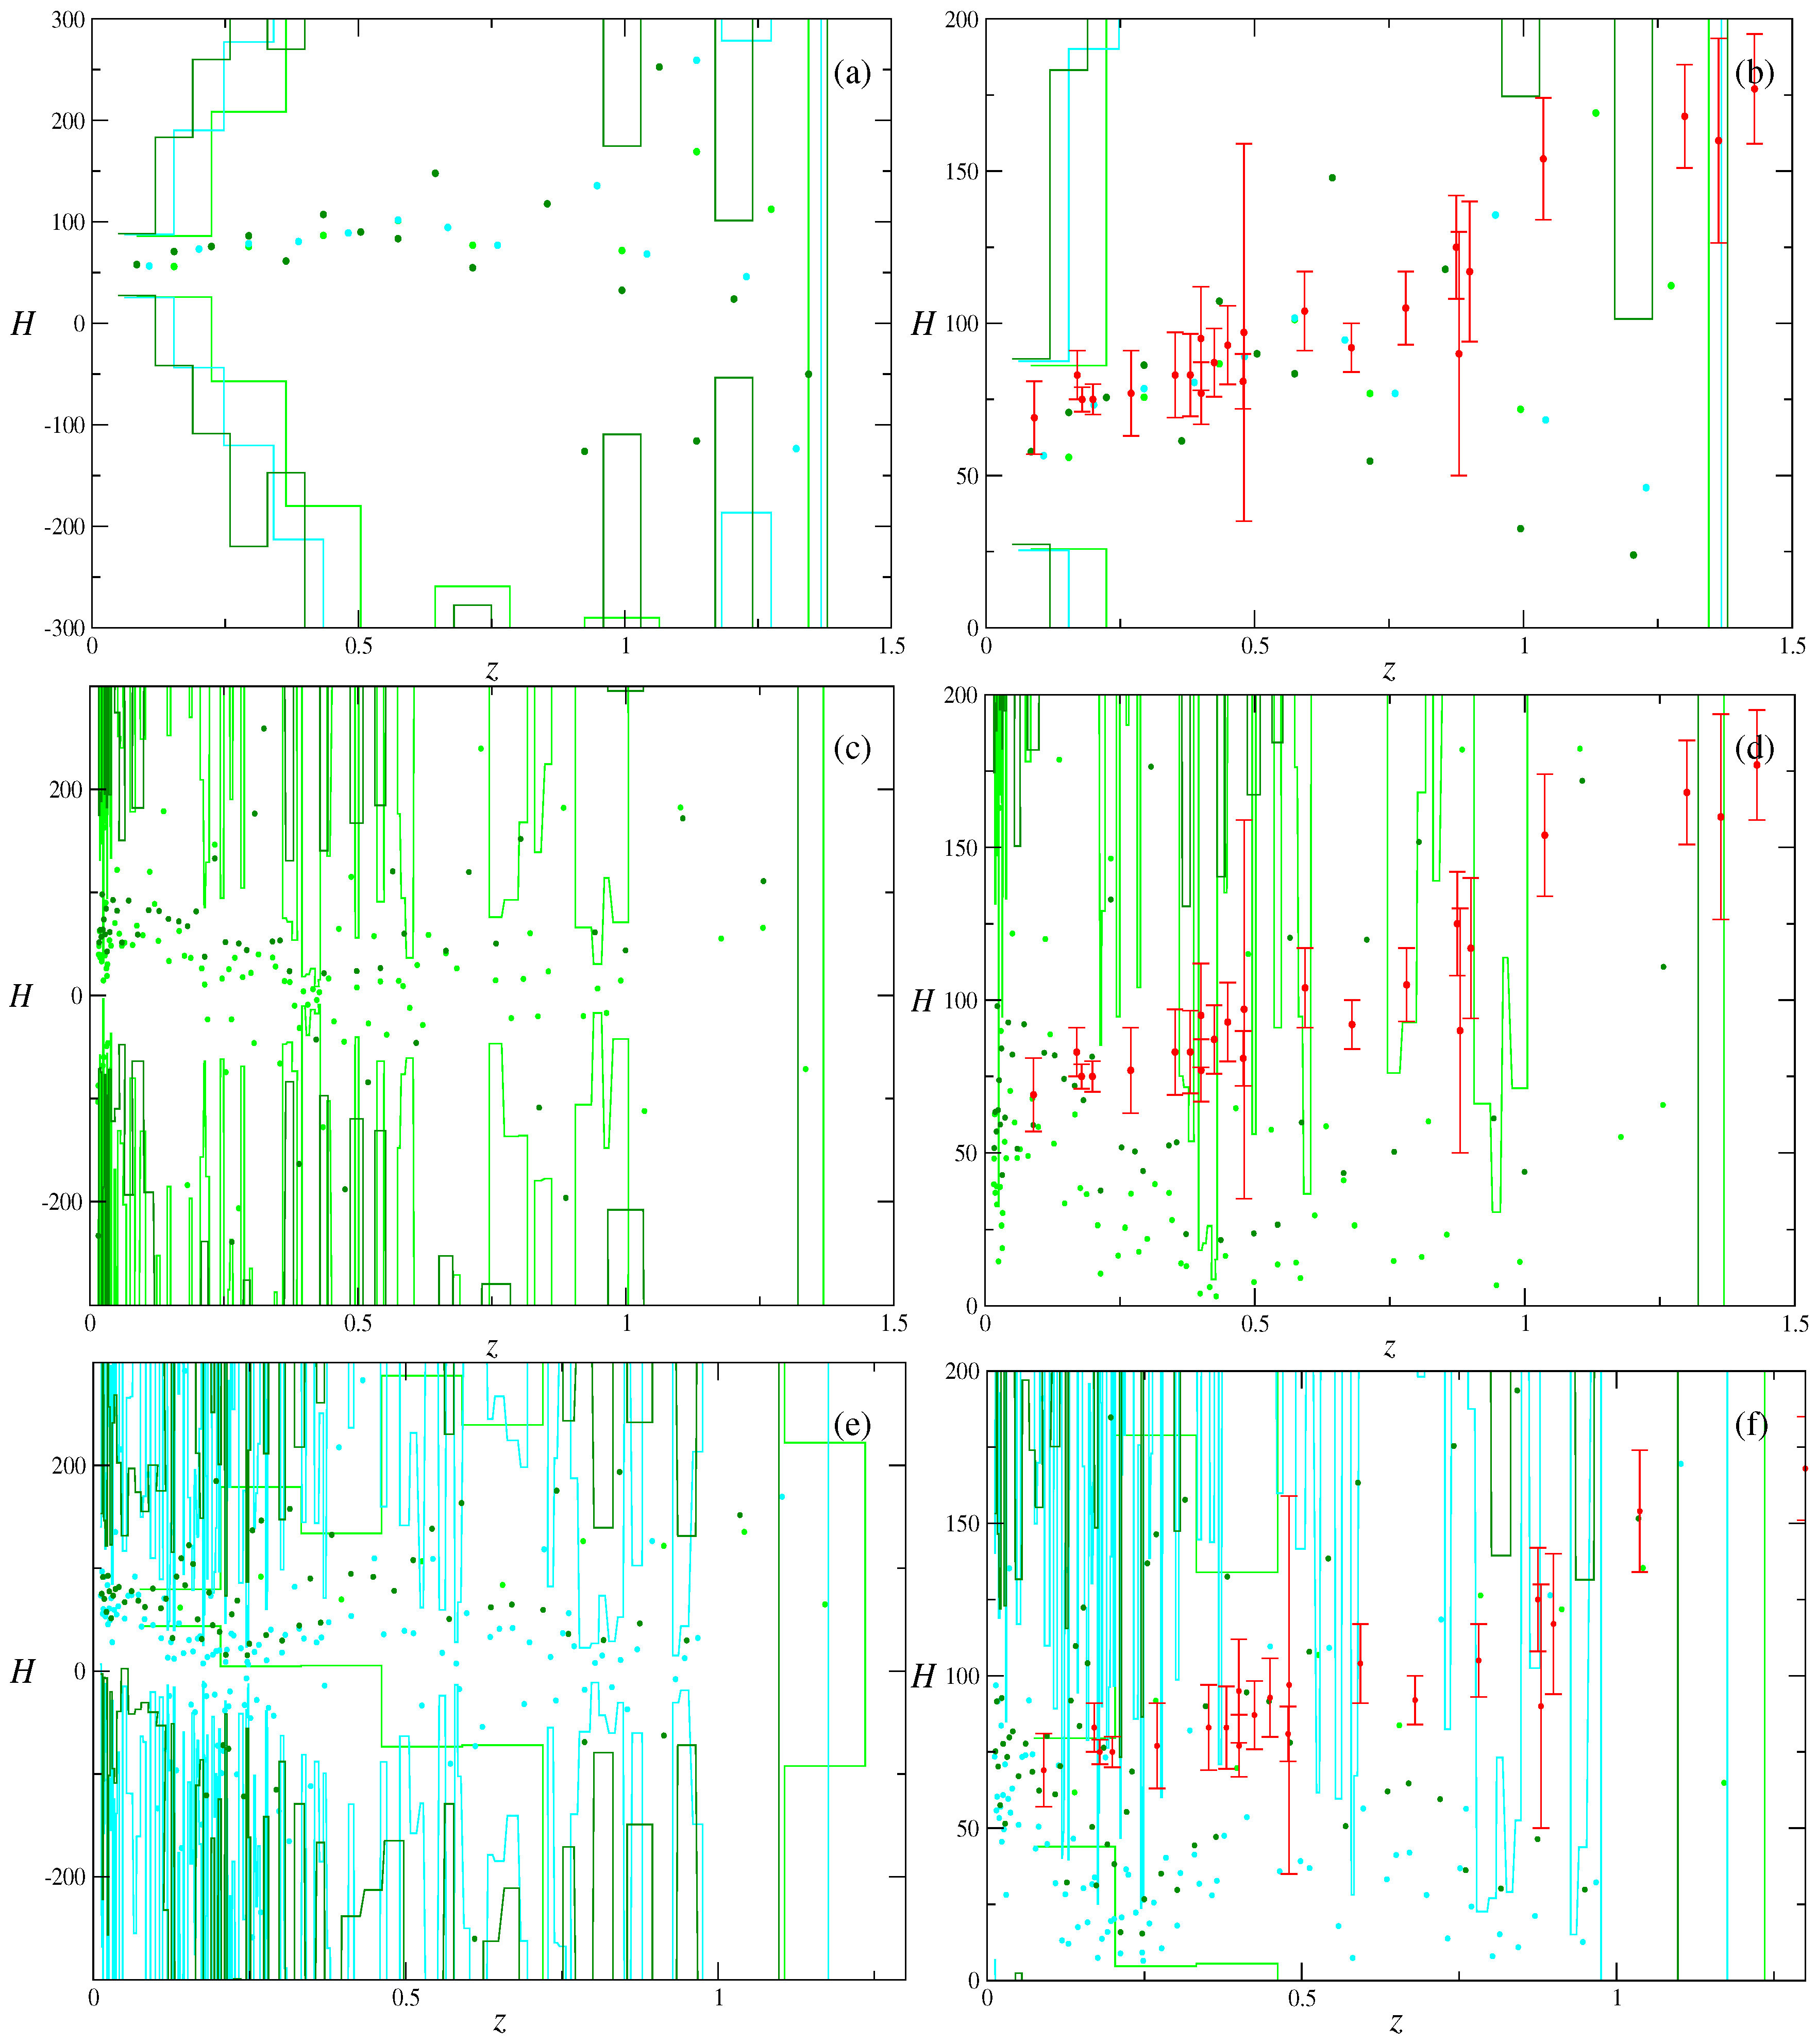
We use two existing SNe Ia sets: the 580 SNe from Union2.1 and the 740 JLA SNe. In addition, we use two different binning techniques, with equal and equal (number of data points per bin), and compare the results. First, we examine Union2.1 data. We bin data over 10, 15 and 20 bins with equal z. With 10 bins, the minimal number of SNe per bin is 9; for 15 bins, it is 5; and, for 20 bins, it is 4. If we consider binning into 25 bins, the minimal number of SNe per bin would be 2, which is too low from the statistical point of view, so we do not consider binning into 25 or more bins. Using the above described method, we recover everything up to and ; as is the quantity that is directly probed by observations, we present it as an intermediate step in Figure 1a–f. There (and in the plots to follow) we put area contours and the central values with the same color. Different panels and different colors correspond to different cases: in Figure 1a,b, we presented for equal-z binning of Union2.1 data—10 bins in green, 15 bins in cyan and 20 bins in dark green. Figure 1a, we present the “large-scale” structure, and, in Figure 1b, a more realistic range. We also added the values with errors from SNe-independent data (from chronometers, etc.—see [50]) in red. One can see that, up to , they are more or less consistent but at larger z, the consistency is lost and we even have negative values for (in the cyan and dark green lines).
Figure 1c,d correspond to equal N binning of the Union2.1 data. The green points correspond to binning while dark green to . We plot “large-scale” data in Figure 1 and more realistic range in Figure 1d. One can immediately see that the final result is very much scattered and contain very little information. This is because we have a lot of data points at low z and they create many bins there. With binning to just 5 and 10 SNe, the effect of averaging is wearing off and so the individual uncounted systematics for each SNe start to manifest themselves. On the contrary, if we choose large N, we will have fewer bins in high z range, which is the range of our interest, thus we will lose important data. Overall, the case with and do not allow any physical conclusion.
Finally, in Figure 1e,f, we present the data for JLA SNe—equal-z with 10 bins in green, equal-N with in cyan, and in dark green. For equal-z, we have only one sample due to the fact that even for just 10 bins the minimal number of SNe per bin is 2, and with 15 bins there are bins with no SNe at all, so we decided to consider only this case. In Figure 1e,f, one can see that equal-N sets are as messy as in Union2.1 case, making equal-N binning less favorable than equal-z one.
The result for clearly demonstrate that the reconstruction of is hopeless. Notice that, for restoration, we require both and its derivative , which is expected to be even more noisy.
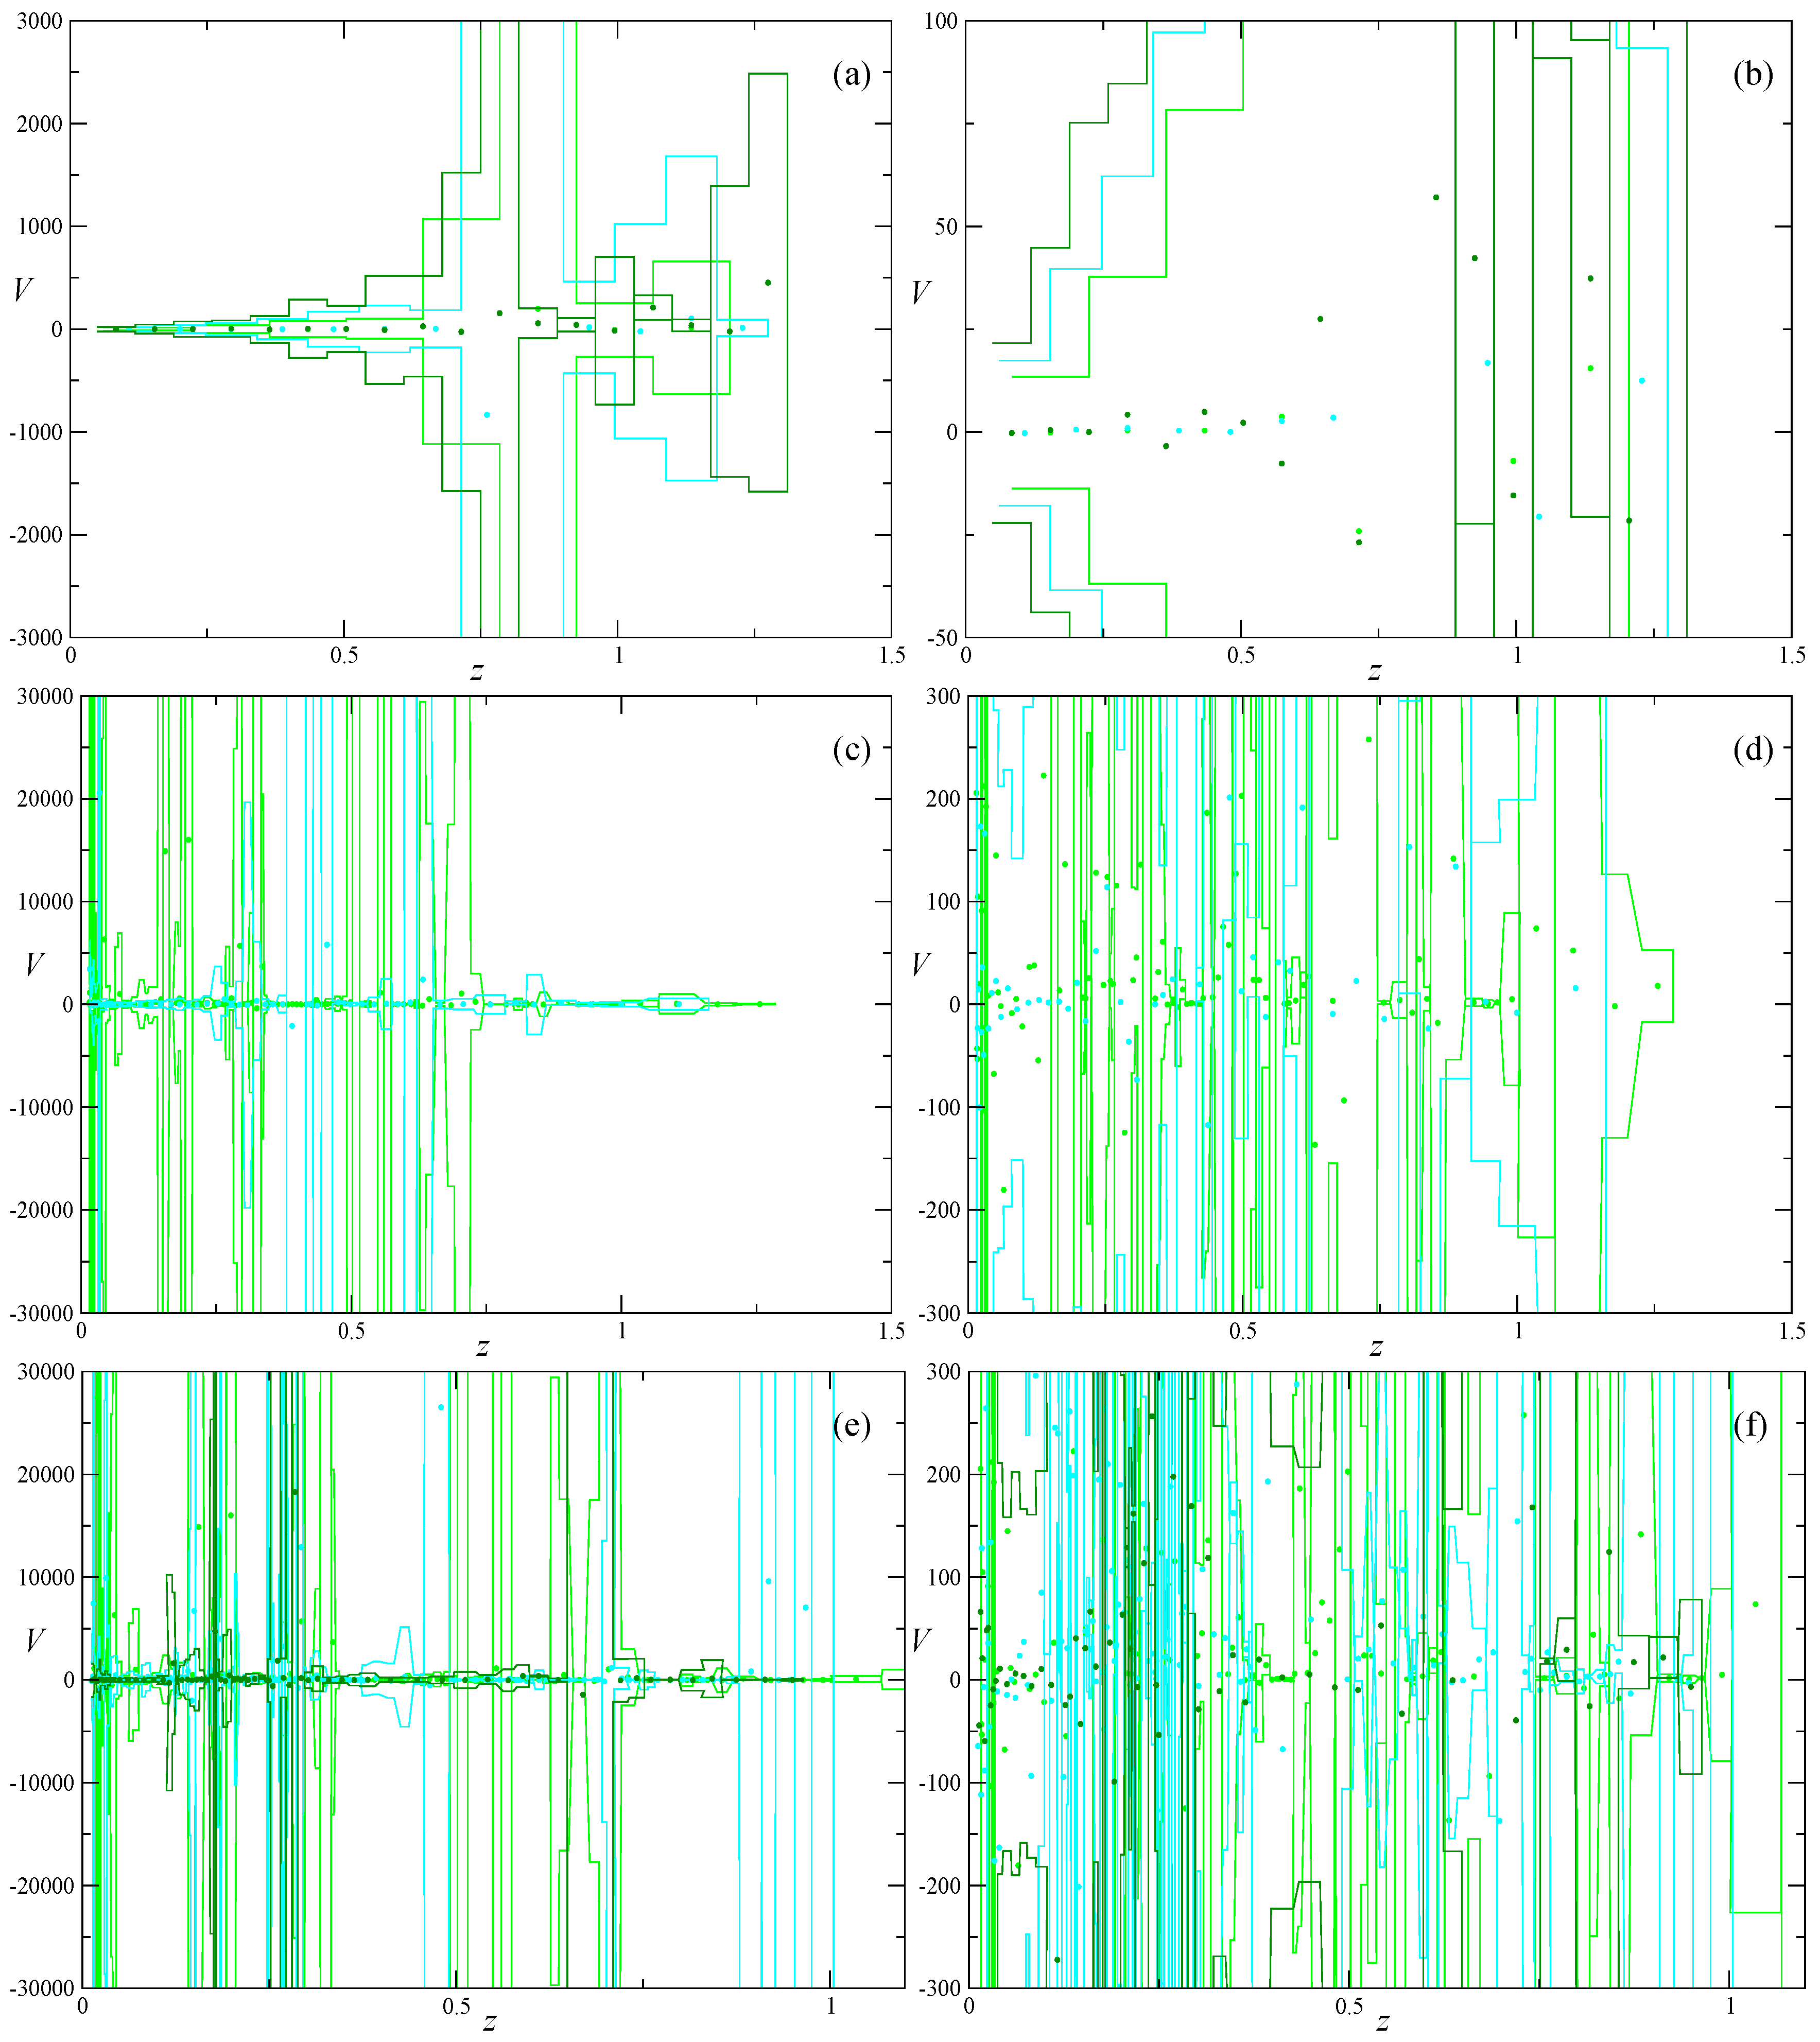
The results for for the same cases are presented in Figure 2 and Figure 3. Both figures keep the same designations as in Figure 1: Figure 2a,b and Figure 3a,b correspond to Union2.1 SNe with equal-z binning; Figure 2c,d and Figure 3c,d to Union2.1 with equal-N binning; and Figure 2e,f and Figure 3e,f to JLA SNe. The color distribution also follow that in Figure 1.
In Figure 2 and Figure 3, we can clearly see that equal-N binning is extremely noisy, as we predicted above. The only results which looks more-or-less physical (or at least which does not look totally unphysical) are the results for equal-z binning. We chose the two most “physical” ones—10 bins from Union2.1 and JLA datasets and put them together in Figure 4. In Figure 4a,b, we present data—green for Union2.1 and cyan for JLA datasets. We also added non-SNe data points from [50] (red circles with error bars) and from SNe from [51] (blue circles with error bars) to compare our results with them. One can see kind of an agreement between the data for but for start to become noisy again. In Figure 4c, we present the results for recovering and, in Figure 4d, for . One can see that, even for the chosen two best binning options, we still have negative central values for , which makes it impossible to recover .
The recovering of and was performed for km/s/Mpc and . As one can see from Equations (4) and (5), the recovering procedure use and as a parameters, so we decided to vary them to see the influence. It is presented in Figure 4e,f. There, we present recovered for different values of and . The potential could be recovered for any values of and . The expression , instead, must of course be positive so we focus on it. In Figure 4e, we fixed and varied km/s/Mpc (black line), 64 km/s/Mpc (red line), 68 km/s/Mpc (green line), and 72 km/s/Mpc (blue line). One can see that the effect is not big but visible and the values grow with increased . In Figure 4f, we fixed km/s/Mpc and varied (black line), 0.25 (red line) and 0.3 (green line). One can see that does not practically change the value for .
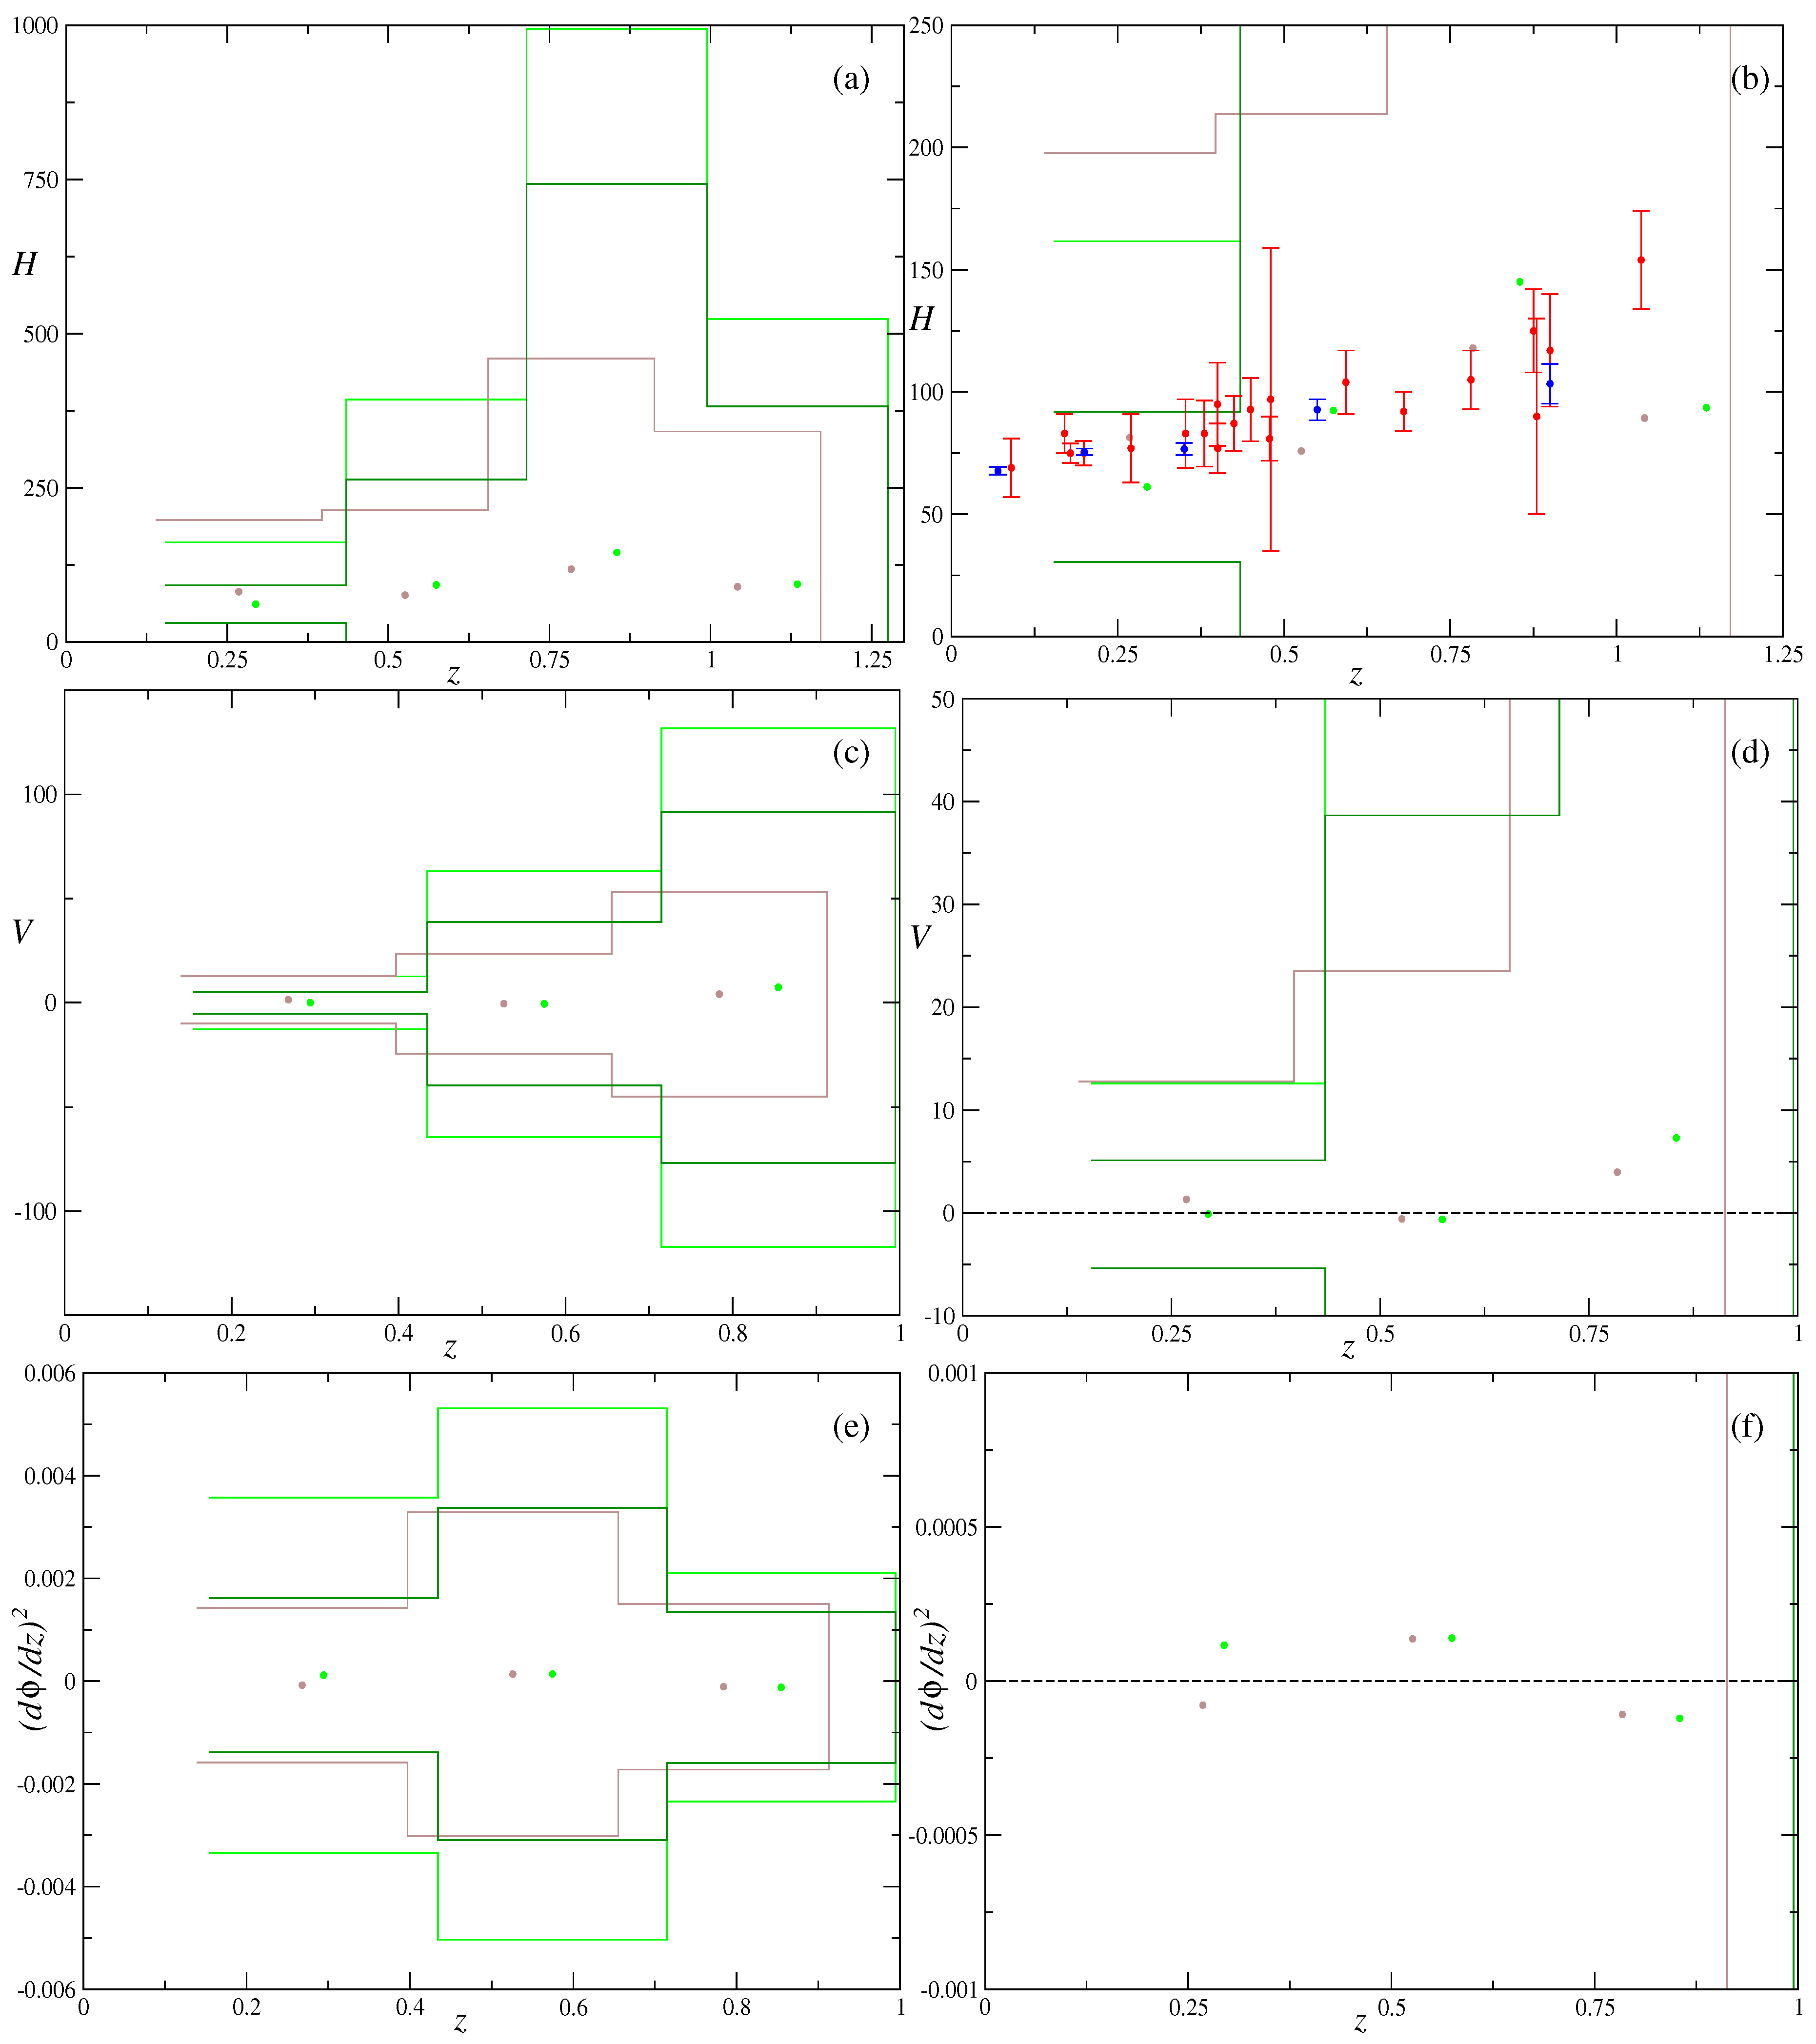
Finally, we decided to try five bins, as even ten have not given us a realistic reconstruction. Thus, we split both Union2.1 and JLA datasets into five equal-z bins and perform exactly the same analysis. This time, we also check the effect of on the error propagation in real data. The results are presented in Figure 5. There, in Figure 5a–f, we put the central values as filled circles, while error areas are bounded by the line of the same color: green for Union2.1 and brown to JLA data. As for the former, the light green corresponds to , while dark green to . The data re presented in Figure 5a,b with non-SNe data from [50] as red points and data from [51] as blue points (“large-scale” in Figure 5a and “fine” in Figure 5b); the recovered is presented in Figure 5c,d (“large-scale” in Figure 5c and “fine” in Figure 5d); and the recovered in Figure 5e,f (“large-scale” in Figure 5e and “fine” in Figure 5f).
One can see that the recovered data points are mostly in agreement with non-SNe data—as in the 10-bins case as well. Obviously, with , the errors are much smaller than in the case. Unfortunately, the potential and the kinetic term reconstructions do not improve—we also have some points of the kinetic term in the negative domain, which prevents the complete reconstruction.
In Figure 5b, we can see that even our best still have an error budget which is several times bigger then for the existing data—non-SNe data from [50] as well as recent SNe-based data from [51]. We are using 26 non-SNe data points (we were using 26 data points, but at the time there could be found maximum of 36 non-SNe data points (chronometers, BAO etc.), see e.g., [52], but one need to carefully investigate the nature of these data, their quality and errors before usage)—out of 30 from [50] we dropped four from [53], since their precision is much less then the rest of the data from [50].
4. Discussion
In this paper, we attempt to reconstruct the scalar field potential, which could be responsible for Dark Energy. In fact, there are a lot of such attempts (see, e.g., [29,36,37,38,39]), but with one crucial difference—all of them using parameterization for either or the effective equation of state, or some other physical quantity. One of such parameterizations is CDM, where one assumes parameterization of the equation of state of the Dark Energy in the form . In the simplest case, , the Dark Energy could be described as scaling [54,55] or tracker [56] solutions—exponential, inverse power-law and several others [56]. With more terms in the decomposition, the solutions for the scalar field becomes less likely to be found, especially in the closed form, which makes the connection of CDM with scalar fields less obvious. Clearly, the potential resulting from CDM is a simple exponential or power-law potential that depends only on one or two parameters. In this case, the reconstruction will be much less noisy than in our parameter-free case.
Another approach is the one used in cosmography (see [41] for review and [42,43,44,45,46,47,48] for applications)—there, one uses the decomposition on the derivatives of —a similar approach is used in CDM but with decomposition over . Formally, both cases allow reconstruction of from the observational (SNe Ia, in particular) data. Despite quite similar procedures (the reconstruction os the and then its differentiation to obtain higher derivatives), there are differences—for instance, for our case is enough, while, in general, cosmography and CDM higher derivatives are involved. In this regard, the approaches are also different—we saw that, in our case, without any Ansatz for or or the equation of state or anything else, the reconstructed is quite noisy, which makes its first derivative even more unprecise. If we continue this procedure to higher derivatives, the results will be totally unusable. However, in this procedure, we keep the reconstructed values totally unbiased. On the contrary, for CDM, one introduces the Ansatz (and, through it, a bias) and reconstructs the in the reduced (and degenerate) way, as well as its derivatives. In this regard, these approaches are meant for different purposes—one aims at reconstructing the scalar field potential in the most unbiased way, and the other at reconstructing of the with the least errors. This could be easily seen in Figure 5b: there, one can find our recovered data points (green and brown) as well as those obtained with non-SNe data: cosmic chronometers, BAO etc.—[50] compilation, red points as well as SNe-based [51] data, blue points. One can see that the central values are in a good agreement up to , for greater z our data points become messy, but our error bars are severalfold larger. This is the effect of the generality—with no ansatz for the dynamical variables, we are left with huge errors. On the contrary, Riess et al. [51] use six-parameter parameterization for resulting in much less errors.
Another problem is that the majority of the data points are located within . This is natural—with growth of z, the distance is increasing and so we can observe only most luminous SNe which affect their number. Here comes the first of the effects we faced while recovering —the effect of binning. We used two types of the binning: equal-N binning (so that to have equal number of SNe per bin) and equal-z binning (equal z width of each bin). Both of the types have their grounds—with equal number of supernovae per bin, equal-N binning formally provide more statistically viable data. However, due to inhomogeneous distribution of the SNe over z, it leads to a lot of bins in low-z region and only a few in high-z. As in reconstruction we are also interested in high-z region, this scheme is less favorable for us. Since we are unable to reconstruct the potential, it is hard to judge to effect of binning on the final results, but we can do it for the previous step—namely, reconstruction of the . The results suggest that for equal-N binning with all considered N the resulting reconstructed looks quite messy (see Figure 1c–f). One can see that the reconstructed (Figure 2c–f) and the kinetic term (Figure 3c–f) are even more messy—the differentiation of the unprecise only decrease the precision of the result. The reason behind it lies in huge variability between the individual bins—the smoothness of the data is not enough to perform such binning. In this regard, if we increase number of SNe per bin, the smoothness increases, but due to highly uneven distribution of the SNe over z, the bin at highest possible z will be located at , which is too low for our initial aim—reconstruction of the Dark Energy scalar field potential. Thus, we decided that the equal-N binning is not suited for our cause and more in-depth investigation was performed with equal-z binning.
On the contrary, equal-z binning have different number of SNe per bin, which makes each bin to have different statistical weight, but this scheme allows us to have sufficient number of data points in the high-z range. Our analysis demonstrated that with the increase of bins number the resulting becomes more messy (see Figure 1a,b). This is because, at high z, there are much less SNe, thus we have much less SNe per bin and the impact of each SNe (and so from the individual uncertainties) increase drastically. For the considered SNe datasets, consideration of even 30 bins per range for JLA is unreasonable, as in this case there appears empty bins. For 25 bins for JLA the minimal number of SNe per bin is just two, which is too small for statistical significance, so that during primary investigation we considered 10, 15 and 20 bins per range. The results suggest that only 10 bins gives more-or-less physical results (see Figure 1a,b, Figure 2a,b, Figure 3a,b and Figure 4a,b), but still fail to reconstruct the potential, so that we obviously need more SNe per bin. Even with as low as five bins (which give four bins for —one bin less from numeric differentiation, thus three bins for for the same reasons), the reconstruction looks better (see Figure 5) but still not good enough for the successful reconstruction of . Overall, one can see that with decrease of the bins number, the agreement between our reconstructed and those from other sources (red and blue data points in Figure 1, Figure 2, Figure 3, Figure 4 and Figure 5 panels (a) and (b)) improves—from around for 10 bins to for 5 bins. For the JLA data even with 10 bins the minimal number of SNe per bin is 2, making this set less favorable for our analysis.
Apart from the binning, it is clear that a major source of the uncertainties—and this time extrinsic uncertainties—is the numerical differentiation. We use it twice—first for and then for . With a parametrized the error propagation would be much simpler and the resulting errors would be much smaller, but, as we mentioned earlier, this would arbitrarily restrict a priori the family of solutions.
Our results for reconstruction demonstrate good agreement with non-SNe-based from [50] and SN-based from [51] within for both 10 bins case (see Figure 4b) and five bins (see Figure 5b), but with higher z they become very noisy. This leads to more inaccurate reconstruction of the and, as a consequence, quite messy reconstruction of both and the kinetic term—both of them enter negative domain, which prevents further reconstruction of the potential in the form.
We also investigated the effect of the and on the reconstructed potential—but even with varying both and within more-or-less accepted range, we failed to find values which lead to the kinetic term reconstruction with no negative values. This may indicate the problem with the data (some unaccounted issues with data reduction), with binning, or overestimation of and/or .
5. Conclusions
We have described a scheme for the reconstruction of the potential of the scalar field, which is supposed to be responsible for the accelerated expansion. The described scheme is tested with real SNe data available today—Union2.1 and JLA datasets. We tested two binning techniques—equal-N and equal-z binning—with different number of SNe per bin for the former, and different number of bins per entire z range for the latter, and find it that only equal-z with number of bins no more then 10 gives us the reconstruction of which is in agreement with independent estimations within . The reconstructed and the kinetic term disallow further reconstruction of the since the reconstructed kinetic term enters in the negative domain. Based on the discussion of the previous section, we believe that the following points, which shall be implemented in the papers to follow, would improve the results of the reconstruction.
First, it could be useful to find a specific binning—with high enough number of SNe per bin and enough bins per z to reconstruct all necessary quantities with good precision. Indeed, as we mentioned, with five bins for , we recover only three bins for the potential, which is quite low number of data points. This way we could utilize low density of SNe at high z to create as many bins as possible, and wisely split low-z domain to a number of bins which create as smooth as possible reconstructed and its derivative. Of course, this binning will be “artificial”, but, as we discussed, it still will be representative and will serve our cause.
Second, it is possible that the resulting binning will not have bins equally spaced over z, which will increase errors coming from the numerical differentiation. To counter that, we can forecast the reconstruction method with future more precise and more extended observations.
Third, we might resort to other methods to deal with reconstruction, in particular the so-called Gaussian Process (see, e.g., [40]). In this method, one assumes that every point in the reconstructed curve is correlated with every other point with a given correlation function that depend on a small number of parameters. This correlation is of course assumed totally by hand but experience with noisy data show that indeed it leads to a robust reconstruction.
To conclude, usage of more precise data, together with advanced binning techniques or reconstruction methods, might lead to more realistic Dark Energy scalar field potential reconstruction.
Acknowledgments
Arpine Piloyan thanks DAAD and FAPEMA (under project BPV-00040/16) for support. Sergey Pavluchenko was supported by FAPEMA under project BPV-00038/16. Luca Amendola acknowledges support from the DFG TR33 “The Dark Universe” project.
Author Contributions
The project is set and prior data analysis were made by Luca Amendola and Arpine Piloyan. Whole further improvements of data analysis are made by Sergey Pavluchenko. Paper wrote by Sergey Pavluchenko, Arpine Piloyan and Luca Amendola. All the research is done under the guidance of Luca Amendola.
Conflicts of Interest
The authors declare no conflict of interest.
References
- Riess, A.G.; Filippenko, A.V.; Challis, P.; Clocchiatti, A.; Diercks, A.; Garnavich, P.M.; Gilliland, R.L.; Hogan, C.J.; Jha, S.; Kirshner, R.P.; et al. Observational Evidence from Supernovae for an Accelerating Universe and a Cosmological Constant. Astron. J. 1998, 116, 1009–1038. [Google Scholar] [CrossRef]
- Perlmutter, S.; Aldering, G.; Goldhaber, G.; Knop, R.A.; Nugent, P.; Castro, P.G.; Deustua, S.; Fabbro, S.; Goobar, A.; Groom, D.E.; et al. Measurements of Ω and Λ from 42 High-Redshift Supernovae. Astrophys. J. 1999, 517, 565–586. [Google Scholar] [CrossRef]
- Carroll, S.M. The Cosmological Constant. Living Rev. Relativ. 2001, 4, 1. [Google Scholar] [CrossRef] [PubMed]
- Padmanabhan, T. Cosmological constant-the weight of the vacuum. Phys. Rep. 2003, 380, 235–320. [Google Scholar] [CrossRef]
- Sahni, V.; Starobinsky, A.A. The Case for a Positive Cosmological Λ-Term. Int. J. Mod. Phys. D 2000, 9, 373–443. [Google Scholar] [CrossRef]
- Caldwell, R.R. A phantom menace? Cosmological consequences of a dark energy component with super-negative equation of state. Phys. Lett. B 2002, 545, 23–29. [Google Scholar] [CrossRef]
- Padmanabhan, T. Accelerated expansion of the Universe driven by tachyonic matter. Phys. Rev. D 2002, 66, 021301. [Google Scholar] [CrossRef]
- Dvali, G.R.; Gabadadze, G.; Porratti, M. 4D gravity on a brane in 5D Minkowski space. Phys. Lett. B 2000, 485, 208–214. [Google Scholar] [CrossRef]
- Esposito-Farese, G.; Polarski, D. Scalar-tensor gravity in an accelerating Universe. Phys. Rev. D 2001, 63, 063504. [Google Scholar] [CrossRef]
- De Felice, A.; Tsujikawa, S. f(R) theories. Living Rev. Relativ. 2010, 13, 3. [Google Scholar] [CrossRef] [PubMed]
- Nojiri, S.; Odintsov, S.D. Unified cosmic history in modified gravity: From F(R) theory to Lorentz non-invariant models. Phys. Rep. 2011, 505, 59–144. [Google Scholar] [CrossRef]
- Li, M. A model of holographic dark energy. Phys. Lett. B 2004, 603, 1–5. [Google Scholar] [CrossRef]
- Pavón, D.; Zimdahl, W. Holographic dark energy and cosmic coincidence. Phys. Lett. B 2005, 628, 206–210. [Google Scholar] [CrossRef]
- Kamenshchik, A.; Moschella, U.; Pasquier, V. An alternative to quintessence. Phys. Lett. B 2001, 511, 265–268. [Google Scholar] [CrossRef]
- Bento, M.C.; Bertolami, O.; Sen, A.A. Generalized Chaplygin gas, accelerated expansion, and dark-energy-matter unification. Phys. Rev. D 2002, 66, 043507. [Google Scholar] [CrossRef]
- Bean, R.; Doré, O. Are Chaplygin gases serious contenders for the dark energy? Phys. Rev. D 2003, 68, 023515. [Google Scholar] [CrossRef]
- Sen, A.A.; Scherrer, R.J. Generalizing the generalized Chaplygin gas. Phys. Rev. D 2005, 72, 063511. [Google Scholar] [CrossRef]
- Deffayet, C.; Dvali, G.; Gabadadze, G. Accelerated Universe from gravity leaking to extra dimensions. Phys. Rev. D 2002, 65, 044023. [Google Scholar] [CrossRef]
- Fardon, R.; Nelson, A.E.; Weiner, N. Dark energy from mass varying neutrinos. JCAP 2004. [Google Scholar] [CrossRef]
- Peccei, R.D. Neutrino models of dark energy. Phys. Rev. D 2005, 71, 023527. [Google Scholar] [CrossRef]
- Kleidis, K.; Spyrou, N.K. Dark energy: The shadowy reflection of dark matter? Entropy 2016, 18, 94. [Google Scholar] [CrossRef]
- Freese, K.; Lewis, M. Cardassian expansion: A model in which the Universe is flat, matter dominated and accelerating. Phys. Lett. B 2002, 540, 1–8. [Google Scholar] [CrossRef]
- Gondolo, P.; Freese, K. Fluid interpretation of Cardassian expansion. Phys. Rev. D 2003, 68, 063509. [Google Scholar] [CrossRef]
- Wang, Y.; Freese, K.; Gondolo, P.; Lewis, M. Future Type Ia Supernova data as tests of dark energy from modified Friedmann equations. Astrophys. J. 2003, 594, 25. [Google Scholar] [CrossRef]
- Horndeski, G.W. Second-Order Scalar-Tensor Field Equations in a Four-Dimensional Space. Int. J. Theor. Phys. 1974, 10, 363–384. [Google Scholar] [CrossRef]
- Starobinsky, A.A. How to determine an effective potential for a variable cosmological term. JETP Lett. 1998, 68, 757–763. [Google Scholar] [CrossRef]
- Ellis, G.F.R.; Madsen, M.S. Exact scalar field cosmologies. Class. Quantum Gravity 1991, 8, 667. [Google Scholar] [CrossRef]
- Huterer, D.; Turner, M.S. Prospects for probing the dark energy via supernova distance measurements. Phys. Rev. D 1999, 60, 081301. [Google Scholar] [CrossRef]
- Saini, T.D.; Raychaudhury, S.; Sahni, V.; Starobinsky, A.A. Reconstructing the Cosmic Equation of State from Supernova Distances. Phys. Rev. Lett. 2000, 85, 1162. [Google Scholar] [CrossRef] [PubMed]
- Weller, J.; Albrecht, A. Future supernovae observations as a probe of dark energy. Phys. Rev. D 2002, 65, 103512. [Google Scholar] [CrossRef]
- Alam, U.; Sahni, V.; Saini, T.D.; Starobinsky, A.A. Exploring the Expanding Universe and Dark Energy using the Statefinder Diagnostic. Mon. Not. R. Astron. Soc. 2003, 344, 1057–1074. [Google Scholar] [CrossRef]
- Daly, R.A.; Djorgovski, S.G. A Model-Independent Determination of the Expansion and Acceleration Rates of the Universe as a Function of Redshift and Constraints on Dark Energy. Astrophys. J. 2003, 597, 9. [Google Scholar] [CrossRef]
- Alam, U.; Sahni, V.; Starobinsky, A.A. The case for dynamical dark energy revisited. JCAP 2004, 008. [Google Scholar] [CrossRef]
- Wang, Y.; Tegmark, M. New dark energy constraints from supernovae, microwave background and galaxy clustering. Phys. Rev. Lett. 2004, 92, 241302. [Google Scholar] [CrossRef] [PubMed]
- Daly, R.A.; Djorgovski, S.G. Direct Determination of the Kinematics of the Universe and Properties of the Dark Energy as Functions of Redshift. Astron. J. 2004, 612, 652. [Google Scholar] [CrossRef]
- Shafieloo, A.; Alam, U.; Sahni, V.; Starobinsky, A. Smoothing Supernova Data to Reconstruct the Expansion History of the Universe and its Age. Mon. Not. R. Astron. Soc. 2006, 366, 1081–1095. [Google Scholar] [CrossRef]
- Shafieloo, A. Model Independent Reconstruction of the Expansion History of the Universe and the Properties of Dark Energy. Mon. Not. R. Astron. Soc. 2007, 380, 1573–1580. [Google Scholar] [CrossRef]
- Clarkson, C.; Zunckel, C. Direct reconstruction of dark energy. Phys. Rev. Lett. 2010, 104, 211301. [Google Scholar] [CrossRef] [PubMed]
- Lazkoz, R.; Salzano, V.; Sendra, I. Revisiting a model-independent dark energy reconstruction method. Eur. Phys. J. C 2012, 72, 2130. [Google Scholar] [CrossRef]
- Seikel, M.; Clarkson, C.; Smith, M. Reconstruction of dark energy and expansion dynamics using Gaussian processes. JCAP 2012, 6, 036. [Google Scholar] [CrossRef]
- Dunsby, P.K.S.; Luongo, O. On the theory and applications of modern cosmography. Int. J. Geom. Meth. Mod. Phys. 2016, 13, 1630002. [Google Scholar] [CrossRef]
- Aviles, A.; Gruber, C.; Luongo, O.; Quevedo, H. Cosmography and constraints on the equation of state of the Universe in various parametrizations. Phys. Rev. D 2012, 12, 123516. [Google Scholar] [CrossRef]
- Gruber, C.; Luongo, O. Cosmographic analysis of the equation of state of the universe through Padé approximations. Phys. Rev. D 2014, 89, 103506. [Google Scholar] [CrossRef]
- Aviles, A.; Bravetti, A.; Capozziello, S.; Luongo, O. Precision cosmology with Padé rational approximations: Theoretical predictions versus observational limits. Phys. Rev. D 2014, 90, 043531. [Google Scholar] [CrossRef]
- Capozziello, S.; De Laurentis, M.; Luongo, O.; Ruggeri, A.C. Cosmographic Constraints and Cosmic Fluids. Galaxies 2013, 1, 216–260. [Google Scholar] [CrossRef]
- De la Cruz-Dombriz, A.; Dunsby, P.K.S.; Luongo, O.; Reverberi, L. Model-independent limits and constraints on extended theories of gravity from cosmic reconstruction techniques. JCAP 2016, 12, 042. [Google Scholar] [CrossRef]
- Aviles, A.; Bravetti, A.; Capozziello, S.; Luongo, O. Updated constraints on f(R) gravity from cosmography. Phys. Rev. D 2013, 87, 044012. [Google Scholar] [CrossRef]
- Aviles, A.; Bravetti, A.; Capozziello, S.; Luongo, O. Cosmographic reconstruction of f(T) cosmology. Phys. Rev. D 2013, 87, 064025. [Google Scholar] [CrossRef]
- Capozziello, S.; D’Agostino, R.; Luongo, O. Model-independent reconstruction of f(T) teleparallel cosmology. Gen. Relativ. Gravit. 2017, 49, 141. [Google Scholar] [CrossRef]
- Moresco, M.; Pozzetti, L.; Cimatti, A.; Jimenez, R.; Maraston, C.; Verde, L.; Thomas, D.; Citro, A.; Tojeiro, R.; Wilkinson, D. A 6% measurement of the Hubble parameter at z 0.45: Direct evidence of the epoch of cosmic re-acceleration. JCAP 2016, 5, 014. [Google Scholar] [CrossRef]
- Riess, A.; Rodney, S.A.; Scolnic, D.M.; Shafer, D.L.; Strolger, L.G.; Ferguson, H.C.; Postman, M.; Graur, O.; Maoz, D.; Jha, S.W.; et al. Type Ia Supernova Distances at z > 1.5 from the Hubble Space Telescope Multi-Cycle Treasury Programs: The Early Expansion Rate. arXiv, 2017; arXiv:1710:00844. [Google Scholar]
- Wang, D.; Meng, X.-H. Model-independent determination on H0 using the latest H(z) data. Sci. China Phys. Mech. Astron. 2017, 60, 110411. [Google Scholar] [CrossRef]
- Zhang, C.; Zhang, H.; Yuan, S.; Liu, S.; Zhang, T.J.; Sun, Y.C. Four New Observational H(z) Data From Luminous Red Galaxies of Sloan Digital Sky Survey Data Release Seven. Res. Astron. Astrophys. 2014, 14, 1221. [Google Scholar] [CrossRef]
- Copeland, E.J.; Liddle, A.R.; Wands, D. Exponential potentials and cosmological scaling solutions. Phys. Rev. D 1998, 57, 4686. [Google Scholar] [CrossRef]
- Tsujikawa, S.; Sami, M. A unified approach to scaling solutions in a general cosmological background. Phys. Lett. B 2004, 603, 113–123. [Google Scholar] [CrossRef]
- Steinhardt, P.J.; Wang, L.; Zlatev, I. Cosmological Tracking Solutions. Phys. Rev. D 1999, 59, 123504. [Google Scholar] [CrossRef]
Figure 1.
Results for : areas of for each bin and the central values for the following cases and datasets: (a,b) Equal-z binning of the Union2.1 data—10 bins in green, 15 bins in cyan and 20 bins in dark green—for “large-scale” data (a); and physically-significant range (b). (c,d) Equal-N binning of the Union2.1 data— in green and in dark green—for “large-scale” data (c); and physically-significant range (d). (e,f) Equal-N with 10 bins in green and equal-N binning of the JLA data— in cyan and in dark green—for “large-scale” data (e); and physically-significant range (f). Additionally, in (b,d,f), we added non-SNe data points with errors in red (see text for more details).

Figure 2.
Results for recovering: areas of for each bin and the central values for the following cases and datasets: (a,b) Equal-z binning of the Union2.1 data—10 bins in green, 15 bins in cyan and 20 bins in dark green—for “large-scale” data (a); and physically-significant range (b). (c,d) Equal-N binning of the Union2.1 data— in green and in dark green—for “large-scale” data (c); and physically-significant range (d). (e,f) Equal-N with 10 bins in green and equal-N binning of the JLA data— in cyan and in dark green—for “large-scale” data (e); and physically-significant range (f). (see the text for more details).

Figure 3.
Results for recovering: areas of for each bin and the central values for the following cases and datasets: (a,b) Equal-z binning of the Union2.1 data—10 bins in green, 15 bins in cyan and 20 bins in dark green—for “large-scale” data (a); and physically-significant range (b). (c,d) Equal-N binning of the Union2.1 data— in green and in dark green—for “large-scale” data (c); and physically-significant range (d). (e,f) Equal-N with 10 bins in green and equal-N binning of the JLA data— in cyan and in dark green—for “large-scale” data (e); and physically-significant range (f). (see the text for more details).
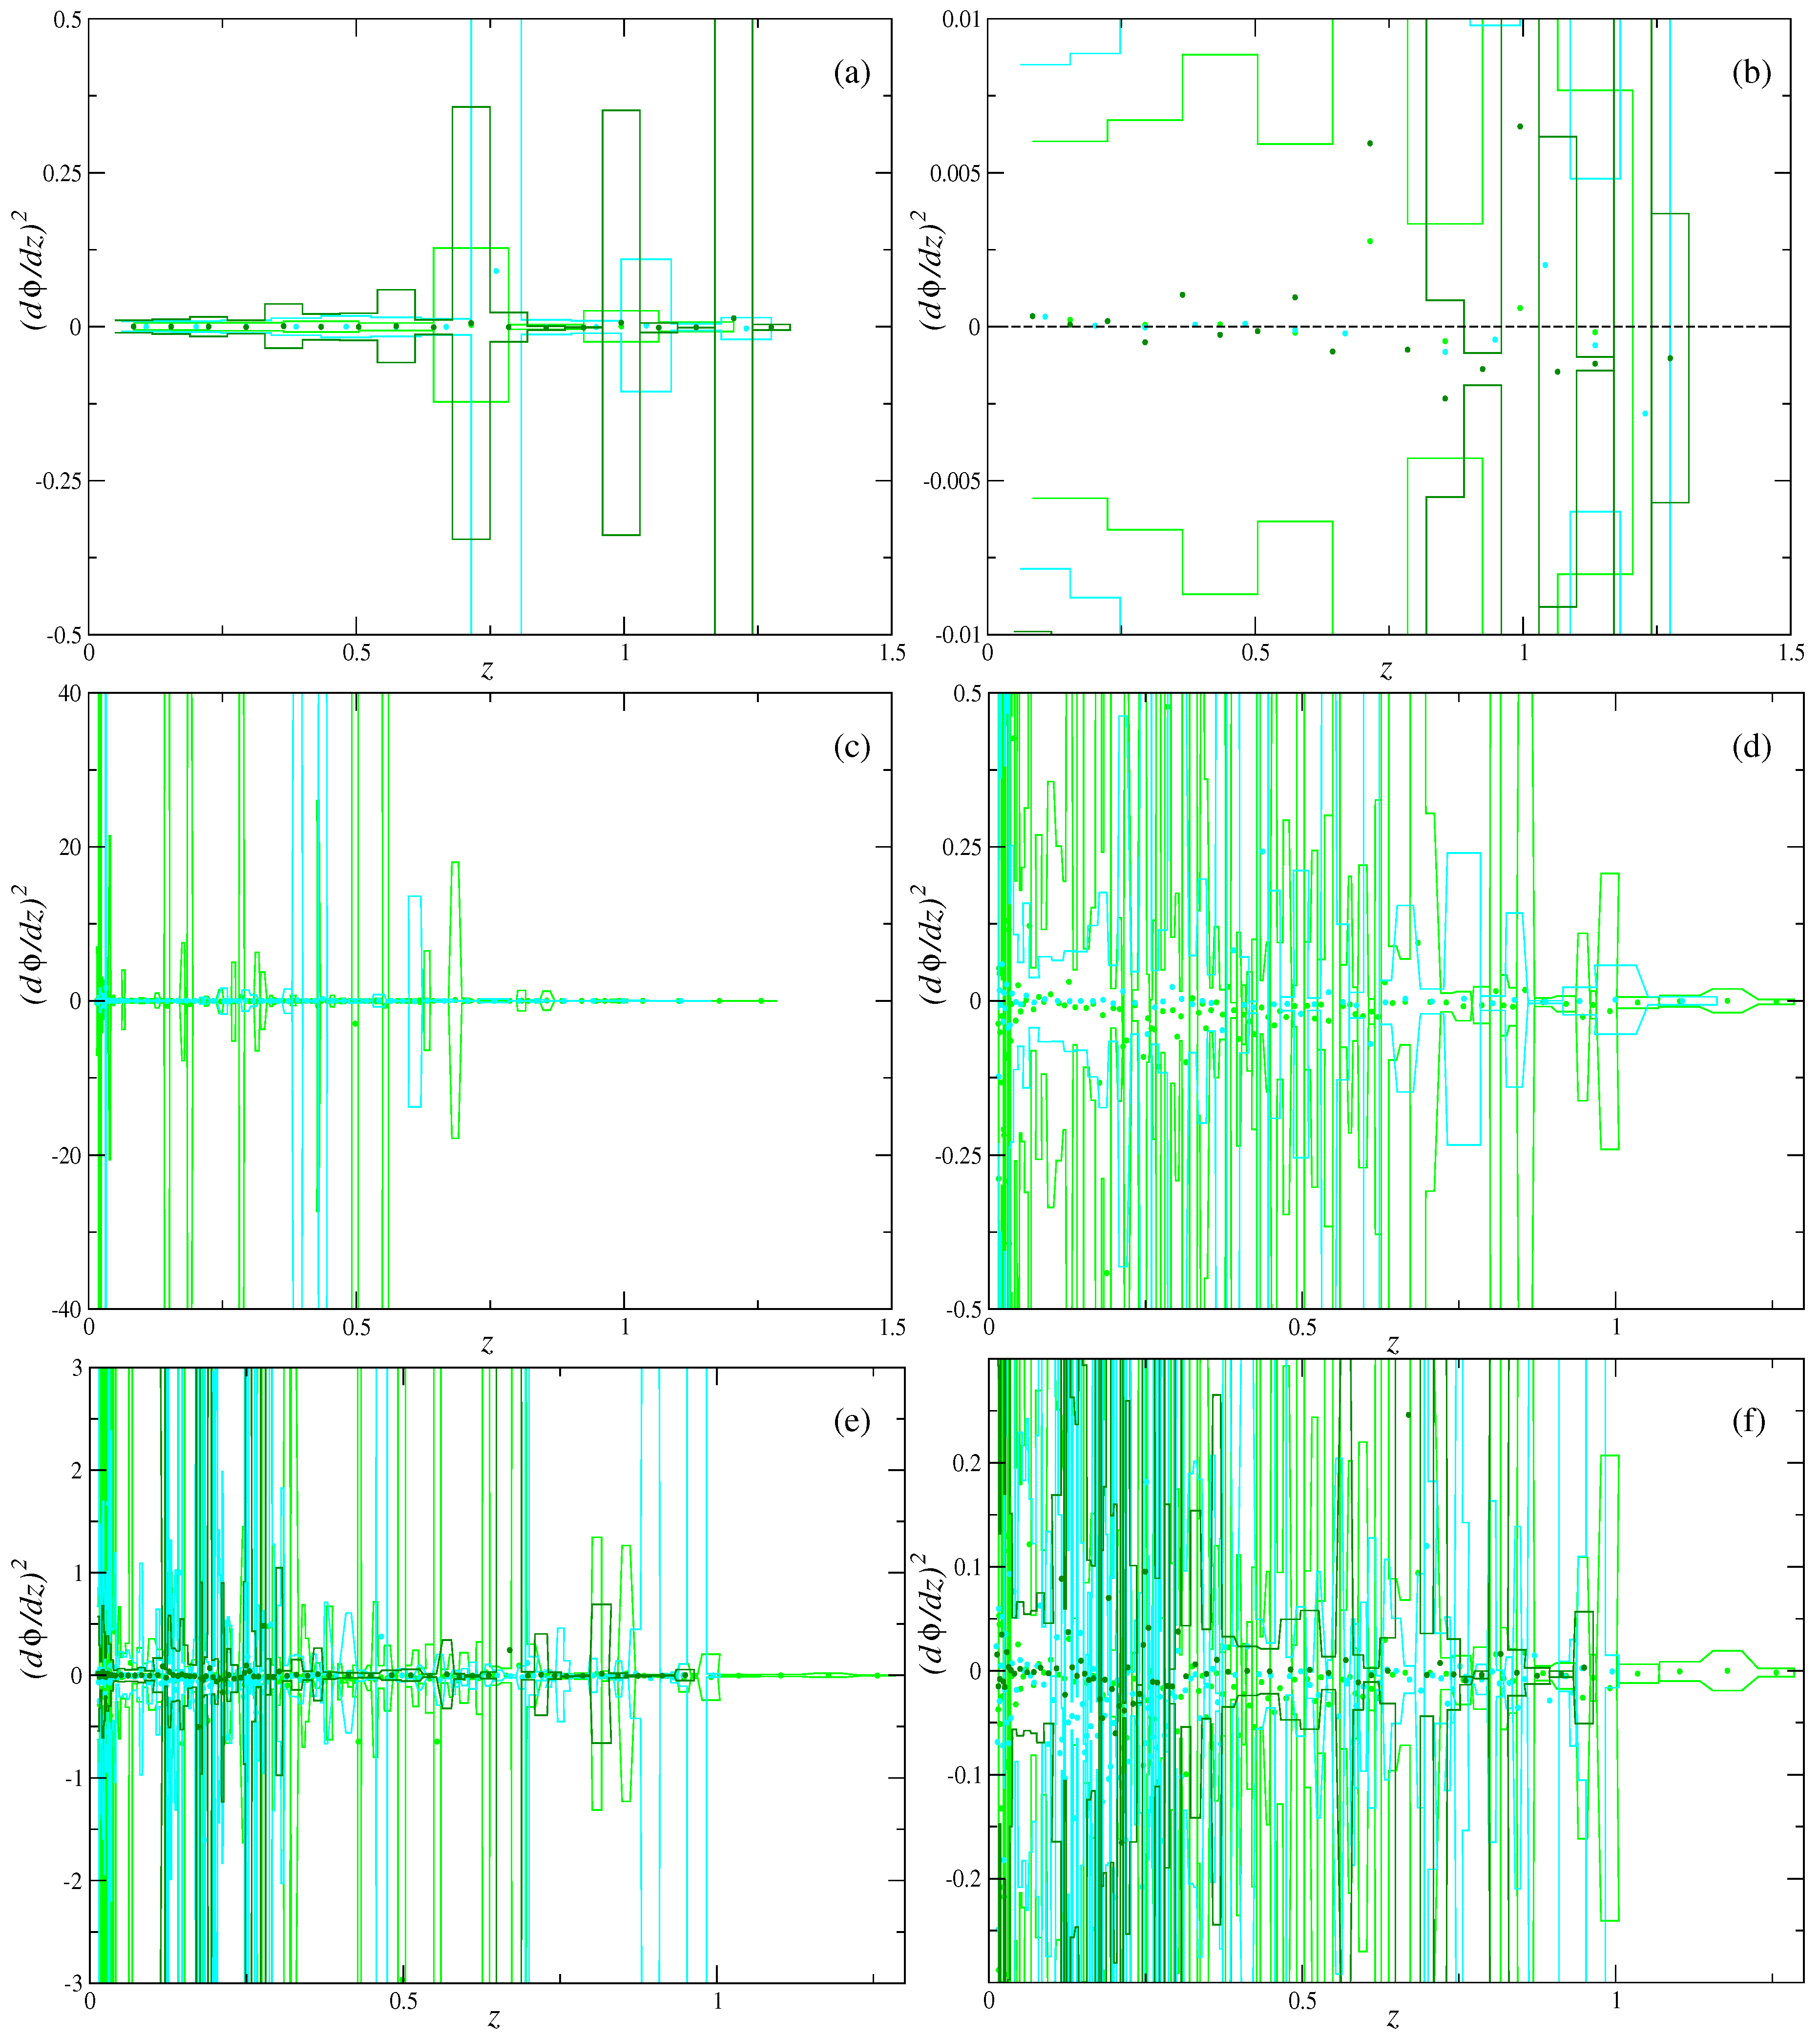
Figure 4.
Combined results for equal-z binning with 10 bins (green points correspond to Union2.1 and cyan to JLA data): (a,b) with non-SNe data from [50] as red points and data from [51] as blue points; (c) recovered ; (d) recovered ; (e) the effect of the variation of ; and (f) the effect of the variation (see the text for more details).
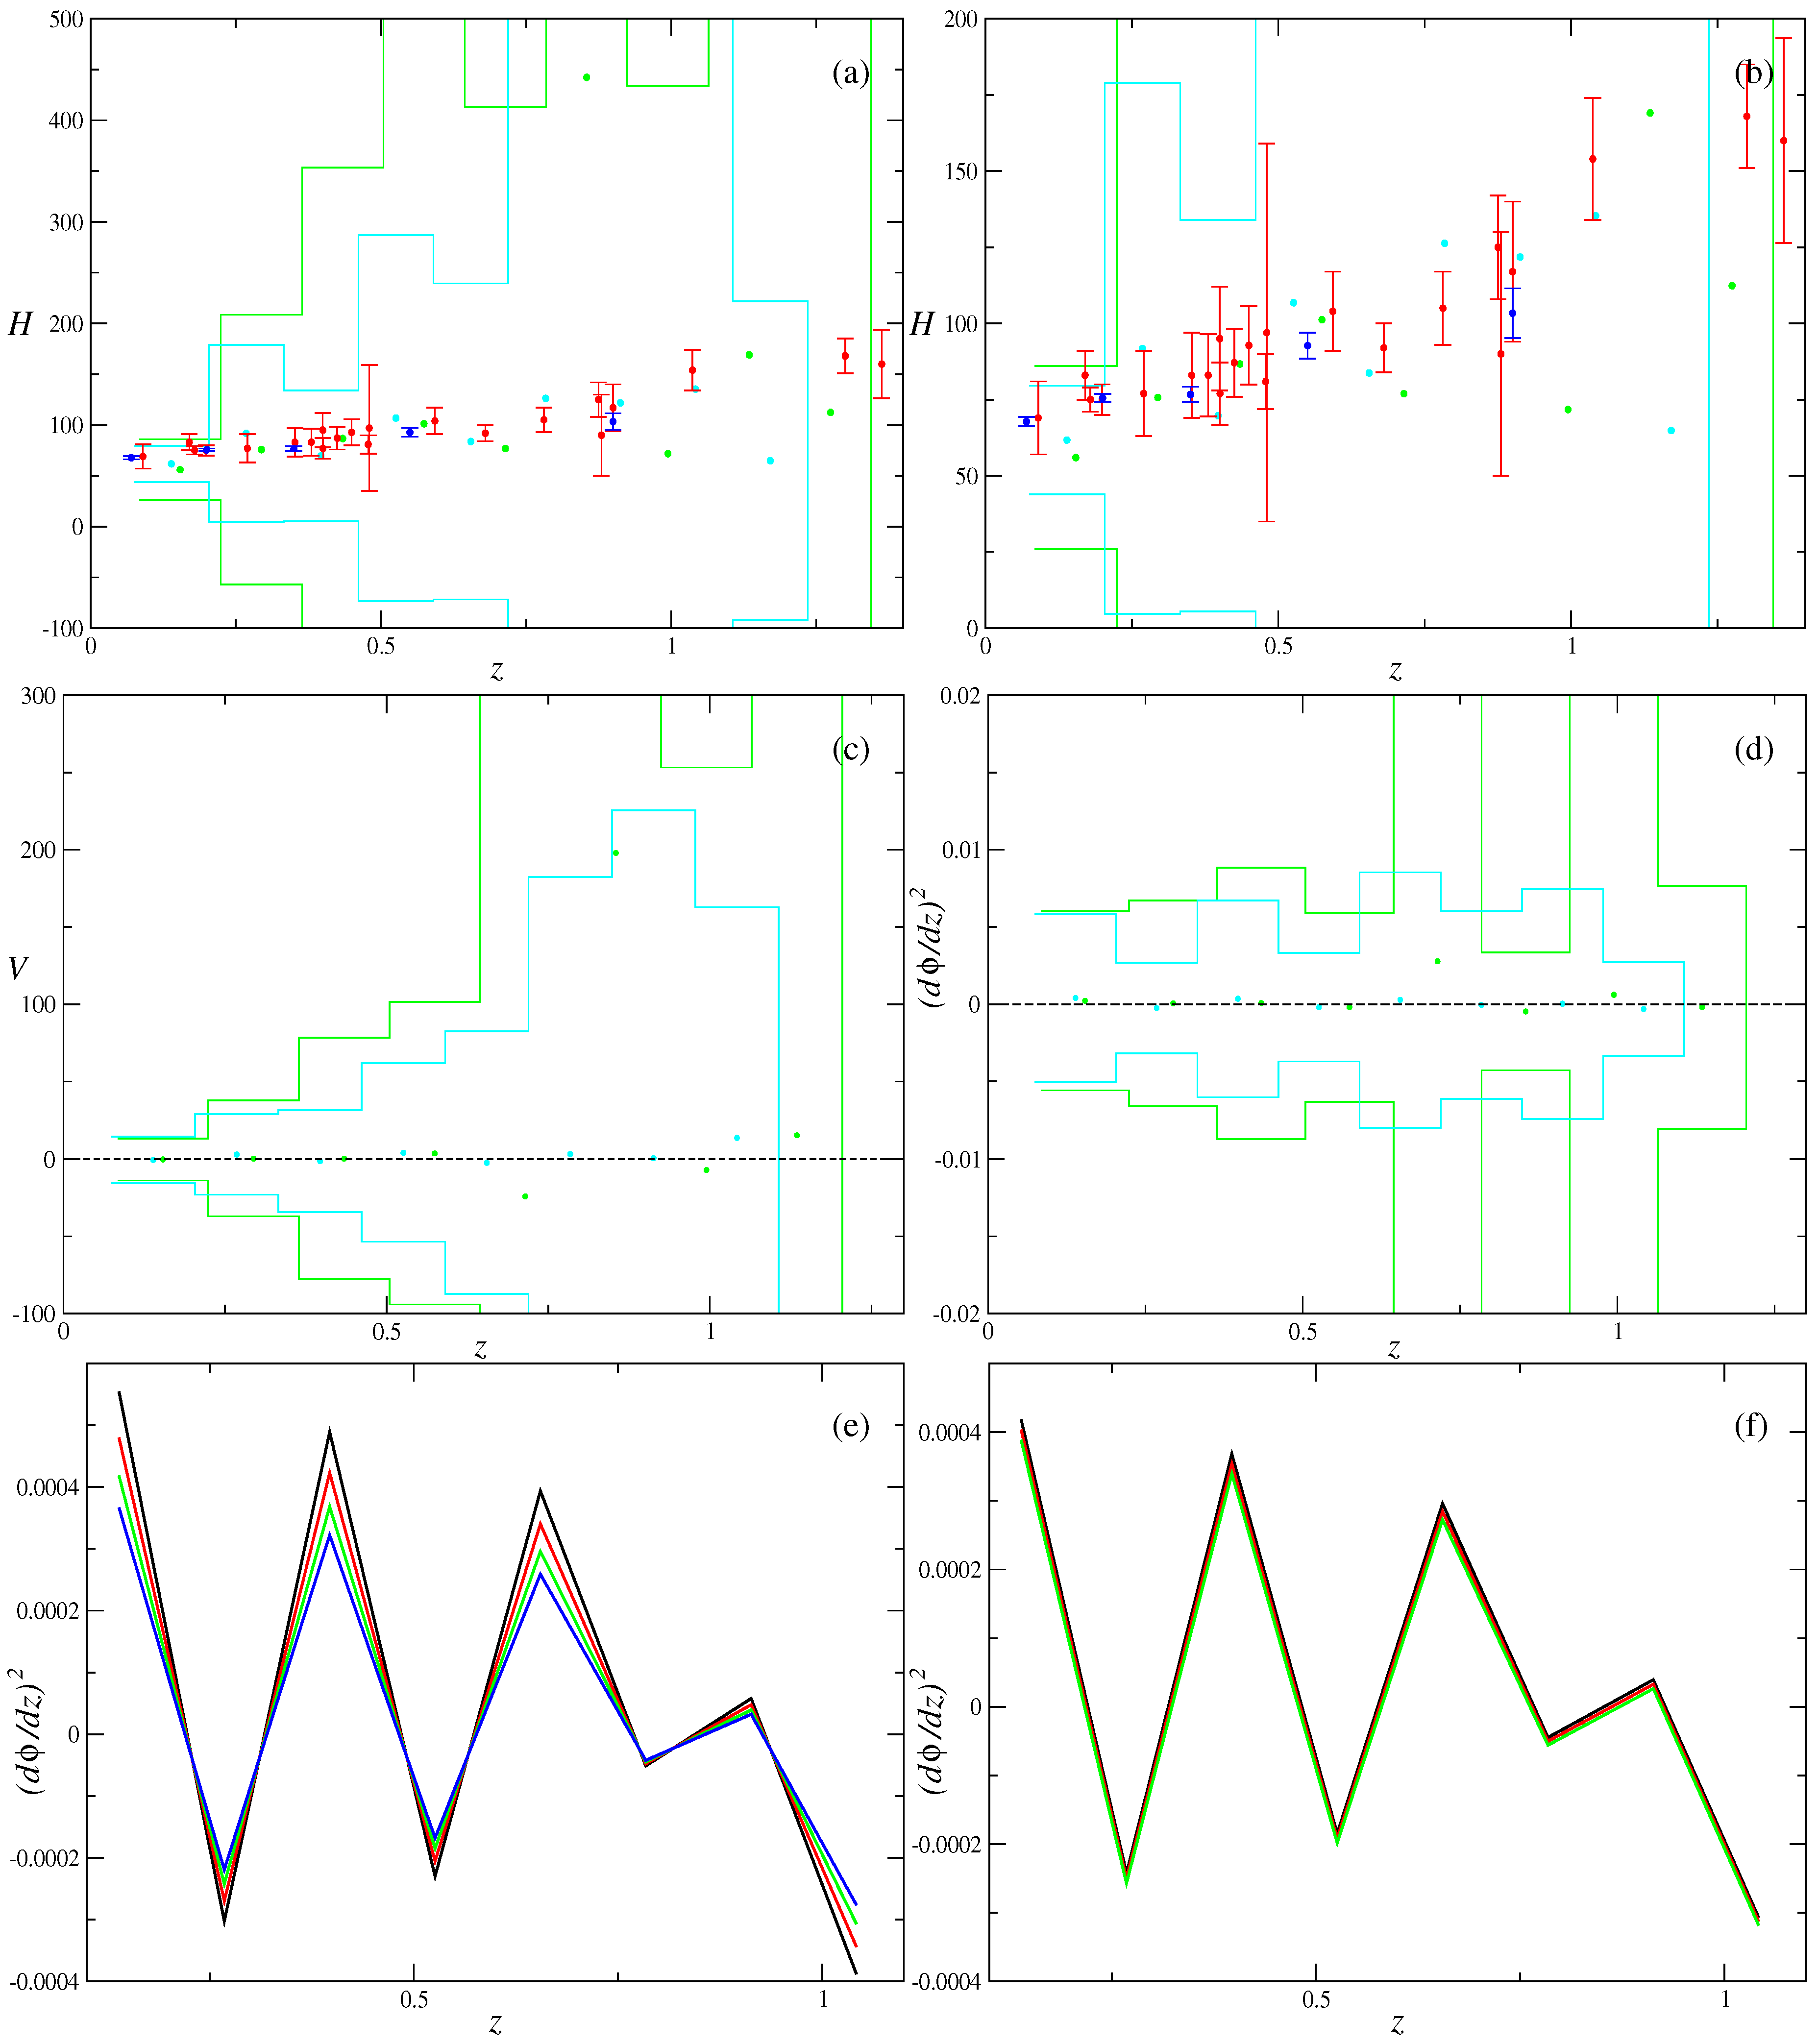
Figure 5.
Combined results for equal-z binning with five bins (green points correspond to Union2.1 and brown to JLA data); central values designed as filled circles while error areas are bounded by the line of the same color: (a,b) with non-SNe data from [50] as red points and data from [51] as blue points (“large-scale” (a); and “fine” (b)); (c,d) recovered (“large-scale” (c); and “fine” (d)); and (e,f) recovered (“large-scale” (e); and “fine” (f)). For Union2.1 data, light green corresponds to while dark green to (see the text for more details).
© 2018 by the authors. Licensee MDPI, Basel, Switzerland. This article is an open access article distributed under the terms and conditions of the Creative Commons Attribution (CC BY) license (http://creativecommons.org/licenses/by/4.0/).
Share and Cite
MDPI and ACS Style
Piloyan, A.; Pavluchenko, S.; Amendola, L. Limits on the Reconstruction of a Single Dark Energy Scalar Field Potential from SNe Ia Data. Particles 2018, 1, 23-35. https://doi.org/10.3390/particles1010003
AMA Style
Piloyan A, Pavluchenko S, Amendola L. Limits on the Reconstruction of a Single Dark Energy Scalar Field Potential from SNe Ia Data. Particles. 2018; 1(1):23-35. https://doi.org/10.3390/particles1010003
Chicago/Turabian StylePiloyan, Arpine, Sergey Pavluchenko, and Luca Amendola. 2018. "Limits on the Reconstruction of a Single Dark Energy Scalar Field Potential from SNe Ia Data" Particles 1, no. 1: 23-35. https://doi.org/10.3390/particles1010003