Drying-Wetting Cycles: Effect on Deep Soil Carbon
by
 , and
, and
Ji Qi
1,*,†, 
Daniel Markewitz
1,
Maryam Foroughi
1,
Eric Jokela
2,
Brian Strahm
3 and
Jason Vogel
2 1
Warnell School of Forestry and Natural Resources, University of Georgia, Athens, GA 30602, USA
2
School of Forest Resources and Conservation, University of Florida, Gainesville, FL 32608, USA
3
Department of Forest Resources and Environmental Conservation, Virginia Tech, Blacksburg, VA 24061, USA
*
Author to whom correspondence should be addressed.
†
Current address: Joseph W. Jones Ecological Research Center, 3988 Jones Center Drive, Newton, GA 39870, USA.
Soil Syst. 2018, 2(1), 3; https://doi.org/10.3390/soils2010003
Submission received: 8 November 2017
/
Revised: 21 December 2017
/
Accepted: 25 December 2017
/
Published: 9 January 2018
(This article belongs to the Special Issue Soil Organic Matter Dynamics)
Abstract
:In the Southeast United States (U.S.), the climate is predicted to be warmer and have more severe drought in the summer. Decreasing rainfall in summer months should create more severe soil drying, which will eventually affect re-wetting cycles deeper in the soil profile. Changing drying-wetting cycles in this deeper portion of the profile may impact the soil C pool, the largest pool of terrestrial C globally. The aim of this research is to study the effect of drying-wetting cycles on deep soil C. A soil incubation experiment was established using four soils that are part of a simulated drought experiment in Oklahoma, Virginia, Georgia, and Florida. Soils were incubated from as many as eight layers up to a depth of 3.0 m. During incubations, soil respiration was generally greatest in surface soils and declined with depth. When compared to soils that were kept constantly moist, drying-wetting cycles did not consistently stimulate more soil respiration. Soil respiration as a proportion of total soil C, however, was higher in soils below 1 m than above. Total C (R2 = 0.82) and hydrolysable C (R2 = 0.77) were the best predictors for soil respiration. Assuming that there was no other factor (i.e., new carbon inputs) affecting soil respiration at depth other than soil moisture cycles, this study indicates that there would be no significant change to soil respiration in deep soils under more severe drying-wetting cycles.
1. Introduction
Climate change models predict that summertime precipitation may decline by 10 to 30% in the Southeast United States (U.S). [1,2], although uncertainty in, and disagreement between, projections remain [3]. Drought may stress soil microbes and plants; and may have implications for nutrient availability, plant productivity, biogeochemical processes, and the C pool in soils [4]. Understanding how drought-induced drying-wetting cycles affect soil respiration is important in predicting the effects of climate change on forest soils and estimating the potential changes in the soil C pool [4].
Soil drying-wetting cycles can result in a pulse of soil respiration (known as the Birch effect), which may exceed the respiration rate of constantly moist soils [5,6]. After a soil wetting, soil respiration can be elevated by as much as 500% when compared with samples that are kept constantly moist, with the CO2 pulse lasting from two days to two weeks [5,7,8,9,10,11,12,13].
Previous research on drying-wetting cycles has mainly focused on surface (0–20 cm) soil C [11,13,14,15]. Fewer studies, however, have looked at subsurface (20–100 cm) [16] and deep (>100 cm) soil C [17]. Globally, more than 50% of soil organic C is found in subsoil horizons (>20 cm) [18]. One estimate found that 27–77% of mineral soil C was below 20 cm depth when soils were sampled to more than 80 cm [19]. Subsurface and deep soils can produce a significant amount of CO2 [20,21]. For example, in a well-drained temperate forest, 27% of soil respiration took place in soils below 15 cm [22]. Shallow soil sampling can result in an underestimate of soil C storage and an inability to adequately measure the impacts of management or climate changes over time in whole-ecosystem studies [19].
Presently, it is unknown if the mechanisms controlling drying-wetting responses in topsoil differ from those in deeper soil. There is, however, clear evidence that the forms of soil C can differ in these two portions of the profile. In a study conducted on a sandy clay loam soil in California, the proportion of soil organic matter with a density <1.6 g/cm3 (primarily undecomposed plant material and charcoal) decreased with depth, making up 20% or more of the total C in the upper 18 cm, but less than 10% for the deeper soil [22]. Another study in Amazonian forest soils found similar results; soil organic C with a density <2 g/cm3 comprised about 30% of the total soil C pool for the upper 10 cm, but the proportion dropped rapidly, with depth to <5% [23]. For the soil organic matter with density >2 g/cm3 (e.g., altered plant matter, microbial cell wall debris and organic matter adsorbed to clay) the ratio of hydrolysable C (removable by acid treatment, e.g., amino acids, proteins, carbohydrates, and simple sugars) to non-hydrolysable C (not removable by acid treatment) also decreased from 2:1 in the upper soil to 1:1 in the deeper soil [22]. One study directly addressing dynamic soil C properties found that soil respiration at 50, 100 and 200 cm responded differently to change in temperature, and to water and nutrient availability relative to the surface soil (0–25 cm) [17]. Due to the different forms of C in deep soils, it is possible that the mechanisms controlling drying-wetting response differ as well.
In addition to differences in states of soil C (i.e., particulate or hydrolysable) with depth, different mineralization rates have also been observed. Subsurface soil organic C mineralization rates are generally lower and have longer mean residence times than surface soil organic C [24]. One study that was conducted in a grassland soil in France showed that surface soil C has a mean residence time of ~300 years, while subsurface soil C has a mean residence time of ~3000 years [16]. Mineralization rates have been demonstrated to relate to fractionation of soil organic C, separated by their physical or chemical properties. Low density C fractions (<2 g/cm3), except charcoal, turns over on a time scale of decades or less [25]. The mean residence time of hydrolysable C is several centuries, while the age of non-hydrolysable material could be thousands of years [22]. It is uncertain, however, which C fraction is a good indicator for potential soil respiration at depth.
We hypothesized that drying-wetting cycles will stimulate deep soil respiration on a relative basis more than it will simulate surface soil respiration. We tested our hypothesis with soil samples that were collected from four locations across the Southeast U.S., which were part of a study simulating increased drought (i.e., through fall exclusion, see Will et al. [26]). Multiple depths from 0 to 3 m were incubated for three drying-wetting cycles with the first 48 h of each wetting period used for calculation. Heterotrophic soil respiration was measured during all the wetting periods, and were then compared to total soil C content, water extractable C content, light, hydrolysable, and residual C fractions.
2. Materials and Methods
2.1. Site Description
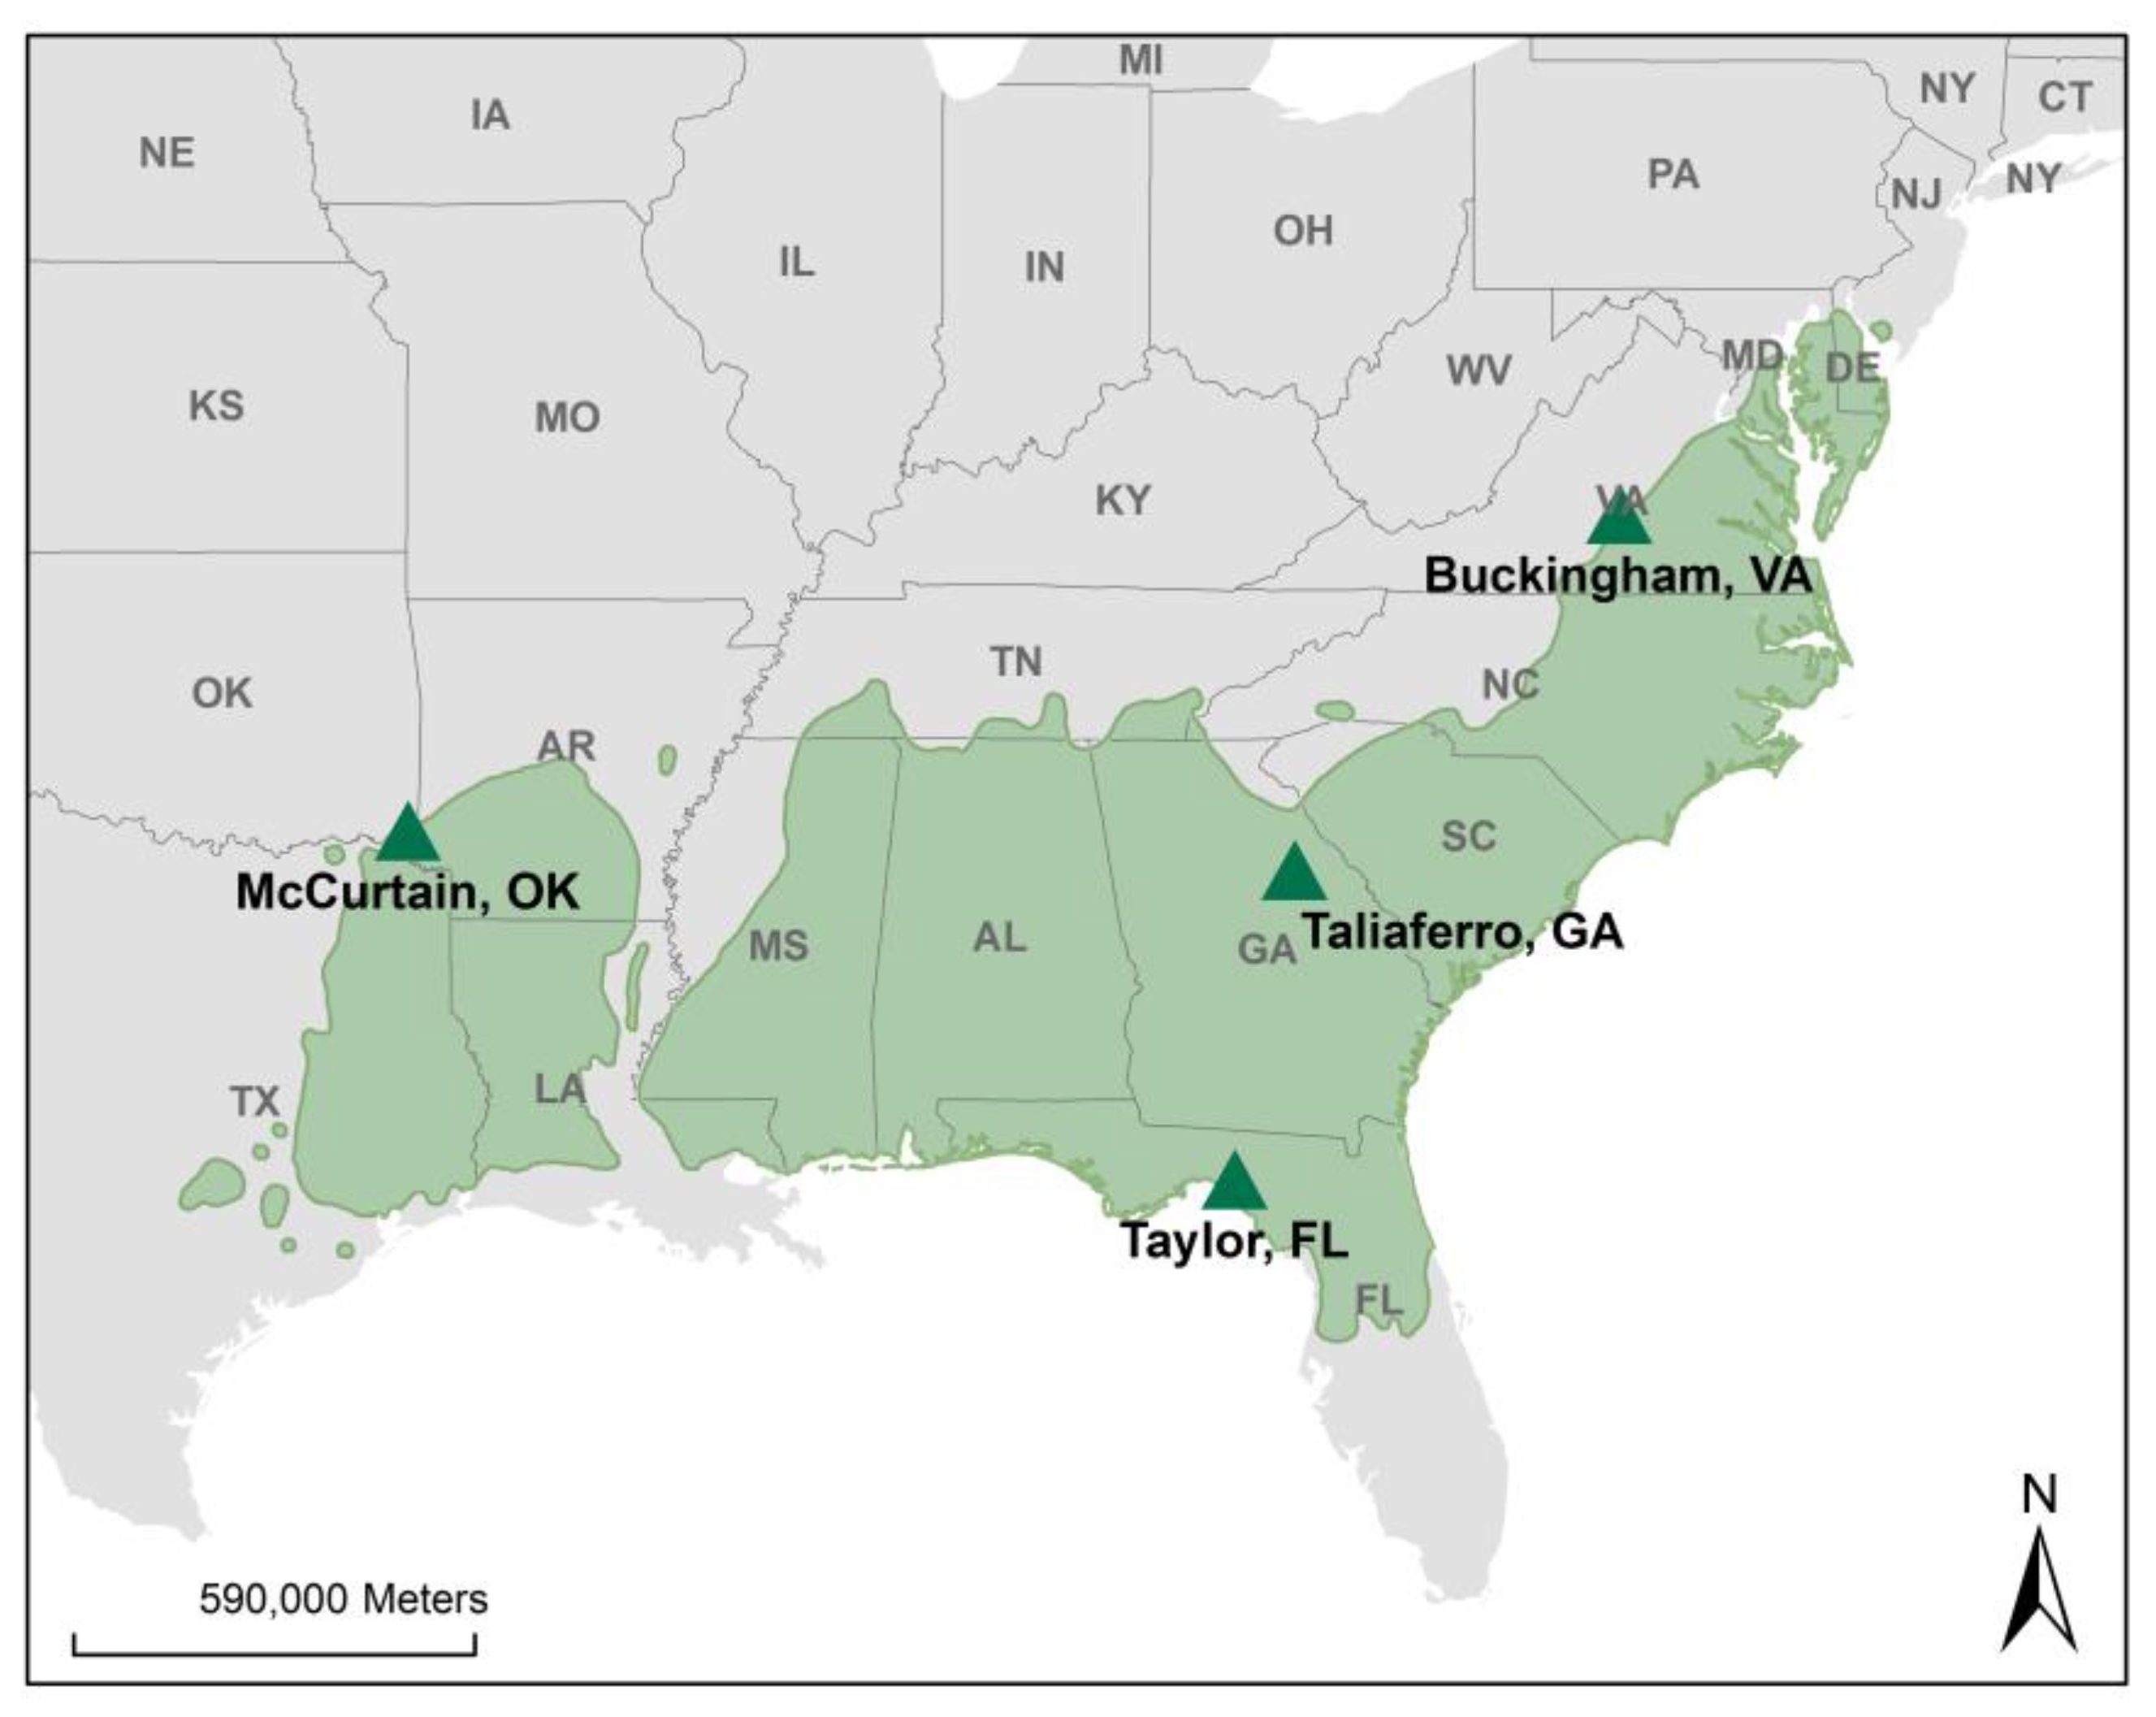
The soils used in this incubation study came from four loblolly pine plantations that comprise a largescale throughfall reduction × fertilization experiment. The four plantations were established at the edges of the loblolly pine range, which span the full temperature and precipitation range of the species (Figure 1). The sites are located in McCurtain County, Oklahoma; Buckingham County, Virginia; Taliaferro County, Georgia; and, Taylor County, Florida. Among these four locations, the 30 year (1981–2010) average annual precipitation ranged from 1.1 to 1.4 m and the annual temperature ranged from a low of 6.7 °C to a high of 27.3 °C (Table 1) [27].
For this incubation experiment soils were sampled in the control plots of each research site. More details of the field experiment can be found in Will et al. [26]. Soils in each location were comprised of Ruston (McCurtain, Oklahoma), Littlejoe (Buckingham, Virginia), Cecil-Lloyd complex (Taliaferro, Georgia), and Melvina-Moriah-Lutterloh complex (Taylor, Florida). The first three complexes are largely Ultisols, while Florida soils consist of Spodosol and Alfisol. Soil samples from Oklahoma, Virginia, and Georgia contain clay to loam texture argillic or kandic horizons, while soils from Florida contain sand texture with a spodic horizon. All of the samples were acidic, with pH ranging from 3.6 to 6.2 (Table 2).
Soils were sampled at eight depths (when possible): 0–10, 10–20, 20–50, 50–100, 100–150, 150–200, 200–250, and 250–300 cm. Two samples were collected at each depth of each research site. These samples were later split into subsamples for laboratory analyses.
- Oklahoma: the Ruston series is a fine-loamy, siliceous, semiactive, thermic Typic Paleudult. Two profiles (four depth, eight samples) were collected to 100 cm, due to shallow soil solum.
- Virginia: Littlejoe is a fine, mixed, subactive, mesic Typic Hapludult. Due to shallow soil solum, two soil profiles (five depth, 10 samples) were collected to a depth of 150 cm.
- Georgia: the Lloyd series is a fine, kaolinitic, thermic Rhodic Kanhapludult, while the Cecil series is a fine, kaolinitic, thermic Typic Kanhapludult. The Rhodic designation indicates an influence of mafic parental material on soil color. Two soil profiles (eight depth, 16 samples) were collected to 300 cm.
- Florida: Melvina is a sandy, siliceous, thermic Oxyaquic Alorthod; Moriah is loamy, siliceous, superactive, thermic Aquic Arenic Hapludalf; while Lutterloh is loamy, siliceous, subactive, thermic Grossarenic Paleudalf. Due to high water table at the Florida site, two soil profiles (six depth, 12 samples) were collected to 170 cm.
These soils are typical in their respective regions. All of the soil series descriptions are based on USDA-NRCS Soil Survey Division [28].
2.2. Soil Physical and Chemical Analysis
All samples were air-dried and homogenized by sieving through a 2 mm screen. A subsample was analyzed in replicate for soil texture, pH, total C and N, and water extractable C. Textural analysis followed Gee and Or [29] and soil water pH tests followed the method of Thomas [30] with a 1:1 soil:water ratio. For C and N analysis samples were further oven-dried at 65 °C and ball mill ground. Total C (TC) and N were analyzed on a CE Elantech NC 2100 Soil Analyzer with a detection limit of 100 µg C/g soil (CE Elantech Inc., Lakewood, NJ, USA) using the Dumas method, as described by Bremmer [31].
2.3. Soil C Fractionation
All of the soil samples were analyzed for water extractable C (WE). Ten grams of air-dried soil was shaken with 100 mL of deionized water for one hour on a reciprocating shaker at a speed of 200 rev/min. After shaking, the extracts were filtered with Whatman No. 42 filter paper to recover solution for analysis [32]. Concentrations of water extractable C were determined with a Shimadzu TOC-TN analyzer (Shimadzu Corp., Kyoto, Japan). Results were then converted to mg C/g soil.
Soil carbon fractionation was performed on all of the soil samples by combining density and hydrolytic fractionation techniques. This method was modified after Trumbore et al. [22] and Golchin et al. [33]. Light fraction, <2.0 g/cm3 (LF), material was physically isolated using sodium polytungstate. The remaining heavy fraction, >2.0 g/cm3, was further fractionated by acid hydrolysis into a hydrolysable fraction (HF) and a residual fraction (RF). The bulk samples, LF, and RF were analyzed for C and N concentration by dry combustion method. The hydrolysable fraction was analyzed on the Shimadzu TOC-TN identified above.
2.4. Soil Incubations
Air-dried and sieved samples were used for incubation. To determine field moisture capacity for incubations, soil water retention curves were determined using Tempe cells (SoilMoisture Equipment Corp., Santa Barbara, CA, USA) and a WP4C Dewpoint PotentialMeter (Decagon Devices. Inc., Pullman, WA, USA). Separate core samples were collected for these analyses. Tempe cells were used for <1 MPa and WP4C Dewpoint PotentialMeter was used for >1 MPa. Results from both instruments were integrated to form soil water retention curves. Gravimetric water contents at field capacity (−0.01 MPa) and air-dry states (−100 MPa) were determined based on these soil water retention curves.
Two subsamples for control treatment and two subsamples for drying-wetting treatment were taken out of each sample. Subsamples were not treated as statically independent and only the mean value between subsamples were used in statistical analysis. Each subsample weighing 100 g air-dried were placed in 1-L canning jars (Mason jars; Jarden Co., Muncie, IN, USA), and then wet to field capacity (−0.01 MPa). After wetting, jars were capped. Caps included a rubber septum for gas sampling. All of the samples were incubated under 35 ± 0.5 °C in a Precision dual program illuminated incubator (GCA Corp., Chicago, IL, USA). Gas samples were taken at 0, 2, 4, 8, 12, 24, 48, 72, and 96 h. This is defined as the first cycle: C1, under the control treatment and DW1, under the drying-wetting treatment. The jars were then opened and samples under the control treatment were quickly aerated and capped. Water was added as necessary to maintain the soil water potential at field capacity. Samples under drying-wetting treatment were allowed to dry under 35 ± 0.5 °C in the same incubator. Total weight of the jar was used to assess the extent of drying. When the air-dry state was achieved soils were re-wetted to field capacity, capped, and re-measured for the second cycle (C2, under the control treatment and DW2, under the drying-wetting treatment). This cycle was repeated a third time (C3, under control treatment and DW3, under the drying-wetting treatment), similar to the approach taken by Fierer et al. [17].
Gas samples were collected from the headspace gas using a 3-mL airtight syringe and was analyzed with the LI-7000 CO2 gas analyzer (LI-COR Inc., Lincoln, NE, USA). Collected gas was injected into the LI-7000 CO2 gas analyzer using compressed N2 gas at 150 mL/min as the carrier [34]. Sample CO2 concentrations were determined by using a calibration equation made by injecting the same volume of standard CO2 gases with concentrations of 0.1, 1, 3, and 10%. To solve for CO2 concentration in the headspace of the jar, the ideal gas equation:
was used, where P is pressure in bars (constant), V is volume of gas in the jar in liters (constant), n is moles of gas in the jar, R is the gas constant in L bar/mol/K, and T is temperature in Kelvin (constant). The mass of C (mg) loss through soil respired is reported. Based on preliminary observations, soil respiration rates remained relatively stable for the first 48 h and declined thereafter. Therefore, soil respiration (mg C) were calculated using 48-h measurements for each cycle. The 0 h reading was used as the baseline CO2 concentration.
PV = nRT,
2.5. Statistical Analysis
The experimental design consisted of 4 factors: location (Oklahoma, Virginia Georgia, and Florida, fixed), depth (0–10, 10–20, 20–50, 50–100, 100–150, 150–200, 200–250, and 250–300 cm, fixed), treatment (control and drying-wetting treatments, fixed), and cycles (cycle 1, 2, and 3, fixed and repeated) with field replicates (field replicate 1 and 2, random). A mixed effect, repeated measures model was used to test for differences and account for the correlation over cycles. Tukey’s significant difference test at the level of α = 0.05 were used to separate soil respiration/TC and soil respiration/WE.
Linear regressions were used to identify soil C fractionations that significantly influenced soil respiration. All of the variables were transformed to obtain normal distributions before the regressions. The LF, RF, WE, and TC were transformed using log transformation. The HF was transformed using square root transformation. The soil respiration was transformed using skewed log transformation. All the C fractionations and TC were analyzed for correlations. The SAS statistical package (SAS Institute Inc., Cary, NC, USA) was used for all data analyses.
3. Results
3.1. Distribution of C
The highest TC concentrations of all four regions were in 0–10 cm soils, ranging from 1.29–3.89% C (Table 2). The C content dropped off rapidly in the upper 1 m from 0.22 to 0.32%. Below 1 m, the C% remained between 0.05–0.09%, with the exception of 150–170 cm Florida soil that had a 0.33% C, indicating a spodic horizon. The surface soils (0–20 cm) contained 41% of the total C stock, subsurface soils (20–100 cm) 35%, and deep soils (100–300 cm) 24%.
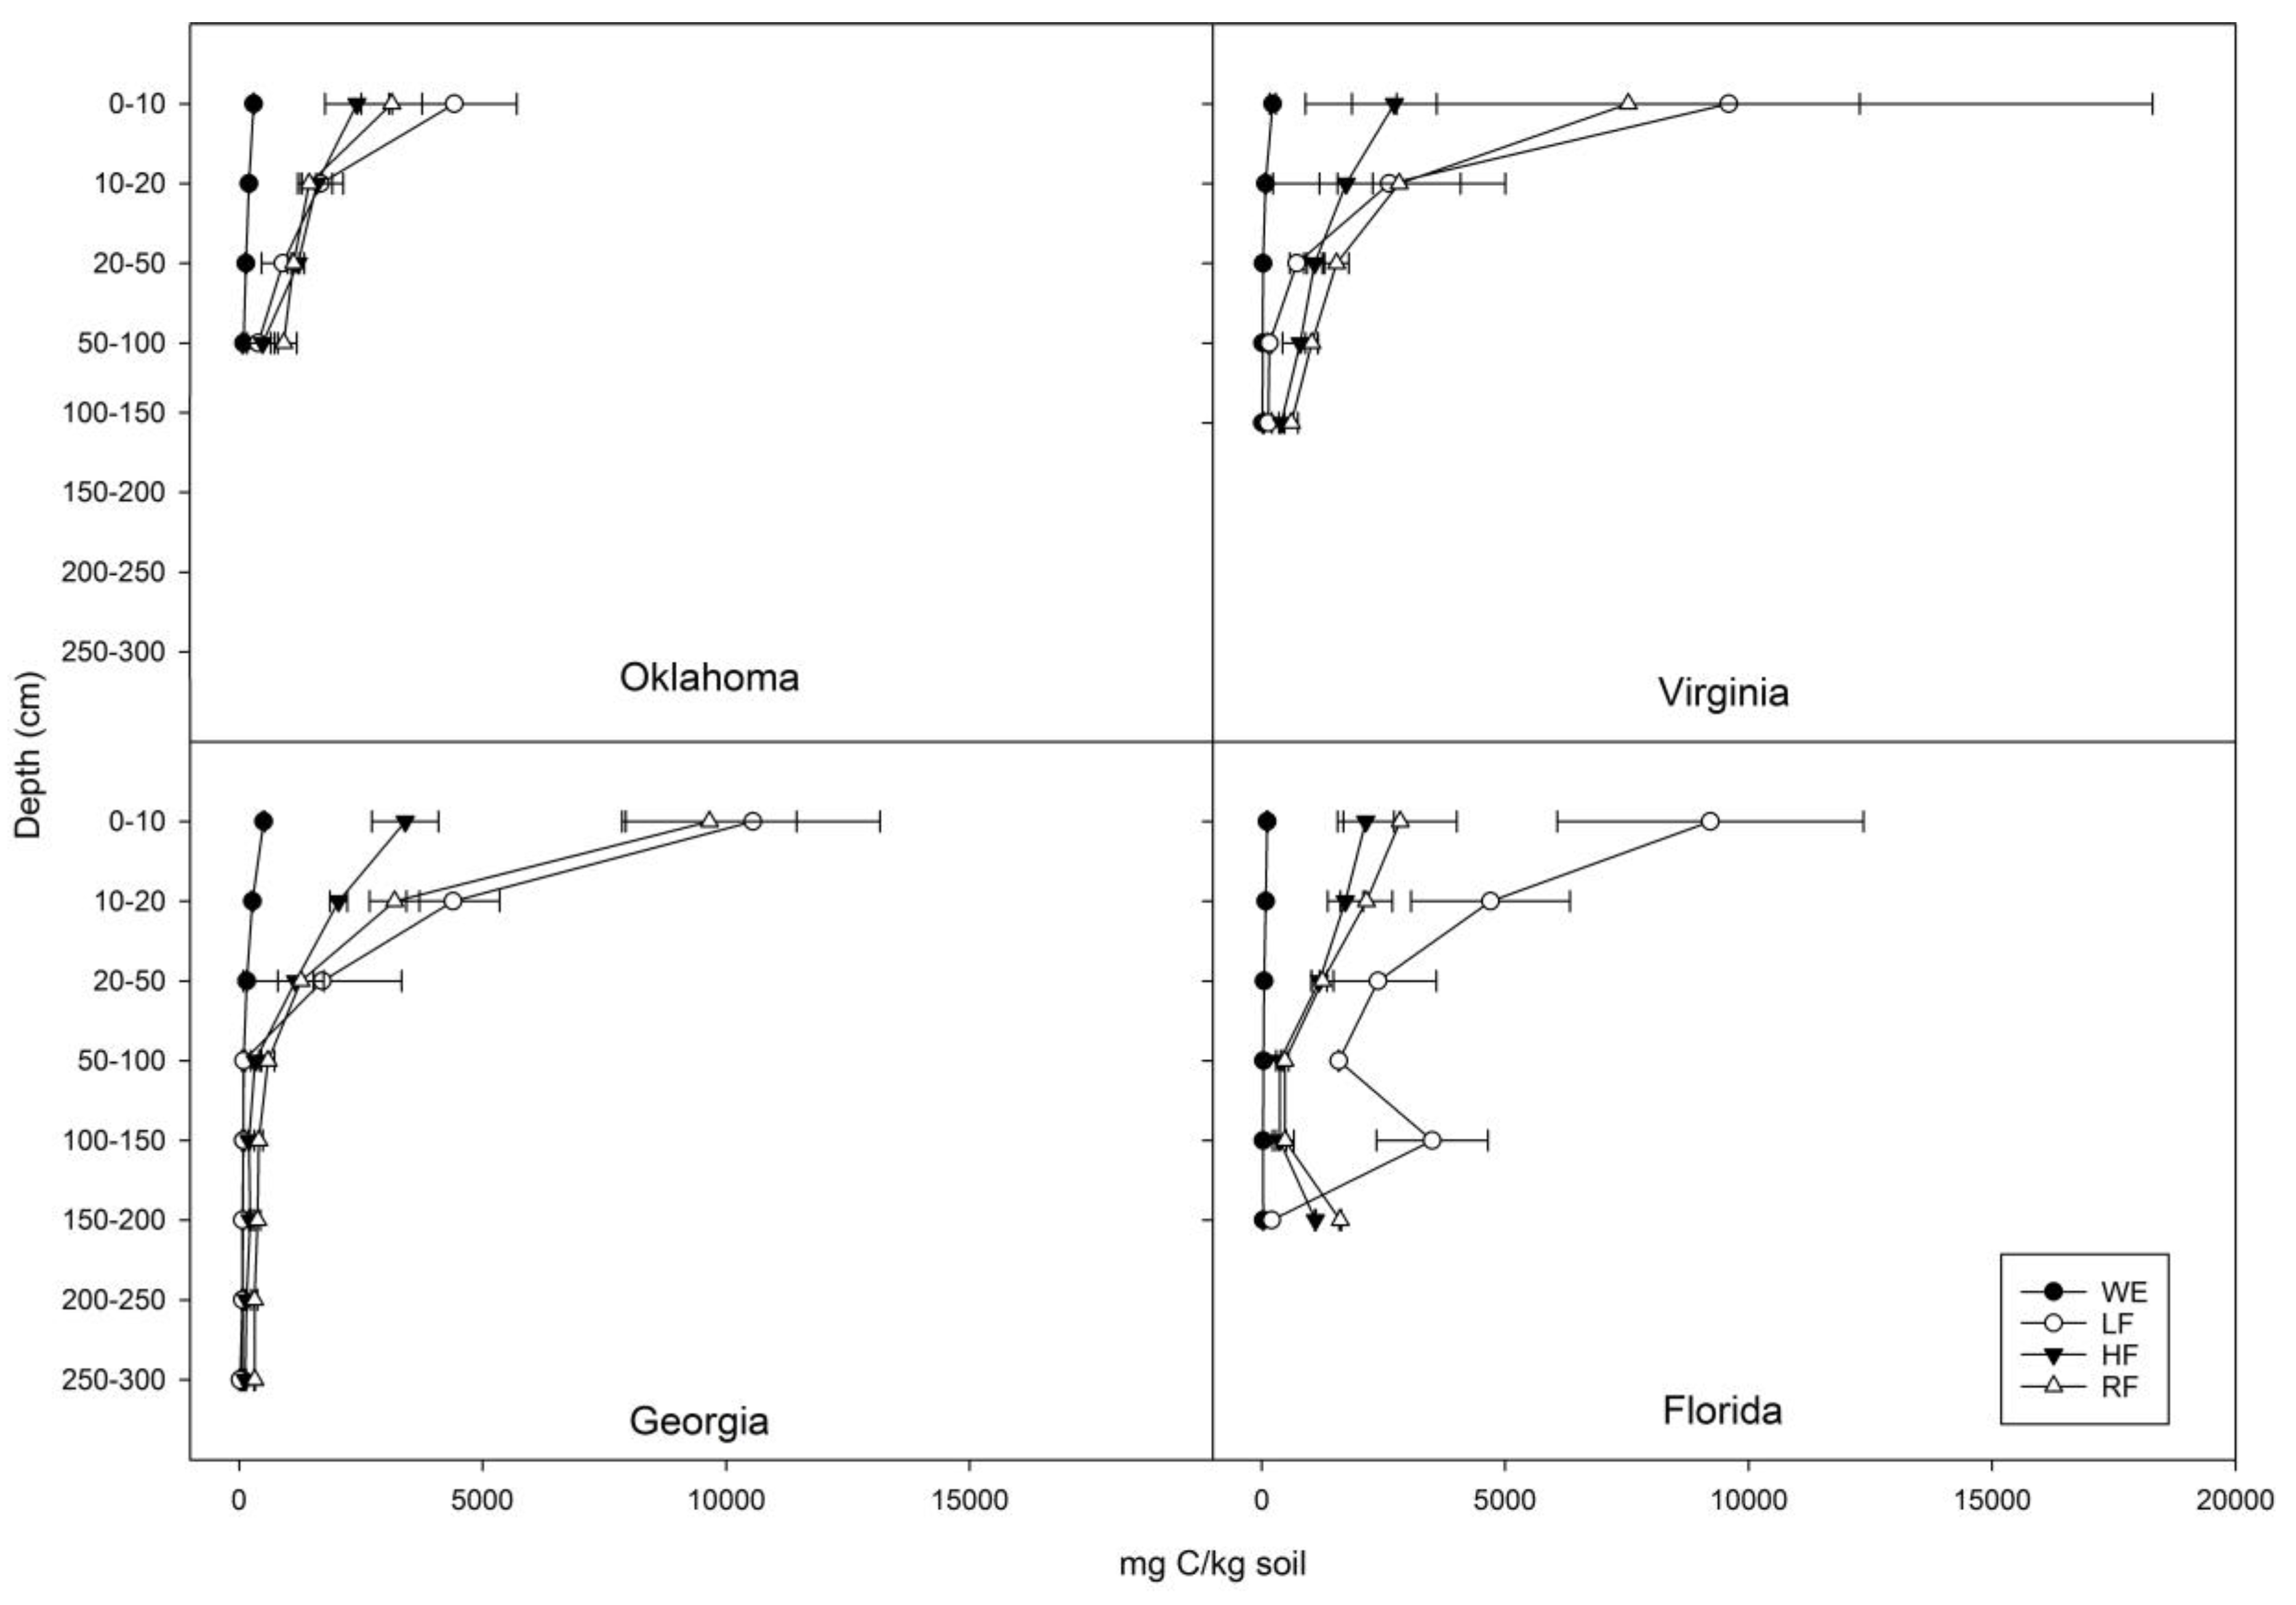
Of the TC in the profile, the WE proportion generally increased with depth (Figure 2). In Georgia, the proportion of WE to TC varied from about 3% for soils above 1 m to 13% for soils below 1 m. In Florida and Virginia, the proportion of WE to TC was ~1% throughout the profile, while in Oklahoma it was ~3% throughout.
The LF concentration of all the profiles decreased rapidly with depth (Figure 2). Georgia soils had the most dramatic change decreasing from 10,550 mg/kg (0–10 cm) to 22 mg/kg (250–300 cm). The LF of Oklahoma soils ranged from 4421–392 mg/kg, while in Florida and Virginia, soils had similar LF concentrations at ~9000 mg/kg in the surface and ~200 mg/kg in the deepest layer. The LF as a proportion of TC showed a generally decreasing trend over depth, with ~ 40% of C as LF at the surface decreasing to ~10% at depth.
The HF of all the profiles varied from ~3000 mg/kg at the surface to ~400 mg/kg at 1 m (Figure 2). In Georgia soil below 1 m, HF decreased to ~150 mg/kg. In the Florida spodic horizon, HF was 1105 mg/kg, much higher than the soils above. There is a generally increasing trend in the proportion of HF to TC with depth. The proportions varied from ~15% at the surface to ~40% at depth.
The RF concentration decreased with depth in all profiles (Figure 2). Georgia 0–10 cm had the highest RF of 9655 mg/kg and declined to 318 mg/kg at 2–3 m. The RF of Florida and Oklahoma surface soils were ~3000 mg/kg, while the RF of Virginia surface soil was 7529 mg/kg. At ~1 m, the RF of Oklahoma and Virginia soils were ~1000 mg/kg, while the RF of Florida dropped to ~500 mg/kg at ~1 m, then increased to 1616 mg/kg at 150–170 cm. The proportion of RF when compared with TC increased with depth. In Georgia, the proportions increased from ~50% to ~60% with depth and in Oklahoma the increase was from ~20% to ~30%. In Florida and Virginia, these proportions varied from <20% at the surface to ~60% at depth.
3.2. Soil Respiration
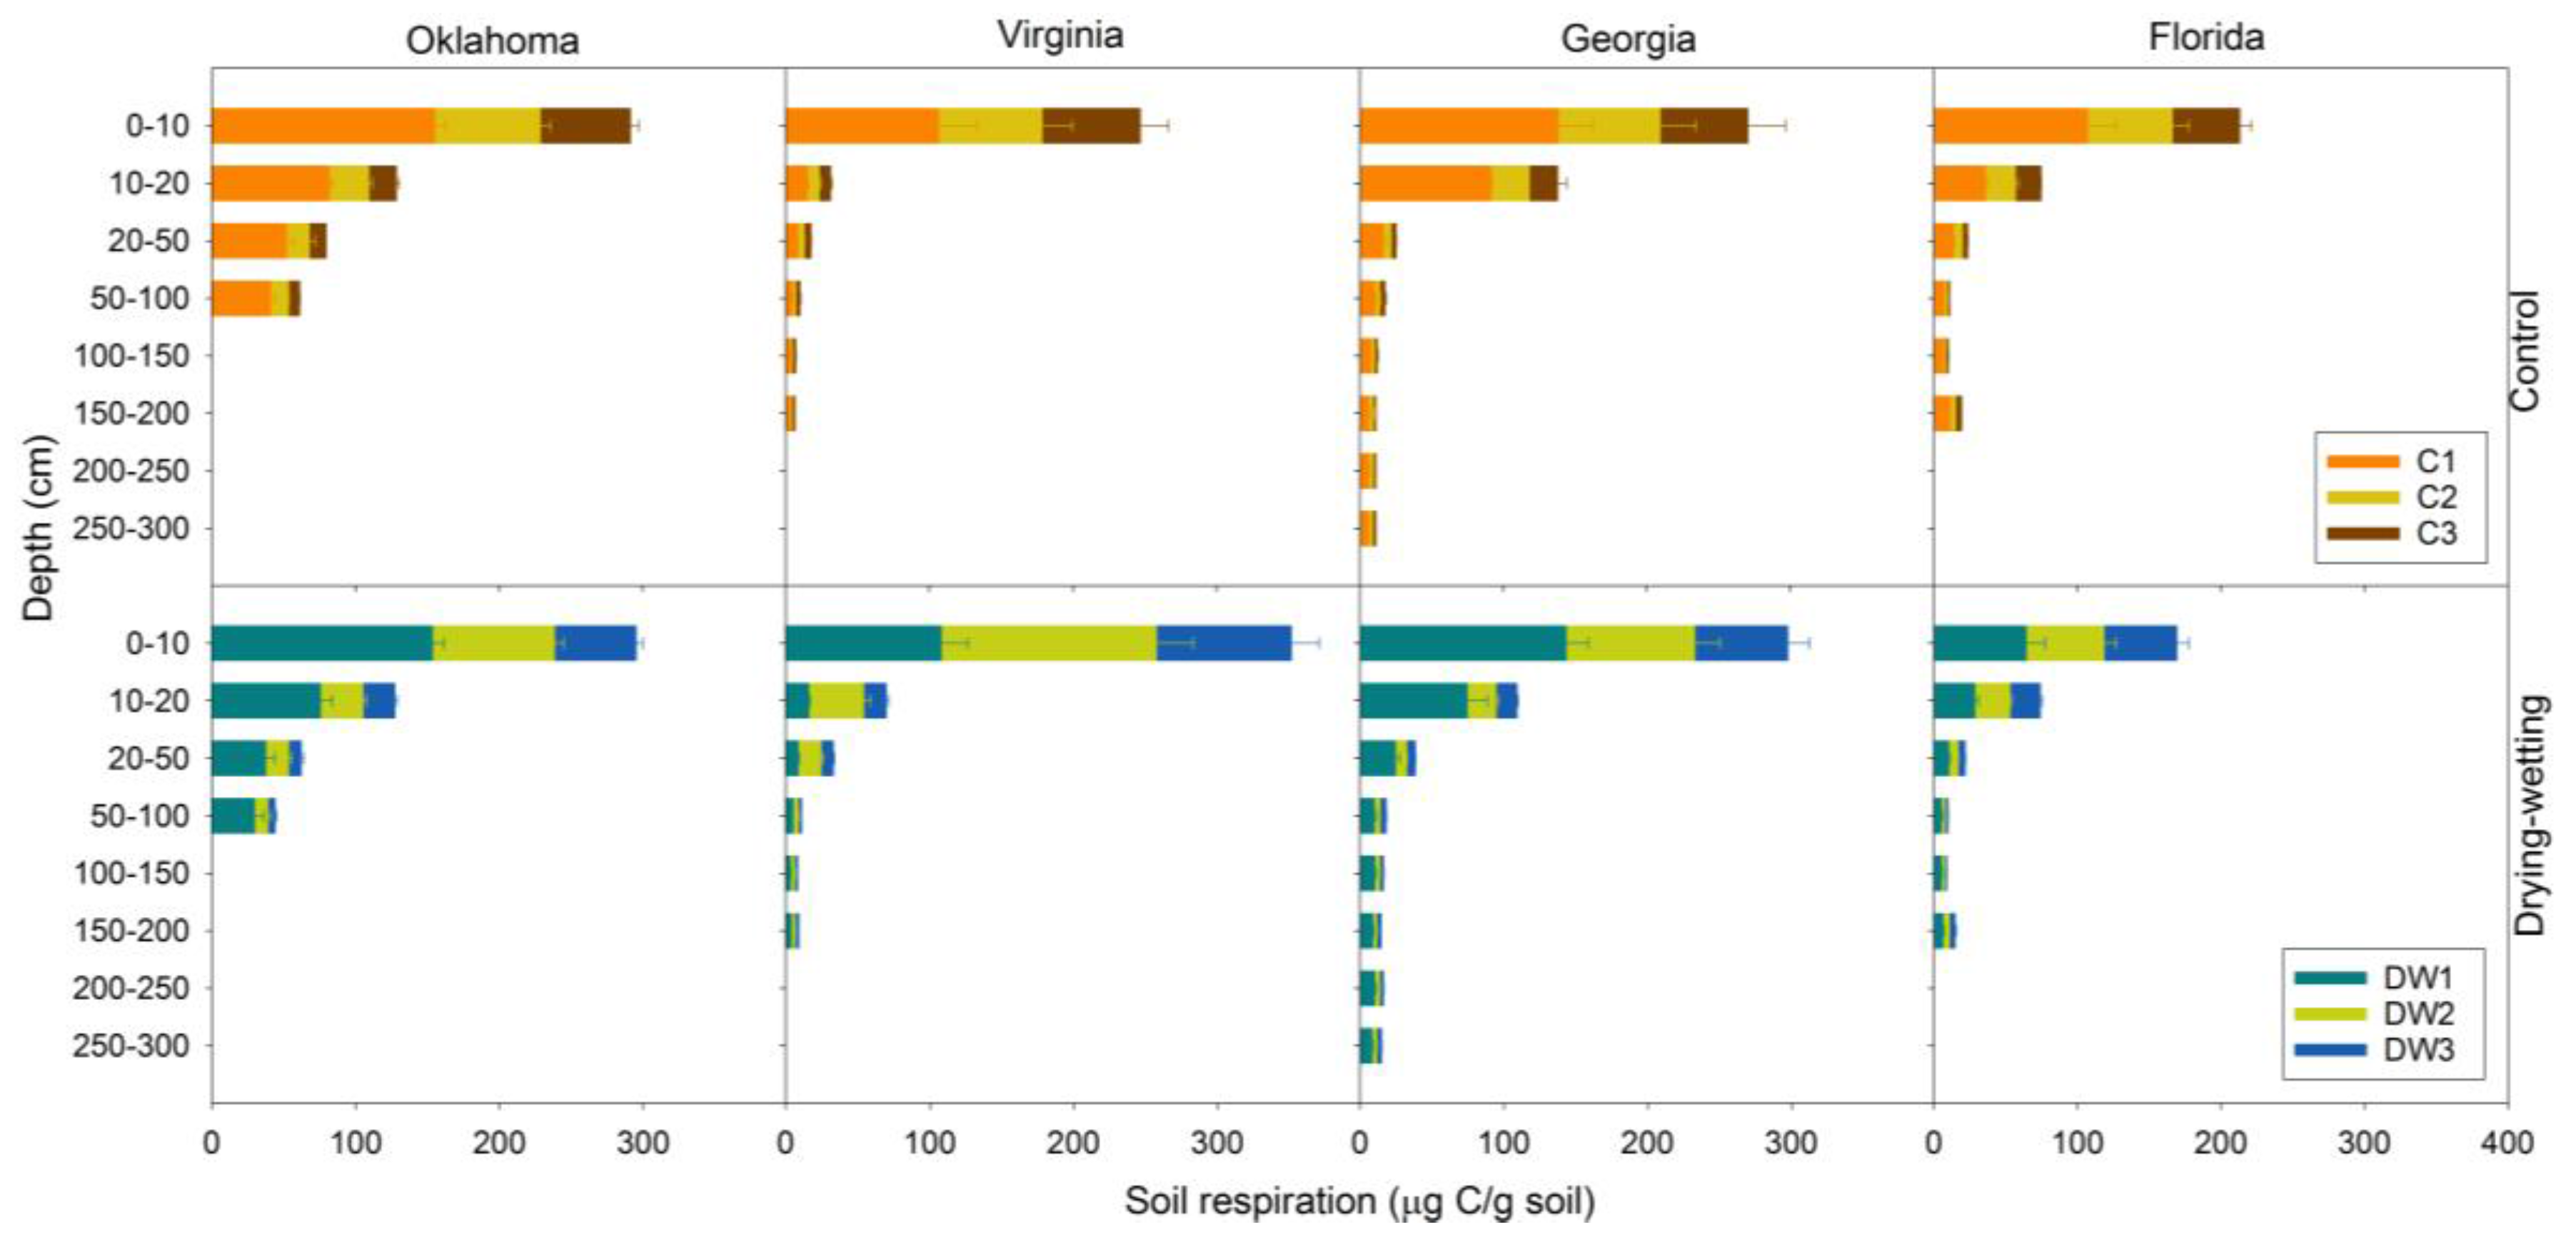
Rates of soil respiration differed among locations (p = 0.0391) with fluxes in Oklahoma generally being greatest and Georgia being lowest. In all the sites, soil respiration was greatest in 0–10 cm soils, ranging from 155 µg of C (Oklahoma) to 64 µg of C (Florida) per gram of soil, and generally decreased over depth to rates of <10 µg C/g soil. The exception was in Florida 150–170 cm soil, which was the spodic horizon and had greater soil respiration than the horizons above. Difference in respiration among depths was significant (p < 0.0001). At all of the depths, there were >3 µg C/g soil of soil respiration measured after drying and re-wetting. This was even true at the deepest depth: 250–300 cm (Figure 3).
Soil respiration was generally greatest during the first cycle (accounting for 27–67% of C loss) and declined thereafter (Figure 3). One exception was 0–10 cm soil samples from Virginia where soil respired more C during the second cycle (149 µg C/g soil) than the first cycle (108 mg C/g soil). Such increases over drying-wetting cycles were not observed in the subsurface soils.
Increased soil respiration with drying-wetting cycles when compared to those that were constantly moist was not consistently observed (Figure 3), and the treatment effect was not significant (p = 0.6798). However, for Georgia soils from 0–10 and 20–300 cm, Florida soils from 10–20 cm, Oklahoma soils from 0–20 cm, and all Virginia soils, drying-wetting cycles stimulated greater (although not significantly greater) soil respiration than ones that were constantly moist.
3.3. Soil Respiration in Relation to TC
For 0–100 cm soils, soil respiration as a proportion of TC generally decreased with depth (Figure 4). Below 100 cm, however, these proportions had increasing trends with depth (with the exception of Florida 150–170 cm soil). In general, soil respiration as a proportion of TC content was greater below 100 cm than soil above 100 cm (Figure 4). In Georgia, total soil respiration over the three cycles accounted for 0.7–1.7% of TC in the upper 100 cm. Below this depth, total soil respiration over the three cycles accounted for 1.8–2.9% of total soil C. Soils from Florida and Virginia showed similar trends. Total soil respiration over the three cycles accounted for 0.3–0.8% of TC in the upper 100 cm in Florida soil, and 0.4–1.3% in the soils below 100 cm. In Virginia, 0.5–1.7% of TC was released above 100 cm and soil below 100 cm respired 0.8–1.3% of TC. The depth effect was significant for all of the locations (p < 0.0001).
3.4. Soil Respiration in Relation to Soil C Fractions
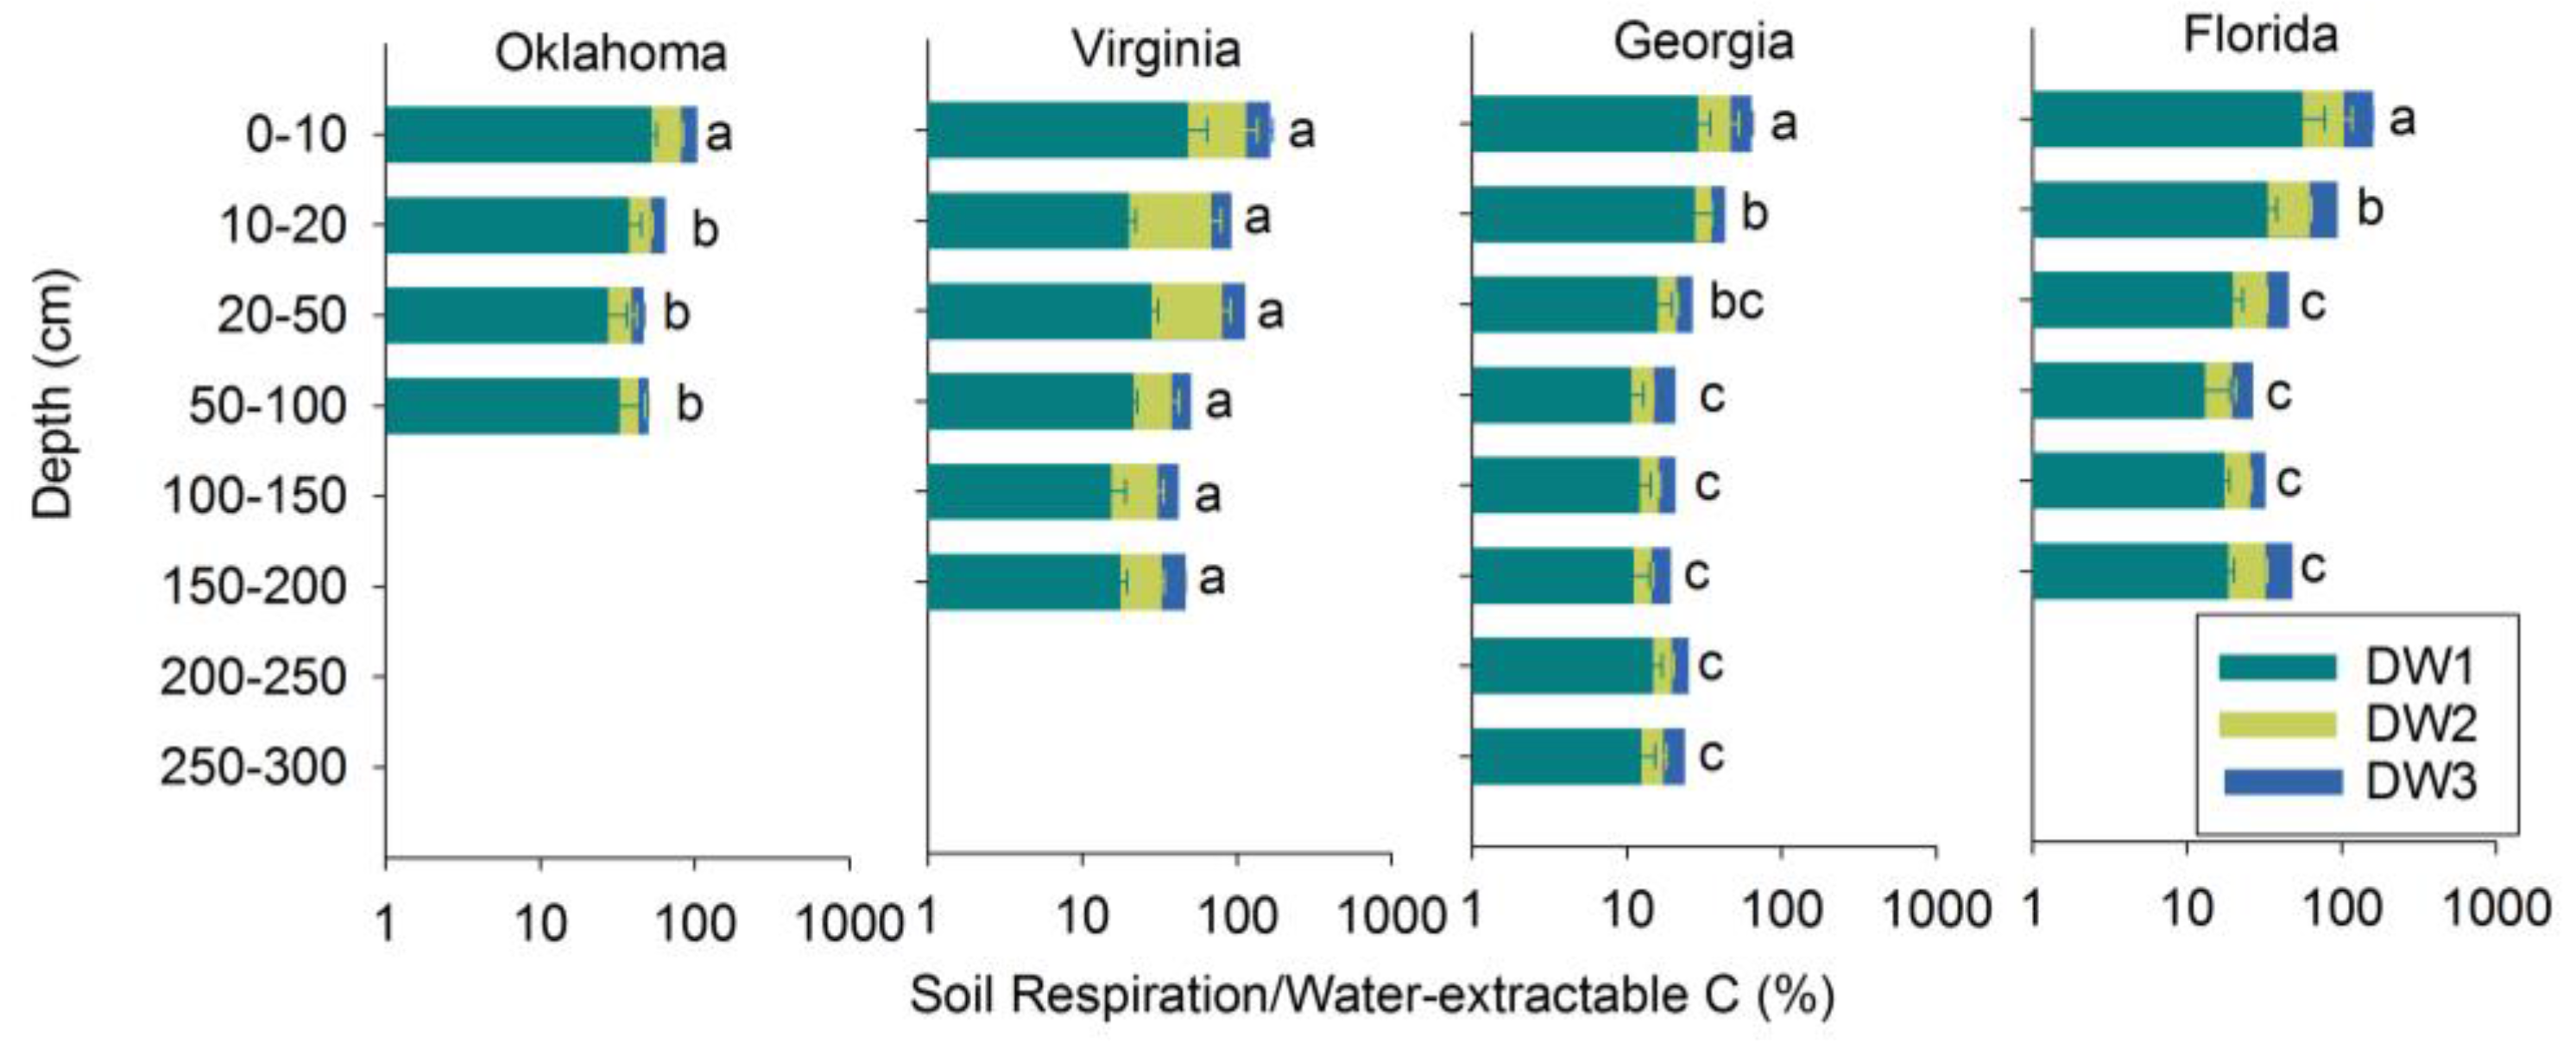
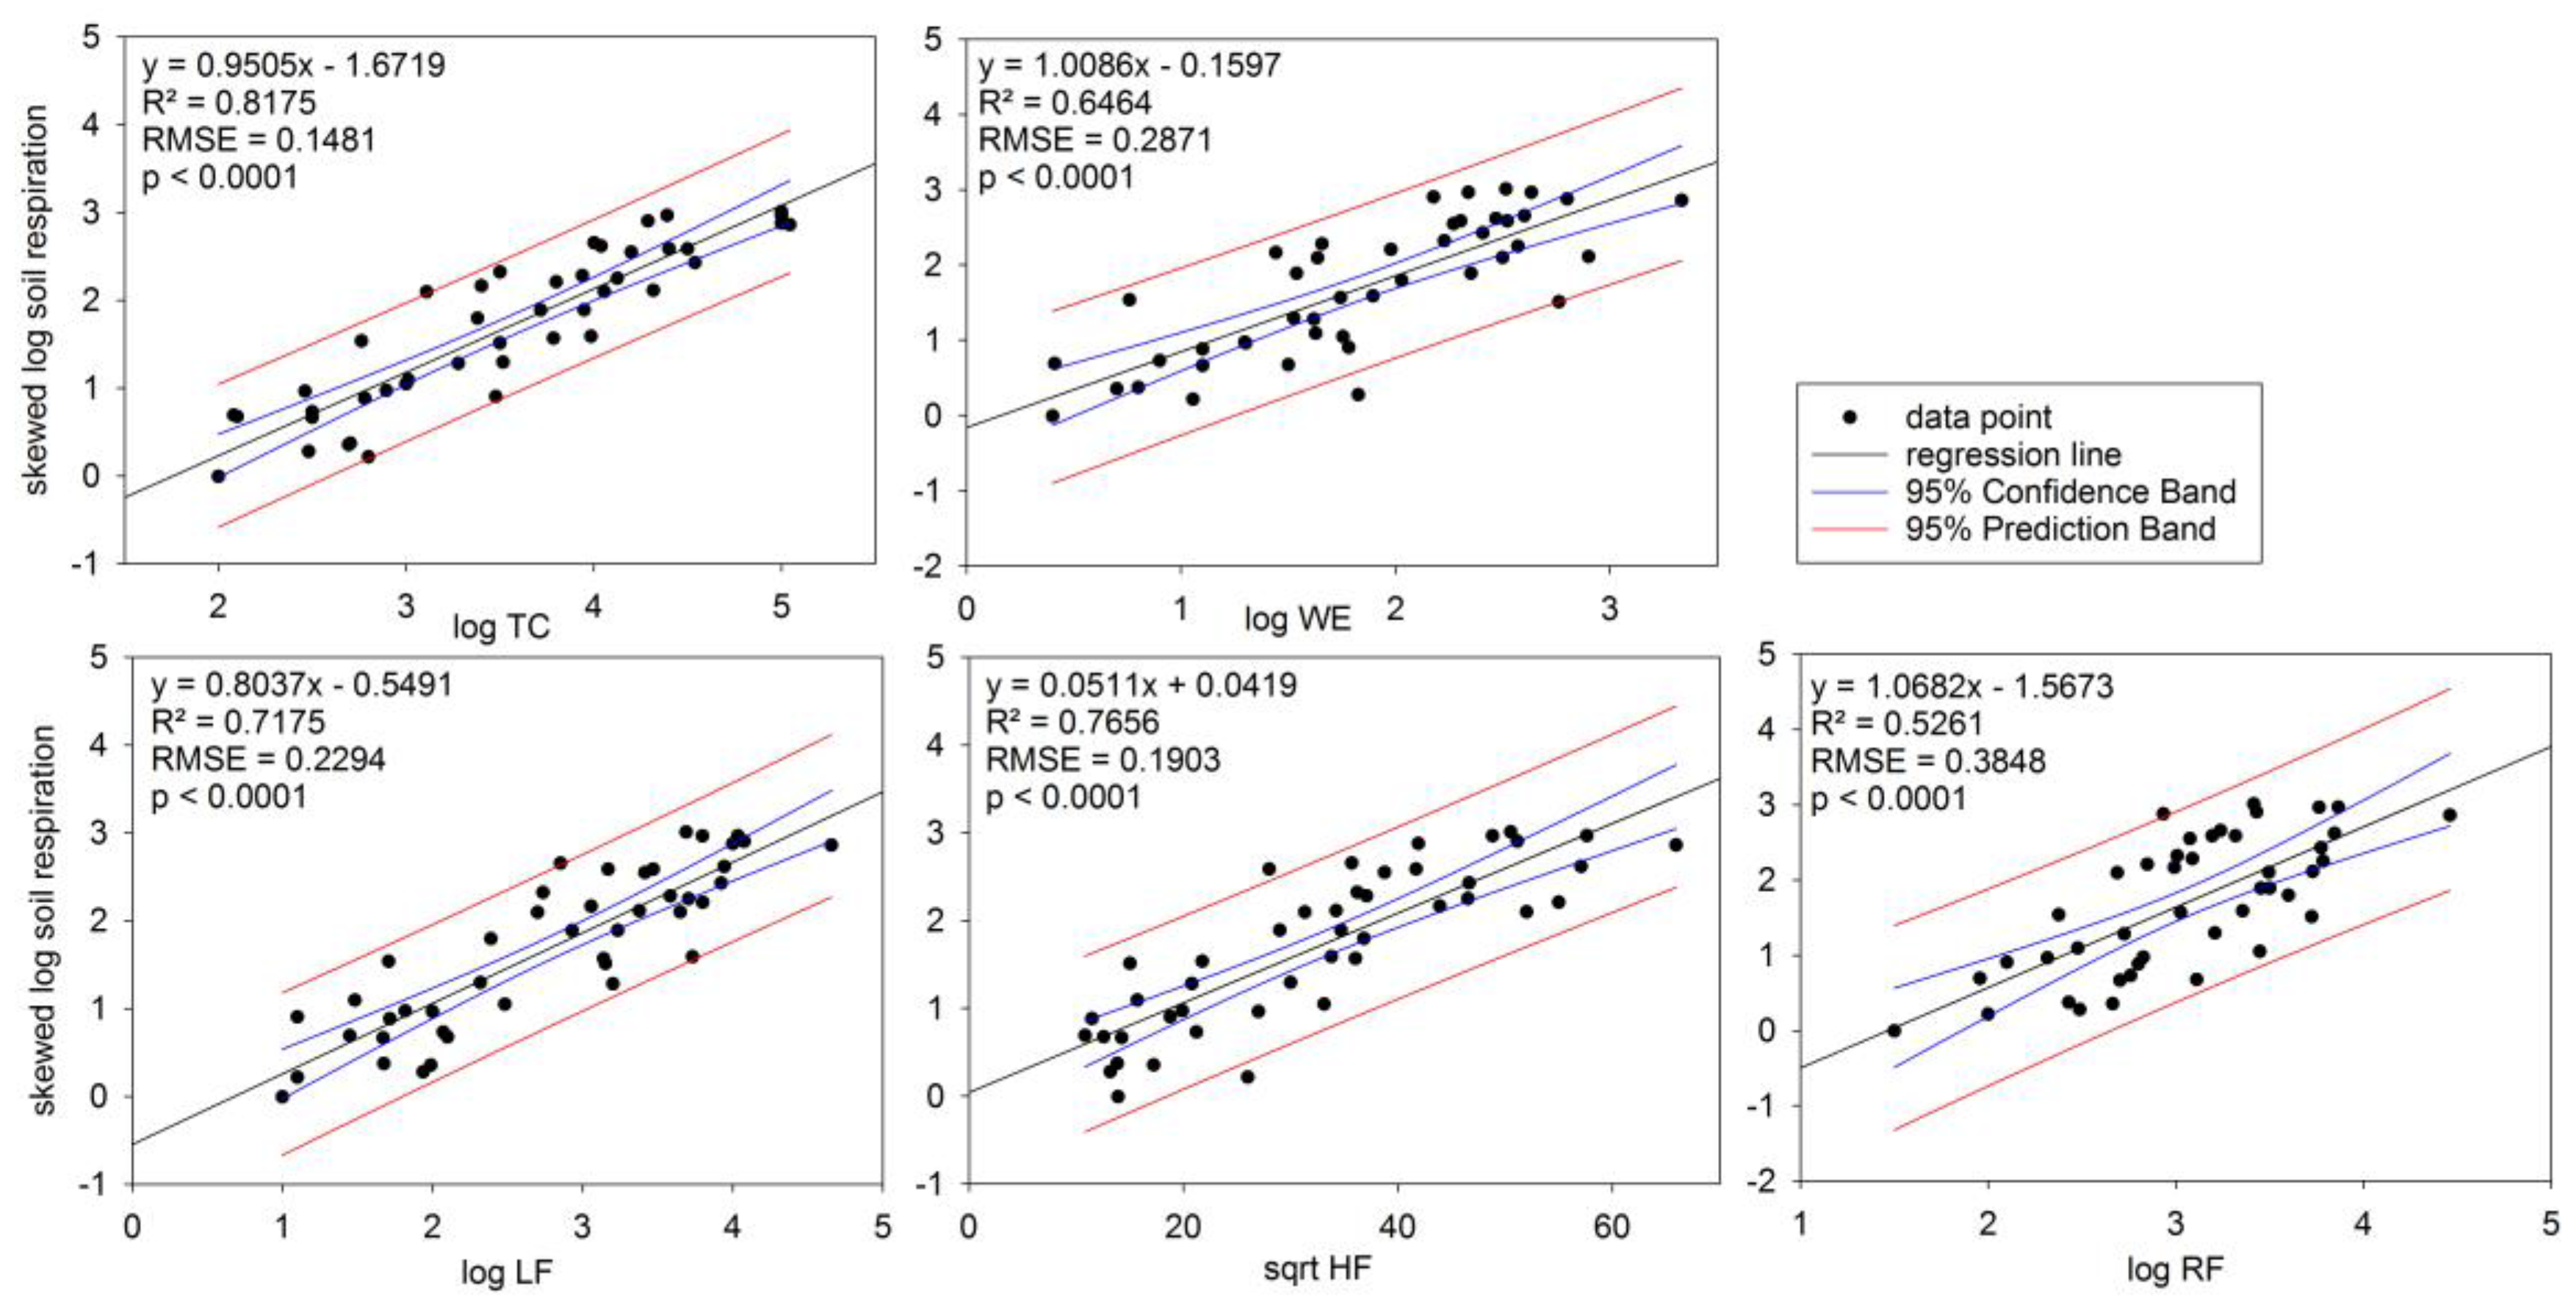
In general, soil respiration as a proportion of water extractable carbon decreased over repeated drying-wetting cycles and with depth (Figure 5). Soil respiration, as a proportion of WE carbon, exceeded 100% in 25% of all the samples, including Oklahoma 0–10 cm, Virginia 0–50 cm, and Florida 0–20 cm (Figure 5). The soil respiration/WE carbon proportion reached 145% in Florida 0–10 cm soils. All C fractionations were significantly correlated with each other and with TC (p < 0.0001). All of the fractions were also significant predictors of total soil respiration (p < 0.0001). Across all the samples, WE explained 65% of the variance in soil respiration (i.e., R2 = 0.65) (Figure 6). Among the components of the C fractionation, the LF accounted for 72%, HF for 77%, and the RF for 53% of the variance in C respired (Figure 6). TC, however, had a greater predictive value individually (R2 = 0.82) than all of the other C fractions (Figure 6).
4. Discussion
The results of this study do not support the hypothesis that drying-wetting cycles in deep soil stimulated soil respiration. In many previous studies focusing on surface soils, drying-wetting cycles have increased soil respiration [5,7,8,9,10,12,13]. Increased soil respiration in these previous studies, however, is not universally observed. For example, Fierer and Schimel [10] reported soil respiration during incubations significantly increased with the number of drying-wetting events for oak forest soils, but not for grassland soils, where a large number of drying-wetting events decreased soil respiration. Similar declines in soil respiration with drying-wetting have been observed in a loamy sand soil with shoot material of Lolium perenne mixed in and a silt loam soil on a farm in Kansas [11,35]. There have been a few reports [36,37,38] that are consistent with results from this study. For example, three soil series in the southeastern U.S. studied by Kruse et al. [38], showed mixed results similar to the current study: the drying-wetting treatment decreased soil respiration on an Orangeburg sandy loam (fine-loamy, kaolinitic, thermic, Typic Kandiudults); while, it increased soil respiration on a Norfolk depressional sandy loam (fine-loamy, kaolinitic, thermic, Arenic Kandiudults); and, had no effect on a Norfolk loamy sand (coarse-loamy, kaolinitic, thermic, Typic Kandiudults).
Previous research has mainly focused on surface soil (<20 cm) responses to drying-wetting [11,14,15]; a few studied subsurface soils (20–100 cm) [39,40]; and, even fewer studied deep soil carbon (>100 cm) [17,23]. Data similar to that of the current study are rare in demonstrating an active microbial community and active C pool, as evidenced by soil respiration, down to as much as three meters. Responses observed in surface and deep soils may differ, however, as showed by results of one previous study where moderate drought (−1.5 and −5 MPa) had a larger relative impact on the rates of soil respiration from surface when compared to deep soil horizons [20]. Results of the current study also show differences, but here, soils below 1 m respired more C as a proportion of the total soil C pool than soils above 1 m, indicating that deep soils may respond differently to drying-wetting cycles than surface soils.
Mechanistically, surface and deep soils may differ in a number of ways. For example, the breakdown of soil aggregates in surface soils and the release of previously physically protected soil organic matter may result in increased soil C respiration. The stabilization of organic C by physical protection within soil aggregates has been reported to be an important factor in subsurface soils [41]. In deep soil, however, aggregation does not occur to as great a degree as in surface soils [42]. Mineral interaction has been shown to be the main stabilization mechanism in acid soils (note pH in Table 2) [41,43]. To achieve sample homogeneity, soil aggregates were partially broke down to pass through 2 mm sieve. Although a common practice for soil incubation studies [13,16,17,38], results reported that using this method should not be considered quantitatively equal to how undisturbed soil would be affected by soil moisture change, instead, should be received as a qualitative representation. Furthermore, even in the event of physical alteration of soils by wetting and drying, deep soils may lack a supply of fresh or microbially available C, thus limit soil respiration in deep soils [16]. Finally, even if labile or microbially available C is made available at depth, it is possible that microbes may be nutrient limited due to extremely low soil nutrient concentrations (note N concentrations in Table 2) [17]. Thus after wetting, an increase in microbial turnover may be truncated by a stoichiometric imbalance [44].
Considering the amount of C stored in deep soils and the potential contribution of deep soil respiration to atmospheric CO2, there is a desire to estimate the potential soil respiration. To estimate the soil respiration at any depth, TC was the best indicator for soil respiration (R2 = 0.82). The WE alone only explained 65% of soil respiration (Figure 6). In 25% of these incubations, soil respiration exceeded WE carbon, the readily available C, indicating that there are other microbially available C pools than WE. The LF is another rapidly cycling C pool and can contribute significantly to soil respiration [24]. However, there is very little LF, especially in Georgia soil tested below 50 cm, there is <100 mg/kg LF (Figure 2). Therefore, the LF could not completely explain the total amount of soil respiration at depth (R2 = 0.72). The RF is not thought to be particularly microbially available [23]; in this study, RF is not very well correlated with soil respiration (R2 = 0.53). Among all C fractionations, HF had the best fit for soil respiration (R2 = 0.77) (Figure 6). Previous research using similar acid extraction methods for HF have found this C pool to be correlated with rates of C decomposition [45,46]. As such, we suggest that in the high clay content, Ultisols and Alfisols of the Southeast (Table 2) the C adsorbed to clay surfaces, which is well represented by HF, might be the best indicator for C respiration at depth.
Despite their low C content, subsoil horizons contribute more than half of the global soil C stock [19,47,48]. The global soil C stock is estimated to have 699 Pg C in the top 0.2 m layer, 716 Pg C in 0.2–1 m layer, 491 Pg C in 1–2 m layer, and 351 Pg C to the depth of 3 m [49]. Together, this soil C pool is larger than the biomass C pool and the atmospheric C pool combined [49]. Specifically, for the soils tested in this study, there was an average of 41% of C stored in the top 0.2 m layer, 35% in the 0.2–1 m layer, and 24% in the 1–3 m layer. The amount of soil respiration with the drying and wetting treatment from the top 0.2 m layer contributed 54%, the 0.2–1 m layer 27%, and the 1–3 m layer 19%. Thus, although soil moisture changes in deep soil did not consistently impact soil respiration, these soils appear to contribute substantially to carbon cycling and atmospheric CO2.
5. Conclusions
Drying-wetting cycles did not have a consistent effect of enhancing soil carbon loss in these four soil profiles that were investigated in the Southeast U.S. Many sub (0.2–1 m) and deep (<1 m) soils of this region have high (>30%) clay contents and low soil C concentrations that may render this deep soil carbon insensitive to more severe drying-wetting cycles. The carbon-enriched, subsurface spodic horizon that was encountered in this study was an exception, having increased soil C respiration with drying-wetting. Spodosols are common in the coastal plains of the Southeast U.S. (and in many northern temperate forests), store significant amounts of C, and thus may deserve further attention. Across all of the soils studied, drying-wetting cycles in deep soils induced greater C loss as a proportion of total soil C than surface soils. Across all of the depths, the total C was the best predicator for soil respiration. In the clay-rich subsoils, the acid extractable, hydrolysable C fraction may be most informative.
Acknowledgments
This research was supported by the Pine Integrated Network: Education, Mitigation, and Adaptation project (PINEMAP) funded by the United States Department of Agriculture National Institute of Food and Agriculture Award #2011-68002-30185. The authors would like to thank Madison Akers, Joshua Cucinella, Andy Laviner, Geoffrey Lokuta, Timothy Martin, Kristin M. McElligott, John Seiler, Raj Shrestha, and Duncan Wilson for their labor and intellectual input. Thanks to Ed Hurliman (Oklahoma), the Virginia Department of Forestry, Appomattox-Buckingham State Forest (Virginia) Plum Creek Timber Co. (Georgia), and Foley Timber and Land Company (Florida) for providing property access. Thanks to the reviewers for their constructive comments.
Author Contributions
J.Q. and D.M. conceived and designed the experiments; J.Q., D.M. and M.F. performed the experiments; J.Q. analyzed the data; E.J., B.S. and J.V. contributed materials; D.M., M.F., E.J., B.S. and J.V. edited the paper; J.Q. wrote the paper.
Conflicts of Interest
The authors declare no conflict of interest. The founding sponsors had no role in the design of the study; in the collection, analyses, or interpretation of data; in the writing of the manuscript, and in the decision to publish the results.
References
- Meehl, G.A.; Tebaldi, C.; Teng, H.; Peterson, T.C. Current and future US weather extremes and El Nino. Geophys. Res. Lett. 2007, 34, L20704. [Google Scholar] [CrossRef]
- Solomon, S.; Qin, D.; Manning, M.; Marquis, M.; Averyt, K.; Tignor, M.M.B.; Miller, H.L., Jr.; Chen, Z. Contribution of Working Group I to the Fourth Assessment Report of the Intergovernamental Panel on Climate Change. In Climate Change 2007: The Physical Science Basis; Cambridge University Press: Cambridge, UK, 2007. [Google Scholar]
- Seager, R.; Tzanova, A.; Nakamura, J. Drought in the Southeastern United States: Causes, variability over the last millennium, and the potential for future hydroclimate change. J. Clim. 2009, 22, 5021–5045. [Google Scholar] [CrossRef]
- Borken, W.; Matzner, E. Reappraisal of drying and wetting effects on C and N mineralization and fluxes in soils. Glob. Chang. Biol. 2009, 15, 808–824. [Google Scholar] [CrossRef]
- Birch, H.F. Pattern of humus decomposition in East African soils. Nature 1958, 181, 788. [Google Scholar] [CrossRef]
- Orchard, V.A.; Cook, F.J. Relationship between soil respiration and soil-moisture. Soil Biol. Biochem. 1983, 15, 447–453. [Google Scholar] [CrossRef]
- Jager, G.; Bruins, E.H. Effect of repeated drying at different temperatures on soil organic matter decomposition and characteristics, and on soil microflora. Soil Biol. Biochem. 1975, 7, 153–159. [Google Scholar] [CrossRef]
- Clein, J.S.; Schimel, J.P. Reduction in microbial activity in birch litter due to drying and rewetting events. Soil Biol. Biochem. 1994, 26, 403–406. [Google Scholar] [CrossRef]
- Franzluebbers, A.J.; Haney, R.L.; Honeycutt, C.W.; Schomberg, H.H.; Hons, F.M. Flush of carbon dioxide following rewetting of dried soil relates to active organic pools. Soil Sci. Soc. Am. J. 2000, 64, 613–623. [Google Scholar] [CrossRef]
- Fierer, N.; Schimel, J.P. Effects of drying-rewetting frequency on soil carbon and nitrogen transformations. Soil Biol. Biochem. 2002, 34, 777–787. [Google Scholar] [CrossRef]
- Mikha, M.M.; Rice, C.W.; Milliken, G.A. Carbon and nitrogen mineralization as affected by drying and wetting cycles. Soil Biol. Biochem. 2005, 37, 339–347. [Google Scholar] [CrossRef]
- Beare, M.H.; Gregorich, E.G.; St-Georges, P. Compaction effects on CO2 and N2O production during drying and rewetting of soil. Soil Biol. Biochem. 2009, 41, 611–621. [Google Scholar] [CrossRef]
- Butterly, C.R.; Marschner, P.; McNeill, A.M.; Baldock, J.A. Rewetting CO2 pulses in Australian agricultural soils and the influence of soil properties. Biol. Fertil. Soils 2010, 46, 739–753. [Google Scholar] [CrossRef]
- Butterly, C.R.; McNeill, A.M.; Baldock, J.A.; Marschner, P. Changes in water content of two agricultural soils does not alter labile P and C pools. Plant Soil 2011, 348, 185–201. [Google Scholar] [CrossRef]
- Wu, J.; Brookes, P.C. The proportional mineralisation of microbial biomass and organic matter caused by air-drying and rewetting of a grassland soil. Soil Biol. Biochem. 2005, 37, 507–515. [Google Scholar] [CrossRef]
- Fontaine, S.; Barot, S.; Barre, P.; Bdioui, N.; Mary, B.; Rumpel, C. Stability of organic carbon in deep soil layers controlled by fresh carbon supply. Nature 2007, 450, 277–280. [Google Scholar] [CrossRef] [PubMed]
- Fierer, N.; Allen, A.S.; Schimel, J.P.; Holden, P.A. Controls on microbial CO2 production: A comparison of surface and subsurface soil horizons. Glob. Chang. Biol. 2003, 9, 1322–1332. [Google Scholar] [CrossRef]
- Batjes, N.H. Total carbon and nitrogen in the soils of the world. Eur. J. Soil Sci. 1996, 47, 151–163. [Google Scholar] [CrossRef]
- Harrison, R.B.; Footen, P.W.; Strahm, B.D. Deep Soil Horizons: Contribution and Importance to Soil Carbon Pools and in Assessing Whole-Ecosystem Response to Management and Global Change. For. Sci. 2011, 57, 67–76. [Google Scholar]
- Gaudinski, J.B.; Trumbore, S.E.; Davidson, E.A.; Zheng, S. Soil Carbon Cycling in a Temperate Forest: Radiocarbon-Based Estimates of Residence Times, Sequestration Rates and Partitioning of Fluxes. Biogeochemistry 2000, 51, 33–69. [Google Scholar] [CrossRef]
- Wood, B.D.; Keller, C.K.; Johnstone, D.L. In situ measurement of microbial activity and controls on microbial CO2 production in the unsaturated zone. Water Resour. Res. 1993, 29, 647–659. [Google Scholar] [CrossRef]
- Trumbore, S.E.; Vogel, J.S.; Southon, J.R. AMS 14C measurements of fractionated soil organic matter: An approach to deciphering the soil carbon cycle. Radiocarbon 1989, 31, 644–654. [Google Scholar] [CrossRef]
- Trumbore, S.E.; Davidson, E.A.; Decamargo, P.B.; Nepstad, D.C.; Martinelli, L.A. Belowground cycling of carbon in forests and pastures of Eastern Amazonia. Glob. Biogeochem. Cycles 1995, 9, 515–528. [Google Scholar] [CrossRef]
- Trumbore, S. Age of soil organic matter and soil respiration: Radiocarbon constraints on belowground C dynamics. Ecol. Appl. 2000, 10, 399–411. [Google Scholar] [CrossRef]
- Trumbore, S.E.; Zheng, S.H. Comparison of fractionation methods for soil organic matter 14C analysis. Radiocarbon 1996, 38, 219–229. [Google Scholar] [CrossRef]
- Will, R.E.; Fox, T.; Akers, M.; Domec, J.C.; Gonzalez-Benecke, C.; Jokela, E.J.; Kane, M.; Laviner, M.A.; Lokuta, G.; Markewitz, D.; et al. A range-wide experiment to investigate nutrient and soil moisture interactions in loblolly pine plantations. Forests 2015, 6, 2014–2028. [Google Scholar] [CrossRef]
- NOAA National Weather Service Cooperative Observation Program. Available online: http://www.ncdc.noaa.gov (accessed on 15 February 2016).
- USDA Soil Classification. Available online: https://soilseries.sc.egov.usda.gov (accessed on 12 February 2016).
- Gee, G.W.; Or, D. 2.4 Particle-size analysis. In Methods of Soil Analysis: Part 4 Physical Methods SSSA Book Series; Soil Science Society of America (SSSA): Fitchburg, WI, USA, 2002; pp. 255–293. [Google Scholar]
- Thomas, G.W. Soil pH and soil acidity. In Methods of Soil Analysis: Part 3—Chemical Methods SSSA Book Series; Soil Science Society of America (SSSA): Fitchburg, WI, USA, 1996; pp. 475–490. [Google Scholar]
- Bremner, J.M. Nitrogen-total. In Methods of Soil Analysis: Part 3—Chemical Methods SSSA Book Series; Soil Science Society of America (SSSA): Fitchburg, WI, USA, 1996; pp. 1085–1121. [Google Scholar]
- Jones, D.L.; Willett, V.B. Experimental evaluation of methods to quantify dissolved organic nitrogen (DON) and dissolved organic carbon (DOC) in soil. Soil Biol. Biochem. 2006, 38, 991–999. [Google Scholar] [CrossRef]
- Golchin, A.; Oades, J.M.; Skjemstad, J.O.; Clarke, P. Study of free and occluded particulate organic-matter in soils by solid-state 13C CP/MAS NMR-spectroscopy and scanning electron-microscopy. Aust. J. Soil Res. 1994, 32, 285–309. [Google Scholar] [CrossRef]
- Zibilske, L.M. Carbon mineralization 1. In Methods of Soil Analysis: Part 2—Microbiological and Biochemical Properties SSSA Book Series; Soil Science Society of America (SSSA): Fitchburg, WI, USA, 1994; pp. 835–863. [Google Scholar]
- Magid, J.; Kjaergaard, C.; Gorissen, A.; Kuikman, P.J. Drying and rewetting of a loamy sand soil did not increase the turnover of native organic matter, but retarded the decomposition of added C-14-labelled plant material. Soil Biol. Biochem. 1999, 31, 595–602. [Google Scholar] [CrossRef]
- Franzluebbers, K.; Weaver, R.W.; Juo, A.S.R.; Franzluebbers, A.J. Carbon and nitrogen mineralization from cowpea plants part decomposing in moist and in repeatedly dried and wetted soil. Soil Biol. Biochem. 1994, 26, 1379–1387. [Google Scholar] [CrossRef]
- Curtin, D.; Selles, F.; Wang, H.; Campbell, C.A.; Biederbeck, V.O. Carbon dioxide emissions and transformation of soil carbon and nitrogen during wheat straw decomposition. Soil Sci. Soc. Am. J. 1998, 62, 1035–1041. [Google Scholar] [CrossRef]
- Kruse, J.S.; Kissel, D.E.; Cabrera, M.L. Effects of drying and rewetting on carbon and nitrogen mineralization in soils and incorporated residues. Nutr. Cycl. Agroecosyst. 2004, 69, 247–256. [Google Scholar] [CrossRef]
- Nelson, P.N.; Baldock, J.A.; Oades, J.M. Changes in dispersible clay content, organic carbon content, and electrolyte composition following incubation of sodic soil. Soil Res. 1998, 36, 883–898. [Google Scholar] [CrossRef]
- Xiang, S.-R.; Doyle, A.; Holden, P.A.; Schimel, J.P. Drying and rewetting effects on C and N mineralization and microbial activity in surface and subsurface California grassland soils. Soil Biol. Biochem. 2008, 40, 2281–2289. [Google Scholar] [CrossRef]
- Rumpel, C.; Kögel-Knabner, I. Deep soil organic matter-a key but poorly understood component of terrestrial C cycle. Plant Soil 2011, 338, 143–158. [Google Scholar] [CrossRef]
- Adu, J.K.; Oades, J.M. Physical factors influencing decomposition of organic materials in soil aggregates. Soil Biol. Biochem. 1978, 10, 109–115. [Google Scholar] [CrossRef]
- Eusterhues, K.; Rumpel, C.; Kleber, M.; Kögel-Knabner, I. Stabilisation of soil organic matter by interactions with minerals as revealed by mineral dissolution and oxidative degradation. Org. Geochem. 2003, 34, 1591–1600. [Google Scholar] [CrossRef]
- Kieft, T.L.; Soroker, E.; Firestone, M.K. Microbial biomass response to a rapid increase in water potential when dry soil is wetted. Soil Biol. Biochem. 1987, 19, 119–126. [Google Scholar] [CrossRef]
- Rovira, P.; Vallejo, V.R. Labile and recalcitrant pools of carbon and nitrogen in organic matter decomposing at different depths in soil: An acid hydrolysis approach. Geoderma 2002, 107, 109–141. [Google Scholar] [CrossRef]
- Silveira, M.L.; Comerford, N.B.; Reddy, K.R.; Cooper, W.T.; El-Rifai, H. Characterization of soil organic carbon pools by acid hydrolysis. Geoderma 2008, 144, 405–414. [Google Scholar] [CrossRef]
- Harper, R.J.; Tibbett, M. The hidden organic carbon in deep mineral soils. Plant Soil 2013, 368, 641–648. [Google Scholar] [CrossRef]
- Koarashi, J.; Hockaday, W.C.; Masiello, C.A.; Trumbore, S.E. Dynamics of decadally cycling carbon in subsurface soils. J. Geophys. Res. Biogeosci. 2012, 117, G03033. [Google Scholar] [CrossRef]
- Scharlemann, J.P.W.; Tanner, E.V.J.; Hiederer, R.; Kapos, V. Global soil carbon: Understanding and managing the largest terrestrial carbon pool. Carbon Manag. 2014, 5, 81–91. [Google Scholar] [CrossRef]
Figure 1.
Research site locations at McCurtain County, Oklahoma; Buckingham County, Virginia; Taliaferro County, Georgia; and Taylor County, Florida, as indicated by dark green triangles. Light green shaded area indicates the native range of loblolly pine (http://esp.cr.usgs.gov/data/little/).
Figure 1.
Research site locations at McCurtain County, Oklahoma; Buckingham County, Virginia; Taliaferro County, Georgia; and Taylor County, Florida, as indicated by dark green triangles. Light green shaded area indicates the native range of loblolly pine (http://esp.cr.usgs.gov/data/little/).

Figure 2.
Fractionations of C: water-extractable fraction (WE), light fraction (LF), hydrolysable fraction (HF), and residual fraction (RF) of soils from four research locations at McCurtain County, Oklahoma; Buckingham County, Virginia; Taliaferro County, Georgia; and Taylor County, Florida . Error bars represent ± 1SE (n = 2).

Figure 3.
Comparison of soil respiration during soil incubations over control and three drying-wetting cycles. Top panels show soil respiration from four locations (Oklahoma, Virginia, Georgia, and Florida) under control condition. Three control cycles are indicated by C1, C2, and C3. Bottom panels show soil respiration from the same four locations under drying-wetting treatment. Three drying-wetting cycles are indicated by DW1, DW2, and DW3. Error bars represent ±1SE (n = 2).

Figure 4.
Soil respiration as a proportion of total soil carbon content over drying-wetting cycles (soil respiration/TC). Three drying-wetting cycles are indicated as DW1, DW2, and DW3. Soil respiration/total C content of three cycles were separated using Tukey’s significant difference test at the level of α = 0.05. The dissimilar letters next to bars are used to indicate significant differences between depths within a site. Error bars represent ±1SE (n = 2).
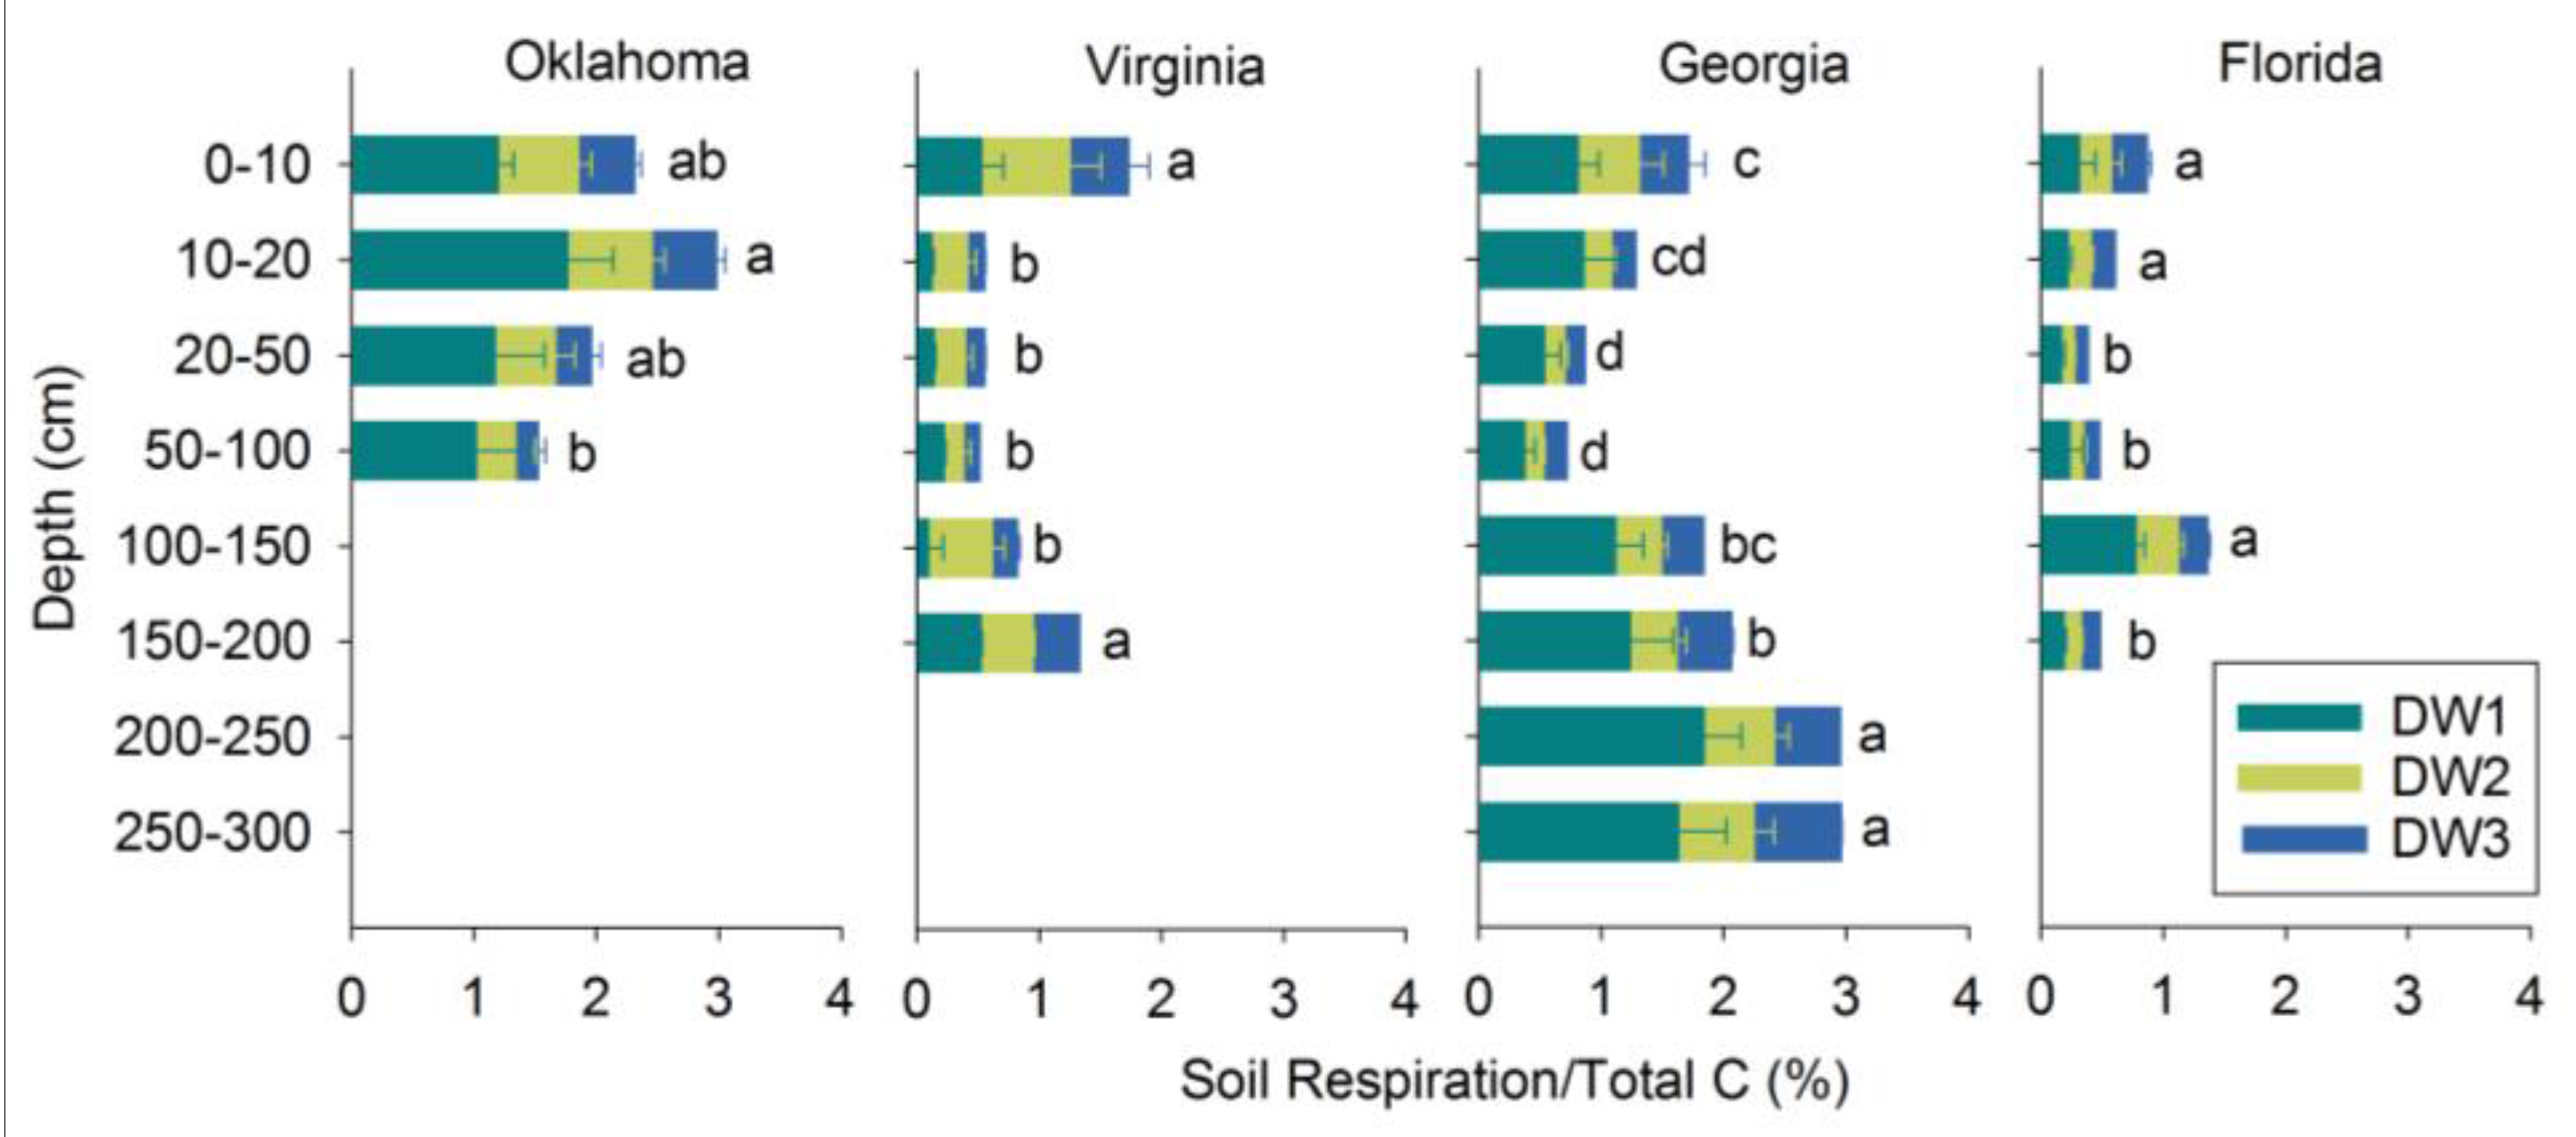
Figure 5.
Soil respiration as a proportion of soil water-extractable carbon over drying-wetting cycles. Three drying-wetting cycles are indicated as DW1, DW2, and DW3. Soil respiration/WE of three cycles were separated using Tukey’s significant difference test at the level of α = 0.05. The dissimilar letters next to bars are used to indicate significant differences between depths within a site. Error bars represent ±1SE (n = 2).

Figure 6.
Total C (TC), water-extractable fraction (WE), and fractionations of C: light fraction (LF), hydrolysable fraction (HF), and residual fraction (RF) compared with soil respiration under drying-wetting treatment using linear regression. All data were transformed to normal distributions. Coefficient of determination (R2), root mean square error (RMSE), and p values are reported. Black dots indicate data points. Solid black lines indicate regression lines. Blue lines indicate 95% confidence intervals. Red lines indicate 95% prediction interval.


Table 1.
Research site attributes with 30 year (1981–2010) average climate data (http://www.ncdc.noaa.gov).
Table 1.
Research site attributes with 30 year (1981–2010) average climate data (http://www.ncdc.noaa.gov).
| Location | Lat (°N) | Long (°W) | Avg Max Temp (°C) | Avg Min Temp (°C) | Avg Ppt (m) | Soil Series |
|---|---|---|---|---|---|---|
| McCurtain, Oklahoma | 35.15 | 94.97 | 23.9 | 9.4 | 1.3 | Ruston |
| Buckingham, Virginia | 37.57 | 78.53 | 19.4 | 6.7 | 1.1 | Littlejoe |
| Taliaferro, Georgia | 33.57 | 82.88 | 22.7 | 10.1 | 1.1 | Lloyd-Cecil |
| Taylor, Florida | 30.11 | 83.58 | 27.3 | 13.6 | 1.4 | Melvina-Moriah-Lutterloh |
Table 2.
Physical and chemical properties of soils from research locations at McCurtain County, Oklahoma; Buckingham County, Virginia; Taliaferro County, Georgia; and Taylor County, Florida. Values given as mean ± 1SE (n = 2).
Table 2.
Physical and chemical properties of soils from research locations at McCurtain County, Oklahoma; Buckingham County, Virginia; Taliaferro County, Georgia; and Taylor County, Florida. Values given as mean ± 1SE (n = 2).
| Location | Depth (cm) | Texture | pH | C (%) | N (%) |
|---|---|---|---|---|---|
| Oklahoma | 0–10 | loam | 4.8 ± 0.5 | 1.29 ± 0.25 | 0.07 ± 0.03 |
| 10–20 | loam | 4.2 ± 0.2 | 0.43 ± 0.12 | 0.04 ± 0.01 | |
| 20–50 | loam | 3.9 ± 0.0 | 0.32 ± 0.14 | 0.03 ± 0.00 | |
| 50–100 | clay loam | 3.6 ± 0.2 | 0.29 ± 0.03 | 0.03 ± 0.01 | |
| Virginia | 0–10 | silt loam | 4.2 ± 0.1 | 3.89 ± 0.54 | 0.14 ± 0.03 |
| 10–20 | loam | 4.5 ± 0.3 | 1.00 ± 0.24 | 0.04 ± 0.01 | |
| 20–50 | silty clay | 4.5 ± 0.4 | 0.52 ± 0.16 | 0.03 ± 0.00 | |
| 50–100 | silty clay loam | 4.9 ± 0.1 | 0.23 ± 0.05 | 0.02 ± 0.00 | |
| 100–150 | silty clay loam | 4.9 ± 0.0 | 0.09 ± 0.01 | 0.00 ± 0.00 | |
| Georgia | 0–10 | loam | 5.5 ± 0.5 | 1.92 ± 0.67 | 0.10 ± 0.03 |
| 10–20 | clay loam | 5.4 ± 0.2 | 0.87 ± 0.26 | 0.06 ± 0.01 | |
| 20–50 | clay | 5.4 ± 0.1 | 0.44 ± 0.13 | 0.04 ± 0.00 | |
| 50–100 | clay | 5.2 ± 0.4 | 0.25 ± 0.02 | 0.03 ± 0.00 | |
| 100–150 | clay | 5.8 ± 0.0 | 0.07 ± 0.03 | 0.00 ± 0.00 | |
| 150–200 | clay loam | 5.6 ± 0.1 | 0.06 ± 0.03 | 0.00 ± 0.00 | |
| 200–250 | clay loam | 5.4 ± 0.3 | 0.05 ± 0.02 | 0.00 ± 0.00 | |
| 250–300 | loam | 5.3 ± 0.2 | 0.05 ± 0.01 | 0.01 ± 0.00 | |
| Florida | 0–10 | sand | 5.5 ± 0.2 | 2.06 ± 0.36 | 0.07 ± 0.02 |
| 10–20 | sand | 5.6 ± 0.1 | 1.30 ± 0.10 | 0.04 ± 0.01 | |
| 20–50 | sand | 5.8 ± 0.3 | 0.62 ± 0.09 | 0.02 ± 0.00 | |
| 50–100 | sand | 6.2 ± 0.4 | 0.22 ± 0.03 | 0.01 ± 0.00 | |
| 100–150 | sandy clay loam | 5.2 ± 0.1 | 0.07 ± 0.01 | 0.00 ± 0.00 | |
| 150–170 | sandy clay loam | 4.8 ± 0.3 | 0.33 ± 0.03 | 0.00 ± 0.00 |
© 2018 by the authors. Licensee MDPI, Basel, Switzerland. This article is an open access article distributed under the terms and conditions of the Creative Commons Attribution (CC BY) license (http://creativecommons.org/licenses/by/4.0/).
Share and Cite
MDPI and ACS Style
Qi, J.; Markewitz, D.; Foroughi, M.; Jokela, E.; Strahm, B.; Vogel, J. Drying-Wetting Cycles: Effect on Deep Soil Carbon. Soil Syst. 2018, 2, 3. https://doi.org/10.3390/soils2010003
AMA Style
Qi J, Markewitz D, Foroughi M, Jokela E, Strahm B, Vogel J. Drying-Wetting Cycles: Effect on Deep Soil Carbon. Soil Systems. 2018; 2(1):3. https://doi.org/10.3390/soils2010003
Chicago/Turabian StyleQi, Ji, Daniel Markewitz, Maryam Foroughi, Eric Jokela, Brian Strahm, and Jason Vogel. 2018. "Drying-Wetting Cycles: Effect on Deep Soil Carbon" Soil Systems 2, no. 1: 3. https://doi.org/10.3390/soils2010003