Species-Specific Impacts of Invasive Plant Success on Vertical Profiles of Soil Carbon Accumulation and Nutrient Retention in the Minjiang River Tidal Estuarine Wetlands of China

 and
and
Abstract
:1. Introduction
2. Materials and Methods
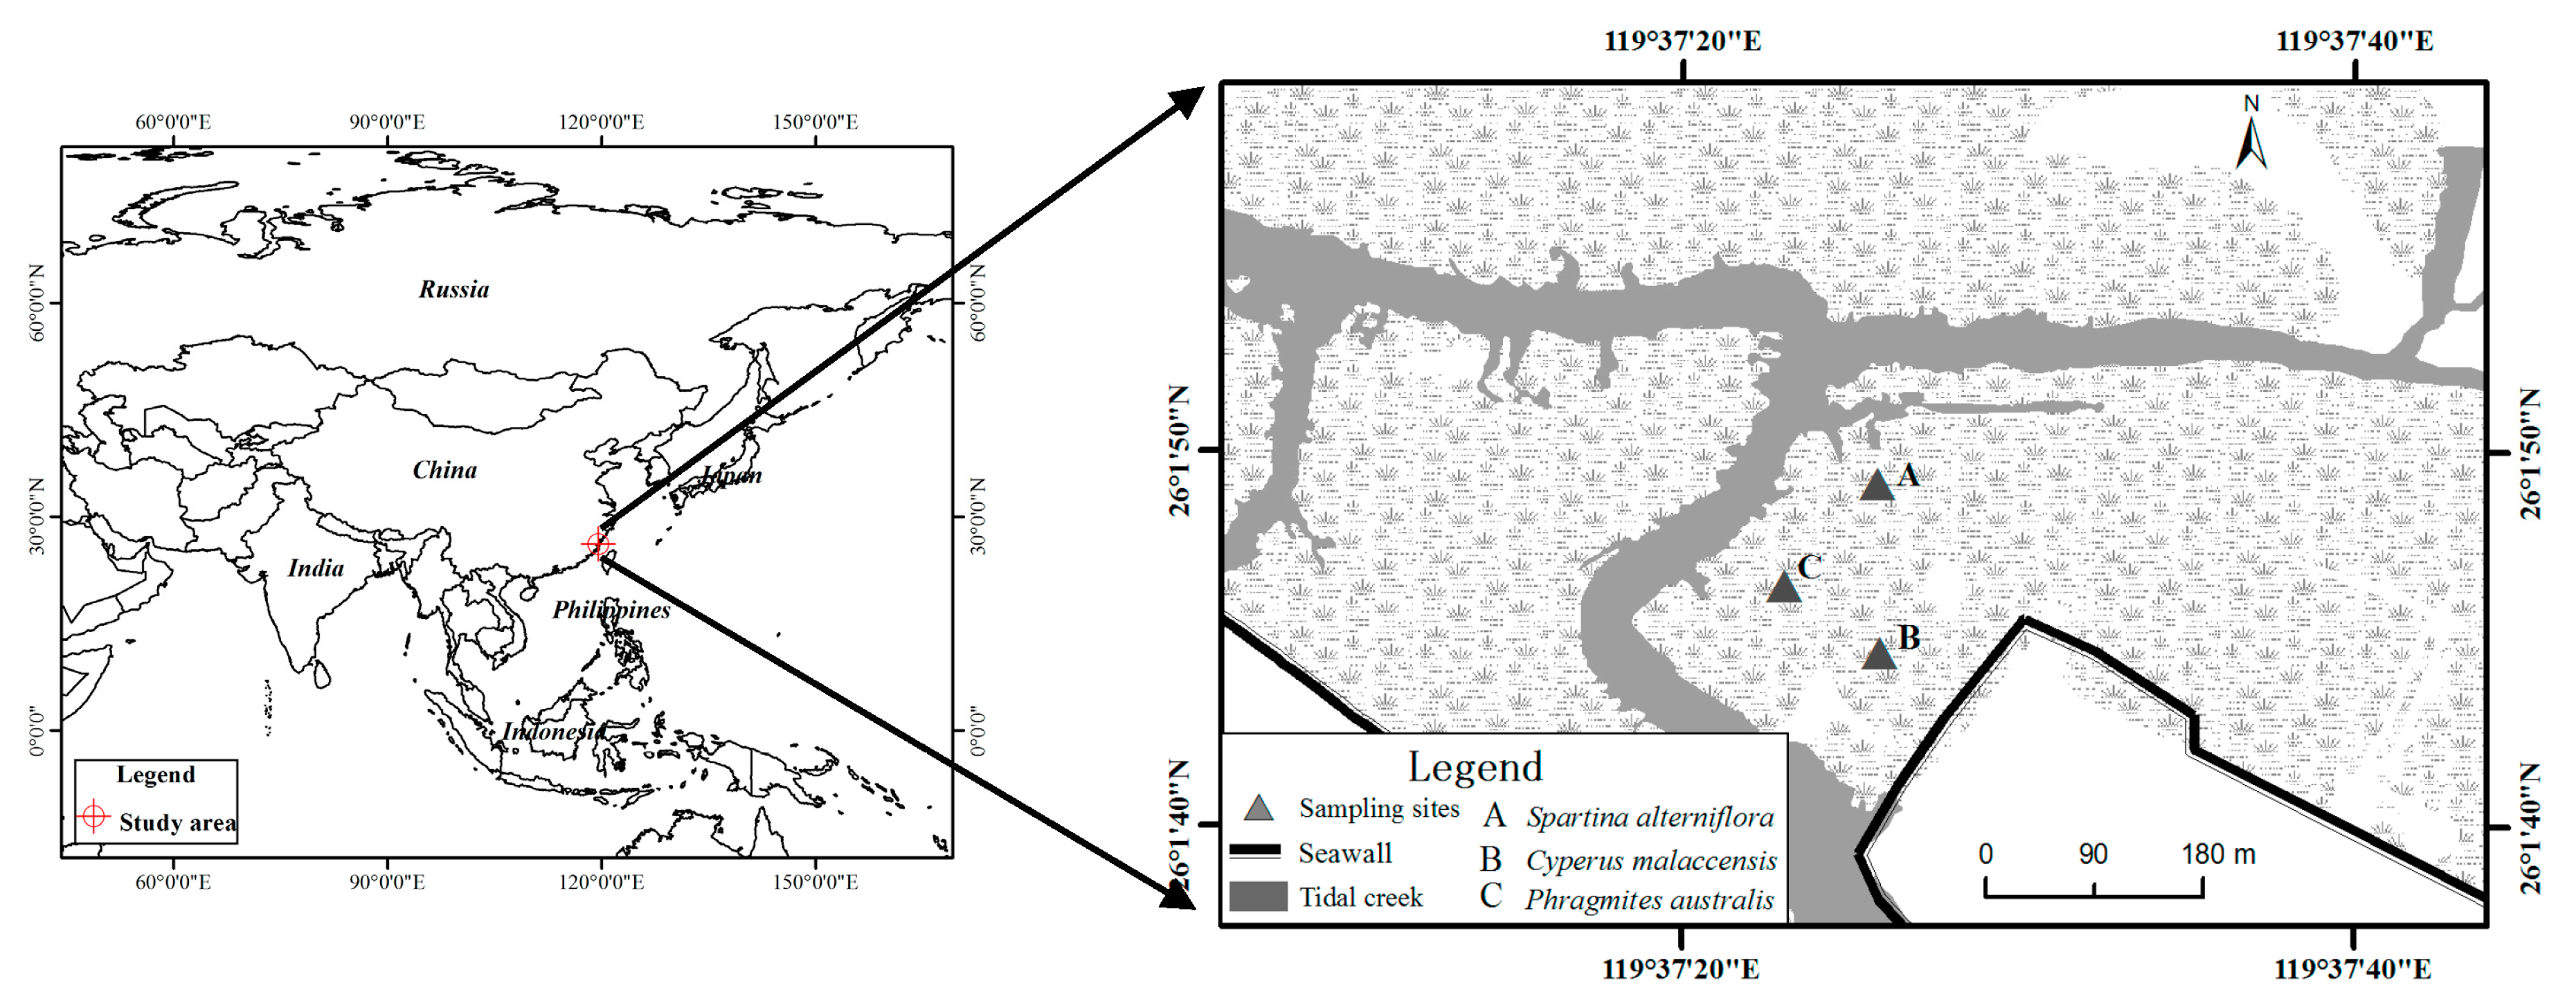
2.1. Study Area
2.2. Sample Collection and Measurements
2.3. Statistical Analyses
3. Results
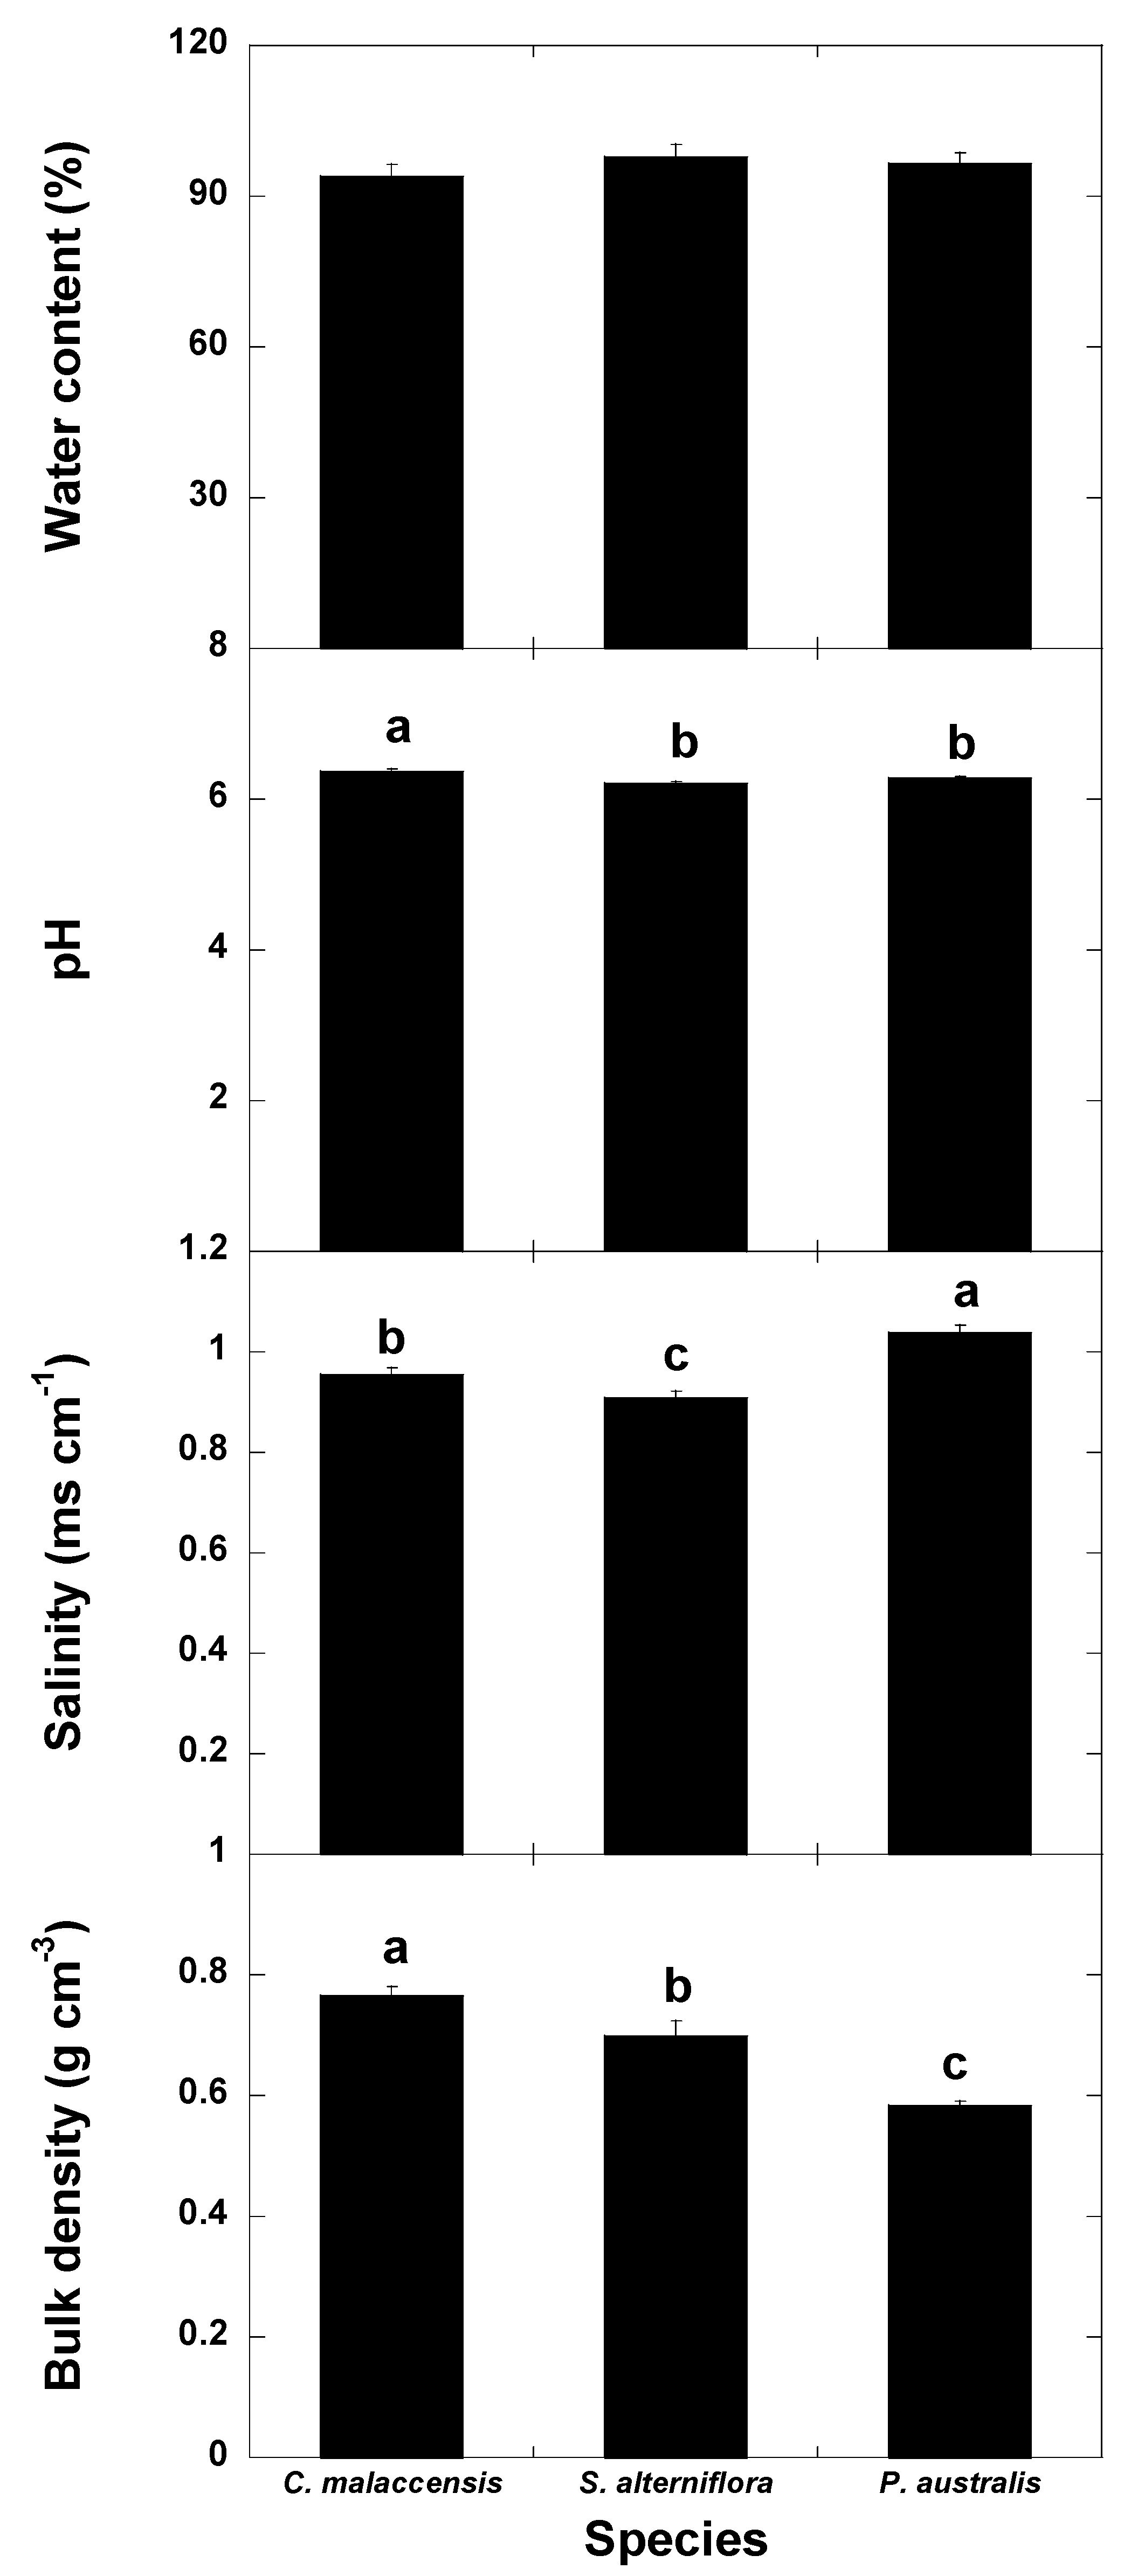
3.1. Univariate Analyses
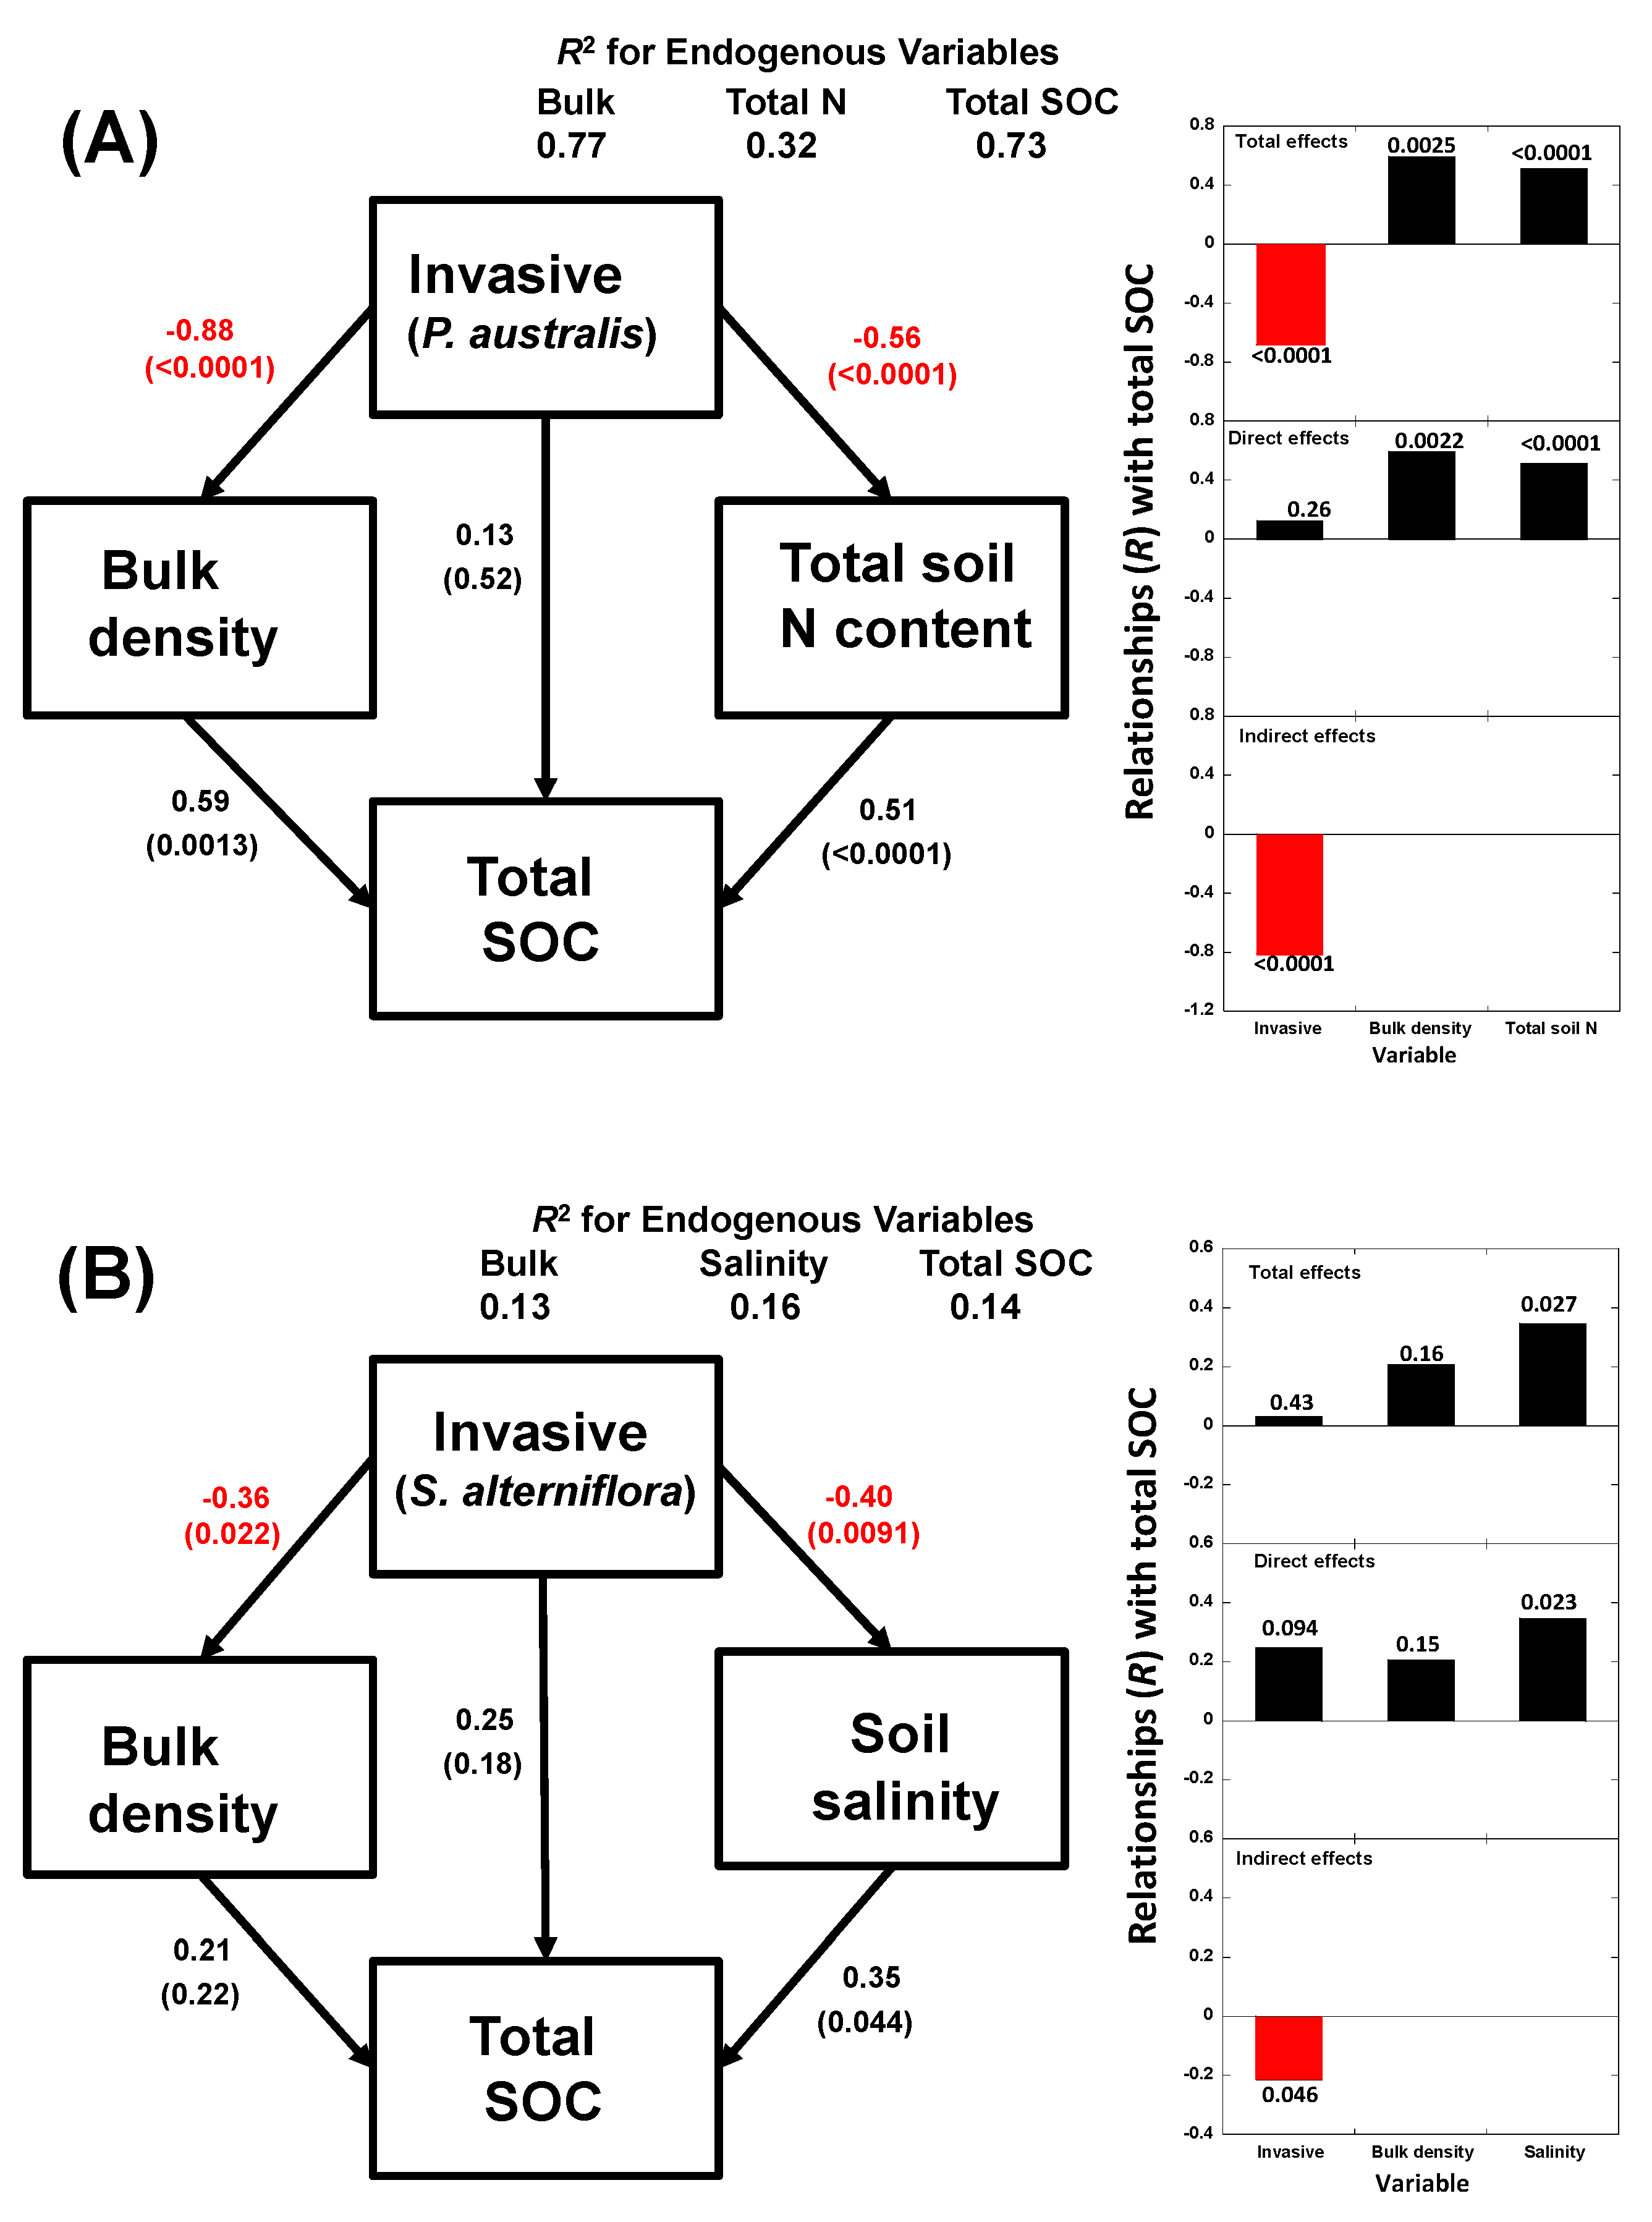
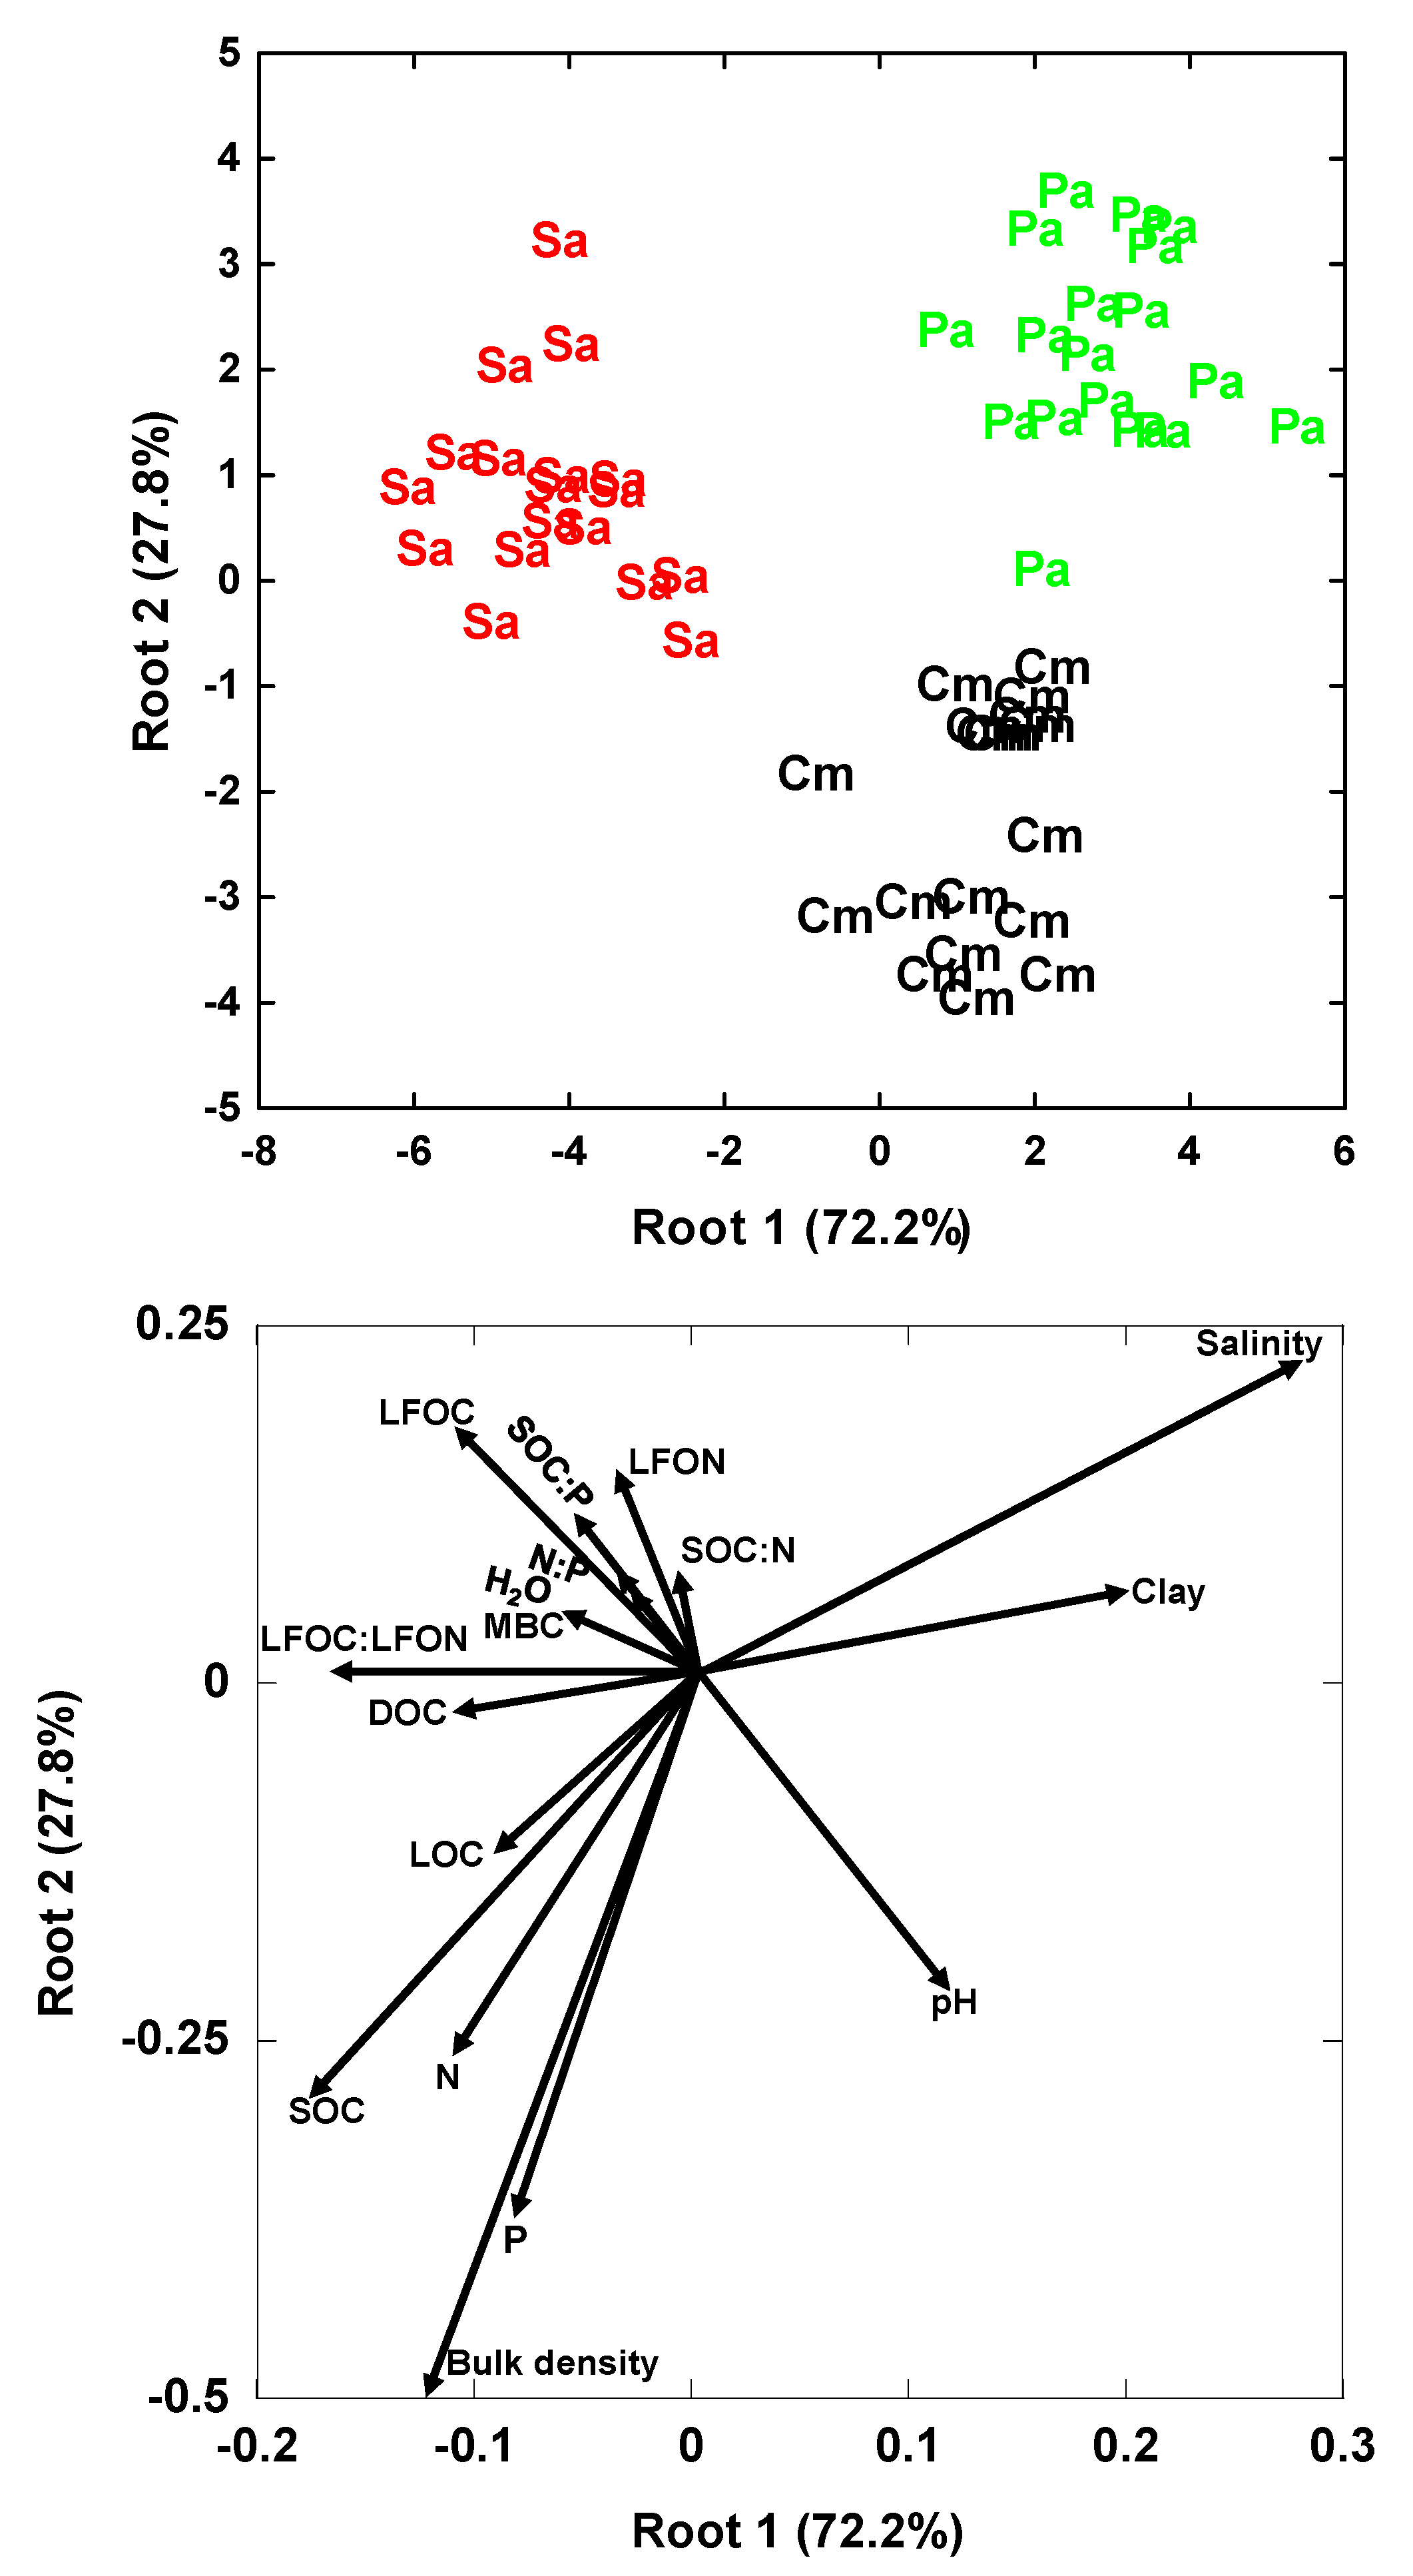
3.2. Multivariate Analyses
4. Discussion
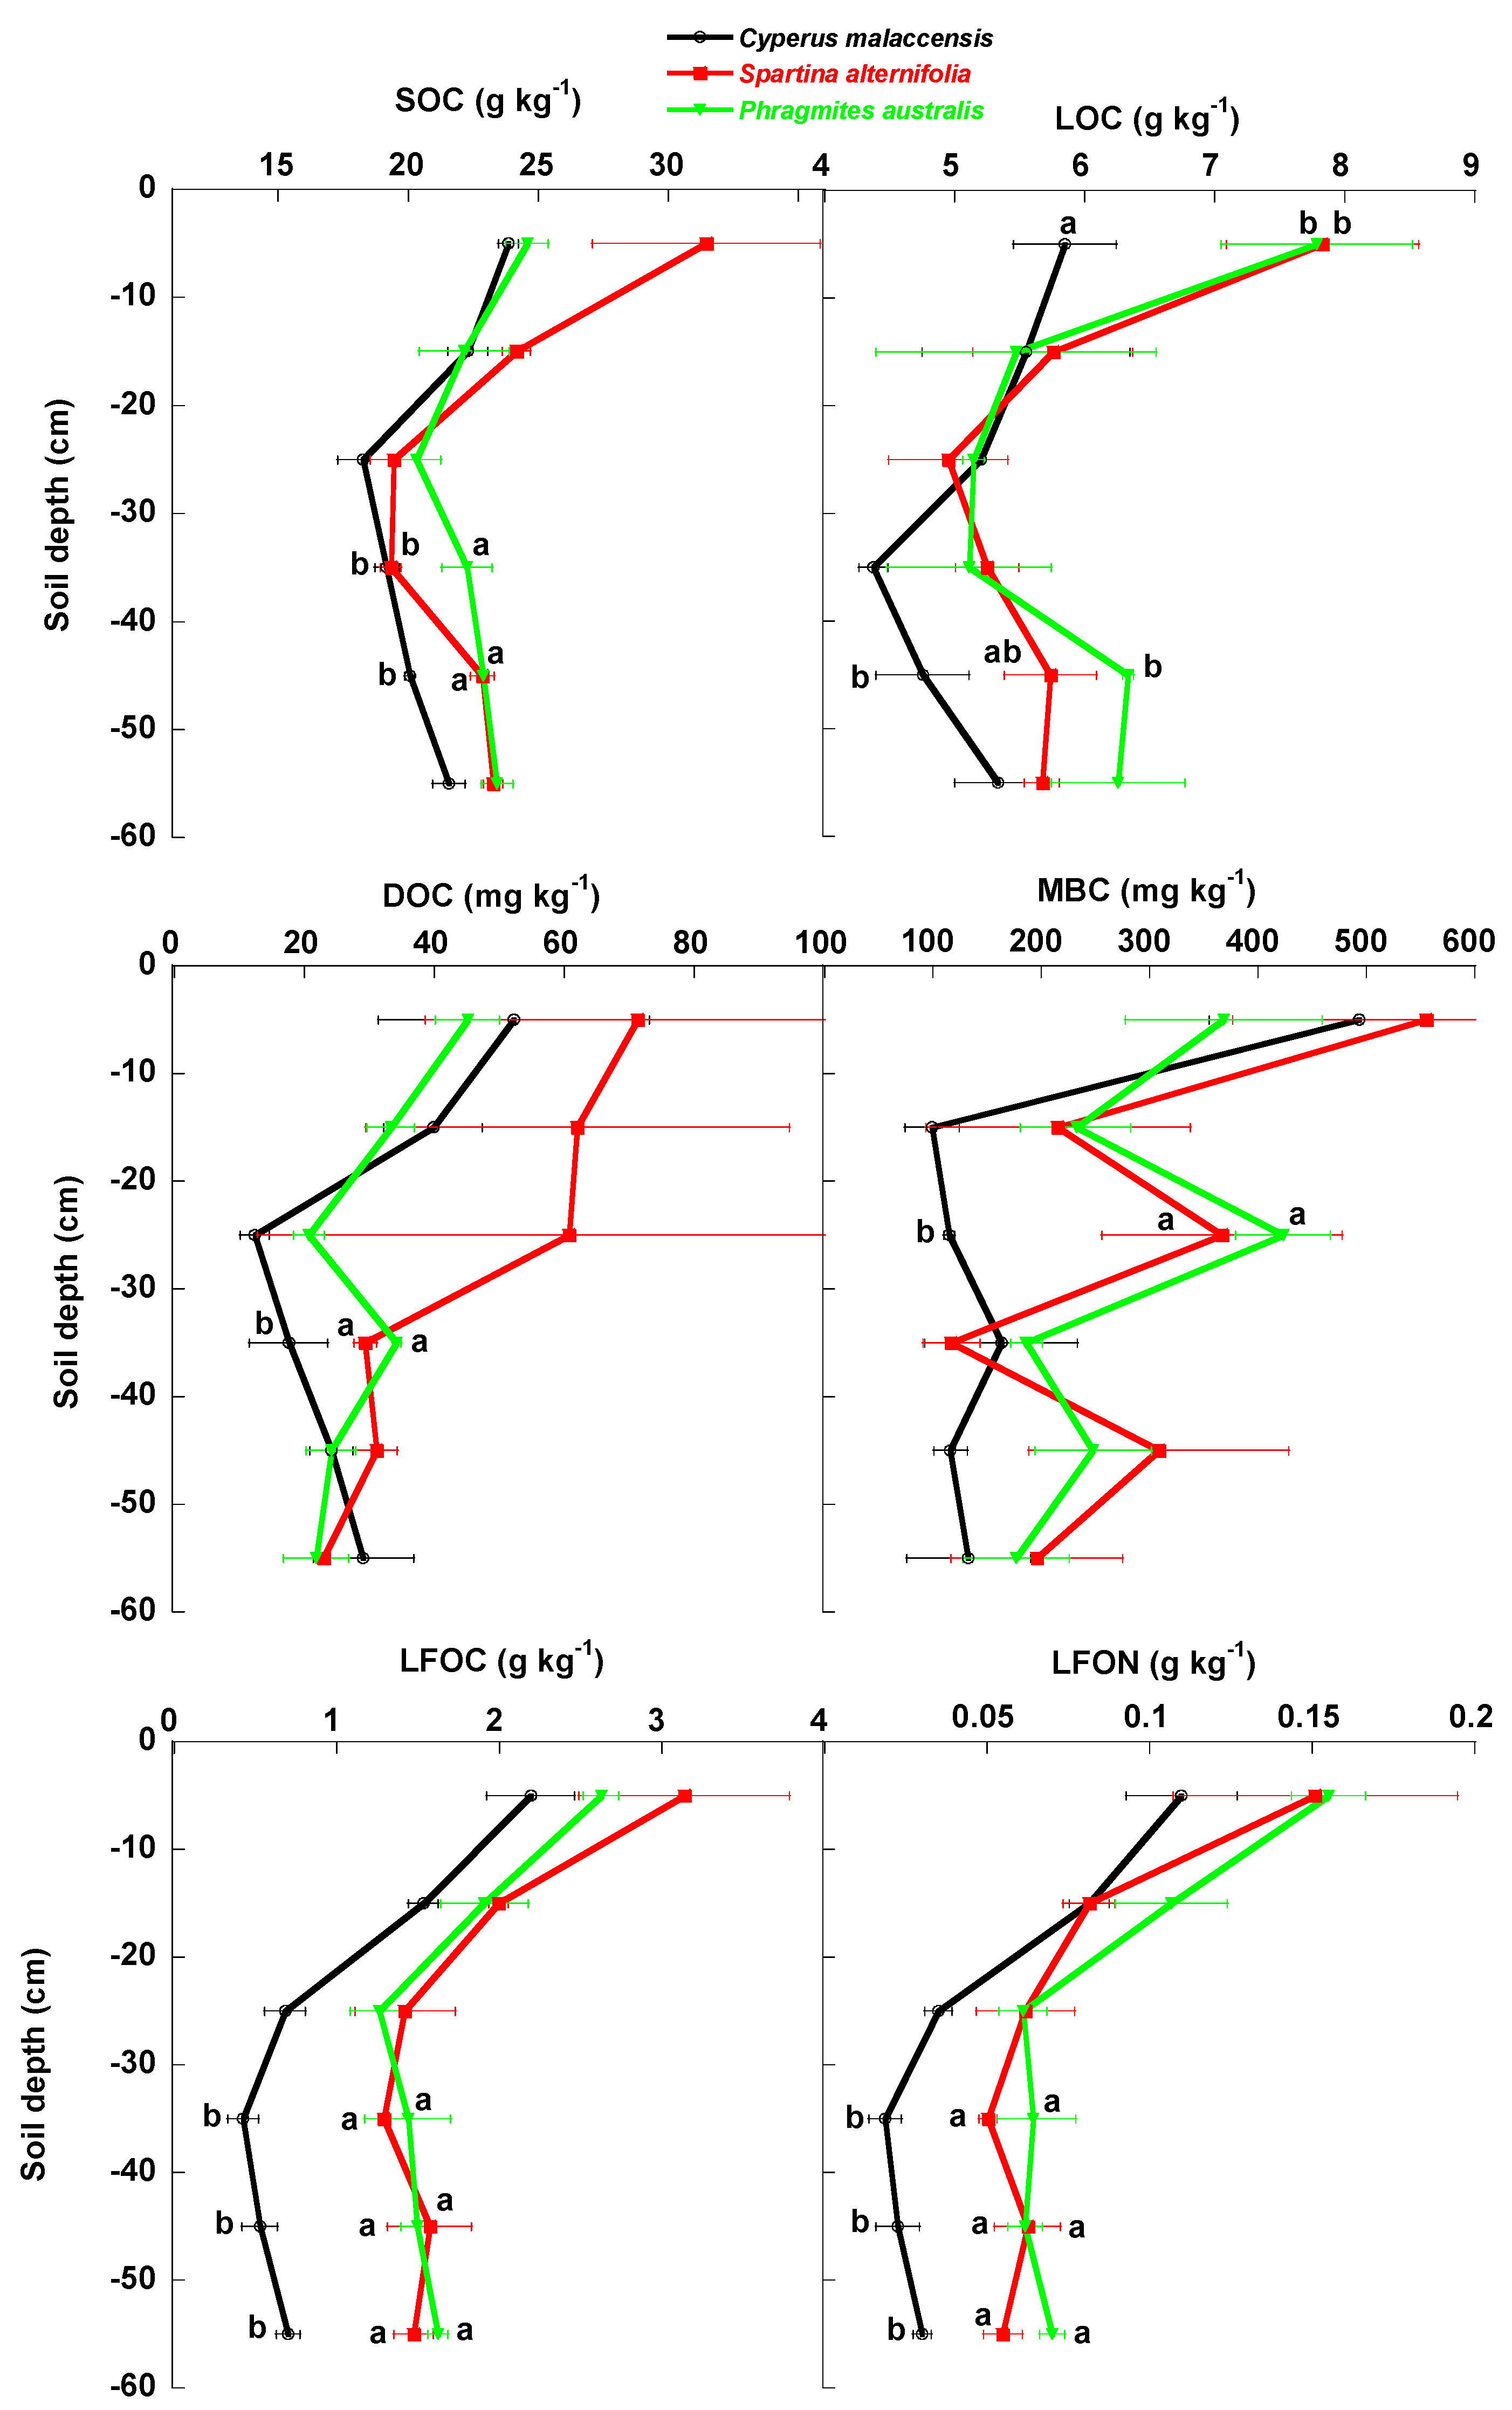
4.1. Changes of Carbon Fractions and N and P along Soil Profile
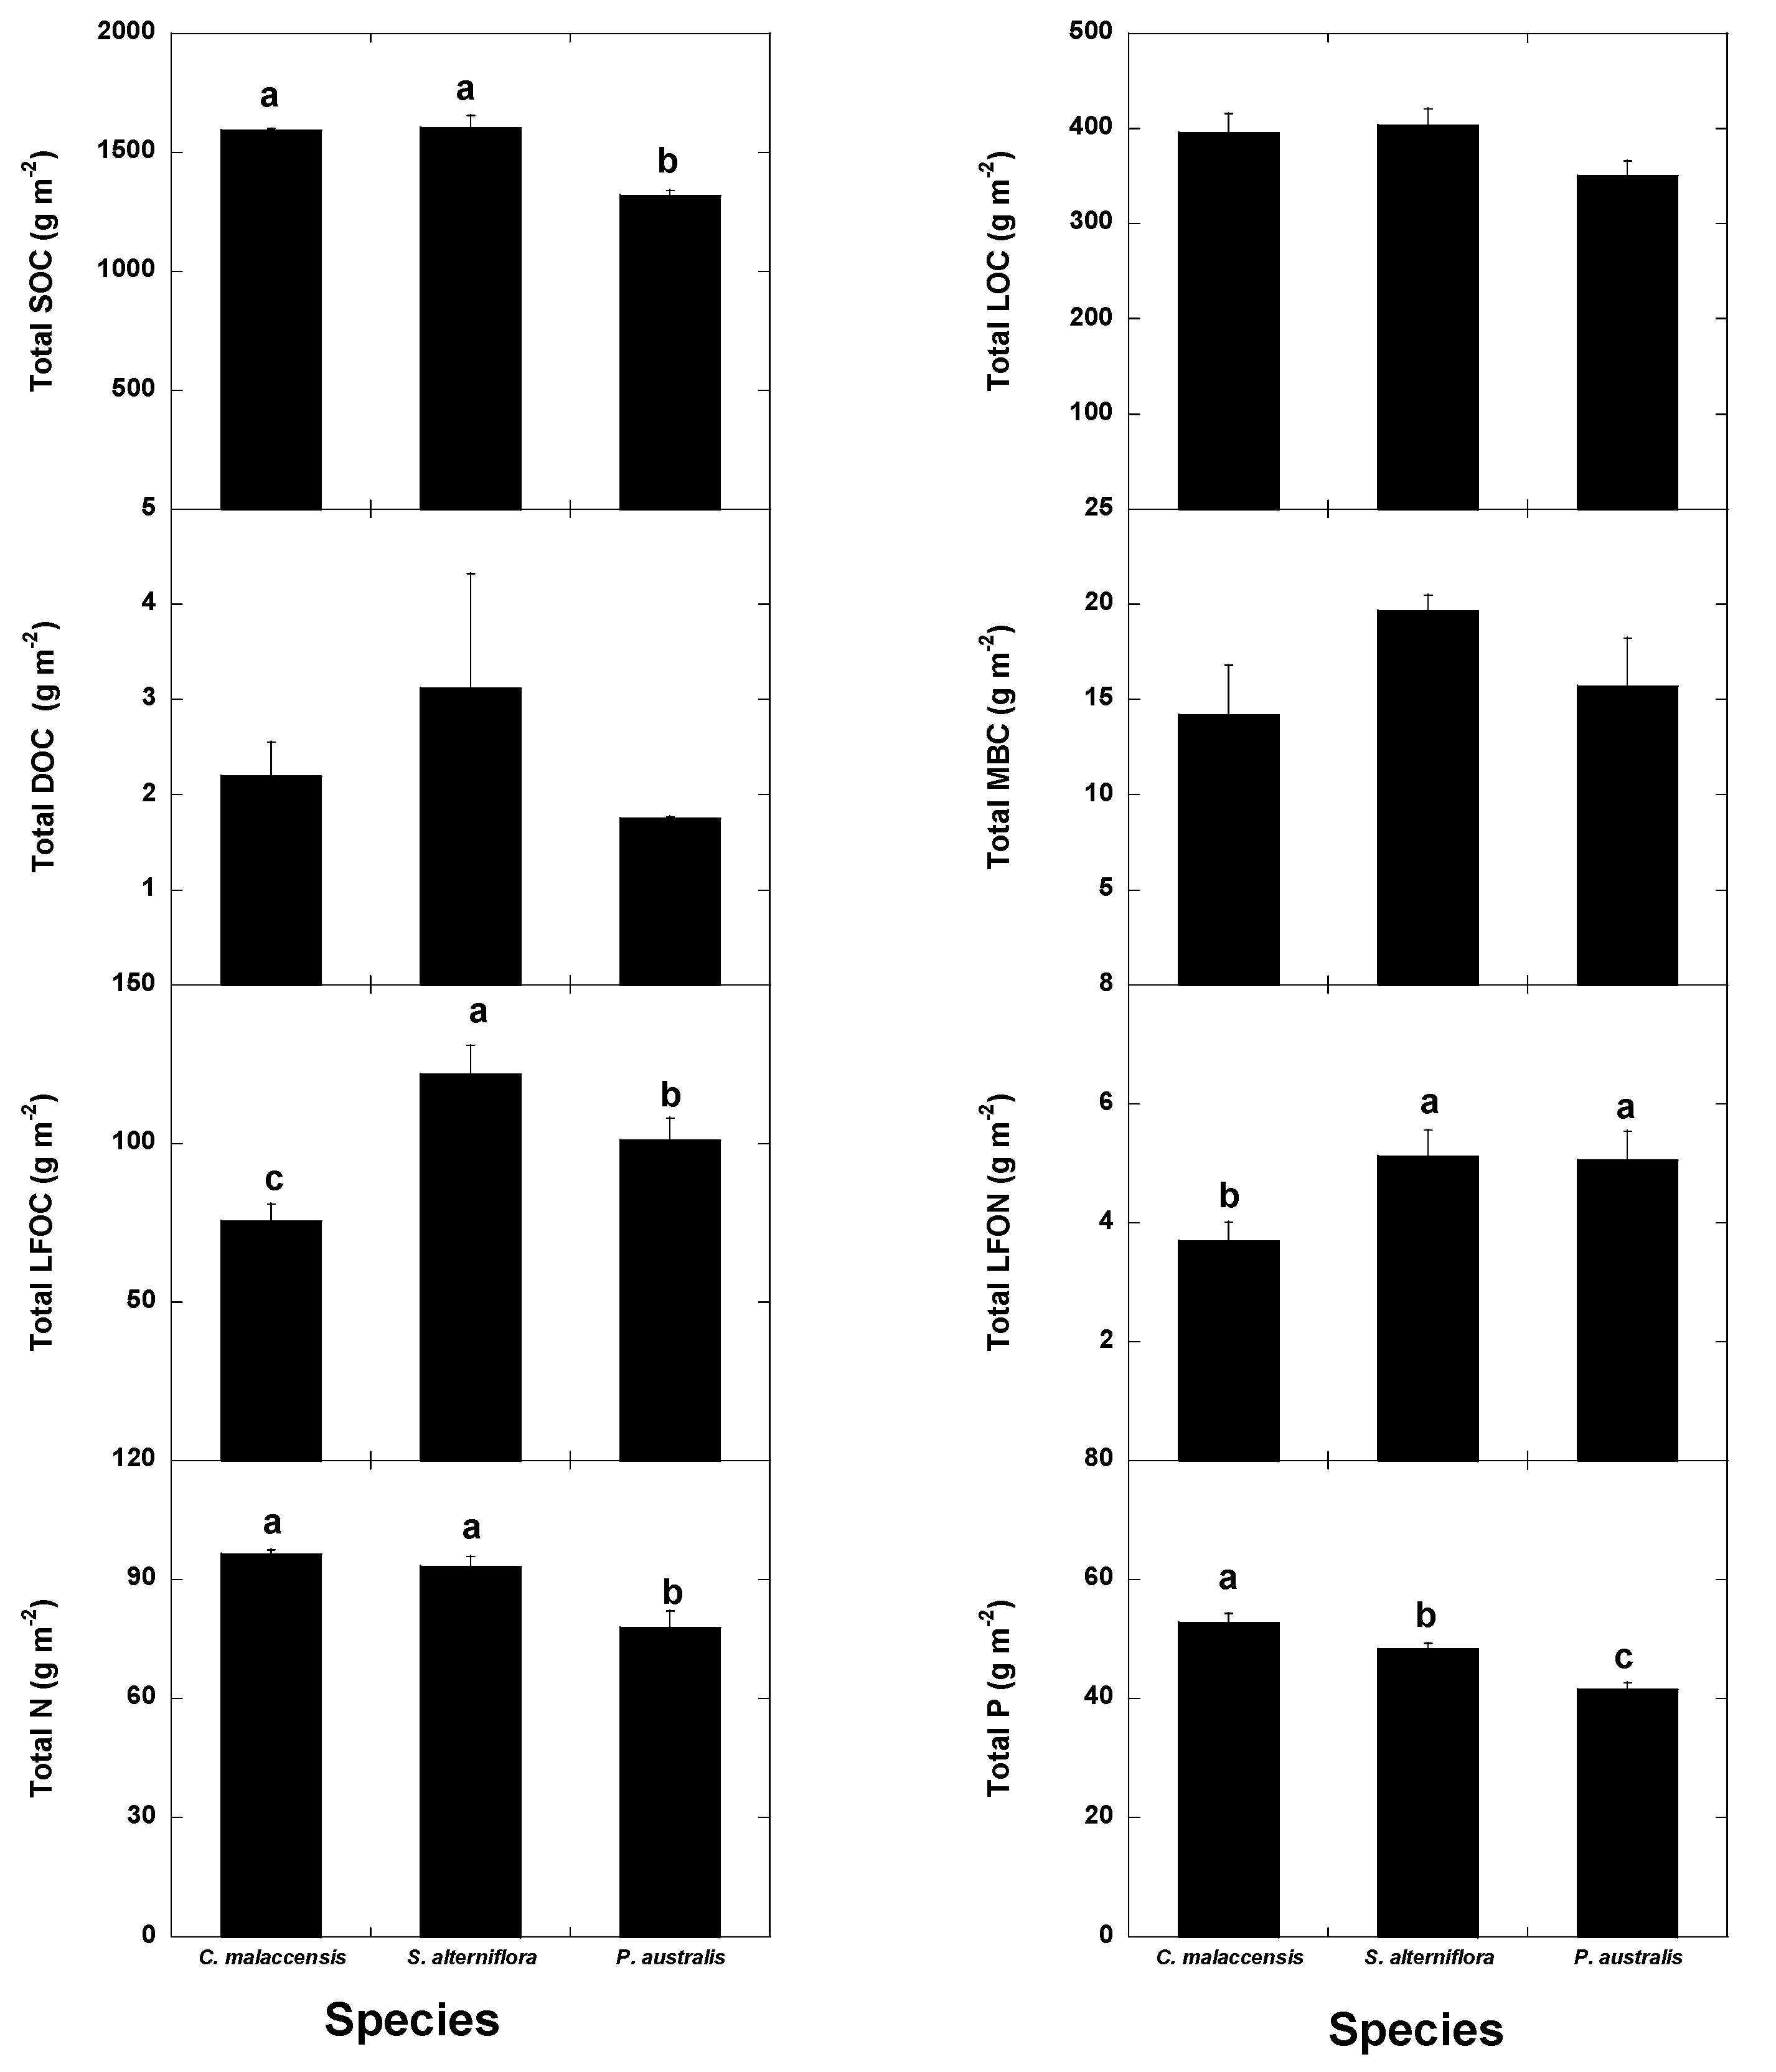
4.2. Relationships of Species Invasion with Soil C Concentrations and Contents
4.3. Similarities and Differences in the Impacts of Invasive Success between S. alterniflora and P. australis
5. Conclusions
Acknowledgments
Author Contributions
Conflicts of Interest
References
- International Panel on Climate Change. Global Carbon Cycle Overview. Summary for Police Makers. In Land Use, Land-Use Change and Forestry; IPCC special Reports; Watson, R.T., Noble, I.R., Bolin, B., Ravindranath, N.H., Verarde, D.J., Dokken, D.J., Eds.; IPCC: Geneva, Switzerland, 2000; p. 375. [Google Scholar]
- Joiner, D.W.; Lafleur, P.M.; McCaughey, J.H.; Bartlett, P.A. Interannual variability in carbon dioxide exchanges at a boreal wetland in the BOREAS northern study area. J. Geophys. Res. 1999, 104, 27663–27672. [Google Scholar] [CrossRef]
- Smith, P. Soils as carbon sinks: The global context. Soil Use Manag. 2004, 20, 212–218. [Google Scholar] [CrossRef]
- Bonan, G.B.; van Cleve, K. Soil temperature, nitrogen mineralization and carbon source-sink relationships in boreal forests. Can. J. For. Res. 2011, 22, 629–639. [Google Scholar] [CrossRef]
- Bianchi, T.S.; Allison, M.A.; Zhao, J.; Li, X.X.; Comeaux, R.S.; Feagin, R.A.; Kulawardhana, R.W. Historical reconstruction of mangrove expansion in the Gulf of Mexico: Linking climate change with carbon sequestration in coastal wetlands. Estuar. Coast. Shelf Sci. 2013, 119, 7–16. [Google Scholar] [CrossRef]
- Burden, A.; Garbutt, R.A.; Evans, C.D.; Jones, D.L.; Cooper, D.M. Carbon sequestration and biogeochemical cycling in a saltmarsh subject to coastal managed realignment. Estuar. Coast. Shelf Sci. 2013, 120, 12–20. [Google Scholar] [CrossRef] [Green Version]
- Mitsch, W.J.; Bernal, B.; Nahlik, A.M.; Mander, U.; Zhang, L.; Anderson, C.J.; Jorgensen, S.E.; Brix, H. Wetlands, carbon, and climate change. Landsc. Ecol. 2013, 28, 583–597. [Google Scholar] [CrossRef]
- Wetland China. The Report on the Second National Wetland Resources Survey (2009–2013). 2014. Available online: http://www.shidi.org/zt/2014xwfbh/ (accessed on 12 June 2017).
- Liu, J.Q.; Zeng, C.S.; Chen, N. Research of Minjiang River Estuary Wetland; Science Press: Beijing, China, 2006. [Google Scholar]
- Wang, W.; Sardans, J.; Zeng, C-S.; Tong, C.; Peñuelas, J. Impact of plant invasion and increasing floods on total soil phosphorus and its fractions in the Minjiang river estuarine wetlands, China. Wetlands 2016, 36, 21–36. [Google Scholar] [CrossRef]
- Schewe, J.; Levermann, A.; Meinshausen, M. Climate change under a scenario near 1.5 degrees C of global warming: Monsoon intensification, ocean warming and stric sea level rise. Earth Syst. Dyn. 2011, 2, 25–35. [Google Scholar] [CrossRef]
- Mendelsohn, R.; Emanuel, K.; Chonabayashi, S.; Bakkensen, L. The impact of climate change on tropical cyclone damage. Nat. Clim. Chang. 2012, 2, 205–209. [Google Scholar] [CrossRef]
- Sardans, J.; Rivas-Ubach, A.; Peñuelas, J. The C:N:P stoichiometry of organisms and ecosystems in a changing world: A review and perspectives. Perspect. Plant Ecol. Evol. Syst. 2012, 14, 33–47. [Google Scholar] [CrossRef]
- Ramsar. The Ramsar Manual, 6th ed.; Ramsar Convention Secretariat: Gland, Switzerland, 2013; p. 110. [Google Scholar]
- Piecuch, C.G.; Ponte, R.M. Mechanisms of global-mean steric sea level change. J. Clim. 2014, 27, 824–834. [Google Scholar] [CrossRef]
- Sardans, J.; Peñuelas, J. The role of plants in the effects of Global Change on nutrient availability and stoichiometry in the plant-soil system. Plant Physiol. 2012, 160, 1741–1761. [Google Scholar] [CrossRef] [PubMed]
- Wang, W.; Sardans, J.; Zeng, C.; Zhong, C.; Li, Y.; Peñuelas, J. Responses of soil nutrient concentrations and stoichiometry to different human land uses in a subtropical tidal wetland. Geoderma 2014, 232–234, 459–470. [Google Scholar] [CrossRef] [PubMed]
- Wang, W.; Wang, C.; Sardans, J.; Tong, C.; Jia, R.; Zeng, C.; Peñuelas, J. Flood regime affects soil stoichiometry and the distribution of the invasive plants in subtropical estuarine wetlands in China. Catena 2015, 128, 144–154. [Google Scholar] [CrossRef]
- Funk, J.L.; Vitousek, P.M. Resource-use efficiency and plant invasion in low-resource systems. Nature 2007, 446, 1079–1081. [Google Scholar] [CrossRef] [PubMed]
- González, A.L.; Kominoski, J.S.; Danger, M.; Ishida, S.; Iwai, N.; Rubach, A. Can ecological stoichiometry help explain patterns of biological invasion? Oikos 2010, 119, 779–790. [Google Scholar] [CrossRef]
- Matzek, V. Superior performance and nutrient-use efficiency of invasive plants over non-invasive congeners in a resource-limited environment. Biol. Invasions 2011, 13, 3005–3014. [Google Scholar] [CrossRef]
- Sardans, J.; Bartrons, M.; Margalef, O.; Gargallo-Garriga, A.; Janssens, I.A.; Ciais, P.; Obersteiner, M.; Sigurdsson, B.D.; Chen, H.Y.; Peñuelas, J. Plant invasion is associated with higher plant-soil nutrient concentrations in nutrient-poor environments. Glob. Chang. Biol. 2017, 23, 1282–1291. [Google Scholar] [CrossRef] [PubMed] [Green Version]
- Wissing, L.; Kölbl, A.; Vogelsang, V.; Fu, J.; Cao, Z.; Kögel-Knabner, I. Organic carbon accumulation in a 2000-year chronosequence of paddy soil evolution. Catena 2011, 87, 376–385. [Google Scholar] [CrossRef]
- Kimura, M.; Murase, J.; Lu, Y. Carbon cycling in rice field ecosystems in the context of input, decomposition and translocation of organic materials and the fates of their end products (CO2 and CH4). Soil Biol. Biochem. 2004, 36, 1399–1416. [Google Scholar] [CrossRef]
- Chen, H.L.; Zhou, J.M.; Xiao, B.H. Characterization of dissolved organic matter derived from rice straw at different stages of decay. J. Soil Sediment. 2010, 10, 915–922. [Google Scholar] [CrossRef]
- Wang, W.; Lai, D.Y.F.; Wang, C.; Pan, T.; Zeng, C. Effects of rice straw incorporation on active soil organic carbon pools in a subtropical paddy field. Soil Tillage Res. 2015, 152, 8–16. [Google Scholar] [CrossRef]
- Gu, L.; Post, W.M.; King, A.W. Fast labile carbon turnover obscures sensitivity of heterotrophic respiration from soil to temperature: A model analysis. Glob. Biogeochem. Cycles 2004, 18. [Google Scholar] [CrossRef]
- Xu, M.; Lou, Y.; Sun, X.; Wang, W.; Baniyamuddin, M.; Zhao, K. Soil organic carbon active fractions as early indicators for total carbon change under straw incorporation. Biol. Fertil. Soils 2011, 47, 745–752. [Google Scholar] [CrossRef]
- Zhao, F.; Yang, G.; Han, X.; Feng, Y.; Ren, G. Stratification of carbon fractions and carbon management index in deep soil affected by the Grain-to-Green Program in China. PLoS ONE 2014, 9, e99657. [Google Scholar] [CrossRef] [PubMed]
- Knoblauch, C.; Maarifat, A.A.; Pfeiffer, E.M.; Faefele, S.M. Degradability of black carbon and its impact on trace gas fluxes and carbon turnover in paddy soils. Soil Biol. Biochem. 2011, 43, 1768–1778. [Google Scholar] [CrossRef]
- Hanke, A.; Cerli, C.; Muhr, J.; Borken, W.; Kalbitz, K. Redox control on carbon mineralization and dissolved organic matter along a chronosequence of paddy soils. Eur. J. Soil Sci. 2013, 64, 476–487. [Google Scholar] [CrossRef]
- Peñuelas, J.; Sardans, J.; Rivas-Ubach, A.; Janssens, I.A. The human-induced imbalance between C, N and P in Earth’s life system. Glob. Chang. Biol. 2012, 189, 5–8. [Google Scholar] [CrossRef]
- Peñuelas, J.; Poulter, B.; Sardans, J.; Ciais, P.; van der Velde, M.; Bopp, L.; Boucher, O.; Godderis, Y.; Llusià, J.; Nardin, E.; et al. Human-induced nitrogen-Phosphorus imbalances alter natural and managed ecosystems across the globe. Nat. Commun. 2013, 4, 2934. [Google Scholar] [CrossRef] [PubMed] [Green Version]
- Daehler, C.C. Performance comparisons of co-occuring native and alien invasive plants: Implications for conservation and restoration. Annu. Rev. Ecol. Evol. Syst. 2003, 34, 183–211. [Google Scholar] [CrossRef]
- Tian, H.; Chen, G.; Zhang, C.; Melillo, J.; Hall, C. Pattern and variation of C: N: P ratios in China’s soils: A synthesis of observational data. Biogeochemistry 2010, 98, 139–151. [Google Scholar] [CrossRef]
- Schipper, L.A.; Sparling, G.P. Accumulation of soil organic C and change in C:N ratio after establishment of pastures on reverted scrubland in New Zealand. Biogeochemistry 2011, 104, 49–58. [Google Scholar] [CrossRef]
- Senga, Y.; Hiroki, M.; Nakamura, Y.; Watarai, Y.; Watanable, Y.; Nohara, S. Vertical profiles of DIN, DOC, and microbial activities in the wetland soil of Kushiro mire, northeastern Japan. Limnology 2011, 12, 17–23. [Google Scholar] [CrossRef]
- Xiang, J.; Liu, D.Y.; Ding, W.X.; Yuan, J.J.; Lin, Y.X. Invasion chronosequence of Spartina alterniflora on methane emission and organic carbon sequestration in a coastal salt marsh. Atmos. Environ. 2015, 112, 72–80. [Google Scholar] [CrossRef]
- Craft, C.; Reader, J.; Sacco, J.N.; Broome, S.W. Twenty-five years of ecosystem development of constructed Spartina alterniflora marshes. Ecol. Appl. 1999, 9, 1405–1419. [Google Scholar] [CrossRef]
- Zheng, C.H.; Zeng, C.S.; Chen, Z.Q.; Lin, M.C. A study on the changes of landscape pattern of estuary wetlands of the Minjiang River. Wetl. Sci. 2006, 4, 29–34. [Google Scholar]
- Tong, C.; Liu, B.G. Litter decomposition and nutrient dynamics in different tidal water submergence environments of estuarine tidal wetland. Geogr. Res. 2009, 28, 118–128. [Google Scholar]
- Jia, R.X.; Tong, C.; Wang, W.Q.; Zeng, C.S. Organic carbon concentrations and storages in the salt marsh sediments in the Min River estuary. Wetl. Sci. 2008, 6, 492–499. [Google Scholar]
- Sorrell, B.; Brix, H.; Schierup, H.H.; Lorenzen, B. Die-back of Phragmites australis: Influence on the distribution and rate of sediment methanogenesis. Biogeochemistry 1997, 36, 173–188. [Google Scholar] [CrossRef]
- Bai, J.H.; Yang, H.O.; Deng, W.; Zhu, Y.M.; Zhang, X.L.; Wang, Q.G. Spatial distribution characteristics of organic matter and total nitrogen of marsh soils in river marginal wetlands. Geoderma 2005, 124, 181–192. [Google Scholar] [CrossRef]
- Lu, R.K. Analysis Methods of Soil Science and Agricultural Chemistry; Agriculture Science and Technology Press: Beijing, China, 1999. [Google Scholar]
- Raamsdonk, L.M.; Teusink, B.; Broadhurst, D.; Zhang, N.S.; Hayes, A.; Walsh, M.C.; Berden, J.A.; Brudle, K.M.; Kell, D.K.; Rowland, J.J.; et al. A functional genomics strategy that uses metabolome data to reveal the phenotype of silent mutations. Nat. Biotechnol. 2001, 19, 45–50. [Google Scholar] [CrossRef] [PubMed]
- Fox, J.; Nie, Z.; Byrnes, J. SEM: Structural Equation Models. 2013. Available online: http://cran.r-project.org/package=sem (accessed on 24 July 2017).
- Davison, A.C.; Hinkley, D.V.; Schechtman, E. Efficient Bootstrap Simulation. Biometrika 1986, 73, 555–566. [Google Scholar] [CrossRef]
- Mitchell-Olds, T. Jackknife, bootstrap and other resampling methods in regression analysis. Ann. Stat. 1986, 14, 1316–1318. [Google Scholar] [CrossRef]
- Lu, G.; Li, Z.; Zhao, X.; Jia, Q.Y.; Xie, Y.; Zhou, G. Vertical distribution of soil organic carbon and total nitrogen in reed wetland. Chin. J. Appl. Ecol. 2006, 17, 384–389. [Google Scholar]
- Ostrowska, A.; Porebska, G. Assessment of the C/N ratio as indicator of the decomposability of organic matter in forest soils. Ecol. Indic. 2015, 49, 104–109. [Google Scholar] [CrossRef]
- Alongi, D.M.; Wattayakorn, G.; Pfitzner, J.; Tirendi, F.; Zagorskis, I.; Brunskill, G.J.; Davidson, A.; Clough, B.F. Organic carbon accumulation and metabolic pathways in sediments of mangrove forests in southern Thailand. Mar. Geol. 2001, 179, 85–103. [Google Scholar] [CrossRef]
- Maynard, J.J.; Dahlgren, R.A.; O’Geen, A.T. Soil carbon cycling and sequestration in a seasonally satured wetland receiving agricultural runoff. Biogeosciences 2011, 8, 3391–3406. [Google Scholar] [CrossRef]
- Peng, P.; Zhang, W.; Tong, C.; Qiu, S.; Zhang, W. Soil C, N and P contents and their relationships with soil physical properties in wetlands of Dongting lake floodplain. Chin. J. Ecol. 2005, 16, 1872–1878. [Google Scholar]
- Miller, M.E.; Belnap, J.; Beattty, S.W.; Reynolds, R.L. Performance of Bromus tectorum L. in relation to soil properties, water additions, and chemical amendments in calcareous soils of southwestern Utah, USA. Plant Soil 2006, 288, 1–18. [Google Scholar] [CrossRef]
- Lortie, C.J.; Cushman, J.H. Effects of a directional abiotic gradient on plant community dynamics and invasion in a coastal dune system. J. Ecol. 2007, 95, 468–481. [Google Scholar] [CrossRef]
- Pande, A.; Williams, C.L.; Lant, C.L.; Gibson, D.J. Using map algebra to determine the mesoscale distribution of invasive plants: The case of Celastrus orbicularis in Southern Illinois, USA. Biol. Invasions 2007, 9, 419–431. [Google Scholar] [CrossRef]
- Tong, C.; Zhang, L.; Wang, W.; Gauci, V.; Marrs, R.; Liu, B.; Jia, R.; Zeng, C. Contrasting nutrient stocks and litter decomposition in stands of native and invasive species in a sub-tropical estuarine marsh. Environ. Res. 2011, 111, 909–916. [Google Scholar] [CrossRef] [PubMed]
- Wang, W.; Wang, C.; Sardans, J.; Zeng, C.; Tong, C.; Peñuelas, J. Plant invasive success associated with higher N-use efficiency and stoichiometric shifts in the soil–plant system in the Minjiang River tidal estuarine wetlands of China. Wetl. Ecol. Manag. 2015, 23, 865–880. [Google Scholar] [CrossRef]
- Boxwell, J.; Drohan, P.J. Surface soil physical and hydrological characteristics in Bromus tectorum L. (cheatgrass) versus Artemisia tridentate Nutt. (big sagebrush) habitat. Geoderma 2009, 149, 305–311. [Google Scholar] [CrossRef]
- Zhou, L.Y.; Yin, S.L.; An, S.Q.; Yang, W.; Deng, Q.; Xie, D.; Ji, H.T.; Ouyang, Y.; Cheng, X.L. Spartina alterniflora invasion alters carbon exchange and soil organic carbon in eastern salt Marsh of China. Clean-Soil Air Water 2015, 43, 569–576. [Google Scholar] [CrossRef]
- Uselman, S.M.; Synder, K.A.; Leger, E.A.; Duke, S.E. First-Year establishment, biomass and seed production of early vs. late seral natives in two medusahead (Taeniatherum caput-medusae) invaded soils. Invasive Plant Sci. Manag. 2014, 7, 291–302. [Google Scholar] [CrossRef]
- Haubensak, K.A.; D’Antonio, C.M.; Embry, S.; Blank, R. A comparison of Bromus tectorum growth and mycorrhizal colonization in salt deserts vs. sagebrush habitats. Rangel. Ecol. Manag. 2014, 67, 275–284. [Google Scholar] [CrossRef]
- Blank, R.R.; Morgan, T.; Allen, F. Suppression of annual Bromus tectorum by perennial Agropyron cristatus: Roles of soil nitrogen availability and biological soil space. AoB Plants 2015, 7. [Google Scholar] [CrossRef] [PubMed]
- Craft, C.; Broome, S.; Campbell, C. Fifteen years of vegetation and soil development after brackish-water marsh creation. Restor. Ecol. 2002, 10, 248–258. [Google Scholar] [CrossRef]
- Zhang, C.B.; Wang, J.; Qian, B.Y.; Li, W.H. Effects of the invader Solidago Canadensis on soil properties. Appl. Soil Ecol. 2009, 43, 163–169. [Google Scholar] [CrossRef]
- Koutika, L.S.; Vanderhoeven, S.; Chapius-Lardy, L.; Dassonville, N.; Meerts, P. Assessment of changes in soil organic matter after invasion by exotic plant species. Biol. Fertil. Soils 2007, 44, 331–341. [Google Scholar] [CrossRef]
- Koteen, L.E.; Baldocchi, D.D.; Harte, J. Invasion of non-native grasses causes a drop in soil carbon storage in California grasslands. Environ. Res. Lett. 2011, 6, 044001. [Google Scholar] [CrossRef]
- Throop, H.L.; Laitha, K.; Kramer, M. Density fractionation and 13C reveal changes in soil carbon following woody encoarchment in a desert ecosystem. Biogeochemistry 2013, 112, 409–422. [Google Scholar] [CrossRef]
- Yu, F.K.; Huang, X.H.; Duan, C.Q.; He, S.Z.; Zhang, G.S.; Liu, C.E.; Fu, D.G.; Shao, H.B. Impacts of Ageratina adenophora invasion on soil physical-chemical properties of Eucalyptus plantation and implications for constructing agro-forest ecosystem. Ecol. Eng. 2014, 64, 130–135. [Google Scholar] [CrossRef]
- Souza-Alonso, P.; Guisande-Collazo, A.; Gonzalez, L. Gradualism in Acacia dealbata link invasion: Impacts on soil chemistry and microbial community over a chronological sequence. Soil Biol. Biochem. 2015, 80, 315–323. [Google Scholar] [CrossRef]
- Surrette, S.B.; Brewer, J.S. Inferring relationships between native plant diversity and Lonicera japonica in upland forests in north Mississippi, USA. Appl. Veg. Sci. 2008, 11, 205–214. [Google Scholar] [CrossRef]
- Lindsay, E.A.; French, K. Litterfall and nitrogen cycling following invasion by Chrysanthemoides moniifera ssp. rotundata in coastal Australia. J. Appl. Ecol. 2005, 42, 556–566. [Google Scholar] [CrossRef]
- Titus, J.H. Nitrogen-fixers Alnus and Lupinus influence soil characteristics but not colonization by later successional species in primary succession on Mount St. Helens. Plant Ecol. 2009, 203, 289–301. [Google Scholar] [CrossRef]
- Novoa, A.; Rodríguez, R.; Richardson, D.; Gonzàlez, L. Soil quality: A key factor in understanding plant invasión? The case of Capobrotus edulis (L.) N.E.Br. Biol. Invasions 2014, 16, 429–443. [Google Scholar] [CrossRef]


| Variable | Species | Soil Layer (cm) | Species × Soil Layer | |||||||
|---|---|---|---|---|---|---|---|---|---|---|
| C. malaccensis | S. alterniflora | P. australis | 0–10 | 10–20 | 20–30 | 30–40 | 40–50 | 50–60 | ||
| SOC (g kg−1) | 20.9 ± 0.5b | 23.4 ± 1.2a | 22.6 ± 0.5ab | 26.6 ± 1.8a | 22.9 ± 0.7b | 19.3 ± 0.6c | 20.3 ± 0.6c | 21.9 ± 0.5bc | 22.7 ± 0.4b | Not significant |
| p = 0.0097 | p < 0.0001 | |||||||||
| LOC (g kg−1) | 5.18 ± 0.19c | 5.87 ± 0.28b | 6.02 ± 0.31a | 7.15 ± 0.46a | 5.59 ± 0.43bc | 5.10 ± 0.15bc | 4.91 ± 0.24c | 5.61 ± 0.27b | 5.76 ± 0.23b | Not significant |
| p = 0.015 | p < 0.0001 | |||||||||
| DOC (mg kg−1) | 29.2 ± 4.7 | 46.2 ± 10.4 | 29.9 ± 2.4 | 56.2 ± 12.0 | 45.0 ± 10.7 | 31.3 ± 15.8 | 27.1 ± 3.1 | 26.5 ± 2.1 | 24.6 ± 2.9 | Not significant |
| p = 0.12 | p = 0.11 | |||||||||
| MBC (mg kg−1) | 187 ± 41 | 293 ± 53 | 272 ± 29 | 472 ± 75a | 182 ± 59b | 302 ± 59ab | 155 ± 24c | 224 ± 48bc | 168 ± 33c | Not significant |
| p = 0.077 | p = 0.00017 | |||||||||
| LFOC (g kg−1) | 1.01 ± 0.16b | 1.81 ± 0.19a | 1.73 ± 0.13a | 2.65 ± 0.25a | 1.81 ± 0.11b | 1.12 ± 0.16c | 1.05 ± 0.18c | 1.20 ± 0.19c | 1.27 ± 0.15c | Not significant |
| p < 0.0001 | p < 0.0001 | |||||||||
| LFON (g kg−1) | 0.050 ± 0.009b | 0.077 ± 0.011ab | 0.086 ± 0.009a | 0.14 ± 0.02a | 0.09 ± 0.007b | 0.053 ± 0.007c | 0.044 ± 0.008c | 0.049 ± 0.008c | 0.052 ± 0.006c | Not significant |
| p < 0.0001 | p < 0.0001 | |||||||||
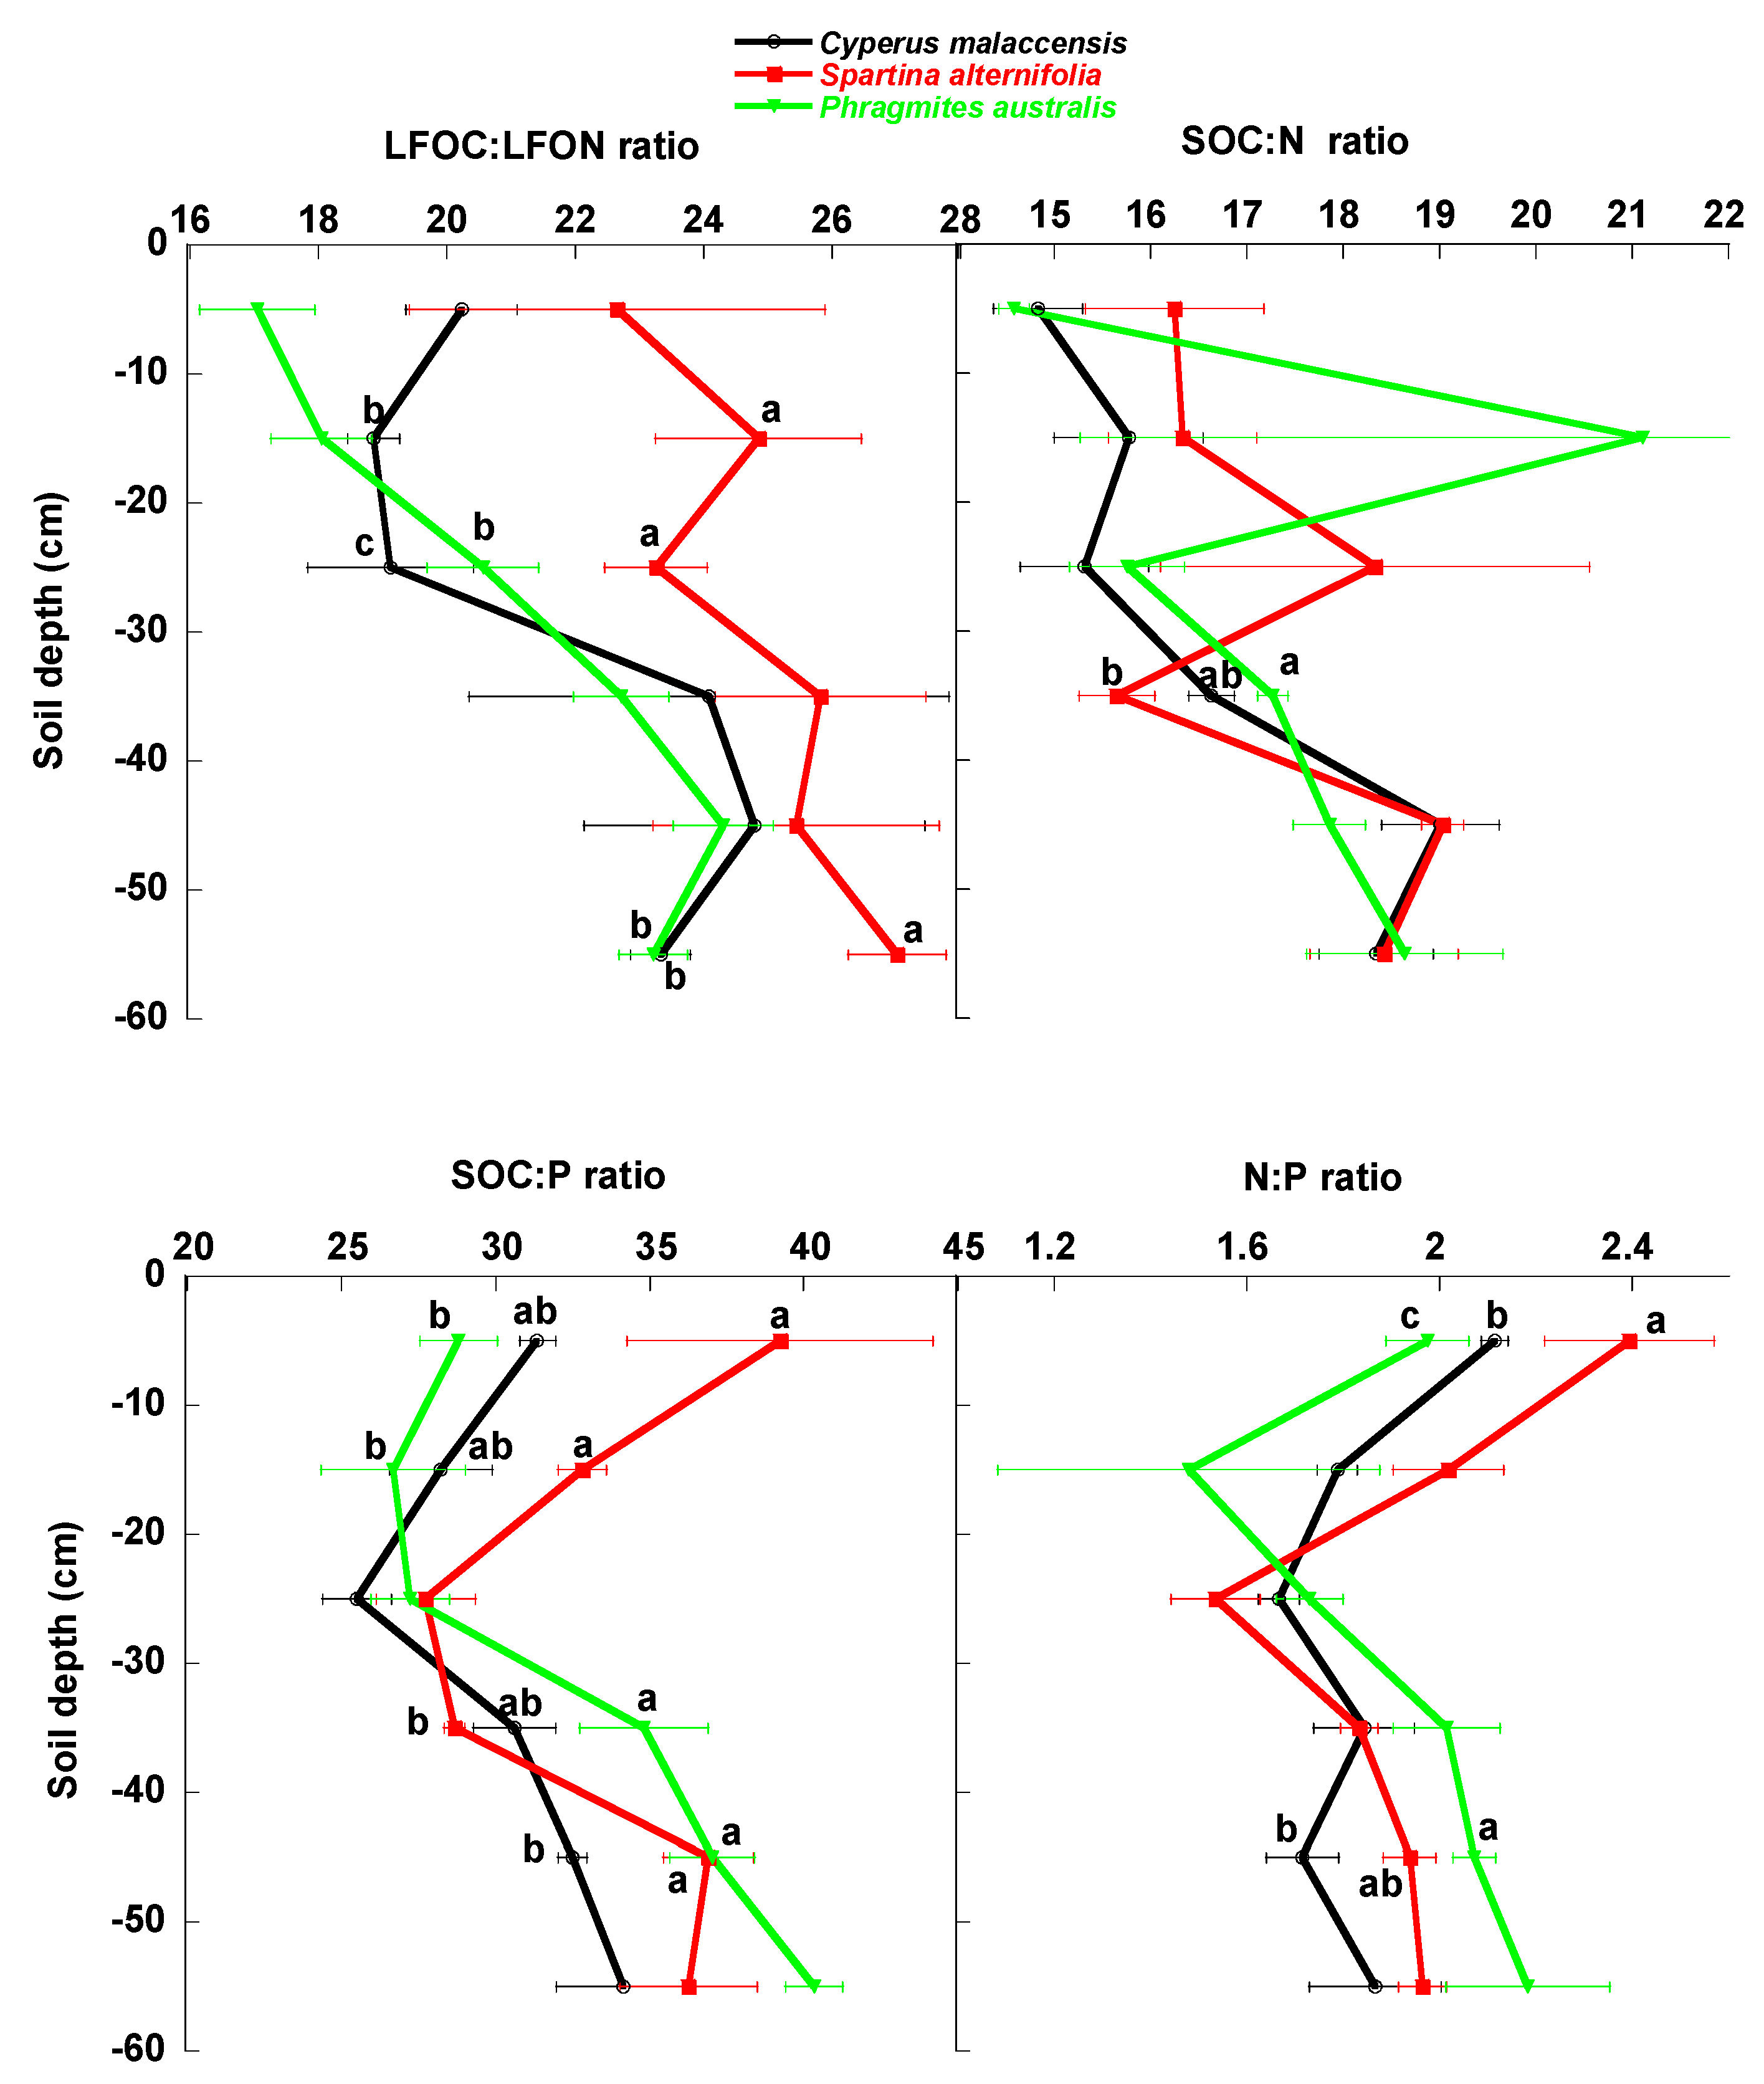
| LFOC:LFON ratio | 21.7 ± 0.9b | 24.8 ± 0.7a | 21.0 ± 0.7b | 20.0 ± 1.3 | 20.6 ± 1.2b | 21.0 ± 0.8b | 24.2 ± 1.3a | 24.8 ± 1.0a | 24.5 ± 0.7a | Not significant |
| p = 0.00027 | p = 0.00025 | |||||||||
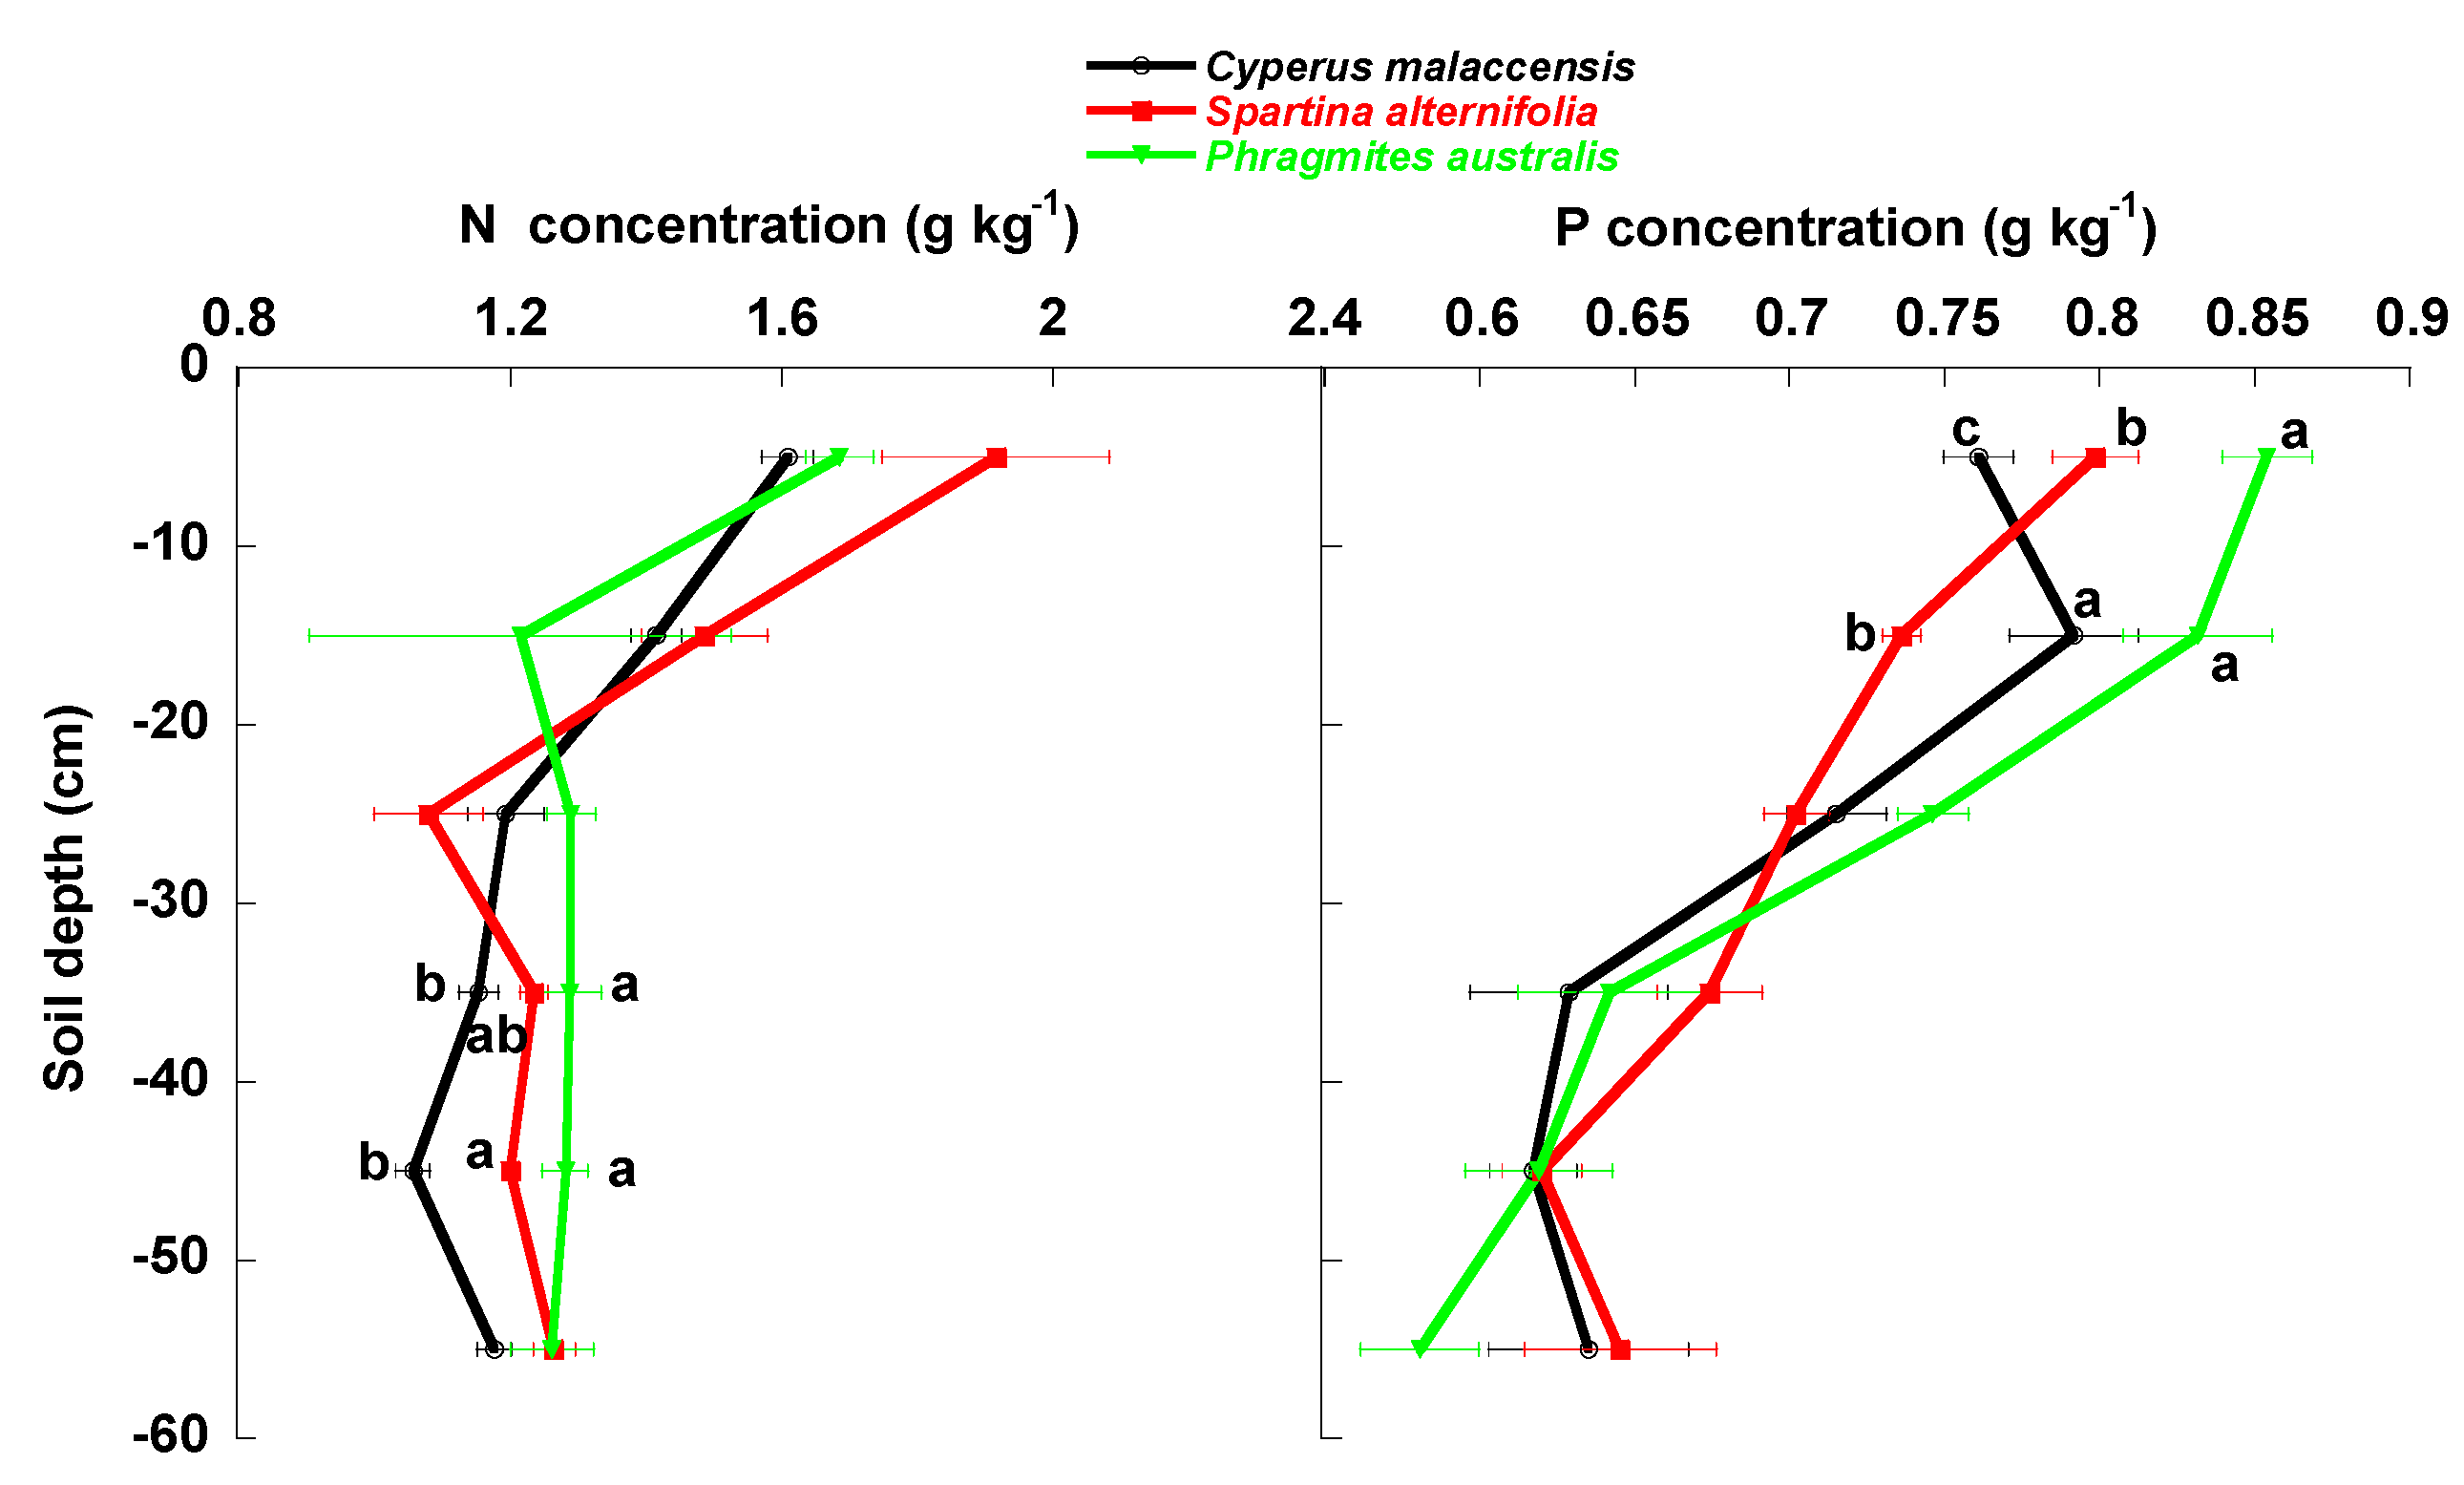
| Total N (g kg−1) | 1.27 ± 0.05 | 1.36 ± 0.07 | 1.34 ± 0.06 | 1.74 ± 0.07a | 1.37 ± 0.10b | 1.19 ± 0.04b | 1.23 ± 0.03b | 1.18 ± 0.04b | 1.23 ± 0.03b | Not significant |
| p = 0.23 | p < 0.0001 | |||||||||
| Total P (g kg−1) | 0.692 ± 0.018b | 0.696 ± 0.015b | 0.712 ± 0.027a | 0.805 ± 0.015a | 0.787 ± 0.017b | 0.721 ± 0.009c | 0.648 ± 0.015d | 0.619 ± 0.009d | 0.620 ± 0.017d | p = 0.0093 |
| p < 0.0001 | p < 0.0001 | |||||||||
| SOC:N ratio | 16.7 ± 0.4 | 17.3 ± 0.5 | 17.5 ± 1.0 | 15.2 ± 0.4b | 17.7 ± 1.9ab | 16.5 ± 0.8ab | 16.5 ± 0.3ab | 18.6 ± 0.3a | 18.5 ± 0.4ab | Not significant |
| p = 0.60 | p = 0.078 | |||||||||
| SOC:P ratio | 30.4 ± 0.8b | 33.6 ± 1.3a | 32.5 ± 1.4ab | 33.1 ± 2.2ab | 29.2 ± 1.3bc | 26.8 ± 0.8c | 31.4 ± 1.2b | 35.5 ± 1.0a | 36.9 ± 1.3a | p = 0.0074 |
| p = 0.016 | p < 0.0001 | |||||||||
| N:P ratio | 1.83 ± 0.04 | 1.95 ± 0.07 | 1.91 ± 0.09 | 2.16 ± 0.08a | 1.76 ± 0.14abc | 1.64 ± 0.05c | 1.90 ± 0.05ab | 1.91 ± 0.06ab | 2.00 ± 0.08ab | Not significant |
| p = 0.39 | p = 0.0017 | |||||||||
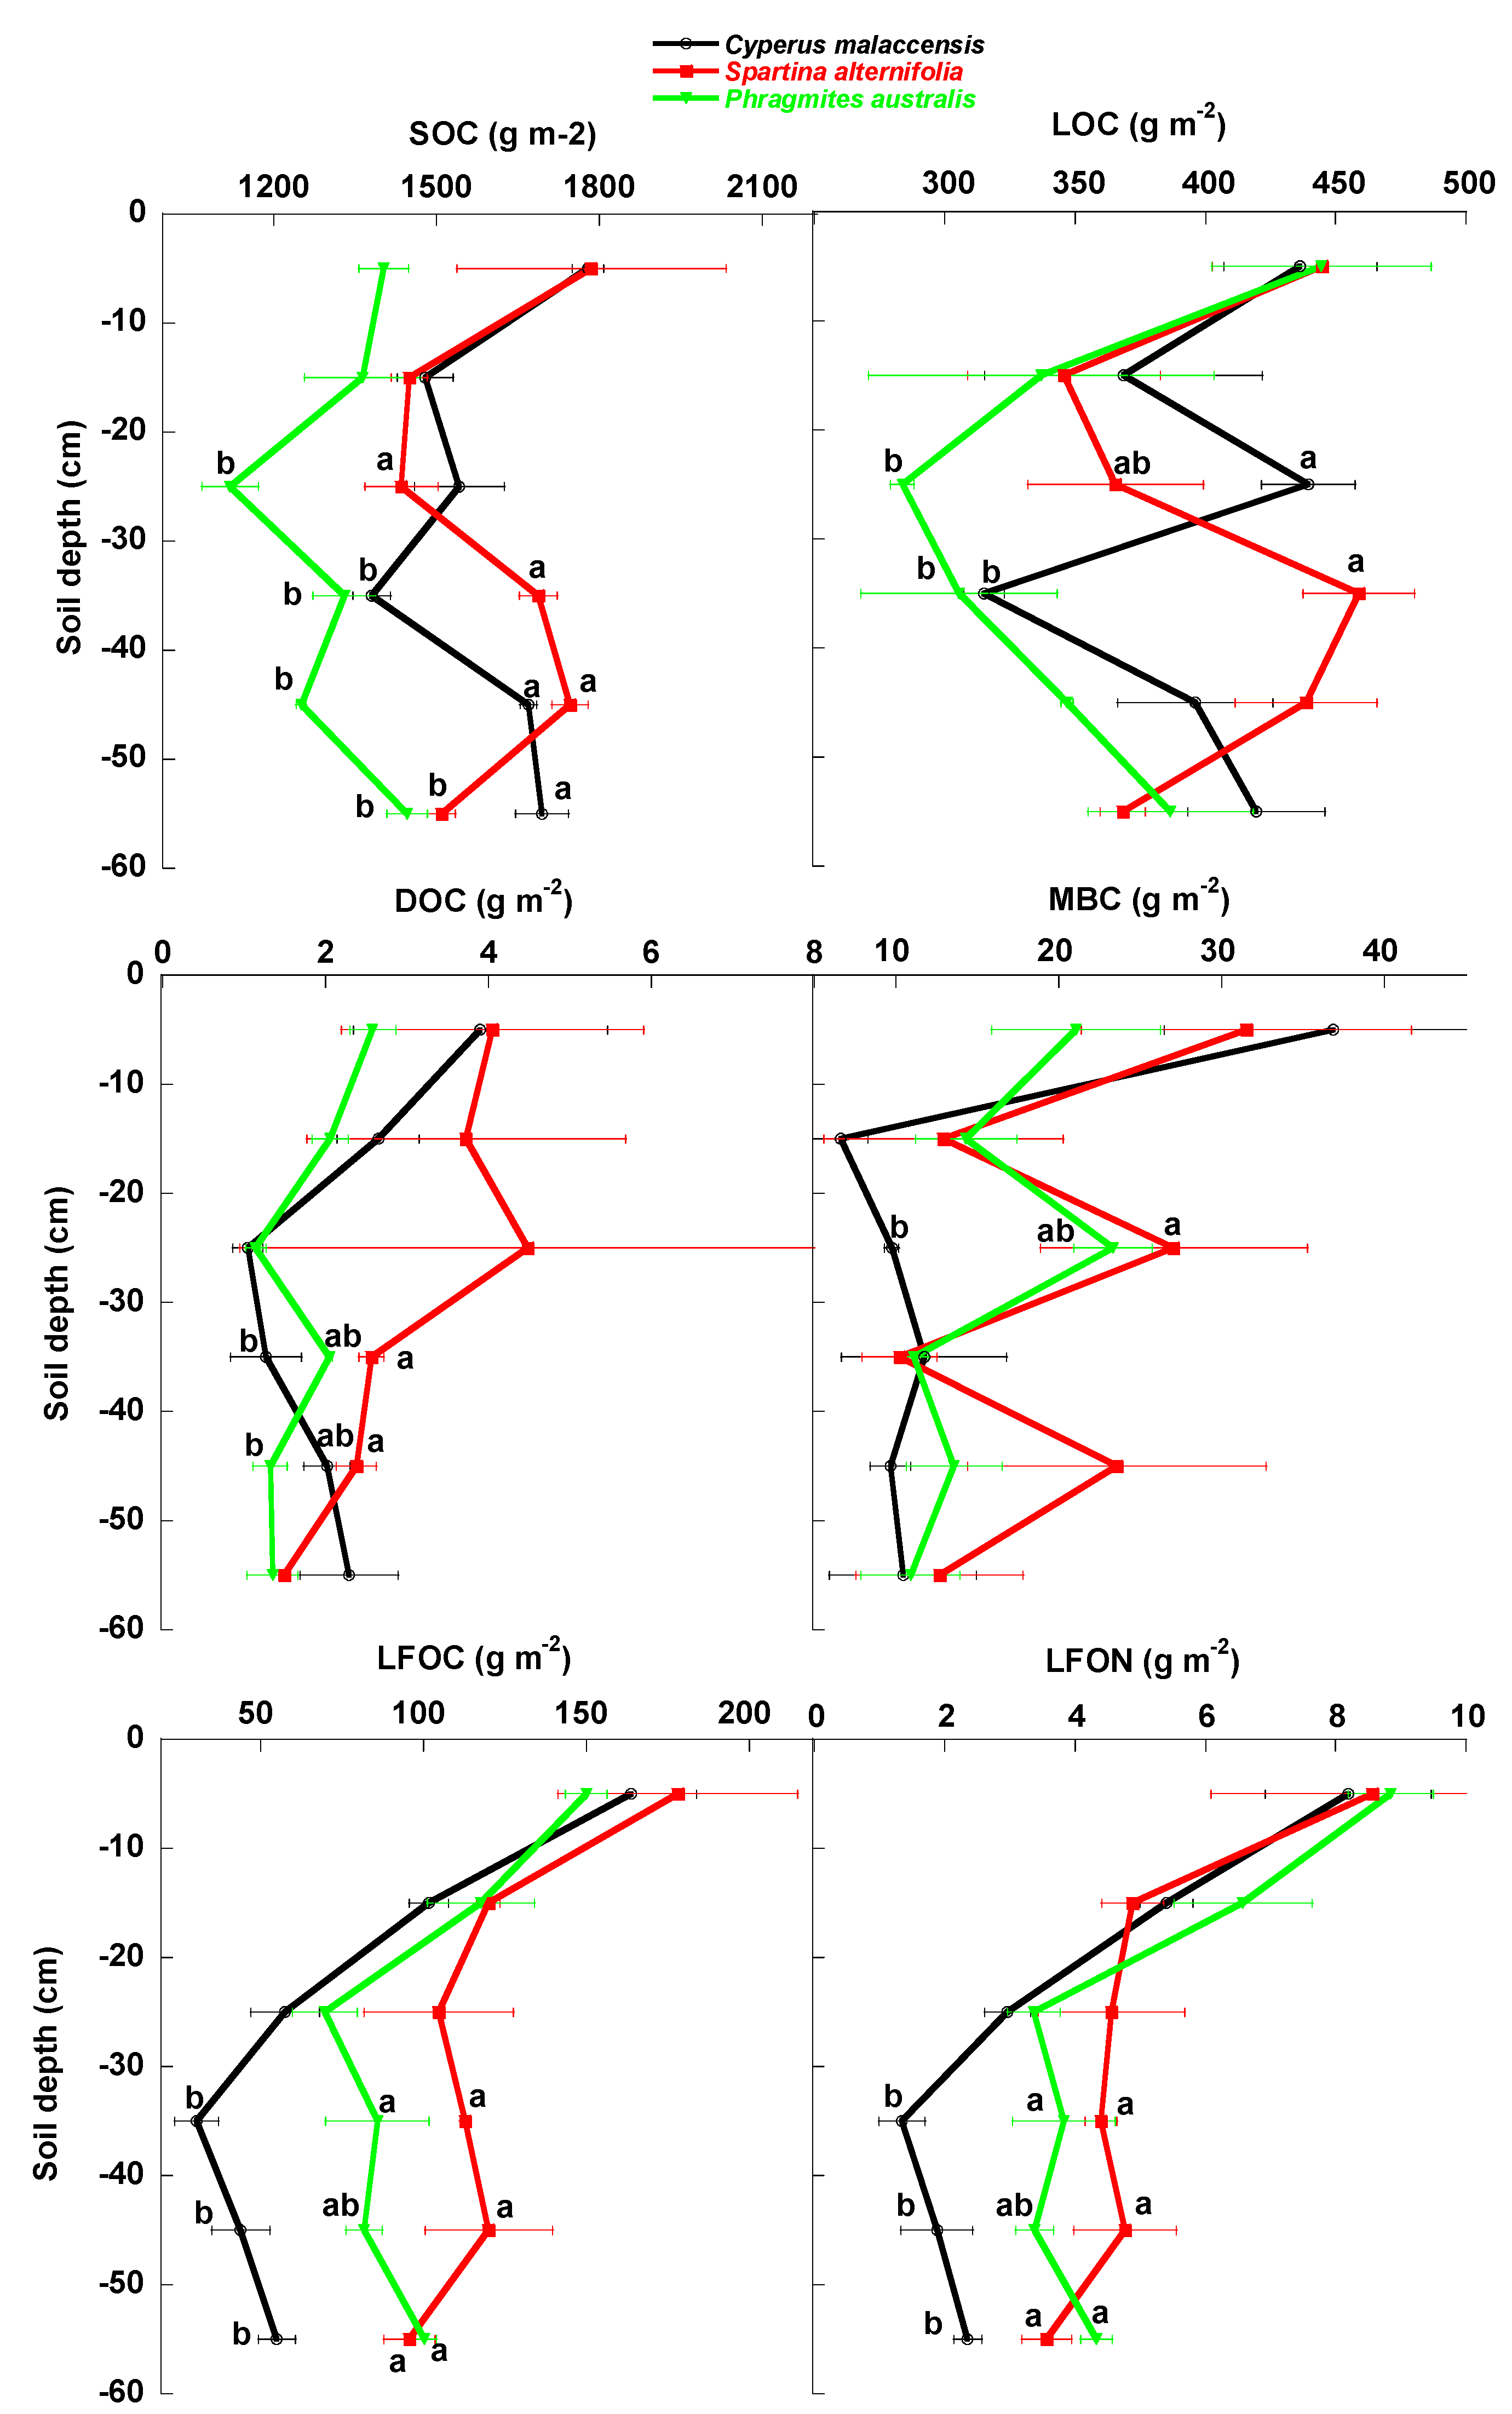
| Total SOC (g m−2) | 1591 ± 51a | 1603 ± 51a | 1319 ± 33b | 1656 ± 97a | 1432 ± 40abc | 1366 ± 72b | 1466 ± 60abc | 1556 ± 78ab | 1550 ± 42ab | p = 0.026 |
| p < 0.0001 | p = 0.00074 | |||||||||
| Total LOC (g m−2) | 396 ± 15ab | 404 ± 15a | 351 ± 18b | 442 ± 19a | 351 ± 27b | 363 ± 25b | 360 ± 28b | 394 ± 18ab | 391 ± 14ab | p = 0.049 |
| p = 0.019 | p = 0.020 | |||||||||
| Total DOC (g m−2) | 2.19 ± 0.34ab | 3.10 ± 0.67a | 1.75 ± 0.15b | 3.51 ± 0.74a | 2.81 ± 0.64ab | 2.22 ± 1.17ab | 1.96 ± 0.23b | 1.90 ± 0.20b | 1.71 ± 0.24b | Not significant |
| p = 0.32 | p = 0.093 | |||||||||
| Total MBC (g m−2) | 14.2 ± 3.0 | 19.7 ± 3.2 | 15.7 ± 1.6 | 29.8 ± 5.0a | 11.3 ± 2.6 | 20.0 ± 3.6ab | 11.0 ± 1.6c | 15.6 ± 3.5bc | 11.4 ± 2.2c | Not significant |
| p = 0.23 | p = 0.00073 | |||||||||
| Total LFOC (g m−2) | 75.4 ± 11.6b | 122 ± 9a | 101 ± 7a | 164 ± 13a | 113 ± 6b | 77.4 ± 10.5c | 76.4 ± 13.1c | 81.9 ± 12.7bc | 83.6 ± 7.8bc | Not significant |
| p < 0.0001 | p < 0.0001 | |||||||||
| Total LFON (g m−2) | 3.69 ± 0.62b | 5.12 ± 0.56a | 5.05 ± 0.54a | 8.54 ± 0.83a | 5.62 ± 0.43b | 3.63 ± 0.43bc | 3.19 ± 0.54c | 3.34 ± 0.51bc | 3.41 ± 0.32bc | Not significant |
| p = 0.0078 | p < 0.0001 | |||||||||
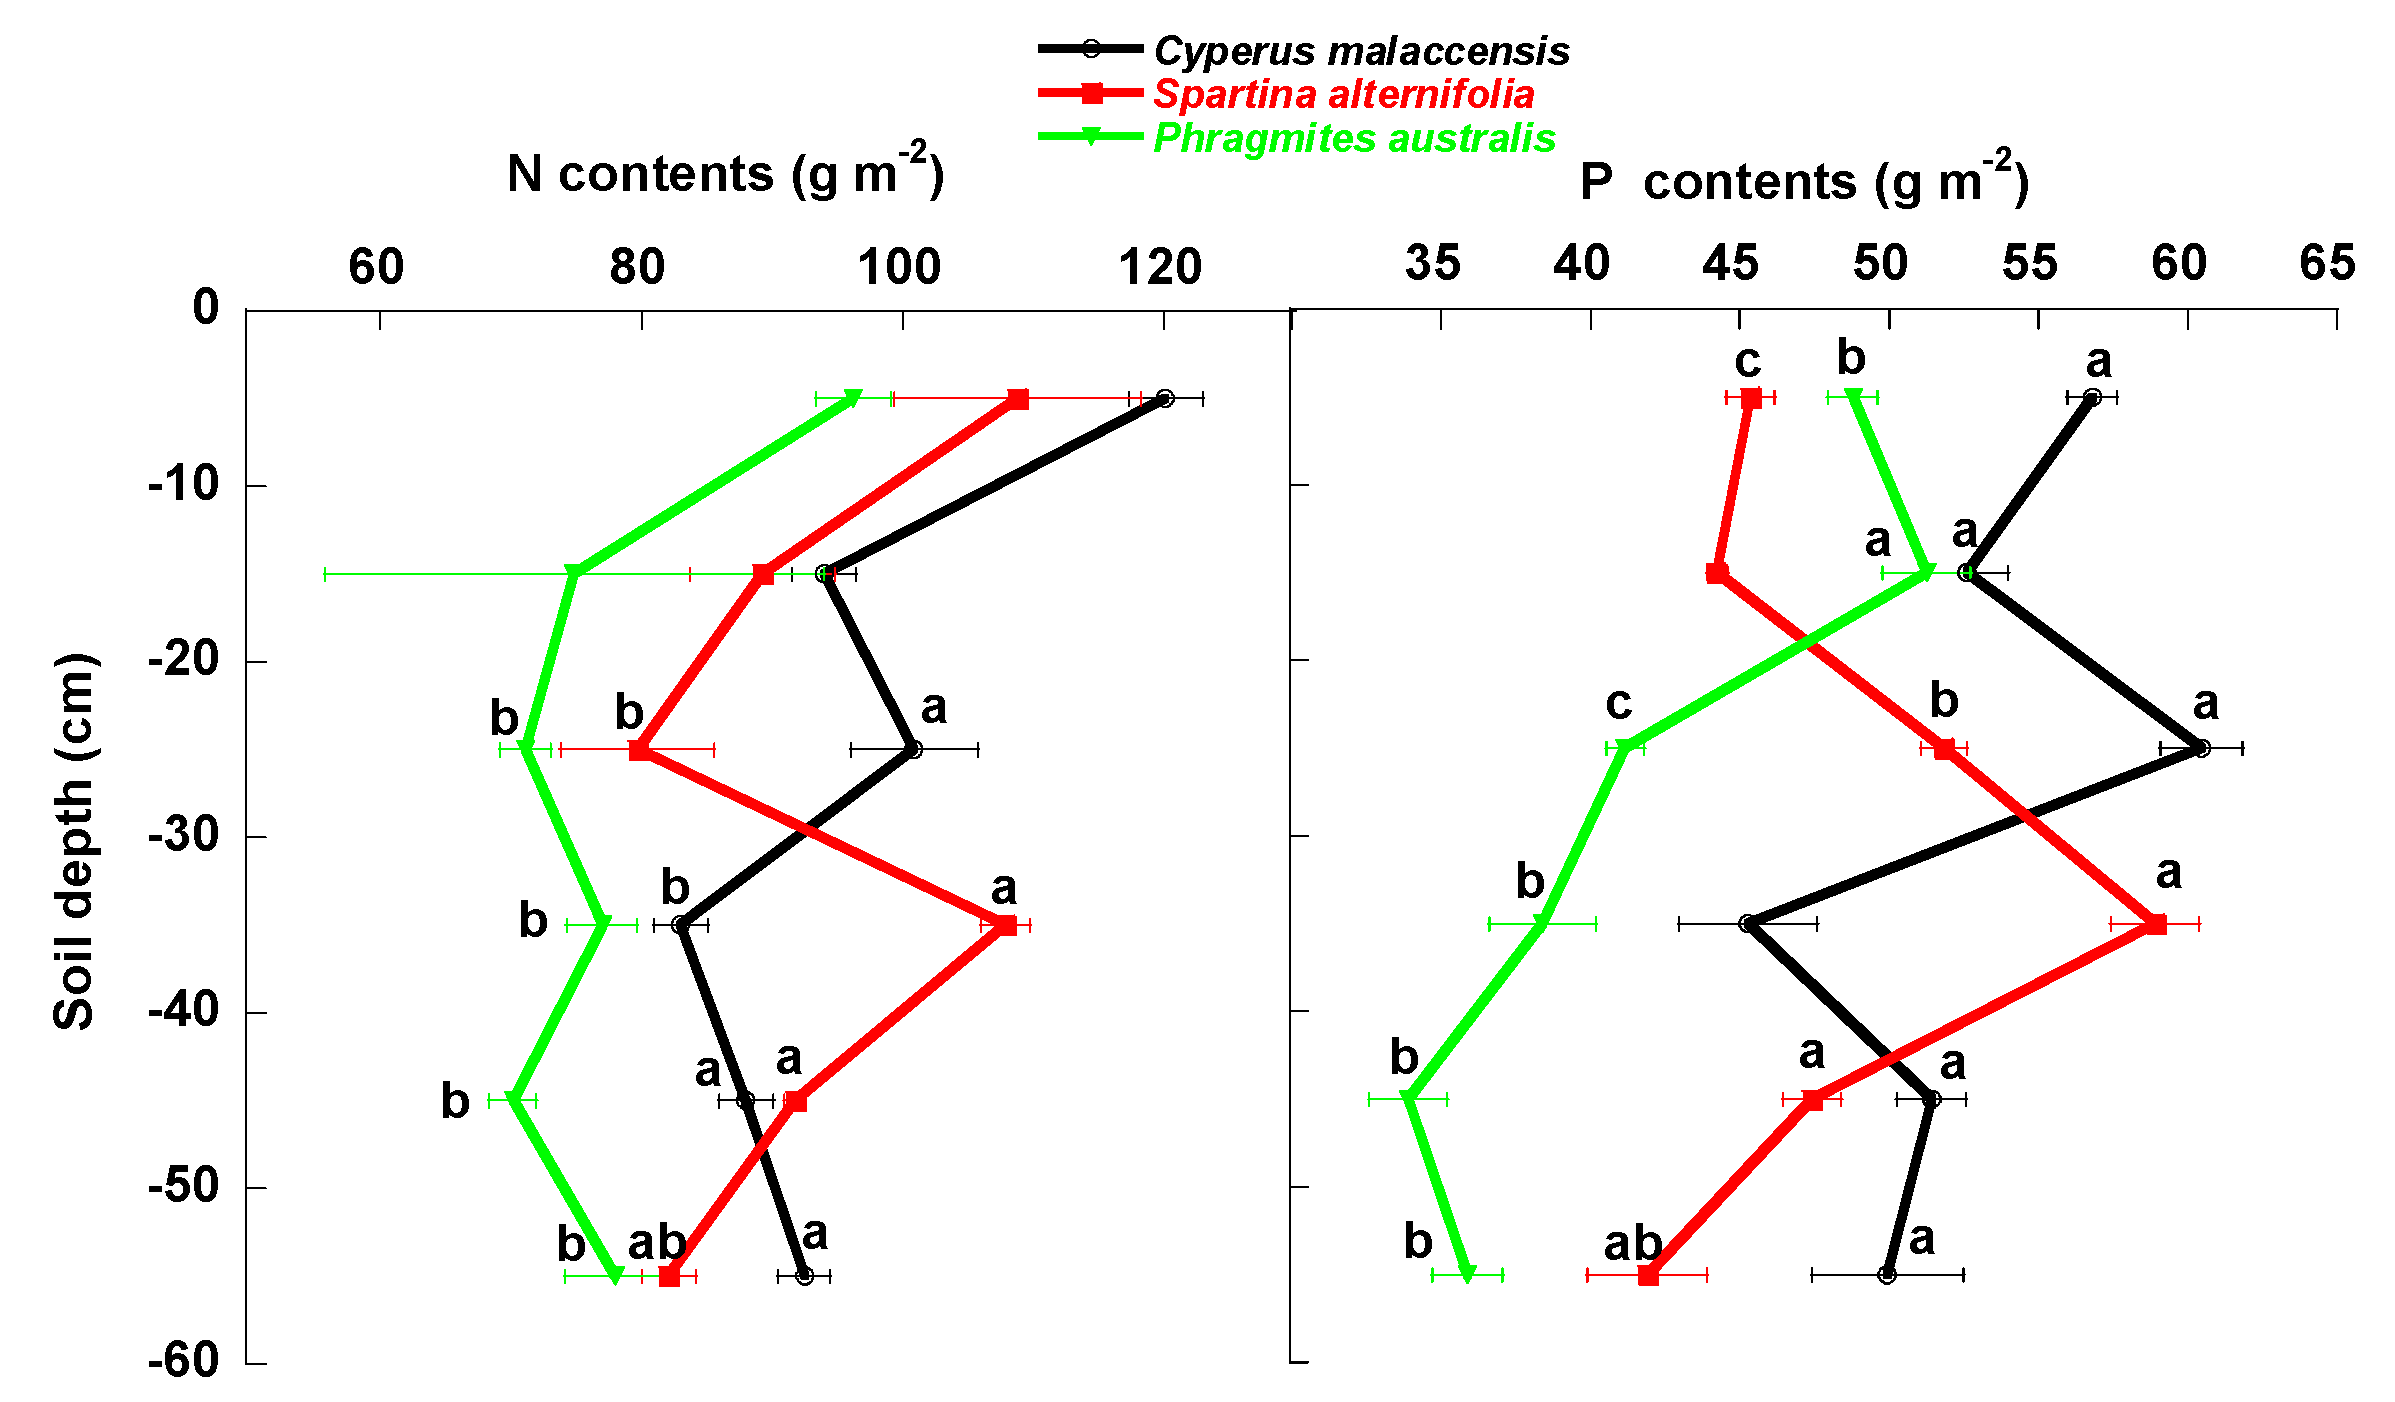
| Total N (g m−2) | 96.4 ± 3.1a | 93.3 ± 3.3a | 77.9 ± 3.5b | 108 ± 4.6a | 86.1 ± 6.5ab | 83.9 ± 5.0b | 89.3 ± 4.9ab | 83.3 ± 3.4b | 84.2 ± 2.6b | Not significant |
| p < 0.0001 | p < 0.0001 | |||||||||
| Total P (g m−2) | 52.7 ± 1.3a | 48.3 ± 1.4b | 41.6 ± 1.6c | 50.3 ± 1.7a | 49.4 ± 1.4ab | 51.1 ± 2.8a | 47.5 ± 3.2bc | 44.2 ± 2.7bc | 42.6 ± 2.3c | p < 0.0001 |
| p < 0.0001 | p < 0.0001 | |||||||||
| Variable Ratios | Species | p-Value | ||
|---|---|---|---|---|
| 0–30/30–60 cm | C. malaccensis | S. alternif lora | P. australis | |
| Total SOC | 1.01 ± 0.03 | 0.95 ± 0.07 | 0.97 ± 0.04 | p = 0.672 |
| Total LOC | 1.10 ± 0.06 | 0.91 ± 0.10 | 1.03 ± 0.11 | p = 0.396 |
| Total DOC | 1.36 ± 0.32 | 1.90 ± 1.10 | 1.28 ± 0.26 | p = 0.790 |
| Total MBC | 1.81 ± 0.39 | 1.69 ± 0.47 | 1.65 ± 0.11 | p = 0.944 |
| Total LFOC | 2.52 ± 0.35a | 1.23 ± 0.16b | 1.27 ± 0.11b | p = 0.013 |
| Total LFON | 2.99 ± 0.44a | 1.46 ± 0.34b | 1.64 ± 0.10b | p = 0.031 |
| Total N | 1.20 ± 0.04 | 0.98 ± 0.03 | 1.08 ± 0.10 | p = 0.159 |
| Total P | 1.16 ± 0.03b | 0.95 ± 0.02c | 1.31 ± 0.04a | p < 0.001 |
| Soil [N] Conc. (g kg−1) | Soil [P] Conc. (g kg−1) | N:P Ratio | Water Content (%) | pH | Salinity (ms cm−1) | Clay (%) | Silt (%) | Sand (%) | Bulk Density (g cm−3) | Soil N Content (g m−2) | Soil P Content (g m−2) | |
|---|---|---|---|---|---|---|---|---|---|---|---|---|
| SOC (g kg−1) | R = 0.78 p < 0.0001 | R = 0.30 p = 0.028 | R = 0.66 p < 0.0001 | R = 0.60 p < 0.0001 | R = −0.35 p = 0.010 | R = 0.091 p = 0.51 | R = 0.16 p = 0.24 | R = −0.39 p = 0.004 | R = 0.10 p = 0.47 | R = −0.49 p < 0.0001 | R = 0.36 p = 0.008 | R = −0.26 p = 0.059 |
| LOC (g kg−1) | R = 0.74 p < 0.0001 | R = 0.32 p = 0.020 | R = 0.60 p < 0.0001 | R = 0.47 p < 0.0001 | R = −0.22 p = 0.10 | R = 0.016 p = 0.91 | R = 0.22 p = 0.11 | R = −0.38 p = 0.005 | R = 0.0050 p = 0.97 | R = −0.41 p = 0.002 | R = 0.38 p = 0.004 | R = −0.17 p = 0.22 |
| DOC (mg kg−1) | R = 0.24 p = 0.077 | R = 0.23 p = 0.10 | R = 0.092 p = 0.51 | R = 0.20 p = 0.15 | R = −0.26 p = 0.058 | R = −0.12 p = 0.40 | R = 0.075 p = 0.59 | R = −0.22 p = 0.11 | R = 0.084 p = 0.55 | R = −0.15 p = 0.27 | R = 0.10 p = 0.47 | R = 0.012 p = 0.93 |
| MBC (mg kg−1) | R = 0.35 p = 0.009 | R = 0.30 p = 0.029 | R = 0.17 p = 0.23 | R = 0.30 p = 0.026 | R = −0.15 p = 0.28 | R = −0.25 p = 0.072 | R = 0.15 p = 0.28 | R = −0.22 p = 0.10 | R = −0.024 p = 0.86 | R = −0.32 p = 0.018 | R = 0.096 p = 0.49 | R = −0.095 p = 0.50 |
| LFOC (g kg−1) | R = 0.77 p < 0.0001 | R = 0.55 p < 0.0001 | R = 0.48 p < 0.0001 | R = 0.63 p < 0.0001 | R = −0.45 p = 0.001 | R = −0.027 p = 0.85 | R = 0.28 p = 0.043 | R = −0.44 p = 0.001 | R = −0.019 p = 0.89 | R = −0.53 p < 0.0001 | R = 0.33 p = 0.015 | R = −0.11 p = 0.44 |
| LFON (g kg−1) | R = 0.75 p < 0.0001 | R = 0.65 p < 0.0001 | R = 0.39 p = 0.004 | R = 0.63 p < 0.0001 | R = −0.30 p = 0.027 | R = 0.027 p = 0.85 | R = 0.34 p = 0.011 | R = −0.48 p < 0.0001 | R = −0.079 p = 0.57 | R = −0.50 p < 0.0001 | R = 0.34 p = 0.013 | R = −0.0095 p = 0.95 |
| LFOC:LFON ratio | R = −0.28 p = 0.037 | R = −0.60 p < 0.0001 | R = 0.11 p = 0.41 | R = −0.22 p = 0.12 | R = −0.17 p = 0.22 | R = −0.21 p = 0.13 | R = −0.33 p = 0.016 | R = 0.24 p = 0.075 | R = 0.27 p = 0.052 | R = 0.18 p = 0.18 | R = −0.14 p = 0.31 | R = −0.27 p = 0.051 |
| Total SOC (g m−2) | R = 0.32 p = 0.020 | R = −0.032 p = 0.82 | R = 0.34 p = 0.012 | R = 0.28 p = 0.044 | R = −0.11 p = 0.42 | R = −0.27 p = 0.045 | R = −0.098 p = 0.48 | R = −0.20 p = 0.15 | R = 0.32 p = 0.019 | R = 0.52 p < 0.0001 | R = 0.74 p < 0.0001 | R = 0.46 p < 0.0001 |
| Total LOC (g m−2) | R = 0.40 p = 0.003 | R = 0.068 p = 0.63 | R = 0.36 p = 0.008 | R = 0.20 p = 0.14 | R = −0.064 p = 0.65 | R = −0.27 p = 0.045 | R = −0.0074 p = 0.96 | R = −0.21 p = 0.13 | R = 0.20 p = 0.16 | R = 0.38 p = 0.004 | R = 0.70 p < 0.0001 | R = 0.40 p = 0.003 |
| Total DOC (g m−2) | R = 0.14 p = 0.32 | R = 0.15 p = 0.27 | R = 0.021 p = 0.88 | R = 0.13 p = 0.36 | R = −0.22 p = 0.12 | R = −0.16 p = 0.25 | R = 0.057 p = 0.69 | R = −0.18 p = 0.19 | R = 0.076 p = 0.59 | R = 0.014 p = 0.92 | R = 0.14 p = 0.33 | R = 0.13 p = 0.40 |
| Total MBC (g m−2) | R = 0.27 p = 0.050 | R = 0.23 p = 0.10 | R = 0.12 p = 0.39 | R = 0.22 p = 0.11 | R = −0.10 p = 0.45 | R = −0.33 p = 0.015 | R = 0.12 p = 0.39 | R = −0.20 p = 0.14 | R = 0.0013 p = 0.99 | R = −0.13 p = 0.34 | R = 0.18 p = 0.20 | R = 0.037 p = 0.79 |
| Total LFOC (g m−2) | R = 0.70 p < 0.0001 | R = 0.50 p < 0.0001 | R = 0.42 p = 0.001 | R = 0.59 p < 0.0001 | R = −0.46 p < 0.0001 | R = −0.15 p = 0.28 | R = 0.25 p = 0.066 | R = −0.43 p = 0.001 | R = 0.0041 p = 0.98 | R = −0.29 p = 0.035 | R = 0.47 p < 0.0001 | R = 0.09 p = 0.52 |
| Total LFON (g m−2) | R = 0.71 p < 0.0001 | R = 0.64 p < 0.0001 | R = 0.34 p = 0.011 | R = 0.60 p < 0.0001 | R = −0.30 p = 0.025 | R = −0.063 p = 0.65 | R = 0.33 p = 0.013 | R = −0.48 p < 0.0001 | R = −0.071 p = 0.61 | R = −0.32 p = 0.018 | R = 0.45 p = 0.001 | R = 0.15 p = 0.26 |
| Species | Spartina alterniflora | Phragmites australis |
|---|---|---|
| Cyperus malaccensis | M = 40.2 F = 9.66 p < 0.0001 | M = 23.2 F = 5.59 p < 0.0001 |
| Spartina alterniflora | M = 52.9 F = 12.7 p < 0.0001 |
| Wilks’ λ | p | |
|---|---|---|
| LFOC:LFON ratio | 0.993 | 0.90 |
| SOC:N ratio | 0.949 | 0.46 |
| SOC:P ratio | 0.823 | 0.054 |
| N:P ratio | 0.901 | 0.21 |
| Water content (%) | 0.996 | 0.95 |
| pH | 0.920 | 0.29 |
| Salinity (ms cm−1) | 0.585 | 0.0003 |
| Clay (%) | 0.536 | 0.00009 |
| Bulk density (g cm−3) | 0.809 | 0.042 |
| Total SOC (g m−2) | 0.762 | 0.017 |
| Total LOC (g m−2) | 0.906 | 0.23 |
| Total DOC (mg m−2) | 0.984 | 0.78 |
| Total MBC (g m−2) | 0.954 | 0.49 |
| Total LFOC (g m−2) | 0.853 | 0.093 |
| Total LFON (g m−2) | 0.966 | 0.59 |
| Total N (g m−2) | 0.877 | 0.14 |
| Total P (g m−2) | 0.952 | 0.48 |
| Soil layers | 0.526 | 0.025 |
© 2018 by the authors. Licensee MDPI, Basel, Switzerland. This article is an open access article distributed under the terms and conditions of the Creative Commons Attribution (CC BY) license (http://creativecommons.org/licenses/by/4.0/).
Share and Cite
Wang, W.; Sardans, J.; Wang, C.; Asensio, D.; Bartrons, M.; Peñuelas, J. Species-Specific Impacts of Invasive Plant Success on Vertical Profiles of Soil Carbon Accumulation and Nutrient Retention in the Minjiang River Tidal Estuarine Wetlands of China. Soil Syst. 2018, 2, 5. https://doi.org/10.3390/soils2010005
Wang W, Sardans J, Wang C, Asensio D, Bartrons M, Peñuelas J. Species-Specific Impacts of Invasive Plant Success on Vertical Profiles of Soil Carbon Accumulation and Nutrient Retention in the Minjiang River Tidal Estuarine Wetlands of China. Soil Systems. 2018; 2(1):5. https://doi.org/10.3390/soils2010005
Chicago/Turabian StyleWang, Weiqi, Jordi Sardans, Chun Wang, Dolores Asensio, Mireia Bartrons, and Josep Peñuelas. 2018. "Species-Specific Impacts of Invasive Plant Success on Vertical Profiles of Soil Carbon Accumulation and Nutrient Retention in the Minjiang River Tidal Estuarine Wetlands of China" Soil Systems 2, no. 1: 5. https://doi.org/10.3390/soils2010005