Article

Altered Bacterial Communities in Long-Term No-Till Soils Associated with Stratification of Soluble Aluminum and Soil pH

1
Department of Crop and Soil Sciences, Washington State University, Pullman, WA 99164, USA
2
USDA Farm Service Agency, Prosser, WA 99350, USA
3
Center for Interdisciplinary Statistical Education and Research, Washington State University, Pullman, WA 99164, USA
4
Northwest Sustainable Agroecosystem Research Unit, USDA Agricultural Research Service, Pullman, WA 99164, USA
*
Author to whom correspondence should be addressed.
Soil Syst. 2018, 2(1), 7; https://doi.org/10.3390/soils2010007
Submission received: 13 December 2017 / Revised: 25 January 2018 / Accepted: 31 January 2018 / Published: 5 February 2018
(This article belongs to the Special Issue Soil Processes Controlling Contaminant Dynamics)

Abstract

:
Soil acidification is a global issue that often results in increased aluminum (Al) toxicity. While no-till (NT) management has many benefits regarding sustainability, a discrete zone of acidification often occurs when ammoniacal fertilizers are banded below the seed. The full agroecological consequences of NT stratification and impacts on bacterial communities are largely unknown. Using next-generation sequencing (NGS) and Phylogenetic Investigation of Communities by Reconstruction of Unobserved States (PICRUSt), we characterized the influence of liming amendment and soil stratification on bacterial community composition and predicted function in 2-cm depth increments. Soil depth, pH, DTPA extractable aluminum (DTPA-Al), and KCl extractable Al (KCl-Al) were all significantly correlated with bacterial community structure and function. In soils with the lowest pH and greatest extractable Al, bacterial community was distinct, with highest relative abundance of the Koribacteraceae family, an indicator of soil degradation. Additionally, aspects of bacterial metabolism and nutrient turnover were impacted in the lowest pH zones, including secondary metabolite, carbohydrate, and energy metabolism. These results suggest that soil stratification (Al and pH) in NT systems has direct impacts on microbial community structure and function, potentially influencing ecosystem services at a highly resolved spatial scale within surface depths relevant to seed germination and emergence.

1. Introduction

Acidification affects nearly 80% of the world’s potentially cultivable soils, where it influences crop productivity by directly impacting plant health and altering soil biogeochemistry, often reducing soil fertility and increasing soluble aluminum (Al) [1,2]. No-tillage agriculture (NT) is frequently implemented to enhance soil fertility and reduce the negative impacts of “conventional” tillage. Though NT has many agricultural benefits, stratification of nutrients and pH have been observed where deep-band placement of ammoniacal fertilizer below the seed leads to a zone of soil acidification at 5–10 cm depths. While soil stratification is not thought to have significant impacts on crop productivity [3], soil stratification of microbial communities has been associated with NT management [4] and the phenomenon remains poorly understood.
Aluminum toxicity is common in acidic soils due to the pH-dependent solubility of Al-bearing soil minerals. However, other edaphic soil properties ultimately determine Al bioavailability, therefore soil pH alone has proven to be an unreliable indicator of Al phytotoxicity [5]. In temperate climates, increased Al bioavailability in agricultural soils often correlates strongly with anthropogenic soil acidification [6]. Aluminum toxicity has significant negative impacts on many important crop plants, including inhibition of root growth and decreased nodule number along with decreased root and shoot biomass in soybeans [7]. Reduction in wheat root growth and biomass has also been documented in response to Al toxicity [8]. Additionally, Al can alter soil microbial community composition [9], while also inhibiting soil microbial enzyme activity, with 400 mg kg-1 KCl extractable Al (KCl-Al) in andisols reducing β-d-glucosidase and polyphenol oxidase activity 30- and 20-fold, respectively [10].
Amendment with agricultural lime (CaCO3) is a common approach to mitigate the harmful effects of low soil pH on crops and it can also attenuate Al bioavailability and ionic activity in soil. It is thought that long-term continuous no-till management can lead to the formation of macropores which, along with the process of bioturbation, carry amendments deeper within the soil profile [3]. In NT systems, liquid lime amendments may promote the movement of surface-applied lime to address near-surface stratified soil acidity. It is unclear how such amendments may influence soil microbial communities and resultant Al biogeochemistry. Microbial community composition and function may be influenced by various soil chemical factors that are concomitantly stratified by the injection of N fertilizers and general NT management, such as Al [11], base ion concentrations [12], pH, organic carbon/matter, and soil N levels [13,14].
We examined the influence of soil stratification on soil bacterial communities at two sites within the Palouse region of Eastern Washington in the inland Pacific Northwest (iPNW), both under long-term NT cultivation management. Previous terminal restriction fragment length polymorphism (T-RFLP) analyses of microbial community composition showed pH and Al correlated with shifts in soil microbial community composition at these sites [9]. Therefore, the objective of the current study was to fully characterize the magnitude of impact that pH and chemical stratification has on bacterial community taxonomic composition and predicted functional capacity, with and without surface application of locally-sourced liming materials.

2. Materials and Methods

2.1. Site Description and Soil Sampling

The site description, experimental design, and sampling are described in the Materials and Methods section of Barth et al. [9]. Briefly, soil samples were gathered from two sites within the dryland cropping region of the iPNW. One site is located in Pullman, WA, USA (46°45′ N, 117°11′ W, 800 m a.s.l.) at the Palouse Conservation Field Station (PC), while the second site is a farm in Rockford (RF), WA, USA (46°45′ N, 117°11′ W, 800 m a.s.l.). Soils at RF and PC are Thatuna silt loams (fine-silty, mixed, superactive, mesic, Oxyaquic Argixeroll) with similar climate and topography under typical wheat-based cropping systems.
PC was converted from reduced tillage to continuous NT in 1996 and planted with a drill and inverted T-openers (Baker No-Tillage Limited, Feilding, New Zealand) until 2010, after which it was planted with 4.57 m wide Horsch drill (HORSCH Maschinen GmbH, Schwandorf, Germany). A three-year crop rotation is implemented at PC (spring wheat, winter wheat, and chickpea). RF has been in continuous NT since 2003 [9] and has been planted with a drill and T-openers. This site has been subject to various winter wheat-pulse rotations (all NT). At both sites, ammonia-based nitrogen fertilizers were injected approximately 2–3 cm below seeding depth at the time of seeding and pH-correcting amendments had never been utilized prior to the current study.
Treatments consisted of two types of surface-applied liming materials to mitigate adverse effects of low pH. Lime amendments were either a “liquid-lime emulsion” with an average particle size of 1–2 µm (NLL, NuCal liquid lime, Columbia River Carbonates, Woodland, WA, USA), or sugar beet lime (SBL, Moses Lake, WA, USA), a dry byproduct of producing table sugar from sugar beets (Beta vulgaris subsp. vulgaris). Application rate equated to 2240 kg ha−1 calcium carbonate equivalent (CCE) in November 2013 [9], with NLL being applied via a tractor-mounted pesticide-sprayer and SBL being crushed and sieved to 2 mm before being broadcast by hand. Experimental conditions were replicated at each site (RF and PC) in a randomized complete block (3 replicate plots per treatment). Sampling plots were 5.5 m × 12.2 m at PC and 4.9 m × 9.1 m at RF.
In late April 2015, 18 months after application and during a fallow period, soil samples were collected from unamended (control) and amended (limed) soils from 3 plots per treatment at each site. Prior to extraction of a soil core, organic debris was removed from the soil surface and any compaction as a result of core insertion was uniform across each site. Ten cores were taken from random locations within each plot to a depth of 10 cm using a 3.8 cm diameter soil probe, and each individual core was aseptically cut into 2-cm increments before compositing by depth and homogenizing. Samples were stored on ice, in the dark, for immediate transport to the Washington State University Department of Crop and Soil Sciences, where they were subdivided, and subsamples used for chemical analyses were stored at 4 °C, while subsamples for DNA extraction were stored at −80 °C.

2.2. Sample Preparation and Chemical Analyses

Sample preparation and soil chemical analyses are described in Barth et al. [9]. Briefly, soil samples were air dried and sieved (2 mm) and sent to Best-Test Analytical Services (Moses Lake, WA, USA) for chemical soil analysis. Analyses relevant to the current study include, DTPA extractable aluminum (DTPA-Al), KCl extractable aluminum (KCl-Al), lime requirement (Lime Req, in pounds per acre to apply in order to reach a soil pH of 6.5), Base Saturation (percent) and Total Bases (the sum of Na, K, Ca, and Mg content in meq/100 g soil).

2.3. Soil Genomic DNA Extraction

Soil microbial genomic DNA extractions were performed on the 0–2, 4–6, and 8–10 cm depth increments, using 0.25 g of each sample in the MoBio PowerSoil™ DNA extraction kit (MoBio Laboratories, Inc., Carlsbad, CA, USA). DNA quality and quantity was assessed with the NanoDrop 2000 UV-Vis spectrophotometer (Thermo Scientific, Wilmington, DE, USA). Genomic DNA extracts were diluted with nuclease-free water to approximately 2 ng μL−1 prior to sequencing.

2.4. Bacterial Community Sequencing and Analyses

Using the genomic DNA extracts described above, the 16S rRNA gene was sequenced (V3–V4 region, paired end, 2 × 150 bp) by Molecular Research (MRDNA, Shallowater, TX, USA) via Illumina sequencing technology (MiSeq) with an average of 20 k reads per sample. The primer set used for amplicon generation (forward primer: CCTACGGGNGGCWGCAG, reverse primer: GACTACHVGGGTATCTAATCC) was previously identified to provide adequate coverage of the bacterial 16S rDNA sequence [15]. The MICCA (MICrobial Community Analysis, version 1.6) [16] software pipeline was used for processing raw sequences which were filtered by removing reads with an expected error rate of >0.5 or with a length less than 350 bp, while reads longer than 350 bp were truncated. Sequences were rarefied to an even sequencing depth. As required by Phylogenetic Investigation of Communities by Reconstruction of Unobserved States (PICRUSt, version 1.1.0) [17], sequences were assigned to operational taxonomic units (OTUs) using a closed-reference approach with the Greengenes reference database (version 13.8; ftp://greengenes.microbio.me/greengenes_release/) clustered at 97% identity and a sequence identity threshold of 0.97. Chimeric sequences were removed and sequences were classified using the consensus classifier with the Greengenes taxonomic reference (97%). Sequences were then aligned using Nearest Alignment Space Termination (NAST) and the Greengenes representative alignments (clustered at 97%). The biom file [18] was then generated for downstream analysis. Data were analyzed and visualized in R statistical analysis software primarily using the Phyloseq, vegan, and ggplot2 packages [19,20,21]. Hypothesis testing was performed using PERMANOVA (adonis function) to assess the impact of site, lime amendment, and sample depth on microbial community distances (Bray-Curtis). Data were visualized using non-metric multidimensional scaling (NMDS) analyses of Bray-Curtis distances, and environmental vectors were fit using the envfit function in vegan. Vectors with p ≤ 0.05 and r2 > 0.8 are reported. Alpha diversity and beta diversity were assessed via the plot_richness function (phyloseq), and the betadiver and betadisper functions (vegan), respectively.
Bacterial family abundances were relativized and examined at each depth, at each site, by treatment. Families with a relative abundance > 0.02 are shown in Figure 1 and Figure 2. Pearson’s correlation coefficients were calculated for the bacterial family by environmental factor correlations using the cor.test function, factors with an influence on community structure determined via envfit were used in the analysis. Pearson’s correlation coefficients were tested for significance (alpha = 0.05) and filtered to include only families with variance explained (VE) > 0.6. Additionally, correlation among environmental factors was examined using the corr.test function.
The PICRUSt package was used to predict metagenomes and functional profiles [17]. PICRUSt results, KEGG orthology (KO) terms at “Level 3”, were regressed against environmental factors with an influence on community structure yielding Pearson’s correlation coefficients. Reported functional profile-environmental data correlations are limited to those with VE > 0.6 and p-value ≤ 0.05, KO terms were also filtered for environmental relevance.

3. Results

3.1. Chemistry of Soil Stratification

Soil chemical variables were significantly correlated with sampling depth, while also correlated to each other when tested via corr.test (Table 1). Soil pH correlated negatively with depth, Al, and lime requirement, but positively with Total Bases. Al positively correlated with sampling depth and Lime Req, but negatively correlated with Total Bases (Table 1).
As previously reported [9], soil pH was greatest at each site and for all treatments, in the surface 0–2 cm, with the lowest pH values observed at the 8–10 cm depth (Table 2). Both liming treatments significantly raised the soil pH in the surface 0–2 cm soils at both sites, and consequently decreased KCl-Al in the surface soils by an order of magnitude or more, compared with the deepest soils (8–10 cm). DTPA extractable Al was typically lower than KCl-Al, particularly with increasing soil depth (Table 2).

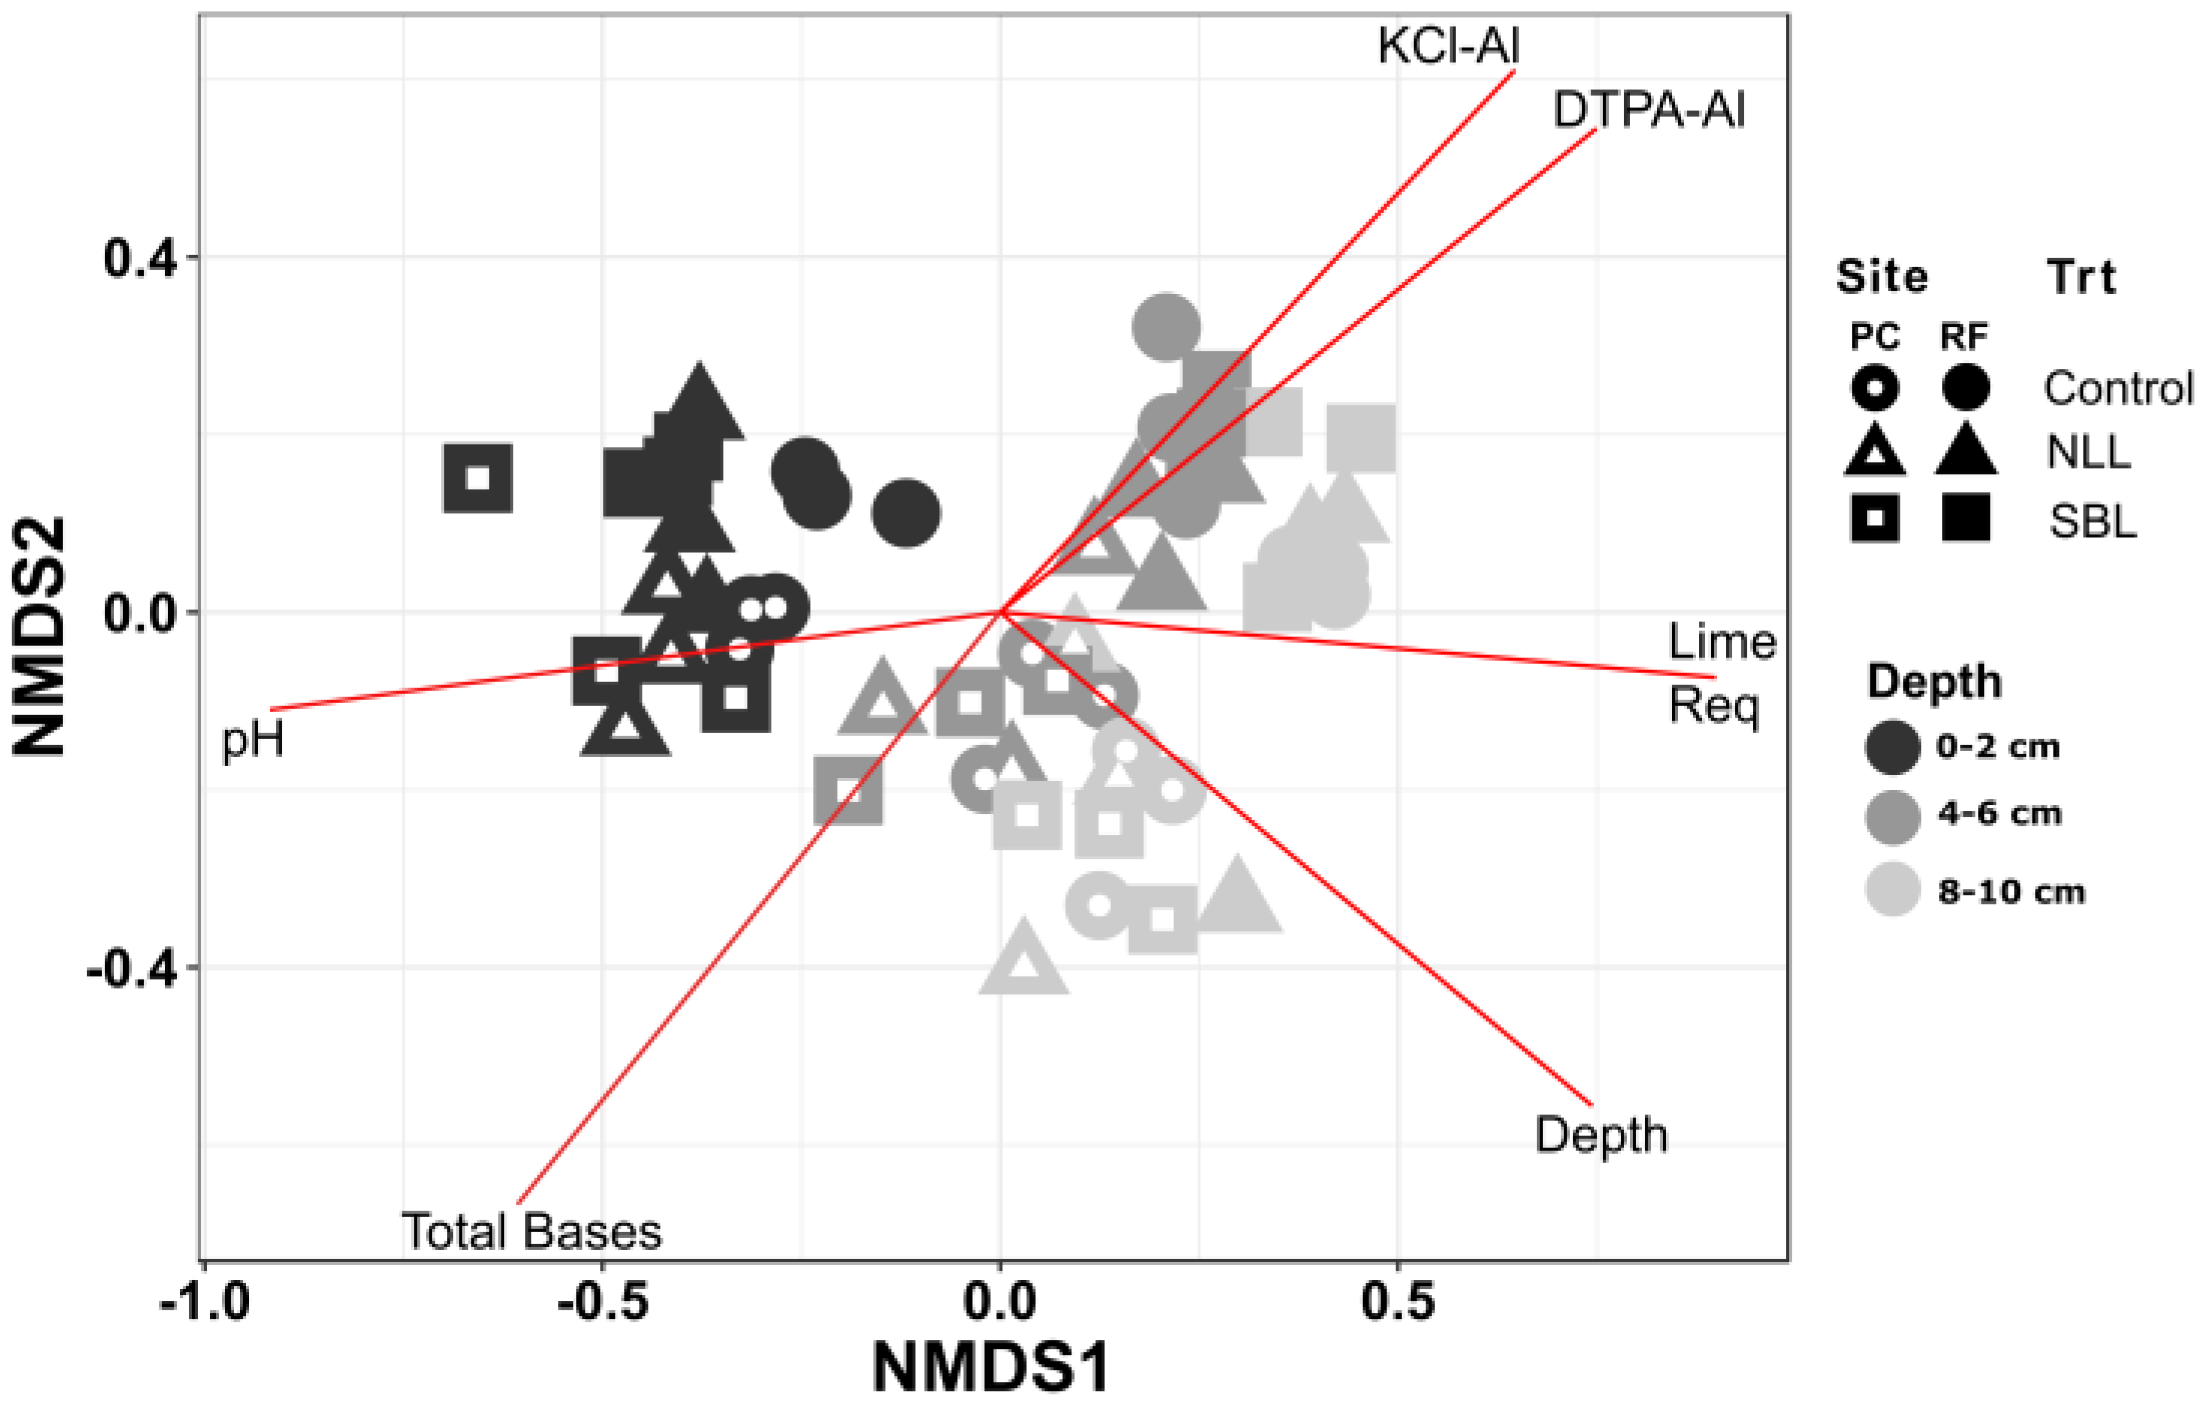
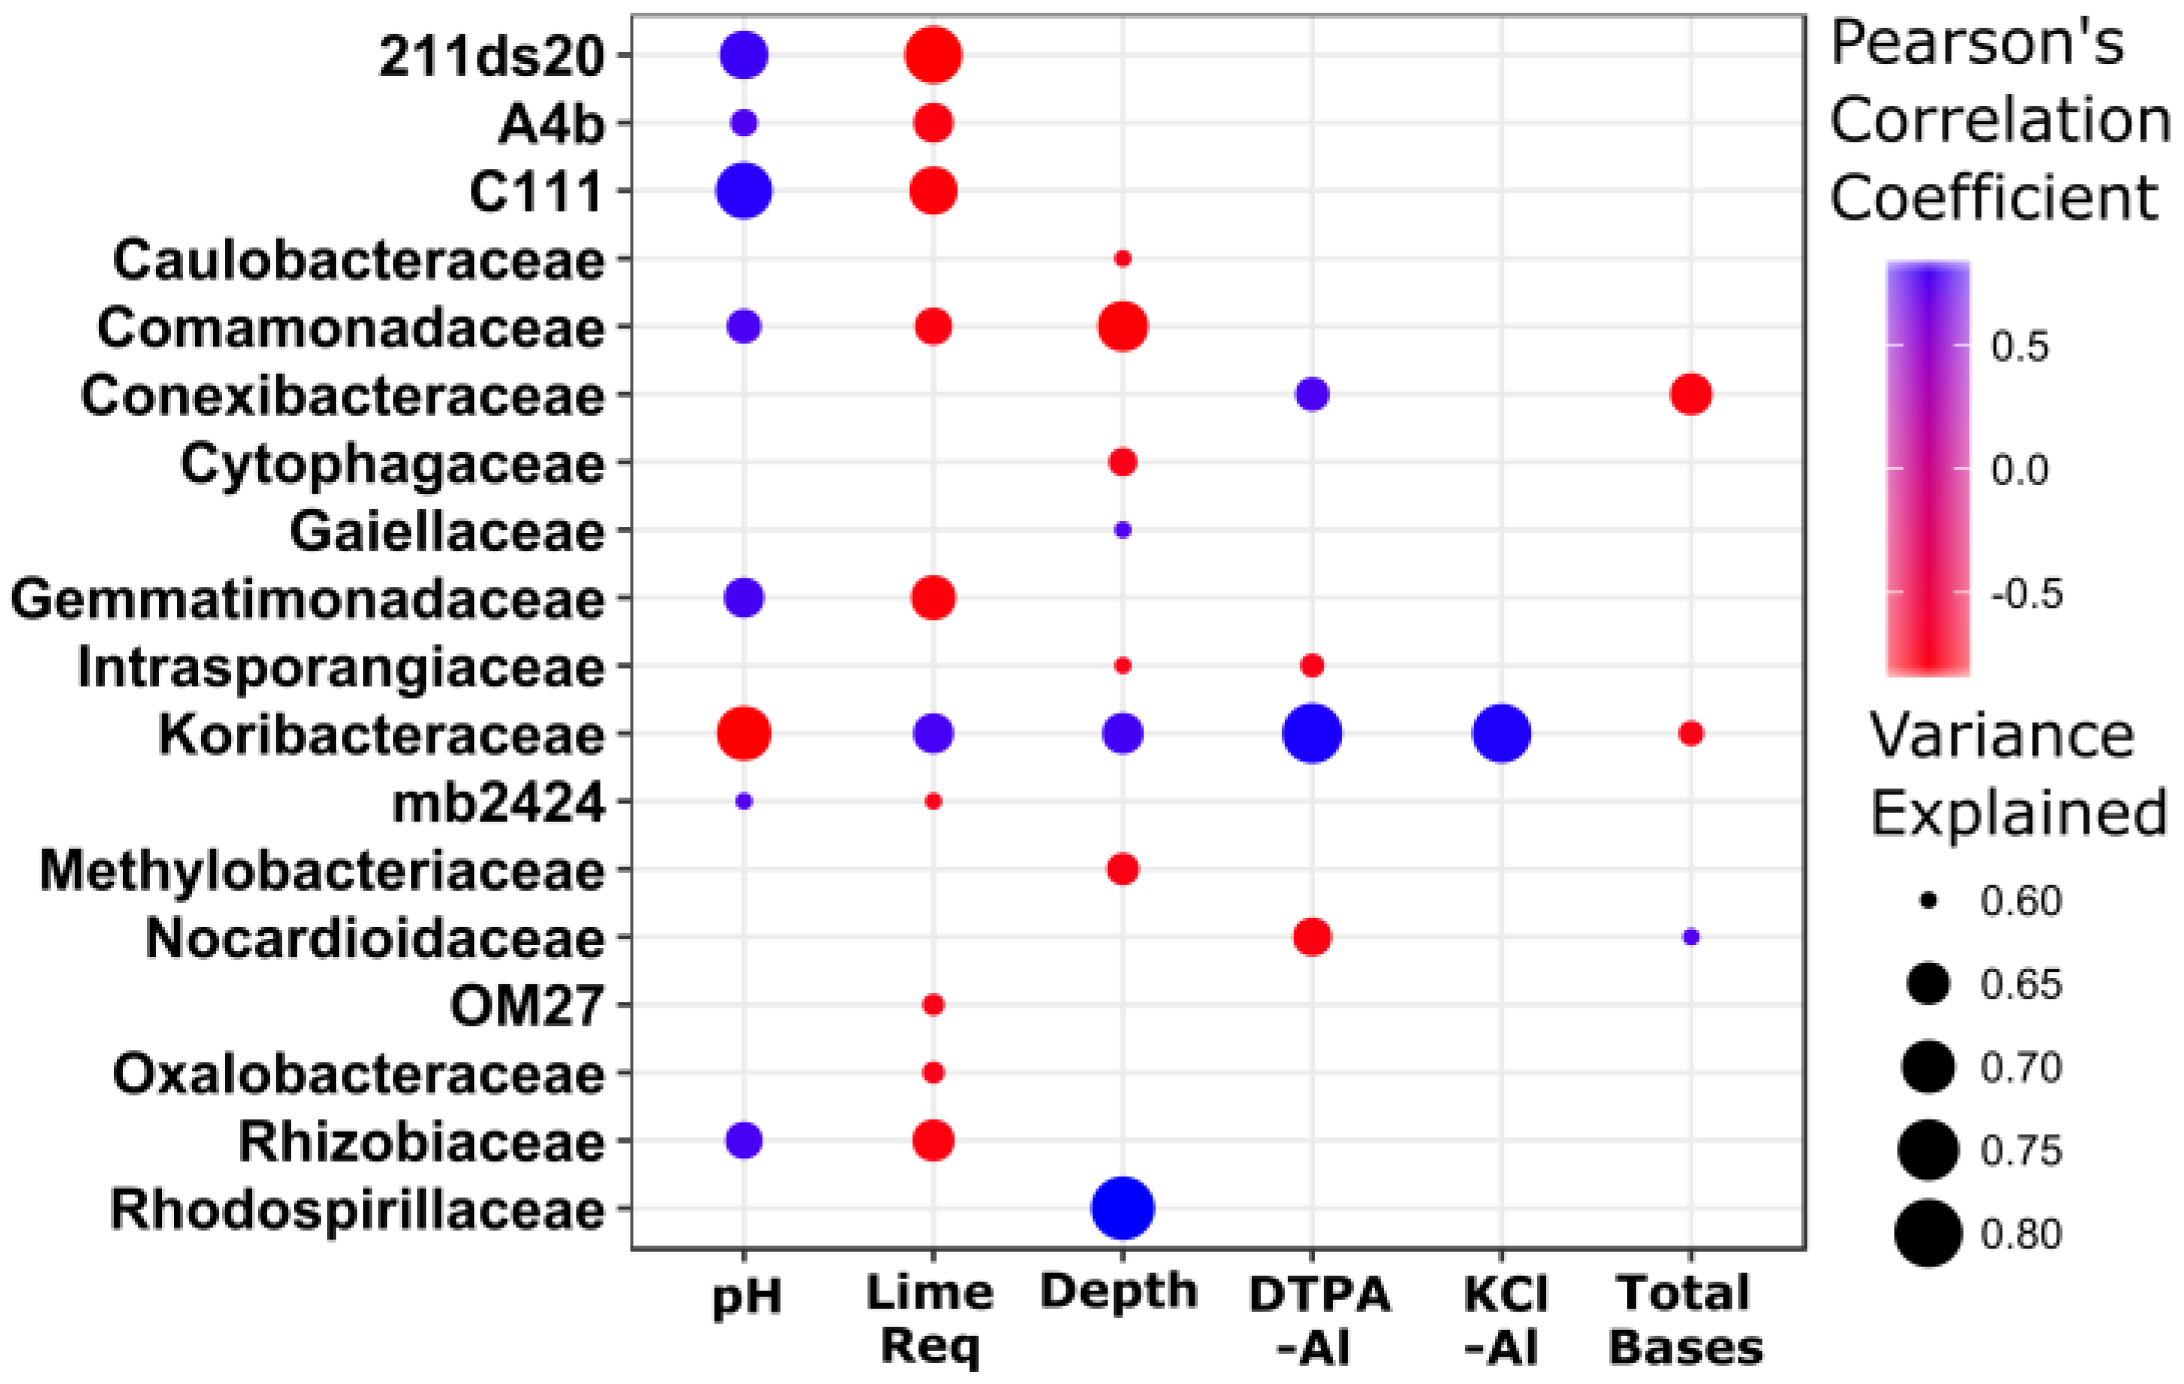
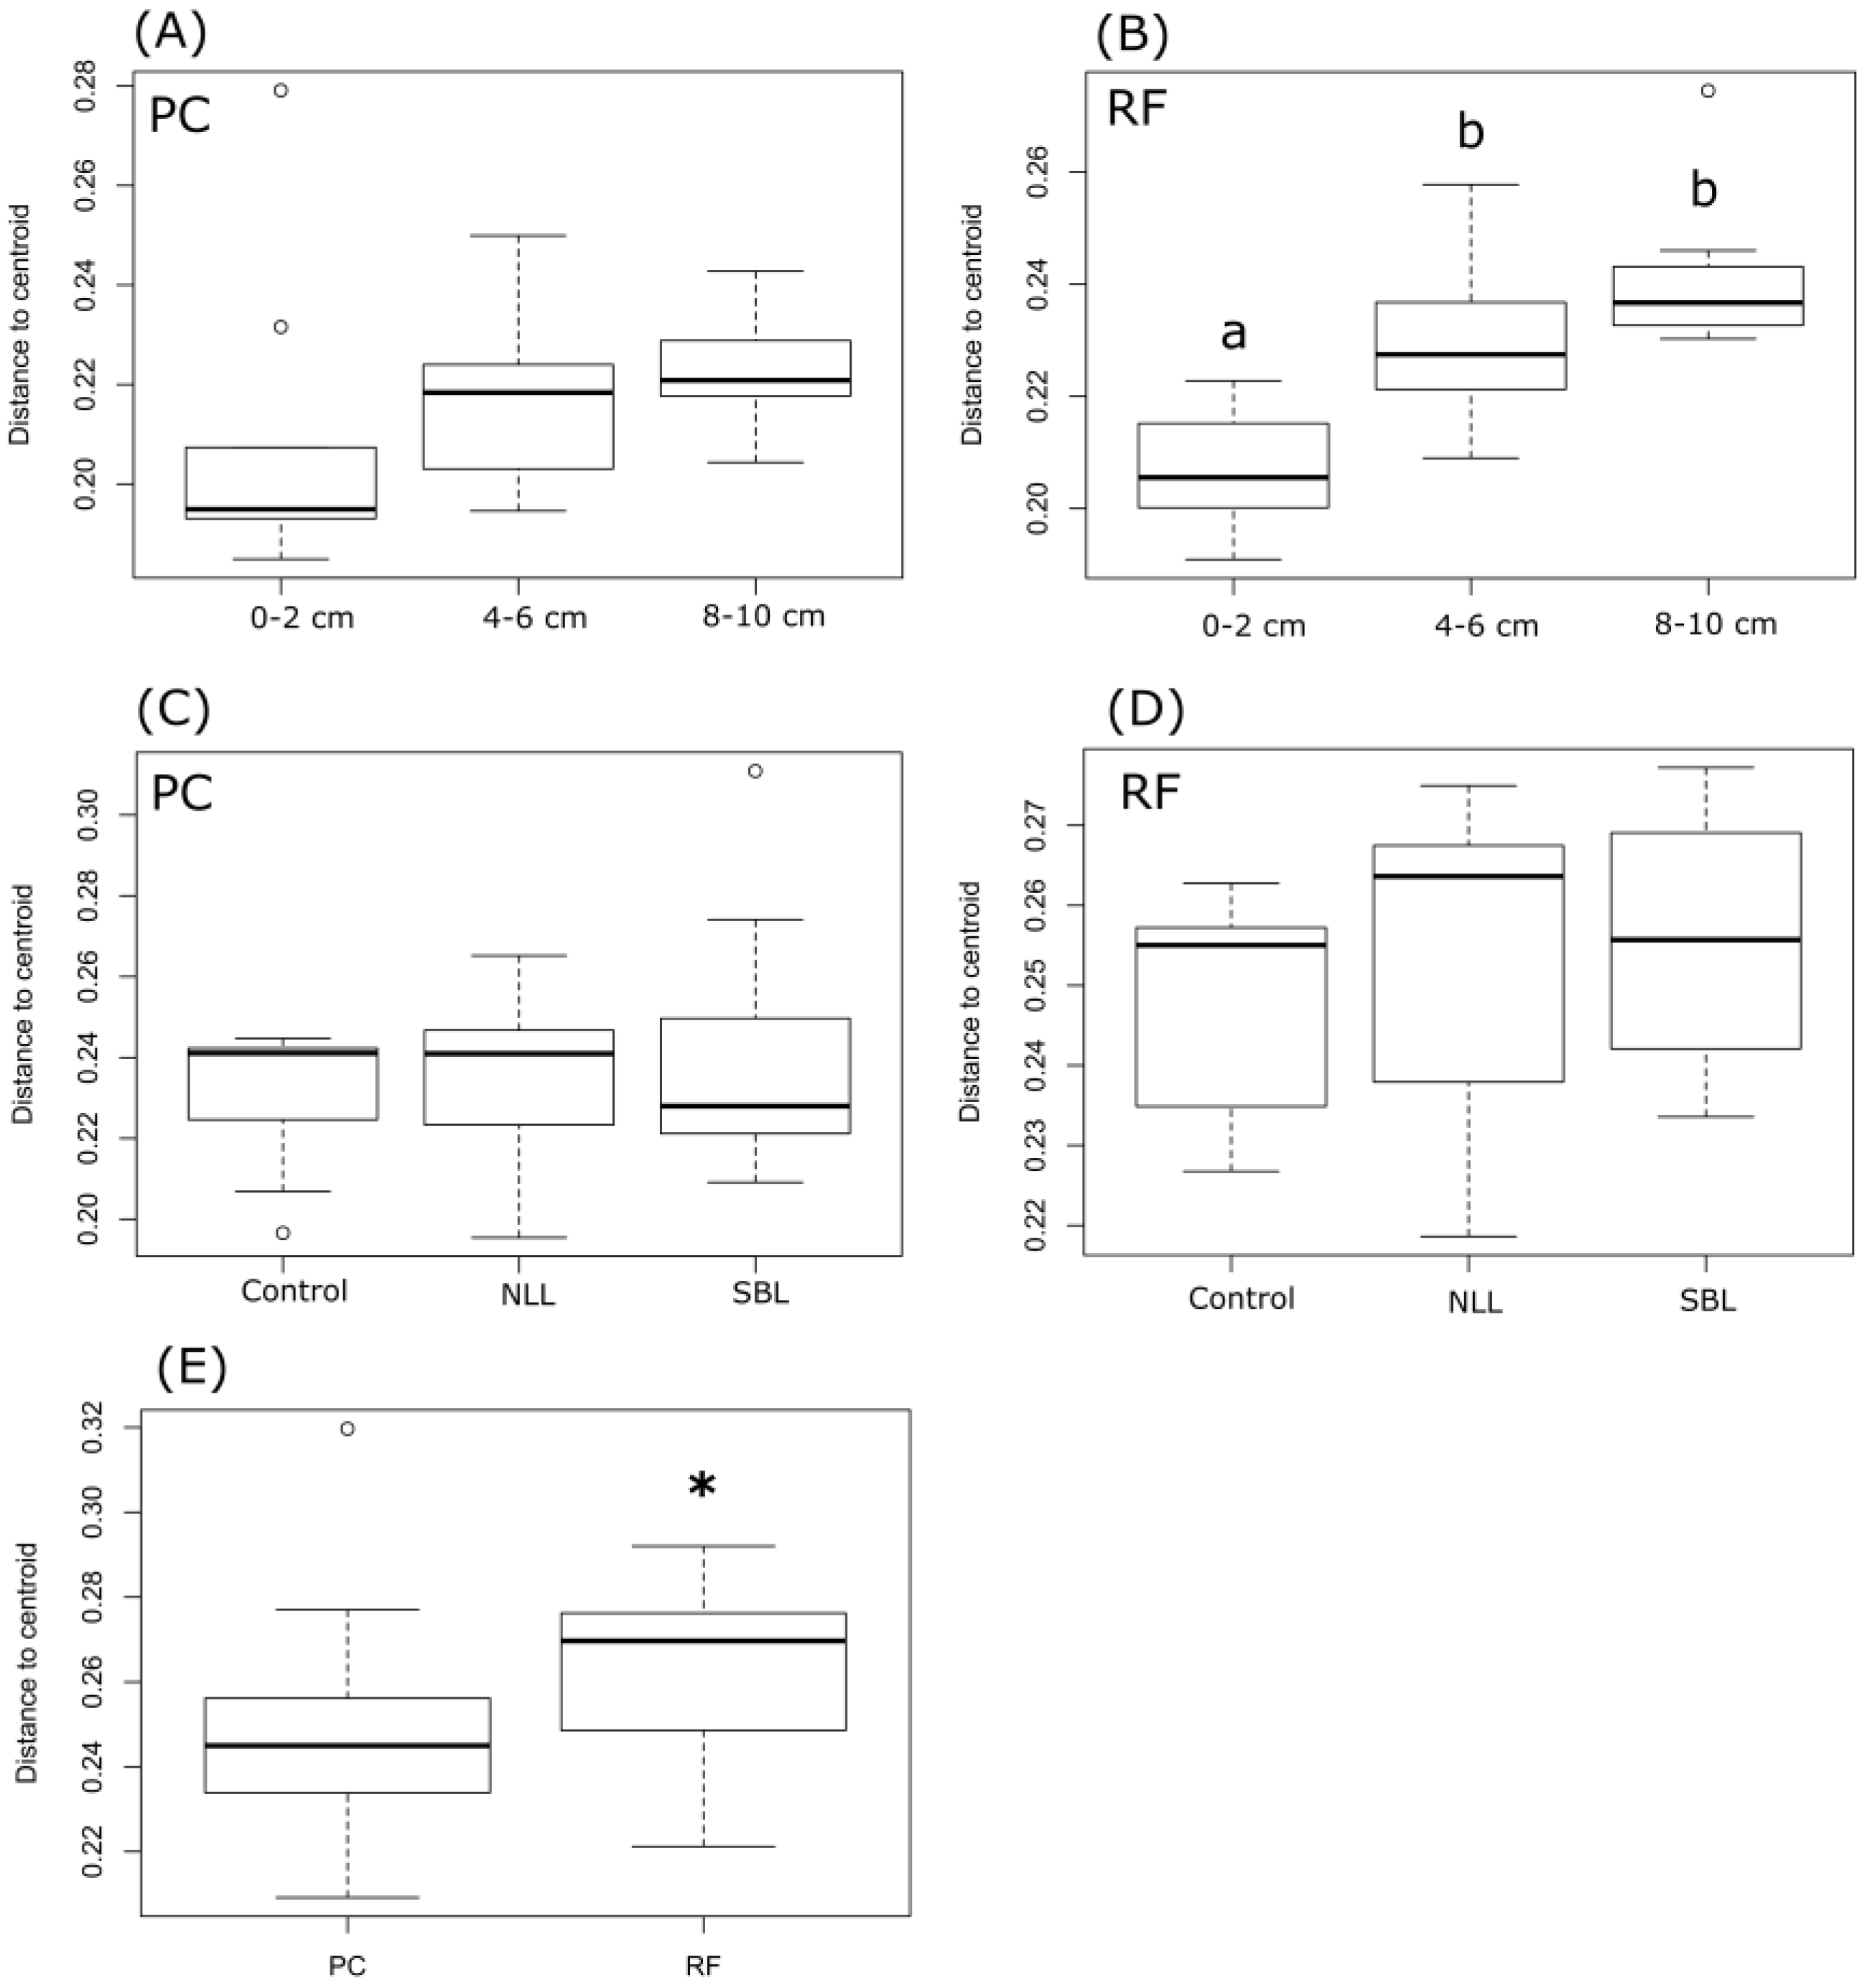
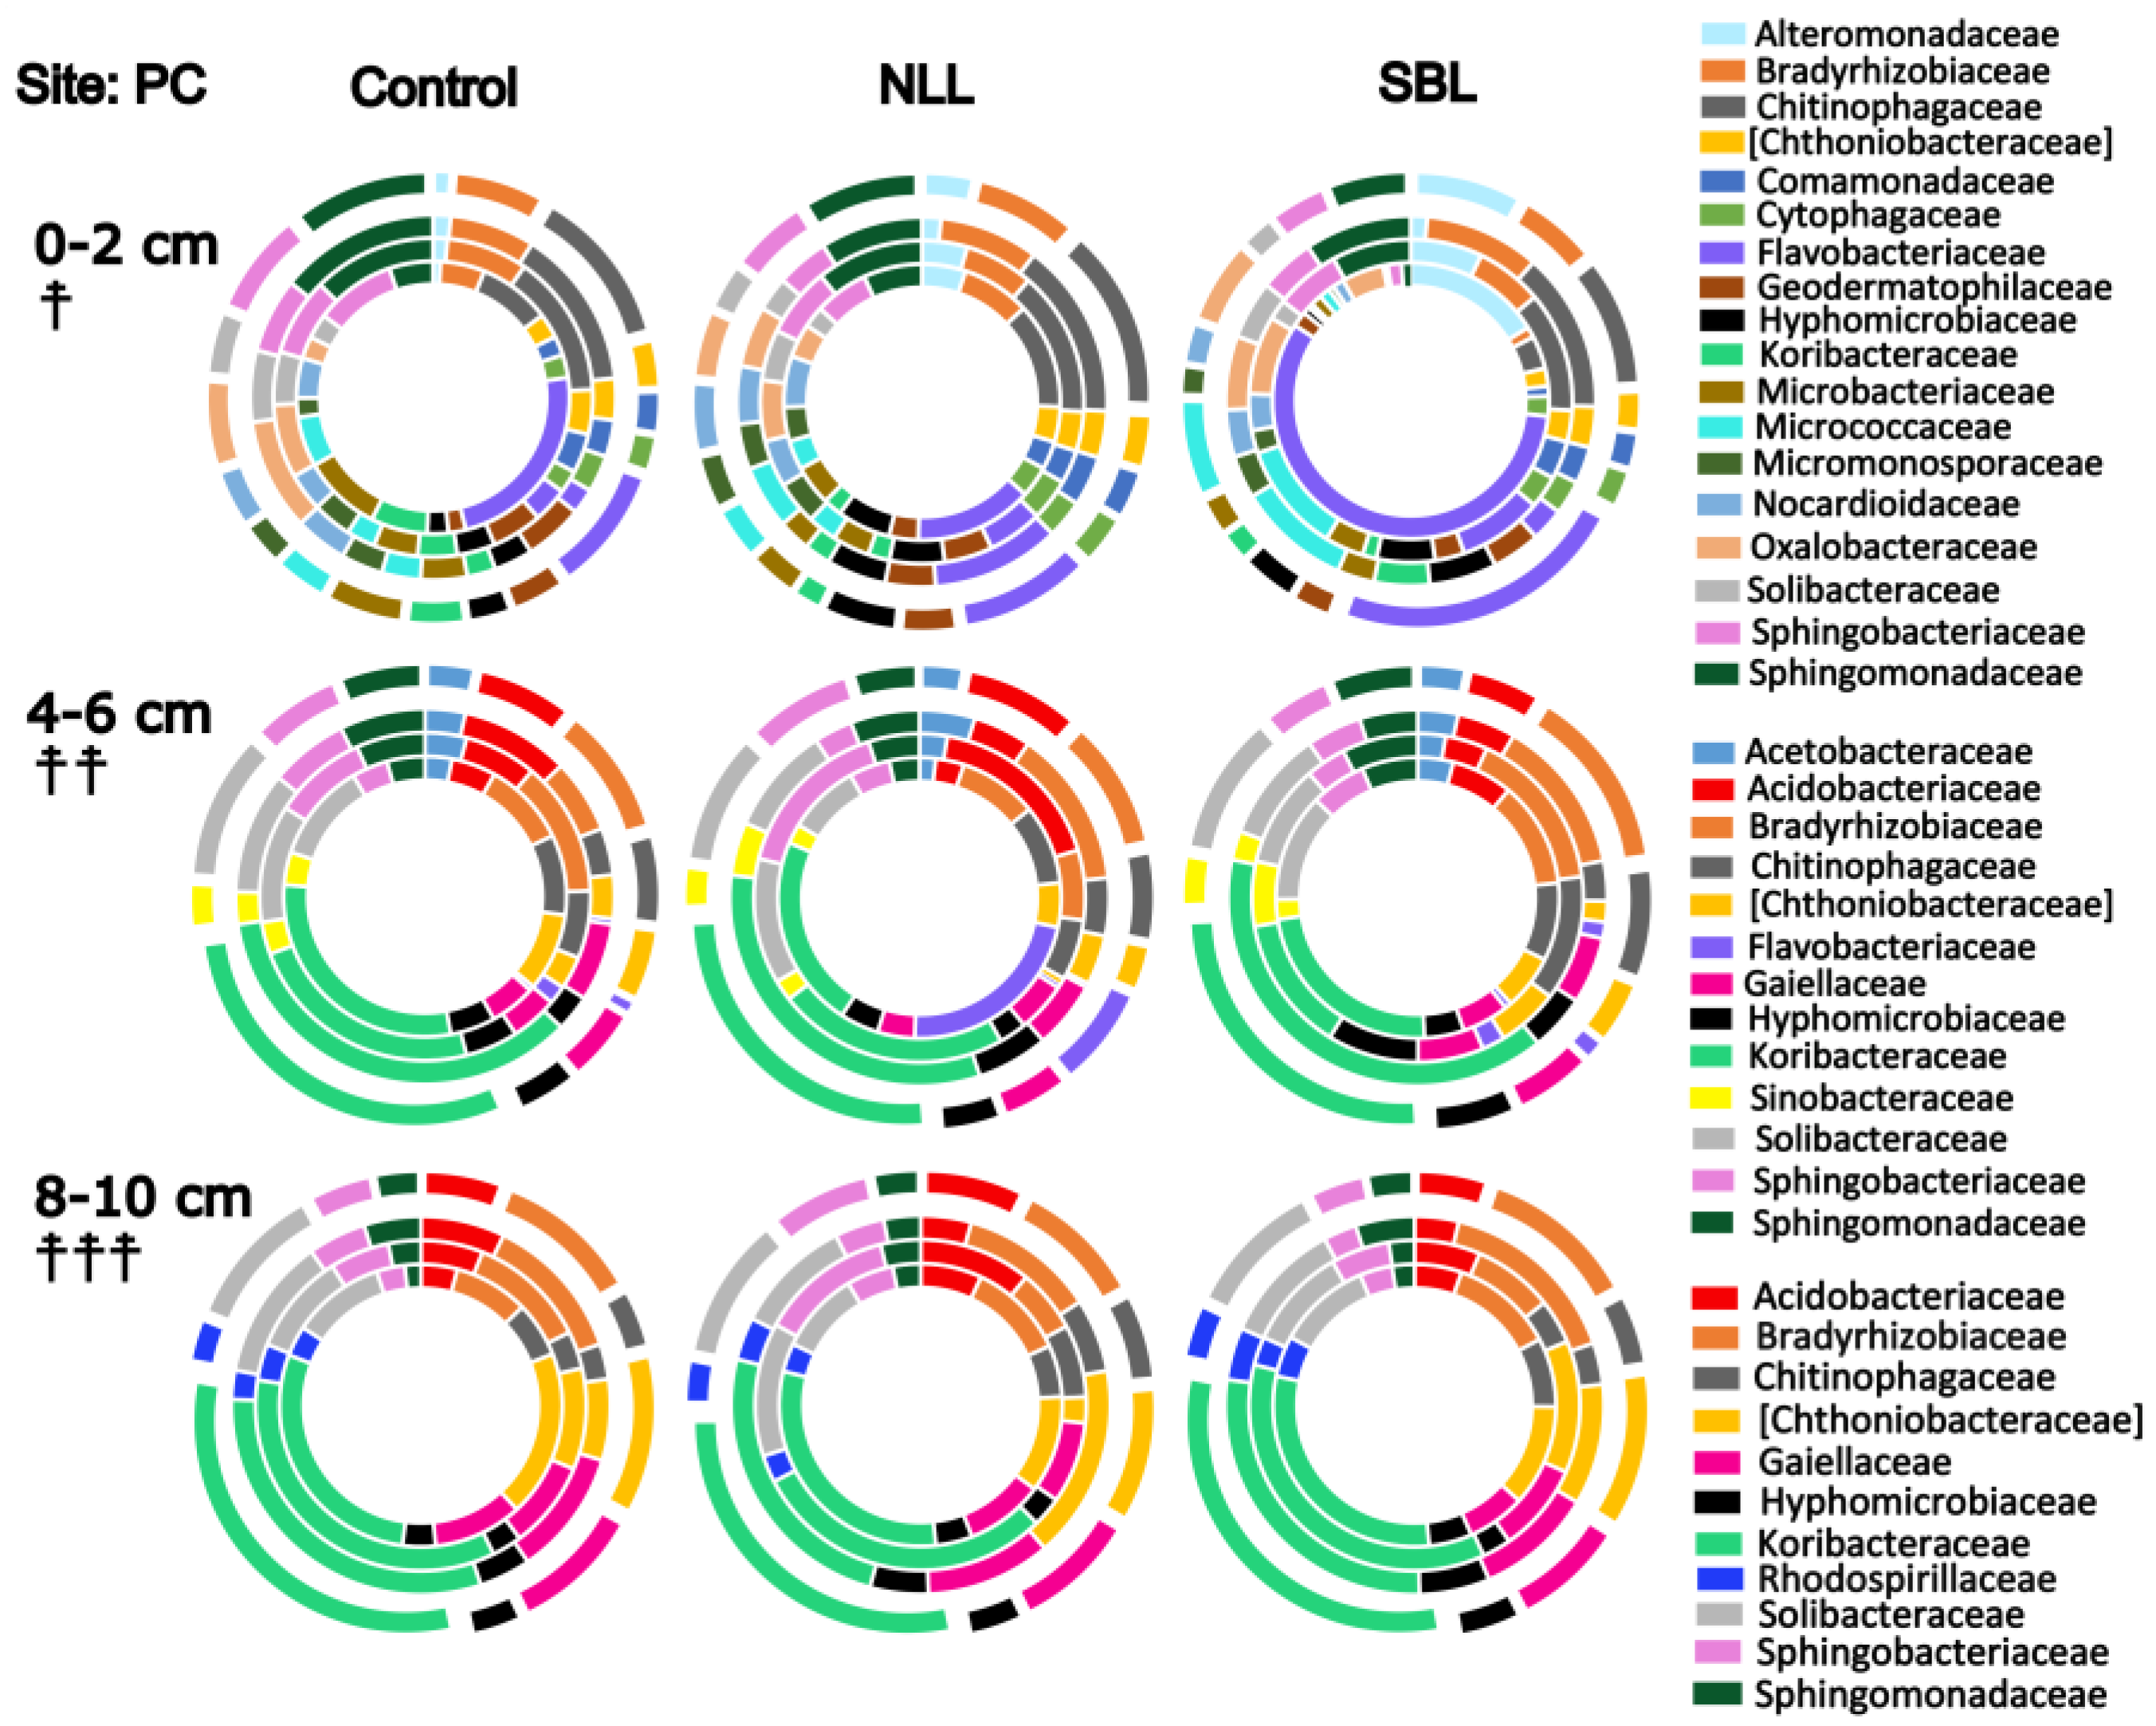
3.2. Soil Bacterial Community Composition

Non-metric multidimensional scaling (NMDS) and PERMANOVA analyses of bacterial community (16S rRNA gene sequences) composition revealed significant site and depth effects (Figure 1). Discrete soil depth increments corresponded with differences in environmental factors that had strong correlations (r2 > 0.8) with microbial community dissimilarities, including DTPA-Al, pH, Total Bases, Lime Req, Ca, and Base Saturation. Due to autocorrelation of Ca and Base Saturation with the Total Bases vector (Table 1), these factors were excluded from the NMDS plot and other analyses. Additionally, the KCl-Al vector (r2 = 0.79) was included for comparison with DTPA-Al. Soil depth directly aligned with the soil pH vector (Figure 1), while Lime Req fell diametrically opposed to soil pH.
No significant liming effects were observed on bacterial community alpha diversity (Table 3); however, diversity generally declined with depth (Table 3). Differences in beta diversity with increasing soil depth were not significant at PC (Figure 2A) but were at RF (Figure 2B). Liming amendment had no significant effect on bacterial beta diversity at either site (Figure 2C,D), but differences in beta diversity were observed between the RF and PC sites (Figure 2E).

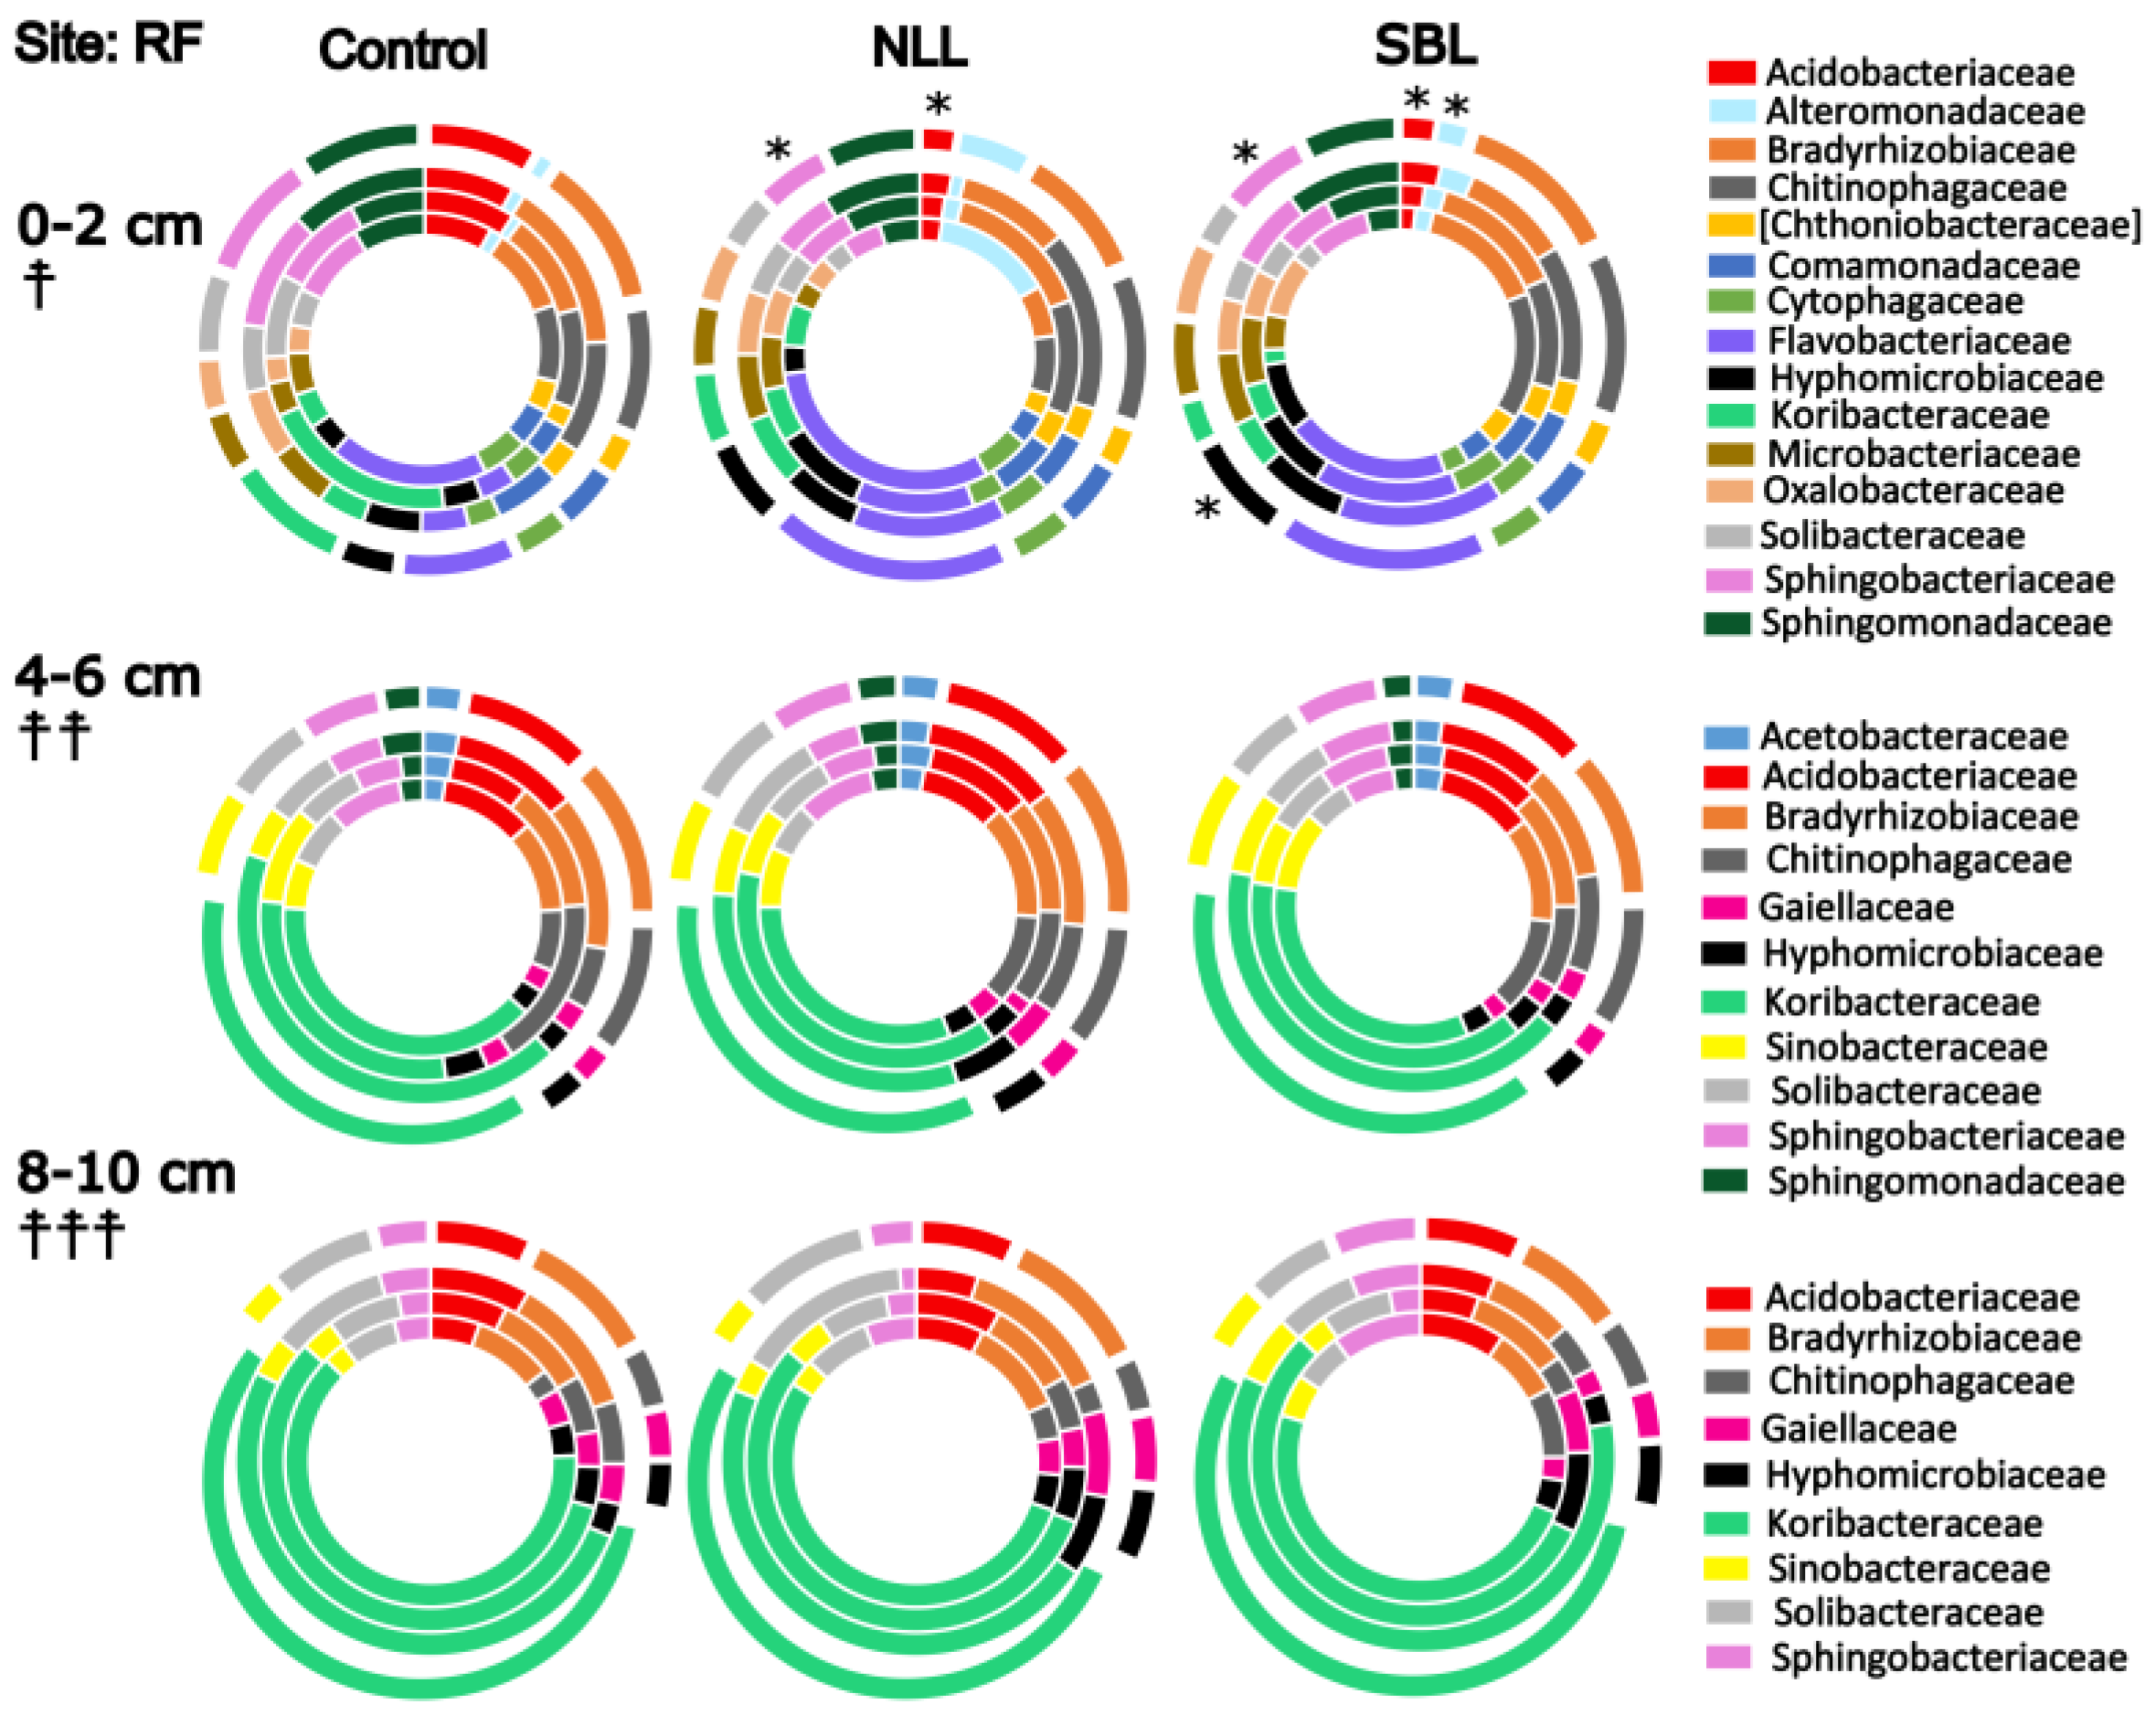
3.3. Taxonomic Stratification and Liming

Differences in relative abundance by depth were observed at both sites (p < 0.05), with each depth being different from all others at each site (Figure 3 and Figure 4). Eight bacterial families were significantly correlated with soil depth. Abundance of Rhodospirillaceae and Koribacteraceae had strong positive correlations with soil depth. Comamonadaceae, Cytophagaceae, and Methylobacteriaceae had the strongest negative correlations with depth (Figure 5). Four families were significantly correlated with DTPA-Al, and Koribacteraceae had strong positive correlations with both DTPA-Al and KCl-Al. Conexibacteraceae had positive correlations with DTPA-Al, while Nocardoidaceae had the strongest negative correlation. Total Bases had a strong negative correlation with Conexibacteracea (Figure 5).
Eight bacterial families were significantly correlated with pH, most of which had opposite correlations with Lime Req (Figure 5). A strong positive correlation was found between pH and the C111 family group within the Acidimicrobiales order (Figure 5). Additional taxa with strong positive correlations to pH include, A4b, Comamonadaceae, and 211ds20. Koribacteraceae abundance had strong negative correlations with pH. Lime Req was also negatively correlated with OM27 and Oxalobacteraceae abundance. (Note that statistical analyses of depth and amendment effects on relative abundance were performed on the abundances of all families while only those with relative abundance > 0.02 are shown).
The influence of liming amendment on relative abundance was only observed at the 0–2 cm depth at the RF site (p = 0.02). Of the families with relative abundance > 0.02, SBL and NLL amendment reduced the relative abundance of Acidobacteriaceae and Sphingobacteriaceae compared with the unamended control soil at RF in surface soils, 0–2 cm (Figure 3). SBL amendment also increased the relative abundance of Alteromonadaceae and Hyphomicrobiaceae compared with the unamended control. Because no significant liming effects were found on community structure at the PC site, significance of liming effects on relative abundance were not assessed at this site, but data are shown (Figure 4).

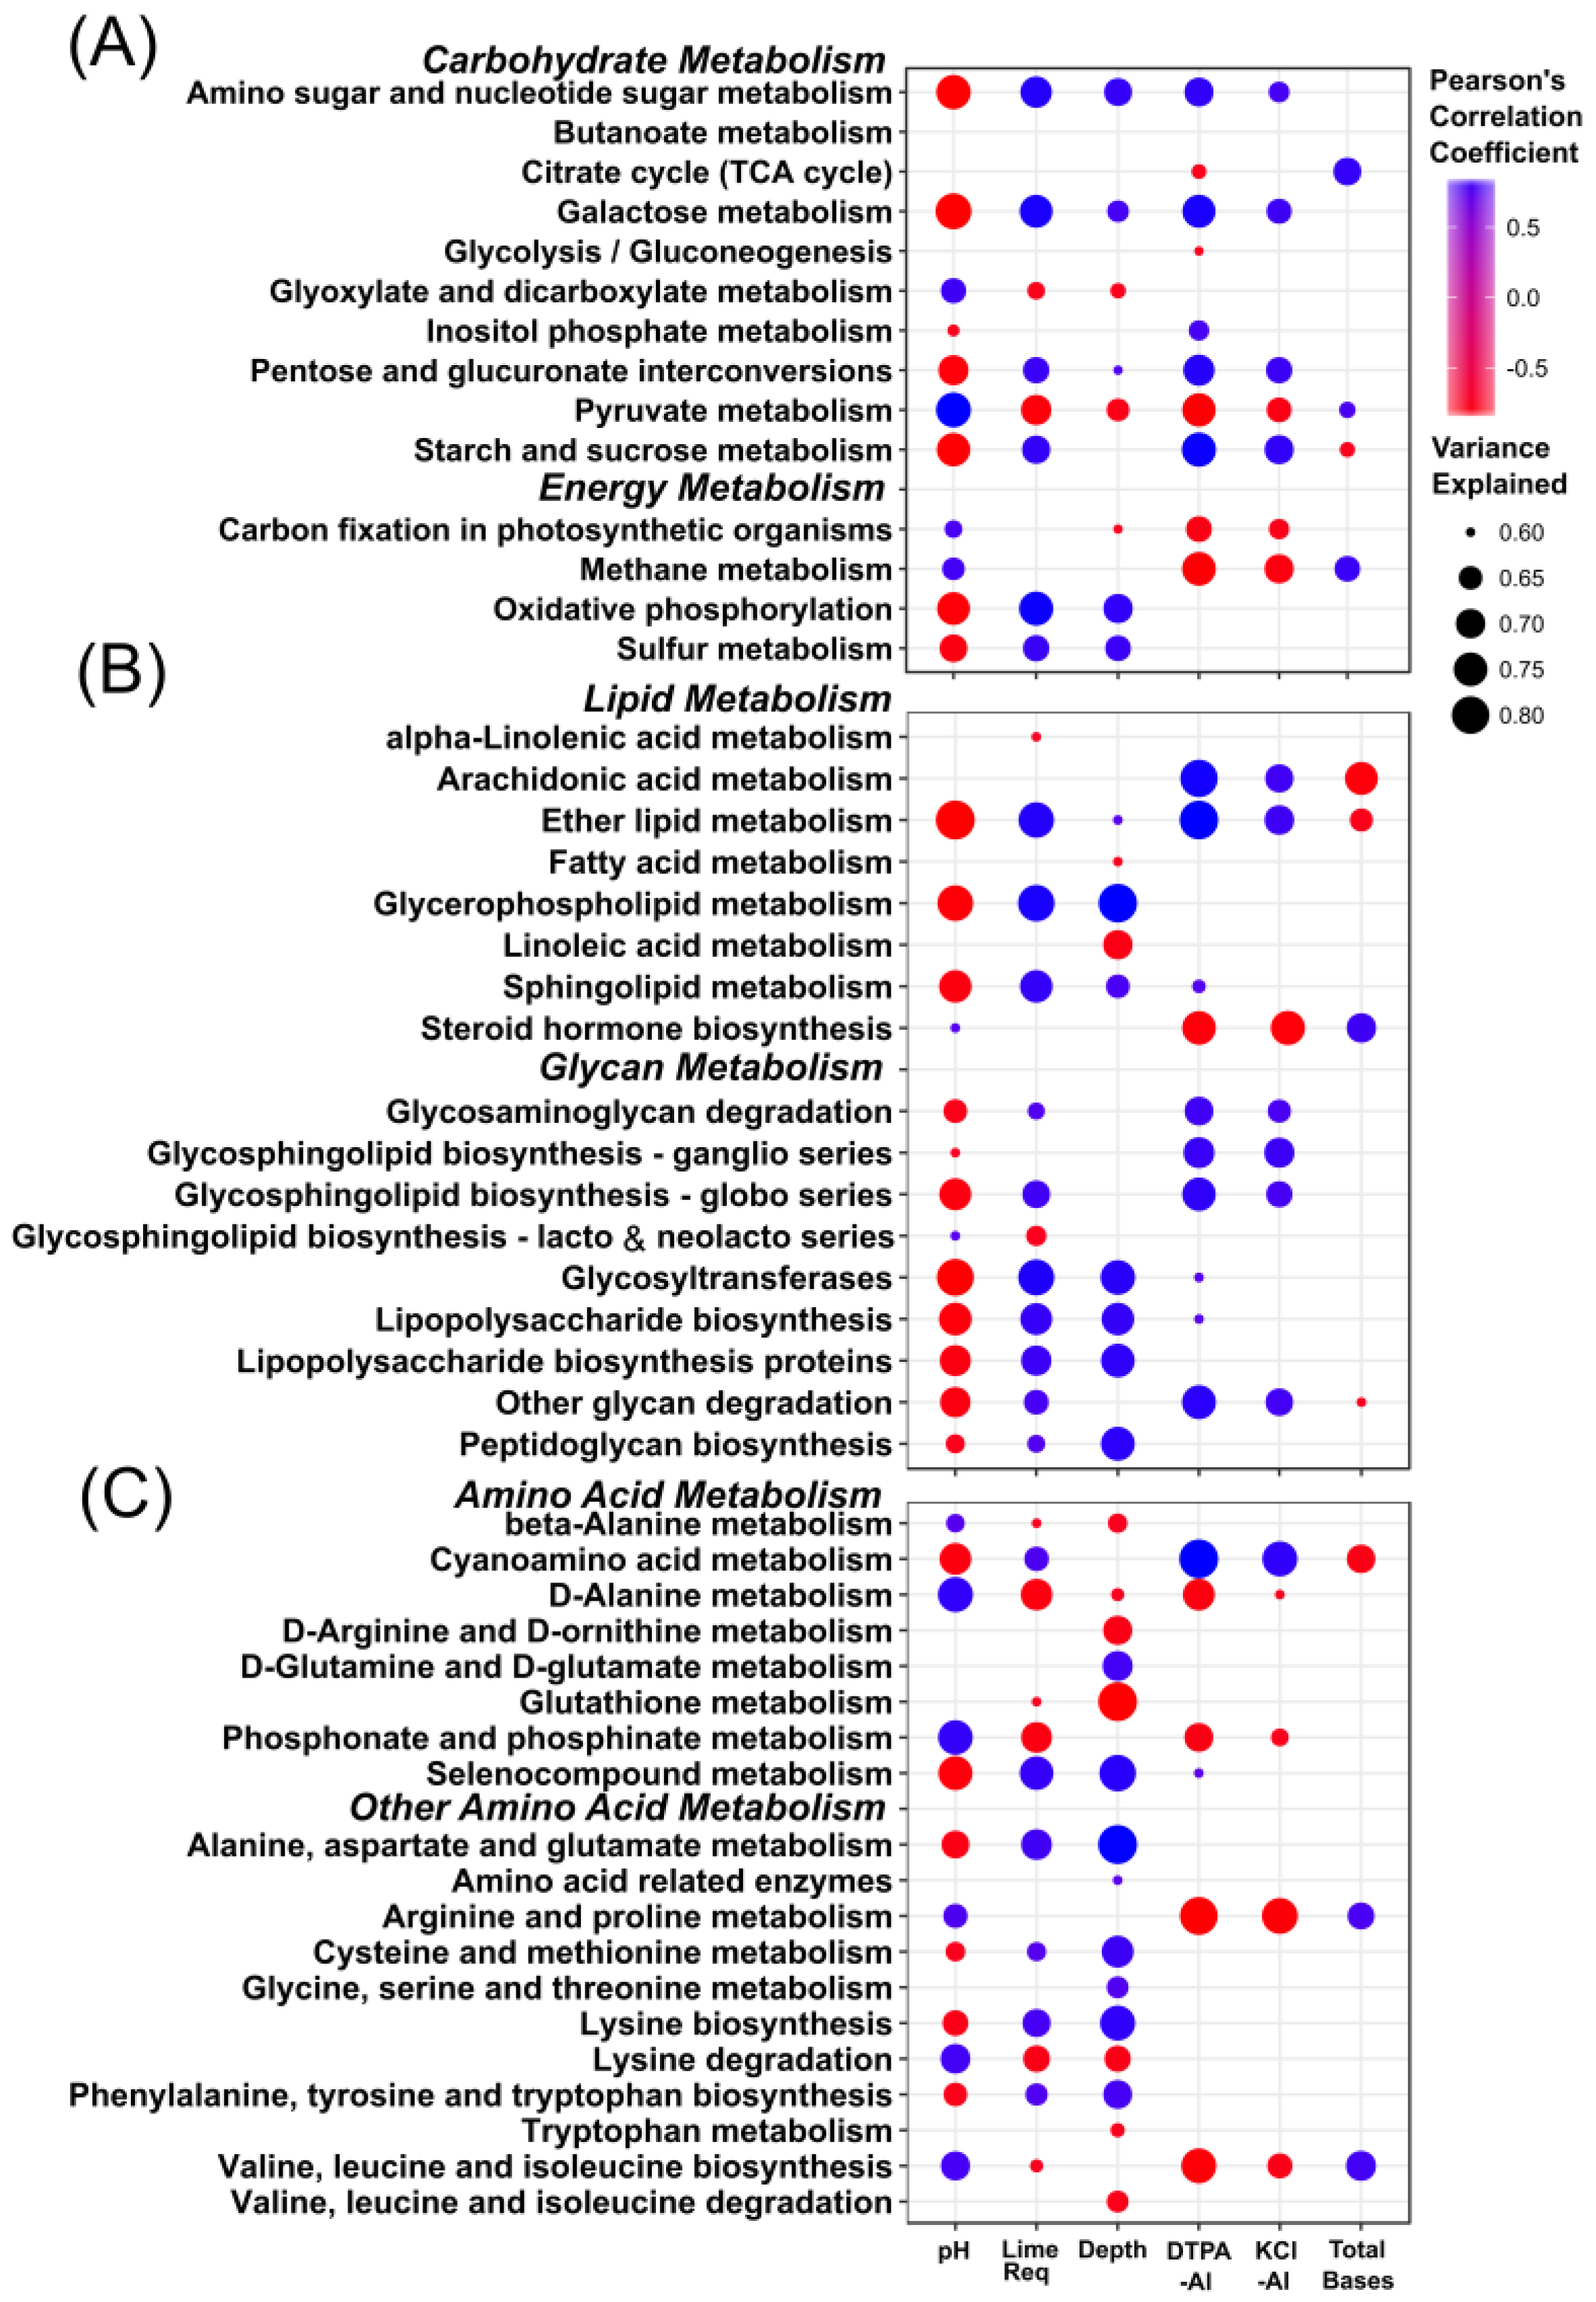
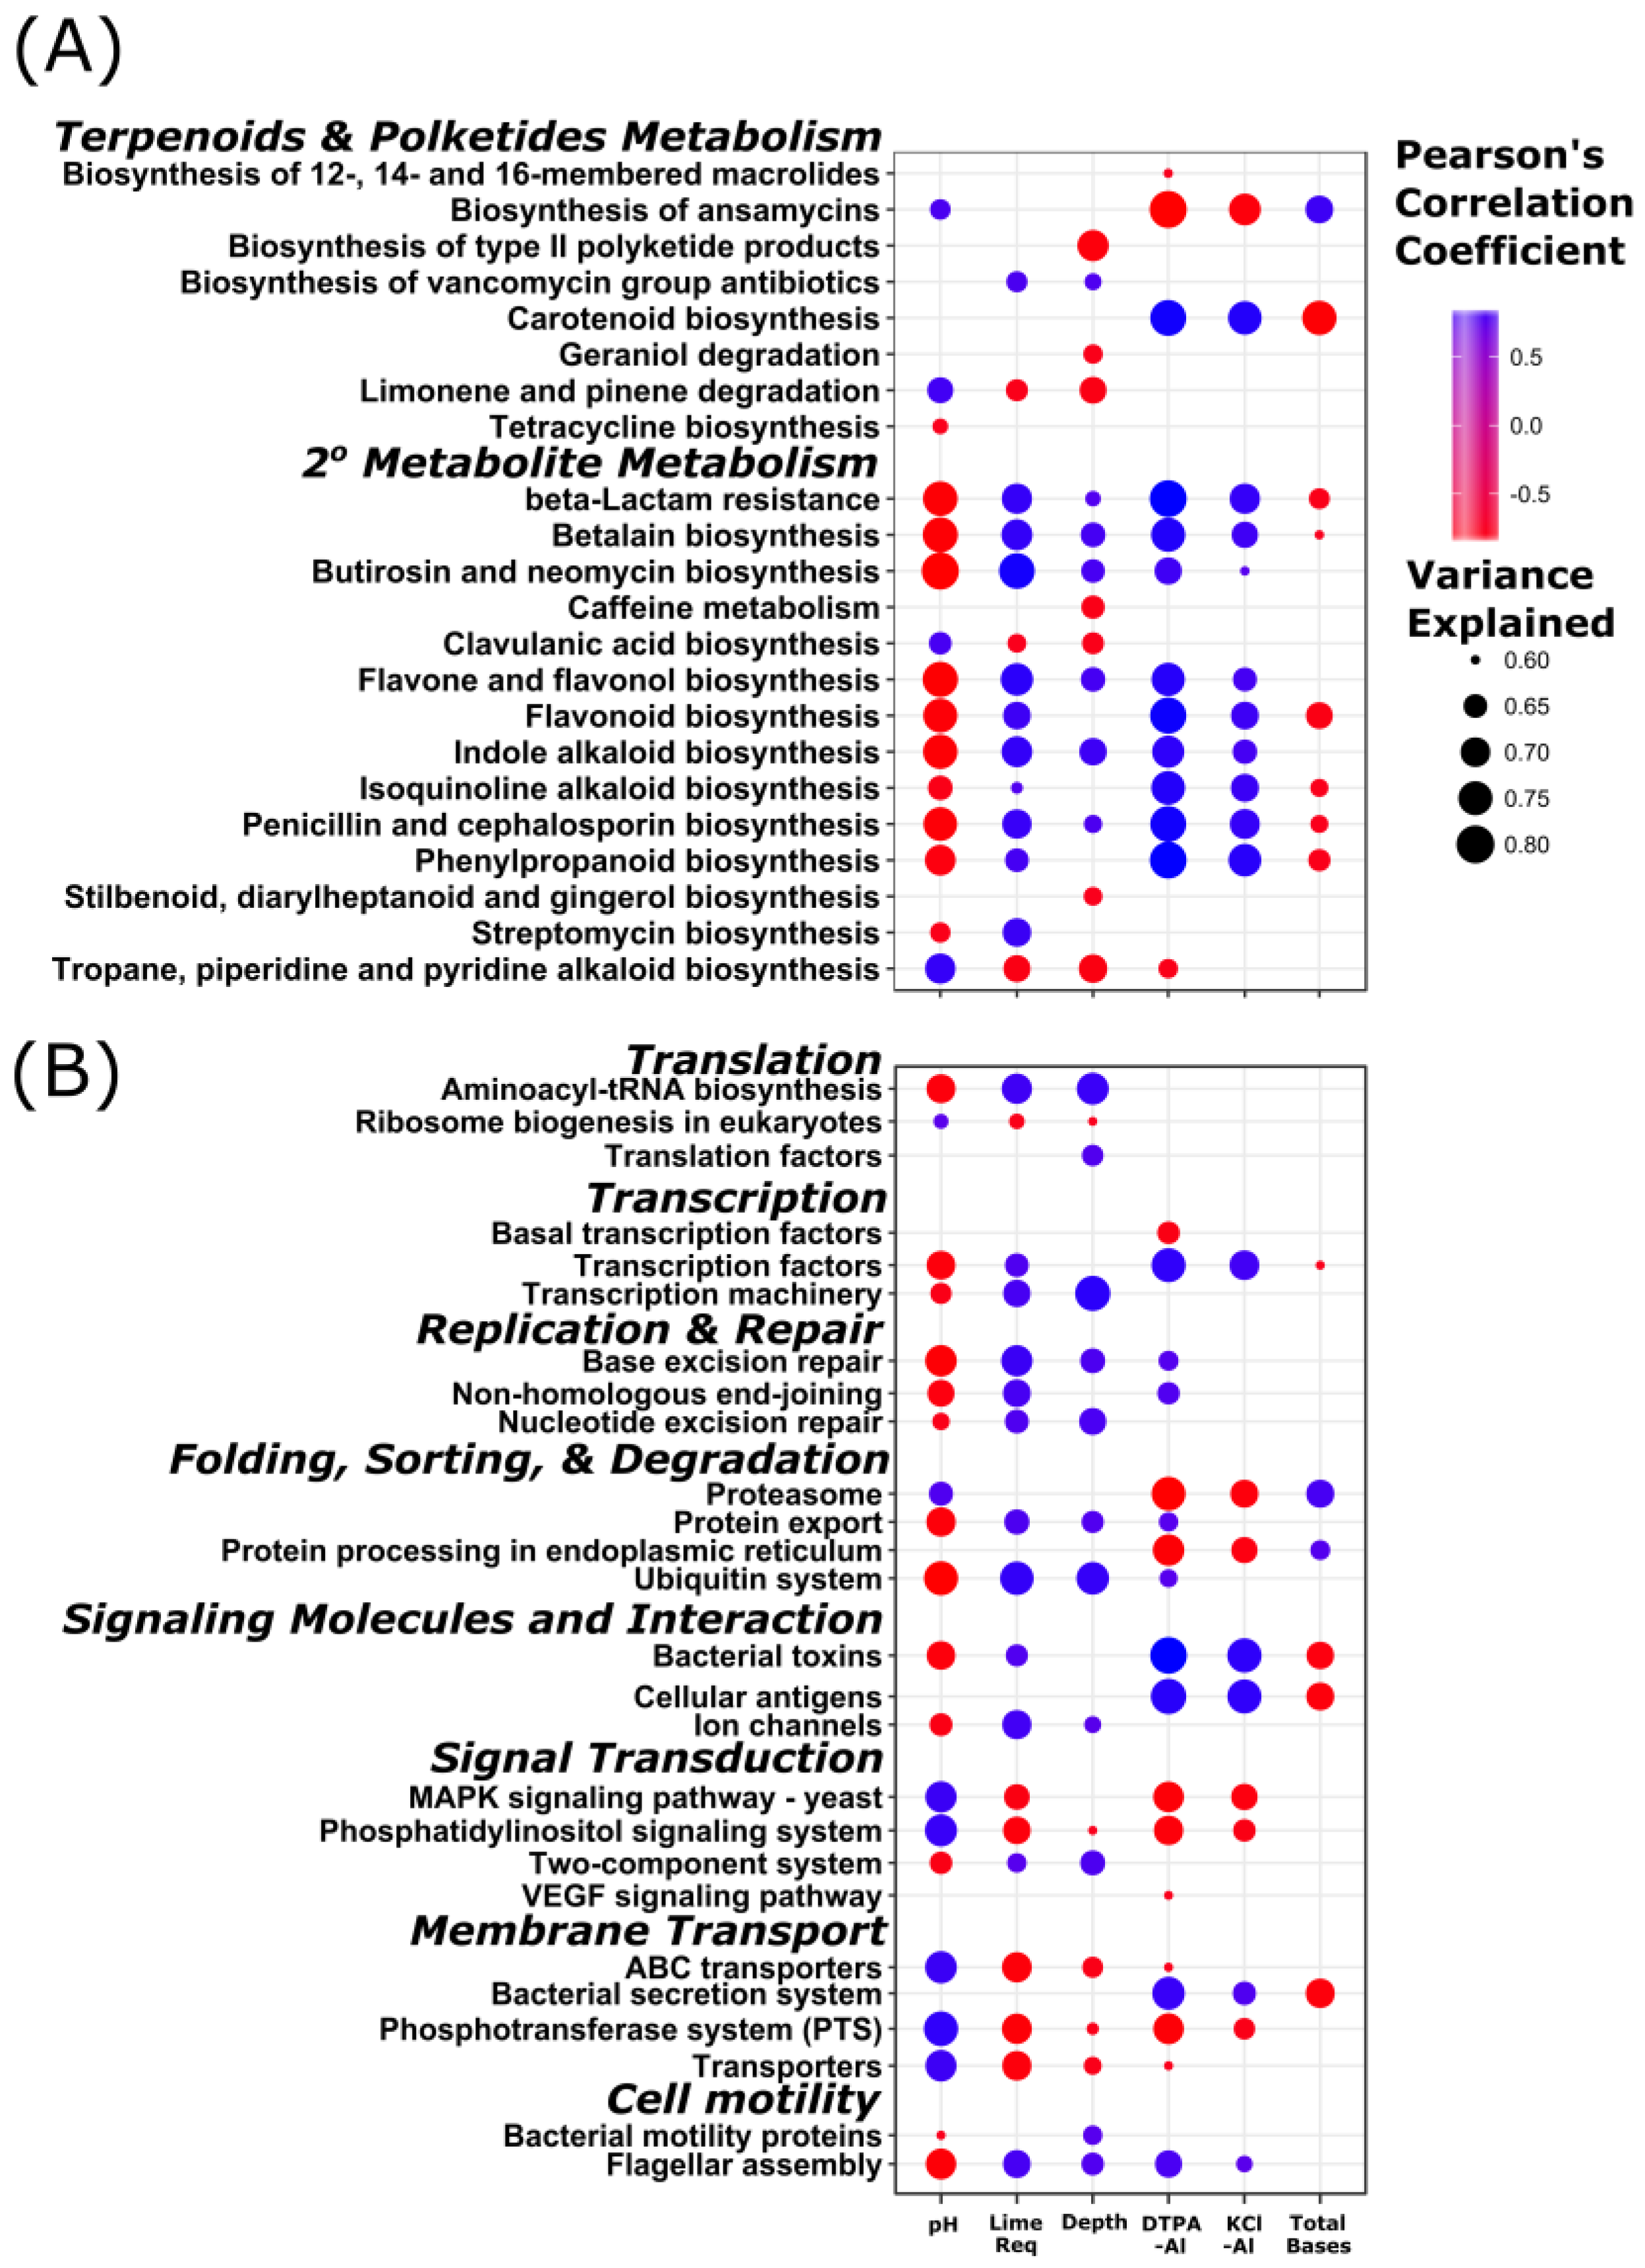
3.4. Stratification of Bacterial Function

The environmental factors with the strongest influence on bacterial predicted functional profiles are soil depth, soil pH, Lime Req, and DTPA-Al (Figure 6 and Figure 7). The relative frequency of KO terms associated with carbohydrate, lipid, glycan, energy, and amino acid metabolism had significant correlations with several environmental factors (Figure 6). DTPA-Al showed stronger and more abundant correlations with the predicted functional profiles compared with KCl-Al (Figure 6 and Figure 7); this may be partially explained by the greater variability in KCl-Al measurements compared with DTPA-Al (Table 2). Other KO terms with strong correlations to these environmental variables include those associated with terpenoid, polketide, and secondary metabolism (Figure 7). Several KO terms associated with cell motility, membrane transport, and translation also correlated strongly with pH, depth, and DTPA-Al (Figure 7). Additionally, we observed a significant site effect on predicted function (p = 0.001, r2 = 0.07). However, depth was found to have a greater influence on predicted function (p = 0.001, r2 = 0.7), consequently, functional profile by environmental data correlations were assessed using the entire dataset (not by site).
KO groups with the highest number of correlated KO terms were carbohydrate, glycan, secondary metabolite, and amino acid metabolism (Figure 6 and Figure 7). Amino acid metabolism was generally negatively correlated with Al concentrations, but demonstrated a mixed response to pH (Figure 6). Lipid and glycan metabolism were positively correlated with Al and negatively correlated with pH. Most strong correlations between Al and KO terms involved in carbohydrate metabolism were positive, while the inverse is true for pH (Figure 6). Al and pH had differential effects on energy metabolism, specifically, negative correlations were observed between Al and ‘methane metabolism’ and ‘carbon fixation in photosynthetic organisms’, while negative correlations were observed between pH and ‘oxidative phosphorylation’ and ‘sulfur metabolism’.

4. Discussion

4.1. Soil pH, Lime, and Bacterial Community Composition

Liming effects on soil pH were observed strictly within the surface 2-cm depth, (Table 2) suggesting limited movement of the amendments into and through the soil profile. Future studies could include multiple applications of the amendments or higher amendment application rates to promote increases in pH to greater depths. Still, liming amendment and resultant soil pH increase, within the 0–2 cm sampling depth was associated with increased Alteromonadaceae and Hyphomicrobiaceae relative abundance at the RF site. Alteromonadaceae abundance was previously found to increase in microbial communities of corals when pH was reduced from 8.2 to 7.3 [22], suggesting potential pH sensitivity in members of this family across ecosystems. Hyphomicrobiaceae abundance was also previously found to be positively correlated with biochar amendment [23], which is relevant given that SBL contains roughly 4% organic matter [9], and because biochar may also increase soil pH [24].
The limited influence of liming amendment on bacterial community structure at depth in this study agrees with the lack of a strong bacterial community response to liming observed by Wang et al. [25] in acidic soils with high Al concentrations and Barth et al. [9]. Wang et al. (2013) found Acidobacteriales and Sphingobacteriales were both dominant orders of acidic soils, which agrees with the observed lime induced reduction of abundance of families associated with these orders (Acidobacteriaceae and Sphingobacteriaceae) in our study (Figure 3). However, Acidobacteriaceae has been both positively and negatively correlated with soil pH depending on which groups of the family are present (see Kielak et al. [26] for review). Little is known concerning the role of the Sphingobacteriaceae family in terrestrial environments, but this family has been associated with wheat roots colonized with Rhizoctonia solani [27], a fungal pathogen of importance in the Palouse region.
Increased abundance of the Koribacteraceae family may be an indication of soil degradation, such as depleted soil nutrient content [28], and the abundance of this family showed a negative correlation with pH, a strong positive correlation with KCl and DTPA extractable Al, and a weaker positive correlation with sampling depth (Figure 5). Koribacteraceae abundance was also previously found to be positively correlated with unfertilized plots receiving inorganic amendments (urea, P2O5, and K2O) compared with soils receiving organic amendments (manure, limestone, and phosphorus) [28]. Conexibacteraceae had a strong positive correlation with DPTA-Al and a weaker negative correlation with Total Bases; this family contains the genus, Conexibacter, which was prevalent in unlimed versus limed mining soils [29]. Norcardioidaceae abundance showed a strong negative correlation with DTPA-Al and a weaker positive correlation with Total Bases (below filtering criteria), which is interesting considering gypsum amendment of “bauxite residue sites” yields increases in the abundance of this family [30]. Additionally, Norcardioidaceae abundance positively correlated with pH (below filtering criteria), which is consistent with the finding that this family was more abundant in gypsum amended bauxite residue sites where pH ~8 versus unamended sites where pH ~10 [30]. Clearly, soil pH plays a major role in the bacterial community composition at PC and RF, with some families correlated with other factors (Al and Total Bases) also demonstrating pH sensitivity in other studies.

4.2. Stratification of Predicted Soil Community Function

An array of metabolic pathways and cellular processes were predicted to be influenced primarily by soil depth, soil pH, and soluble Al (Figure 6 and Figure 7). The autocorrelations among pH, Al, and sampling depth (Table 1) make it difficult to discern which factor is primarily driving the changes in predicted community function; however, these factors are also interrelated in the terrestrial environment (low pH soils generally have high bioavailable Al concentrations, and both vary with depth), so it is pertinent to examine the responses together.
KO terms related to carbohydrate, glycan, secondary metabolite, and amino acid metabolism were particularly responsive to pH, depth, and soluble Al, indicating definitive impacts to carbon and nitrogen cycling. Additionally, numerous KO terms related to basic bacterial physiology were also correlated with these environmental factors. The correlation of Al with shifts in bacterial metabolism is not unexpected. For instance, Al toxicity induces metabolic shifts in pure cultures of P. fluorescens and it is thought these shifts are the result of Al induced disruptions in iron (Fe) homeostasis [31]. Lemire et al. (2010) discusses that Al driven alterations in intracellular Fe homeostasis may inhibit oxidative phosphorylation and subsequently amino acid metabolism along with the entire TCA cycle, which agrees with our findings (Figure 6). Additionally, Al is thought to induce toxicity by direct interaction with DNA in some bacteria [32] and we observed positive correlations between DTPA-Al and base excision repair, along with non-homologous end joining (Figure 7). Aluminum toxicity has also been shown to induce changes in lipid and glycan metabolism in Hydrangea macrophylla [33], consistent with our observations in soil bacteria (Figure 6).

5. Conclusions

Using a 2-cm soil sampling interval and NGS, we observed fine-resolution distinctions in bacterial community structure and function, revealing important biological aspects of soil stratification in NT systems. Increased extractable Al and decreased pH were associated with shifts in bacterial community composition indicating soil degradation (increased abundance of Koribacteraceae). Additionally, pH and Al were correlated with potentially deleterious alterations in bacterial community metabolism and basic cellular functioning (metabolism of amino acids, carbohydrates, lipids, glycans, and energy). These findings imply soil stratification derived from current NT practices influences bacterial community structure and function across small spatial scales (cm) and creates a zone of potentially degraded soil where seedlings emerge and root. The literature suggests crop plants can generally cope with soil stratification in NT systems [3]; however, the crop physiology necessary for this is not clearly understood and soil acidification in general is a major limitation to crop production world-wide. Future work should attempt to clarify the consequences of shifts in microbial structure and function observed in our study in various regions where soil Al and acidification pose the greatest threat.

Acknowledgments

Review of the manuscript and suggestions regarding analysis of community composition and predicted functions were provided by Michael Robeson at the University of Arkansas for Medical Sciences. Additional assistance with microbiome survey data analysis was provided by Aaron Mahoney (Washington State University, Pullman, WA, USA).

Author Contributions

Analysis and interpretation of the microbiome survey data and writing of the manuscript was performed primarily by Ricky W. Lewis. Victoria P. Barth, Carol McFarland, and David Huggins helped design and implement the experiment and collect soil samples, as well as contributing to writing and editing. Todd Coffey advised on the statistical design and assisted with statistical analysis and review of the manuscript. Tarah S. Sullivan determined the experimental design, parameters tested, oversaw the experimental setup, sampling, data analysis, and co-wrote the manuscript.

Conflicts of Interest

The authors declare no conflict of interest.

References

  1. Mahler, R.L.; McDole, R.E. Effect of soil pH on crop yield in Northern Idaho1. Agron. J. 1987, 79, 751–755. [Google Scholar] [CrossRef]
  2. von Uexküll, H.R.; Mutert, E. Global extent, development and economic impact of acid soils. Plant Soil 1995, 171, 1–15. [Google Scholar] [CrossRef]
  3. Grove, J.H.; Ward, R.C.; Weil, R.R. Nutrient stratification in no-till soils. Agron. J. 2007, 65, 781–783. [Google Scholar]
  4. Sipilä, T.P.; Yrjälä, K.; Alakukku, L.; Palojärvi, A. Cross-site soil microbial communities under tillage regimes: Fungistasis and microbial biomarkers. Appl. Environ. Microbiol. 2012, 78, 8191–8201. [Google Scholar] [CrossRef] [PubMed]
  5. Adams, F.; Lund, Z. Effect of chemical activity of soil solution aluminum on cotton root penetration of acid subsoils. Soil Sci. 1966, 101, 193–198. [Google Scholar] [CrossRef]
  6. Auger, C.; Han, S.; Appanna, V.P.; Thomas, S.C.; Ulibarri, G.; Appanna, V.D. Metabolic reengineering invoked by microbial systems to decontaminate aluminum: Implications for bioremediation technologies. Biotechnol. Adv. 2013, 31, 266–273. [Google Scholar] [CrossRef] [PubMed]
  7. Sartain, J.; Kamprath, E. Effect of liming a highly Al-saturated soil on the top and root growth and soybean nodulation. Agron. J. 1975, 67, 507–510. [Google Scholar] [CrossRef]
  8. Shann, J.; Bertsch, P. Differential cultivar response to polynuclear hydroxo-aluminum complexes. Soil Sci. Soc. Am. J. 1993, 57, 116–120. [Google Scholar] [CrossRef]
  9. Barth, V.P.; Reardon, C.R.; Coffey, T.; Klein, A.M.; McFarland, C.L.; Huggins, D.R.; Sullivan, T.S. Stratification of soil chemical and microbial properties under no-till management after lime amendment. Appl. Soil Ecol. 2018. submitted. [Google Scholar]
  10. Kunito, T.; Isomura, I.; Sumi, H.; Park, H.-D.; Toda, H.; Otsuka, S.; Nagaoka, K.; Saeki, K.; Senoo, K. Aluminum and acidity suppress microbial activity and biomass in acidic forest soils. Soil Biol. Biochem. 2016, 97, 23–30. [Google Scholar] [CrossRef]
  11. Joris, H.A.W.; Caires, E.F.; Bini, A.R.; Scharr, D.A.; Haliski, A. Effects of soil acidity and water stress on corn and soybean performance under a no-till system. Plant Soil 2013, 365, 409–424. [Google Scholar] [CrossRef]
  12. Crozier, C.R.; Naderman, G.C.; Tucker, M.R.; Sugg, R.E. Nutrient and pH stratification with conventional and no-till management. Commun. Soil Sci. Plant Anal. 1999, 30, 65–74. [Google Scholar] [CrossRef]
  13. Pierce, F.; Fortin, M.-C.; Staton, M. Periodic plowing effects on soil properties in a no-till farming system. Soil Sci. Soc. Am. J. 1994, 58, 1782–1787. [Google Scholar] [CrossRef]
  14. Thomas, G.A.; Dalal, R.C.; Standley, J. No-till effects on organic matter, pH, cation exchange capacity and nutrient distribution in a luvisol in the semi-arid subtropics. Soil Tillage Res. 2007, 94, 295–304. [Google Scholar] [CrossRef]
  15. Klindworth, A.; Pruesse, E.; Schweer, T.; Peplies, J.; Quast, C.; Horn, M.; Glöckner, F.O. Evaluation of general 16S ribosomal RNA gene PCR primers for classical and next-generation sequencing-based diversity studies. Nucleic Acids Res. 2013, 41, e1. [Google Scholar] [CrossRef] [PubMed]
  16. Albanese, D.; Fontana, P.; De Filippo, C.; Cavalieri, D.; Donati, C. Micca: A complete and accurate software for taxonomic profiling of metagenomic data. Sci. Rep. 2015, 5, 9743. [Google Scholar] [CrossRef] [PubMed]
  17. Langille, M.G.I.; Zaneveld, J.; Caporaso, J.G.; McDonald, D.; Knights, D.; Reyes, J.A.; Clemente, J.C.; Burkepile, D.E.; Vega Thurber, R.L.; Knight, R.; et al. Predictive functional profiling of microbial communities using 16S rRNA marker gene sequences. Nat. Biotechnol. 2013, 31, 814–821. [Google Scholar] [CrossRef] [PubMed] [Green Version]
  18. McDonald, D.; Clemente, J.C.; Kuczynski, J.; Rideout, J.R.; Stombaugh, J.; Wendel, D.; Wilke, A.; Huse, S.; Hufnagle, J.; Meyer, F. The Biological Observation Matrix (BIOM) format or: How I learned to stop worrying and love the ome-ome. GigaScience 2012, 1, 7. [Google Scholar] [CrossRef] [PubMed]
  19. McMurdie, P.J.; Holmes, S. Phyloseq: An R package for reproducible interactive analysis and graphics of microbiome census data. PLoS ONE 2013, 8, e61217. [Google Scholar] [CrossRef] [PubMed]
  20. Oksanen, J.; Kindt, R.; Legendre, P.; O’Hara, B.; Stevens, M.H.H.; Oksanen, M.J.; Suggests, M. The vegan package. Community Ecol. Package 2007, 10, 631–637. [Google Scholar]
  21. Wickham, H. A layered grammar of graphics. J. Comput. Graph. Stat. 2010, 19, 3–28. [Google Scholar] [CrossRef]
  22. Meron, D.; Atias, E.; Iasur Kruh, L.; Elifantz, H.; Minz, D.; Fine, M.; Banin, E. The impact of reduced pH on the microbial community of the coral acropora eurystoma. ISME J. 2011, 5, 51–60. [Google Scholar] [CrossRef] [PubMed]
  23. Anderson, C.R.; Condron, L.M.; Clough, T.J.; Fiers, M.; Stewart, A.; Hill, R.A.; Sherlock, R.R. Biochar induced soil microbial community change: Implications for biogeochemical cycling of carbon, nitrogen and phosphorus. Pedobiologia 2011, 54, 309–320. [Google Scholar] [CrossRef]
  24. Obia, A.; Cornelissen, G.; Mulder, J.; Dörsch, P. Effect of soil ph increase by biochar on NO, N2O and N2 production during denitrification in acid soils. PLoS ONE 2015, 10, e0138781. [Google Scholar] [CrossRef] [PubMed] [Green Version]
  25. Wang, C.; Zhao, X.; Chen, R.; Chu, H.; Shen, R. Aluminum tolerance of wheat does not induce changes in dominant bacterial community composition or abundance in an acidic soil. Plant Soil 2013, 367, 275–284. [Google Scholar] [CrossRef]
  26. Kielak, A.M.; Barreto, C.C.; Kowalchuk, G.A.; van Veen, J.A.; Kuramae, E.E. The ecology of acidobacteria: Moving beyond genes and genomes. Front. Microbiol. 2016, 7, 744. [Google Scholar] [CrossRef] [PubMed]
  27. Yin, C.; Hulbert, S.H.; Schroeder, K.L.; Mavrodi, O.; Mavrodi, D.; Dhingra, A.; Schillinger, W.F.; Paulitz, T.C. Role of bacterial communities in the natural suppression of Rhizoctonia solani bare patch disease of wheat (Triticum aestivum L.). Appl. Environ. Microbiol. 2013, 79, 7428–7438. [Google Scholar] [CrossRef] [PubMed]
  28. Soman, C.; Li, D.; Wander, M.M.; Kent, A.D. Long-term fertilizer and crop-rotation treatments differentially affect soil bacterial community structure. Plant Soil 2017, 413, 145–159. [Google Scholar] [CrossRef]
  29. Narendrula-Kotha, R.; Nkongolo, K.K. Microbial response to soil liming of damaged ecosystems revealed by pyrosequencing and phospholipid fatty acid analyses. PLoS ONE 2017, 12, e0168497. [Google Scholar] [CrossRef] [PubMed]
  30. Schmalenberger, A.; O’Sullivan, O.; Gahan, J.; Cotter, P.D.; Courtney, R. Bacterial communities established in bauxite residues with different restoration histories. Environ. Sci. Technol. 2013, 47, 7110–7119. [Google Scholar] [CrossRef] [PubMed]
  31. Lemire, J.; Mailloux, R.; Auger, C.; Whalen, D.; Appanna, V.D. Pseudomonas fluorescens orchestrates a fine metabolic-balancing act to counter aluminium toxicity. Environ. Microbiol. 2010, 12, 1384–1390. [Google Scholar] [PubMed]
  32. Wood, M. A mechanism of aluminium toxicity to soil bacteria and possible ecological implications. Plant Soil 1995, 171, 63–69. [Google Scholar] [CrossRef]
  33. Chen, H.; Lu, C.; Jiang, H.; Peng, J. Global transcriptome analysis reveals distinct aluminum-tolerance pathways in the al-accumulating species Hydrangea macrophylla and marker identification. PLoS ONE 2015, 10, e0144927. [Google Scholar] [CrossRef] [PubMed]
Figure 1. Non-metric multidimensional scaling (NMDS) plot of bacterial community distances (Bray-Curtis). Open symbols indicate PC site and closed symbols are RF. Circles (●) represent control, triangles (▲) represent NLL amendment, and squares (■) represent SBL. Depth is indicated by shade, lighter = deeper. Environmental vectors were fit using the envfit function in the vegan package. Only vectors with significant fit to the ordination (vegan, alpha = 0.05) and with significant effect on community structure (PERMANOVA, alpha = 0.05) are shown. Ordination stress = 0.09.
Soilsystems 02 00007 g001
Figure 2. Bacterial community beta diversity dispersions at each site (A,C) are PC soils; (B,D) are RF soils), according to treatment. Diversity by depth is reflected in (A,B) and diversity by treatment is reflected in (C,D). Diversity difference between sites is given in Figure 2E. Letters and asterisks indicate significant differences evaluated at alpha = 0.05.
Soilsystems 02 00007 g002
Figure 3. Relative abundance of bacterial families at the RF site, according to treatment and soil sampling depth. Only families with relative abundance > 0.02 are shown. Inner circles represent individual samples and the exploded circle represents the average relative abundance of families. Soil depth is indicated as 0–2, 4–6, and 8–10 cm. Soil amendment is either Control (no amendment), NLL (liquid lime emulsion), or SBL (sugar beet lime). Asterisks indicate significant differences in family relative abundance compared with the control (alpha = 0.05). , ☨☨, and ☨☨☨ indicates significant differences in family relative abundance across sampling depth (alpha = 0.05), before abundance based filtering.
Soilsystems 02 00007 g003
Figure 4. Relative abundance of bacterial families at the PC site. Only families with relative abundance > 0.02 are shown. Inner circles represent individual samples and the exploded circle represents the average relative abundance of families. Soil depth is indicated as 0–2, 4–6, and 8–10 cm. Soil amendment is either Control (no amendment), NLL (NuCal), or SBL (sugar beet lime). , ☨☨, and ☨☨☨ indicates significant differences in family relative abundance across sampling depth (alpha = 0.05), before abundance based filtering.
Soilsystems 02 00007 g004
Figure 5. Pearson’s correlation coefficients and variance explained of bacterial family relative abundance with environmental data. DTPA-Al is DTPA extractable aluminum and KCl-Al is KCl extractable aluminum. Significance was examined at alpha = 0.05 using R statistical software, data were filtered to only those with a variance explained (VE) > 0.6
Soilsystems 02 00007 g005
Figure 6. Pearson’s correlation coefficients and variance explained of multiple KEGG orthology terms regressed against environmental data. DTPA-Al is DTPA extractable aluminum and KCl-Al is KCl extractable aluminum. Significance was examined at alpha = 0.05 using R statistical software, data were filtered to only those with a variance explained (VE) > 0.6. (A) shows carbohydrate and energy metabolism; (B) shows lipid and glycan metabolism; and (C) shows amino acid metabolism.
Soilsystems 02 00007 g006
Figure 7. Pearson’s correlation coefficients and variance explained of multiple KEGG orthology terms regressed against environmental data. DTPA-Al is DTPA extractable aluminum and KCl-Al is KCl extractable aluminum. Significance was examined at alpha = 0.05 using R statistical software, data were filtered to only those with a variance explained (VE) > 0.6. (A) Shows terpenoids, polketides, and secondary (2°) metabolite metabolism; (B) cell motility, membrane transport, and translation.
Soilsystems 02 00007 g007
Table 1. Coefficients of determination (R2) among measured soil chemical variables. White cells represent positive correlations; gray cells represent negative correlations. Significance was evaluated at alpha = 0.05 using R statistical software and all correlations had a p-value < 0.05. Lime Req = lime requirement.
DepthKCl-AlTotal BasesLime ReqpH
KCl-Al0.34
Total Bases0.210.71
Lime Req0.580.410.52
pH0.570.520.640.96
DTPA-Al0.340.760.900.670.73
Table 2. Soil chemical mean values at each site by depth and liming treatment (abbreviated from Barth et al., 2018). DTPA-Al is DTPA extractable aluminum, and KCl-Al is KCl extractable aluminum, RF and PC indicate Rockford Farm and Palouse Conservation Farm Site, respectively. Control = no liming amendment, NLL = liquid lime (NuCal), and SBL = sugarbeet lime, Depth is sampling depth in cm. a–c indicates differences between depths within treatments, and x–z indicates differences between treatments in the same depth, alpha = 0.05.
Depth (cm)RF Soil pHRF DTPA-AlRF KCl-AlPC Soil pHPC DTPA-AlPC KCl-Al
mg kg−1mg kg−1 mg kg−1mg kg−1
Control
0–25.1 ± 0.04 (a, x)23 ± 3 (a, x)14 ± 5 (a, x)5.4 ± 0.3 (a, x)11 ± 2 (a, x)2 ± 2 (a, x)
4–64.4 ± 0.1 (b, x)40 ± 4 (a, x)132 ± 7 (a, x)4.9 ± 0.1 (b, x)19 ± 4 (a, x)34 ± 19 (a, x)
8–104.4 ± 0.2 (b, x)40 ± 4 (a, x)143 ± 6 (a, x)4.8 ± 0.2 (b, x)16 ± 5 (a, x)37 ± 24 (a, x)
NLL
0–26.2 ± 0.2 (a, y)9 ± 4 (a, y)1 ± 2 (a, x)6.7 ± 0.2 (a, y)2 ± 1 (a, y)1 ± 0 (a, x)
4–64.7 ± 0.1 (b, x)36 ± 4 (a, x)70 ± 15 (a, y)5.2 ± 0.1 (a, y)14 ± 3 (a, x)6 ± 6 (a, x)
8–104.4 ± 0.2 (c, x)36 ± 6 (a, x)127 ± 34 (a, x)4.9 ± 0.1 (a,x)17 ± 3 (a, x)30 ± 22 (a, x)
SBL
0–26.4 ± 0.2 (a, y)5 ± 2(a, y)3 ± 2 (a, x)6.7 ± 0.2 (a, y)1 ± 0 (a, y)1 ± 1 (a, x)
4–64.5 ± 0.2 (a, x)36 ± 3 (a, x)106 ± 43 (a, xy)5.3 ± 0.4 (a, y)13 ± 3 (a, x)6 ± 9 (a, x)
8–104.3 ± 0.1 (a, x)41 ± 1 (a, x)200 ± 31 (a, y)4.9 ± 0.2 (a, x)17 ± 3 (a, x)19 ± 19 (a, x)
Table 3. Bacterial community alpha diversity, Observed abundance and Shannon’s Index, for each site. RF and PC indicate, Rockford Farm and Palouse Conservation Farm Site, respectively. Control = no liming amendment, NLL = liquid lime (NuCal), and SBL = sugarbeet lime, Depth is sampling depth in cm. Letters (a and b) indicate significant differences between depths (alpha = 0.05).
Depth (cm)RF ObservedRF Shannon’s IndexPC ObservedPC Shannon’s Index
Control
0–22504 ± 64 (a)6.5 ± 0.1 (a)2607 ± 125 (a)6.6 ± 0.2 (a)
4–61915 ± 59 (b)5.5 ± 0.2 (b)2294 ± 265 (b)6.2 ± 0.2 (b)
8–101754 ± 49 (b)5.2 ± 0.2 (b)2139 ± 132 (b)5.9 ± 0.2 (b)
NLL
0–22726 ± 318 (a)6.6 ± 0.4 (a)2902 ± 240 (a)6.9 ± 0.1 (a)
4–61975 ± 135 (b)5.7 ± 0.2 (b)2362 ± 363 (b)6.1 ± 0.4 (b)
8–101956 ± 366 (b)5.6 ± 0.5 (b)2283 ± 262 (b)6.0 ± 0.2 (b)
SBL
0–22708 ± 169 (a)6.6 ± 0.2 (a)2631 ± 608 (a)6.0 ± 1.4 (a)
4–61823 ± 45 (b)5.5 ± 0.03 (b)2528 ± 353 (b)6.4 ± 0.5 (b)
8–101786 ± 122 (b)5.2 ± 0.3 (b)2194 ± 95 (b)5.9 ± 0.1 (b)

