Chemical and Biochemical Onslaught of Anthropogenic Airborne Species on the Heritage Monument of the Taj Mahal


1
Archaeological Survey of India (ASI), C.G.O. Complex, Salt Lake Sector1, Kolkata, West Bengal 700064, India
2
Nano Science and Synthetic Leaf Cell, Department of Chemistry, Industrial and Applied Chemistry, Ramakrishna Mission Vidyamandira, Belurmath, Howrah, West Bengal 711022, India
*
Author to whom correspondence should be addressed.
Heritage 2019, 2(3), 2137-2159; https://doi.org/10.3390/heritage2030129
Submission received: 18 June 2019
/
Revised: 21 July 2019
/
Accepted: 22 July 2019
/
Published: 24 July 2019
(This article belongs to the Section Architectural Heritage)
Abstract
:The science on the anthropogenic airborne aerosols impacting the World Heritage marble monument, the Taj Mahal, at Agra, has been studied in the light of modern physico-chemical approaches. The study is an effort to understand unrecognized airborne species which were found on the surface of the Taj Mahal monument. These species have been analyzed in the light of current analytical methods to impart characterization features and their possible impacts on the surface of the marble. Chemical constituents of these substrates, which were incorporated over the top surface of the monument, have been identified. Interestingly, the carbon particulates which were found on the micro level, popularly called “particulate matters”, have now been identified in the nano domain entity, which is chemically more reactive, and have been found on the surface of the monument. Because of their high chemical activity, these nano carbons have a newer chemistry in the presence of air and sunlight, generating several reactive oxygen species (ROS). These ROS are capable of responding to complicated chemical reactions on the surface of the marble in association with deposited cyanophyceae and other deposits of plant origin, causing rapid degradation. This study provides the nature of the onslaught of such monuments exposed under the prevalent smoggy environmental scenario.

1. Introduction
The world heritage monument, the Taj Mahal at Agra, in the Indian state of Uttar Pradesh, has always remained a favorite among tourists due to its grandeur and significance. The monument was built in the seventeenth century using Makrana marble, a type of marble found in Makrana marble mines in the adjoining state of Rajasthan. Although Agra has a few other notable monuments, like Akbar’s tomb at Sikandra(Agra), Fatehpur Sikri some 36 km away from Agra, Agra Fort, and Itmad-ud-Daula, the Taj Mahal, due to its immaculate beauty and charm, attracts a wider area of aesthetic concern. The environmental concerns with respect to the Taj Mahal came into being in 1974 by the setting up of an oil refinery at Mathura some 50-odd km from Agra. The Government of India attributed an area between Agra and Mathura as an air pollution protected area. Therefore, a notified area called the Taj Trapezium Zone (TTZ) came into being. In 1999, the Ministry of Environment and Forests, Government of India, notified this area, the TTZ, an authority for the protection and improvement of the environment of this zone. Many countries have experienced a progressive degradation in air quality as a consequence of rapid unplanned development over the last three decades [1]. In the cities of developing countries, the environmental problems are much greater because of the overwhelming scale and speed of unplanned urbanization [2].
Agra is connected with Delhi and Jaipur by National Highways, viz. NH-2, 3, and 11. It is also well connected with other major cities by rail, road networks, and air. Recently, Yamuna Expressway linked to Agra Inner Ring Road Expressway that can be used to directly reach the Taj Mahal has been introduced, resulting in direct heavy traffic flow near this monument.
Dust fall is a measure of all air pollutants containing smoke, soot, or other potentially active particles that settle, with or without the rain, due to their own weight. It can be considered as a total depositional profile in a particular study area. Dust fall, through a simple non-specific test method, can be very useful in the study of long-term trends as the actual input of organic, inorganic, and biological inputs. Dust fall can be scientifically studied byway of its soluble and insoluble fractions. Therefore, water and air dispersed materials can separately be determined from the floating aerosol.
In aerosol science, it is generally believed that particles with an aerodynamic diameter >50 µm do not usually remain airborne very long as they have a terminal velocity >7 cm/second. Dust particles are mostly found with dimensions around <1 µm and for these, settling due to gravity is negligible for practical purposes. In this regard, it can be considered that dusts are made up of solid particles with a size range from below 1 µm to nearly 100 µm. These can become airborne, depending on their physical characteristics, ambient conditions, and origin. Mineral dust has free crystalline silica as quartz, coal, metallic dusts like lead, cadmium, nickel, etc. Other chemical dusts such as bulk chemicals, pesticides, and bio hazards like potential viable particles such as molds and spores are spontaneously grown under such ambient conditions. Airborne dusts are particle-based species, and are mostly considered as Particulate Matter (PM), composed of solid particles and liquid droplets that can float in the air. Dust phenomena occur due to construction, mining, changes in agricultural patterns, industrial activities, and wind transport through continuous soil erosions. Dust particles can be composed of different mineral profiles. Mineral profiles affect their physical and chemical properties. An understanding of the chemical nature of the dust requires determination of the soil mineral profile since soils become airborne by the action of wind.
Buildings are subjected to the impact of micro flora like cyanobacteria (blue-green algae) and chlorophyta (green algae), which can be considered as basic inhabitants in the colonization of stones. Due to the photoautotrophic nature of cellular metabolism, these microorganisms grow on stone surfaces and form colored patinas and incrustations. These organisms form a body in which airborne pollutants, particulates, and organisms get entrapped in the form of a potentially live area, which can be referred to as a bio film. Such bio films are found around adjacent areas affected by rainfall. The main inhabitants found in the bio films are the blue-green algae (cyanophyceae).
2. Addressable Problems
There is a pressing concern about the yellowing and soiling of the Taj Mahal, voiced by many national and international forums, where respective views on the sustainability of the monument and its environment have been expressed. A detailed study has pointed out the air quality issues [3]. Studies have also been made on the possible impact of sulfur oxide and associated atmospheric depositions [4], along with the possible impact of dust pollution [5].
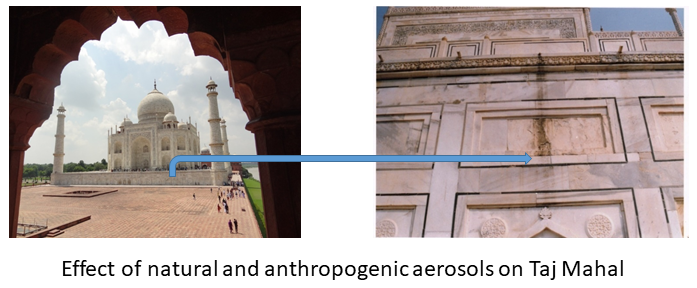
Apart from these foci, studies on the effect of dry deposition on foliage surfaces at Agra [6], on the rates of dry deposition of sulfur on natural surfaces (marble), and on the dry deposition velocity of particulate sulfate on marble have been calculated [7], and the nature of the water-soluble fraction of aerosols at Agra, the associations of the aerosols, and the ionic balances have also been studied [8]. In a recent work, it was highlighted that black carbon, brown carbon, and airborne dust, which were the result of biomass combustion, trash/refuse burning, and mobile sources, were responsible for the discoloration of the Taj Mahal(Figure 1) monument [9].
The scientific concerns and conservation issues of the Taj Mahal were first provided in 1997 by the ICCROM-UNESCO Report [10] of the mission to Agra, Satdhara, and Sanchi by M.L.Tabasso. However, the steady and systematic approaches that can be used to conserve such monuments have been suggested since 1987 [4,5,6,7,8,9,10,11]. These reports provided prevalent knowledge-based study on the interdisciplinary approach to the aspects of conservation of the Taj Mahal monument. The reports pointed to the presence of pigeons and bees with hives, which cause conservation problems. The major conservation problem of the Taj marble is stated to be due to the frequent appearance of fractures and sporadic exfoliation layers. These studies also address the color of the monument as a concern for specialists. The general public and the newspapers have occasionally raised the alarm that the monument is turning grey or yellow due to air pollution or a lack of maintenance. In this regard, it has also been mentioned that the human eye, though sensitive, has a very poor memory of colors, and slight variations could hardly be demonstrated unless objective data were available. Last but not least ,such reports have said that a major conservation issue has been the presence of blue-green algae, which grows on different parts of the monument.
The literature on the international scenario is well-equipped with research on air quality data; air quality trends; findings on the acidic gases; and monitoring of the concentrations of daily, monthly, and yearly study trends on the concepts of acidic gas inputs and their possible effects on the stone surfaces. In India, such air trend yearly data can be witnessed in the national air quality studies conducted through the Central Pollution Control Board, which is the main nodal agency under the Ministry of Environment and Forests, Government of India. However, no reports on the study of the effect of aerosols on the monument surfaces in India from such agencies are available.
To provide a concise, research data-based, pragmatic understanding of the overall impact of atmospheric species on the Taj Mahal monument, a couple of studies were recently reported [9,11]. These studies pointed out that the pollution load on the Taj Mahal monument could be from natural as well as anthropogenic inputs.
The external surface of any building in urban polluted environments is inevitably destined to be covered with gray or black layers generally called black crusts [12](Figure 2). Sulfur dioxide and nitrogen oxides are the most harmful air pollutants for stone materials and they are also the major source of soluble salts, sulfates, and nitrates [13].
Other deteriorating agents like the solar input, relative humidity, and wind conditions also affect the dispersion and dilution of pollutants within a given area. The intensity and rate of weathering depend upon the stone, the surface area, and the levels of atmospheric pollutants, the orientation of the building, acid rain, and rainfall [14].
The Agra Environment Management Plan [3] stated that actions taken for the protection of the TTZ were targeted for protecting the structure of the Taj Mahal and not Agra city or the TTZ. Such actions taken for protection were mainly focused on repairing or maintaining the Taj Mahal structure and controlling the pollution through closing down industries. The report also emphasized that there is a need for a scientific study and innovative approach to achieve the desired results. Earlier in the ICCROM-UNESCO report of 1997, [10] pointed to the conservation cum environmental concerns in relation to the Taj Mahal monument. Therefore, there is a need to study, quantify, and assess the actual environmental cum chemical species interacting in this complex scenario. This study has attempted to qualitatively ascertain the atmospheric and associated environmental inputs acting upon the area of the monument.
With such thought, first, this paper will focus on significant environmental inputs in the vicinity of the monument to visualize the possible chemical imprints acting upon the area. The important issues related to these inputs are governed by the local climate, and demographic and social profile, which affect the economic-based environmental issues related to the problems encountered in conservation of the monument.
Local Climate: Agra has a continental type of climate. It has three distinct seasons: summer, monsoon, and winter. The monsoon season is from July to September, winter season is from November to February, and summer months are from April to June. The temperature ranges from 26 °C to 39 °C during the monsoon, from 27 °C to 47 °C during the summer, and between 2 °Cand15 °C during the winter. The relative humidity ranges from 60% to 90%during the winter, 60% to 95% during the monsoon, and 30%to 60% during the summer. The summers are characterized by high daytime temperatures ranging between 23 °Cand44 °C and low humidity of 25%–40%. The wind direction witnessed in the city is from North to West (prevailing wind) and South and Southeast (monsoon wind) [15].
Socio-demographic profile: Agra has a total population of about 1400,000 and the population density is about 19.593 per sq. km [13]. The population density is 897 persons per sq. km compared to the national Indian average of 324persons per sq. km. This data shows an immensely overcrowded city. The average literacy rate in Agra is 70%. The population is composed of55% males and 45% females, while the work population rate is only 27%. Vulnerability assessments of the city conducted by various agencies like OXFAM, the State Urban Development Authority, and Agra Municipal Corporation have estimated that around 50% of residents live in slums [16], while another study revealed that the slums are home to around 40% of the population [3]. The urban area of Agra is divided into Nagar Mahapalika (local administrative civic body for the city), Agra Cantonment Area, and the Dayalbagh and Swamibagh Panchayats (Panchayats are local civic administrative bodies). The municipal area has been divided into three main divisions, viz. the main city, Tajganj, and the Trans Yamuna Area. The municipal area has 90 wards. The jurisdiction of the Agra urban area is under the Agra Development Authority (ADA).
Economic-based environmental issues: The economy of Agra is based on small and scattered industries, trade, commerce, and tourism. Domestic, medium, and small industries exist as a tradition. On a daily basis, the Taj Mahal is visited by 8–10 thousand tourists, of whom 54% are foreign nationals. There are 12 major- and medium-scale industries and 7200 small-scale units inAgra in various goods, like pipes, cast iron fittings and allied fabrication goods, electrical items, leatherwear, and shoes. The city has 150 foundry units that produce cast iron pipe fittings, motor and tractor parts, weights and measures, diesel engines, pumping sets, generators, agricultural equipment, etc. The small-scale industries are comprised of textiles, cotton, wood paper products, leather goods, metal products, electroplating units, auto and engine parts, etc. The handicraft industry is composed of zari and zardozi, (zari and zardozi are traditional medieval handicraft clothing in which some precious metal is embroidered on the clothes, marble and stone carving inlay works, and in carpet units). About 116 of these are exporting units. Agra has several notified industries; the majority of these are foundries in which the principal source of emission is the cupola. The fuels used in these industries are coal; coke; and HSD, LPG, and furnace oil. The most commonly used are hard coke, steam coal, wood, and fuel oil.
The volume of effluent gases discharged depends upon the cupola, melting temperature regimes, operation durations, nature of the charged material, and the coke used. Gases are released during hot metal drawing and during casting. Agra is also famous for Petha (a type of local and traditional sweet), which is produced locally and consumes enormous thermal energy supplied by primitive methods like fire wood, at the cost of depleting local forestry and coal burning. The total air pollution in the city from domestic activity, industrial activity, Petha units (sweets industry), vehicular source inputs, and diesel generators (D.G. sets) is about 51 t/day [3,17]. Along with these, the Mathura refinery, Firozabad glass industries, and brick kiln factories are also situated within 40km from Agra [18]. People in slums use firewood, coal, and cow-dung, and the average consumption is 200–300kg/capita/year. Daily use of burning cow dung is around 4 hours/day.
Vehicles contribute a major source of air pollution. The total number of vehicles has grown at a tremendous rate of 57.7% during 1994 to 2000 and the numbers have increased each year. The vehicular pollution load in Agra city is around 15.6 t/day.
Diesel Generator (DG) sets also contribute to the pollution input, as the diesel used for running the DG sets emits a considerable amount of airborne effluents. Many of these diesel powered engines are also used in lighting shops during power cuts and for short-distance transport in three wheelers, adulterated diesel is employed, with kerosene emitting voluminous un-burnt fuel as smoke.
Natural sources also contribute to the pollution scenario as the soil of Agra consists of loose alluvium, which thus becomes airborne easily. A considerable amount of windblown dust covers the city during the summer months. Dust is the major contributor of particulates in the summer from April to June, during which period dust storms with high crustal loads and high wind speeds occur. Such dusty masses also remain suspended during summers in the atmosphere as hazes. The Suspended Particulate Matter (SPM) shows very high values and more so on days which witness dust storm episodes. Additional air pollution that has not been recognized till now is the contribution from the black particulate matters under nano dimension trapped in floating aerosol originating from the neighboring states.
A troubling aspect recently seen is related to the solid waste management in the city, which is extremely poor. There is no method utilized to collect the garbage under the classification of biodegradable and non-degradable approaches. Total solid waste is perhaps in the magnitude of 450 t/day. There has now been a new unscientific practice introduced by the civic body to burn accumulated city garbage at the city dump sites as a rapid measure to clear it, which in turn releases enormous un-burnt solid particulates with obnoxious gases into the local environment.
3. Sampling/Materials and Methods
Interest in the study of aerosol phenomena worldwide is justified by high particle emissions from natural and anthropogenic sources, high concentrations of gaseous precursors, relative humidity, weather conditions that favor the stagnation of pollutants, low precipitation rates, and water vapor in the atmosphere. Aerosols also have an impact on the weathering of historical buildings. The pollutants are transferred by two mechanisms: dry deposition and wet deposition. The external surfaces of a building with an atmospheric effect of pollution evidence black, brown, or grey crusts and black scab-like areas, depending on the deposition of the particles, rainfall, and transformation within the crusts.
The geographical area situated in a continental type of climate witnesses a temperature regime which radiates between 1 °C in winters to around 47 °C in intense summers within a year at Agra. Therefore, the monument falls in a temperature range in which a yearly thermal difference pattern influences geological processes conducive to surface weathering. Micro crust pieces peel and fall off from places such as water spouts or areas of water passage naturally due to natural weathering phenomena. Dust is a natural phenomenon and is measured on a monthly basis as a standard measurement procedure called dust fall, and secondly as dust collected on a daily fixed cycled monitoring operation system to measure Suspended Particulate Matter (SPM) from high volume samplers. The particle mode used for dust characterization was the coarse mode. The algal-bacterial input into the dust fall, i.e., algal sample, has been taken from dust fall samples. Soluble organic components of the aerosols have been determined from the water-soluble portions from the standard glass fiber filter papers used in high volume sampling operations. Marble crust samples and fresh marble used in conservation have been examined along with marble samples with algal growth. Dust has also been characterized based on seasonal conditions. The composite dust represents the airborne input of the annual dust profile.
To study the effect of weathering and the chemical nature of these diverse pollutants, samples like blue-green algae, airborne dust, soluble dust from dust fall, seasonal dust, and water-soluble portions of aerosols were analyzed. There are zones near the water spouts, places protected from direct rainfall, niches, and areas where water accumulation had taken place. From these zones, crust pieces, due to weathered geological surfaces, give way due to various geological and atmospheric stress factors and such small pieces have been used as treasure for analyses.
Algal samples have taken from monthly dust fall, airborne dust from high volume samplers, natural peeled off pieces from the monument as crust pieces, water-soluble fractions from dust fall, and water-soluble fractions of seasonal organic aerosols have been extracted from the glass fiber filter papers. Dust samples have been taken from high volume samplers representing major seasons, as well as a composite dust profile, which contains the features of the annual dust load.
Sample Preparation
A black crust that was separated from the monument under chemical and biological weathering conditions has been identified as the best sample to work with. To search for the identity of any nano domain carbon, a part of this was washed with warm nitric acid, the residue was then leached with dilute sodium hydroxide, and the filtrate was acidified with hydrochloric acid and vacuum evaporated to dryness. Such treatment removes other contaminants, including large carbon particulates, to separate nano carbon. The black residue was washed with cold water thrice to remove any sodium chloride and was then subjected to transmission electron microscopy (TEM) analysis.
For mineralogical analysis, the samples were analyzed by a Seifert model Debye flex X-ray Diffractometer, with CrKα radiation and running conditions of 30mA, 40kV, and a scan speed of 3.0◦/min. Samples were analyzed within a range of 0–90°. XRD plots were further refined by Bruker AXS Software. IR analysis was carried out by an FTIR Bruker Spectrophotometer (Vector 22 Model) working between 4000 and 400cm−1 using a KBr disc. For elemental analysis coupled with morphological and topographical analyses, samples were subjected to anFEI Quanta 200 model computer-controlled scanning electron microscopy cum energy dispersive spectroscopy (SEM-EDS) system. Transmission electron microscopy (TEM) images were taken using the FEI TECHNAI-T-20 machine operated at the voltage of 200 kV.
4. Results and Discussion
X-ray data of the summer, winter, and a composite mixture with the PDF card number and mineral component is shown in Table 1, Table 2, and Table 3, respectively.
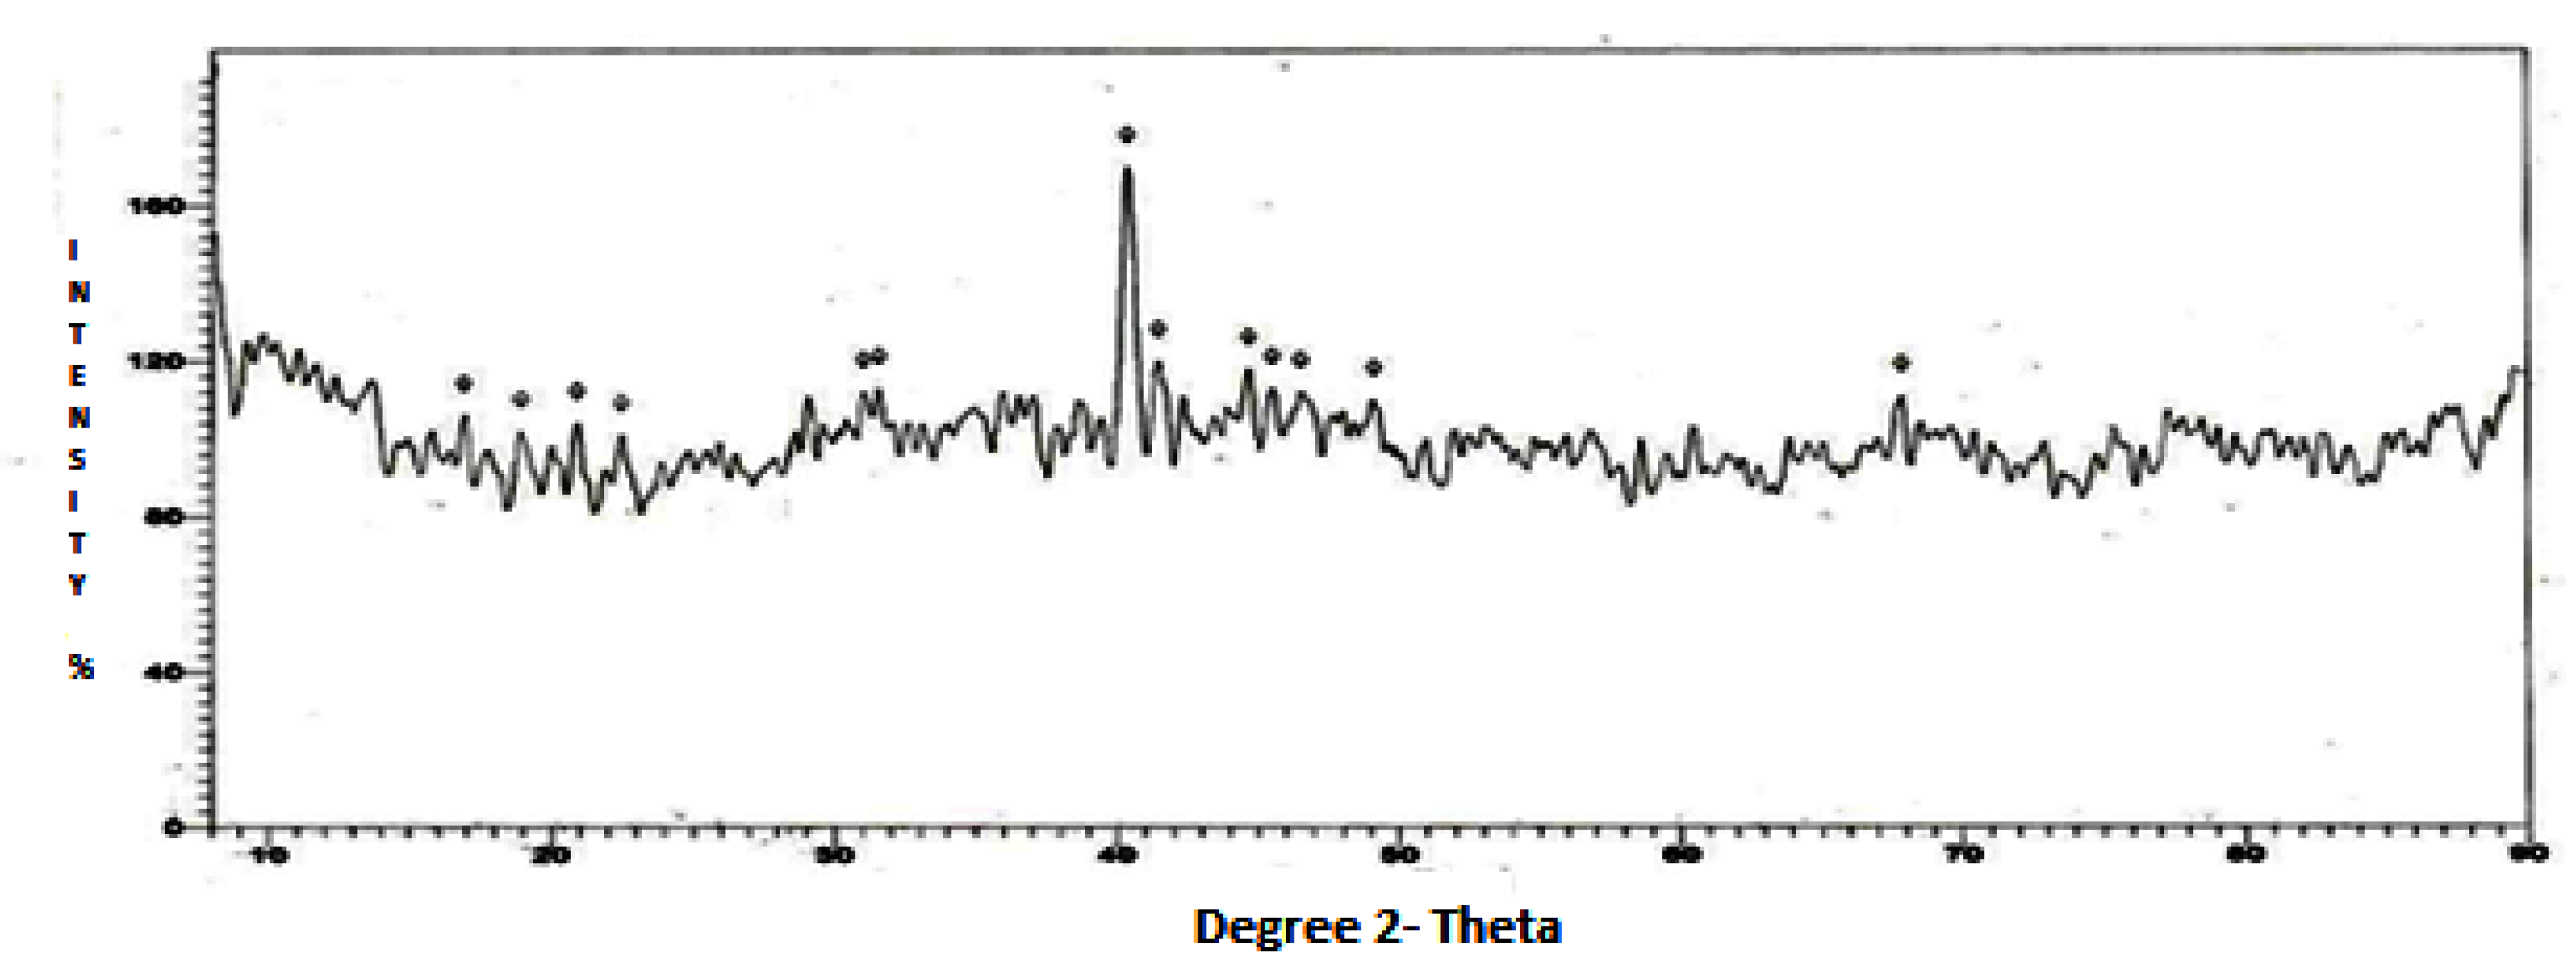
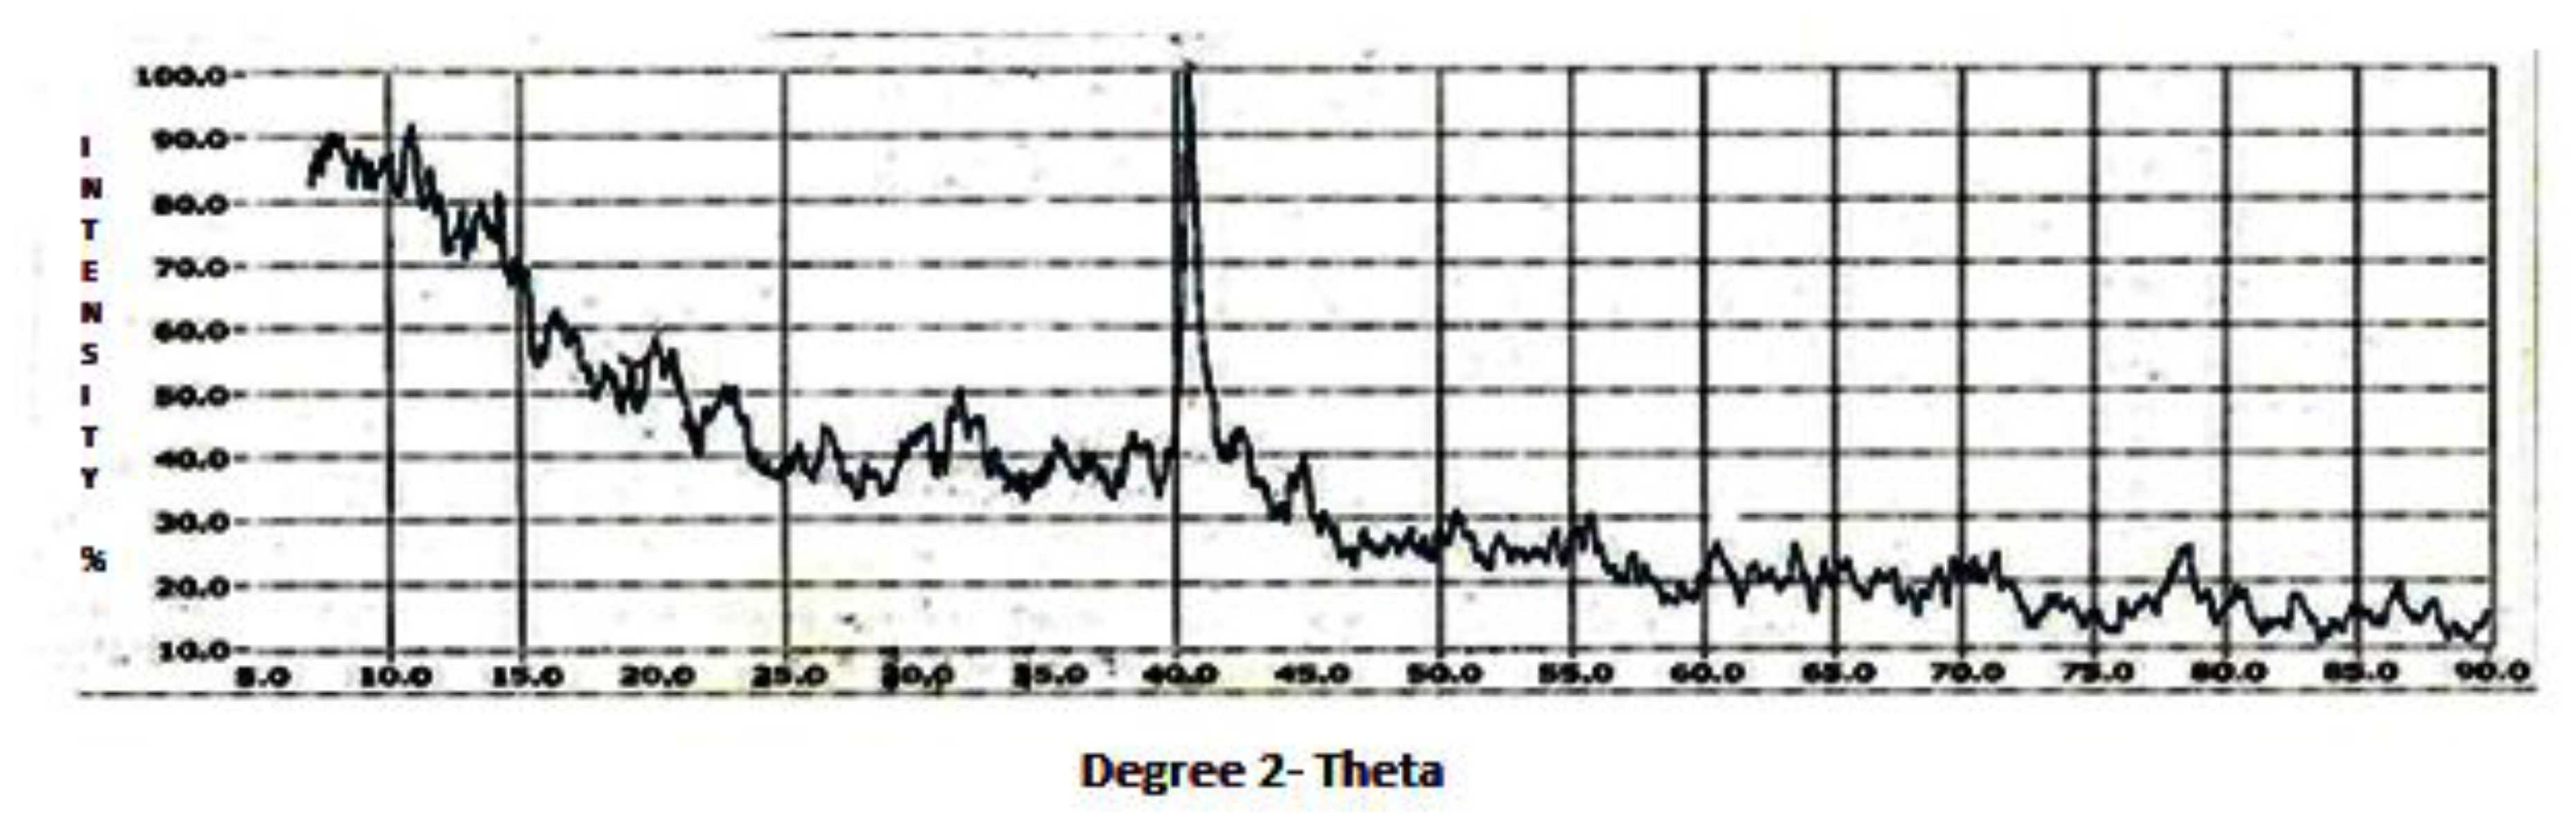
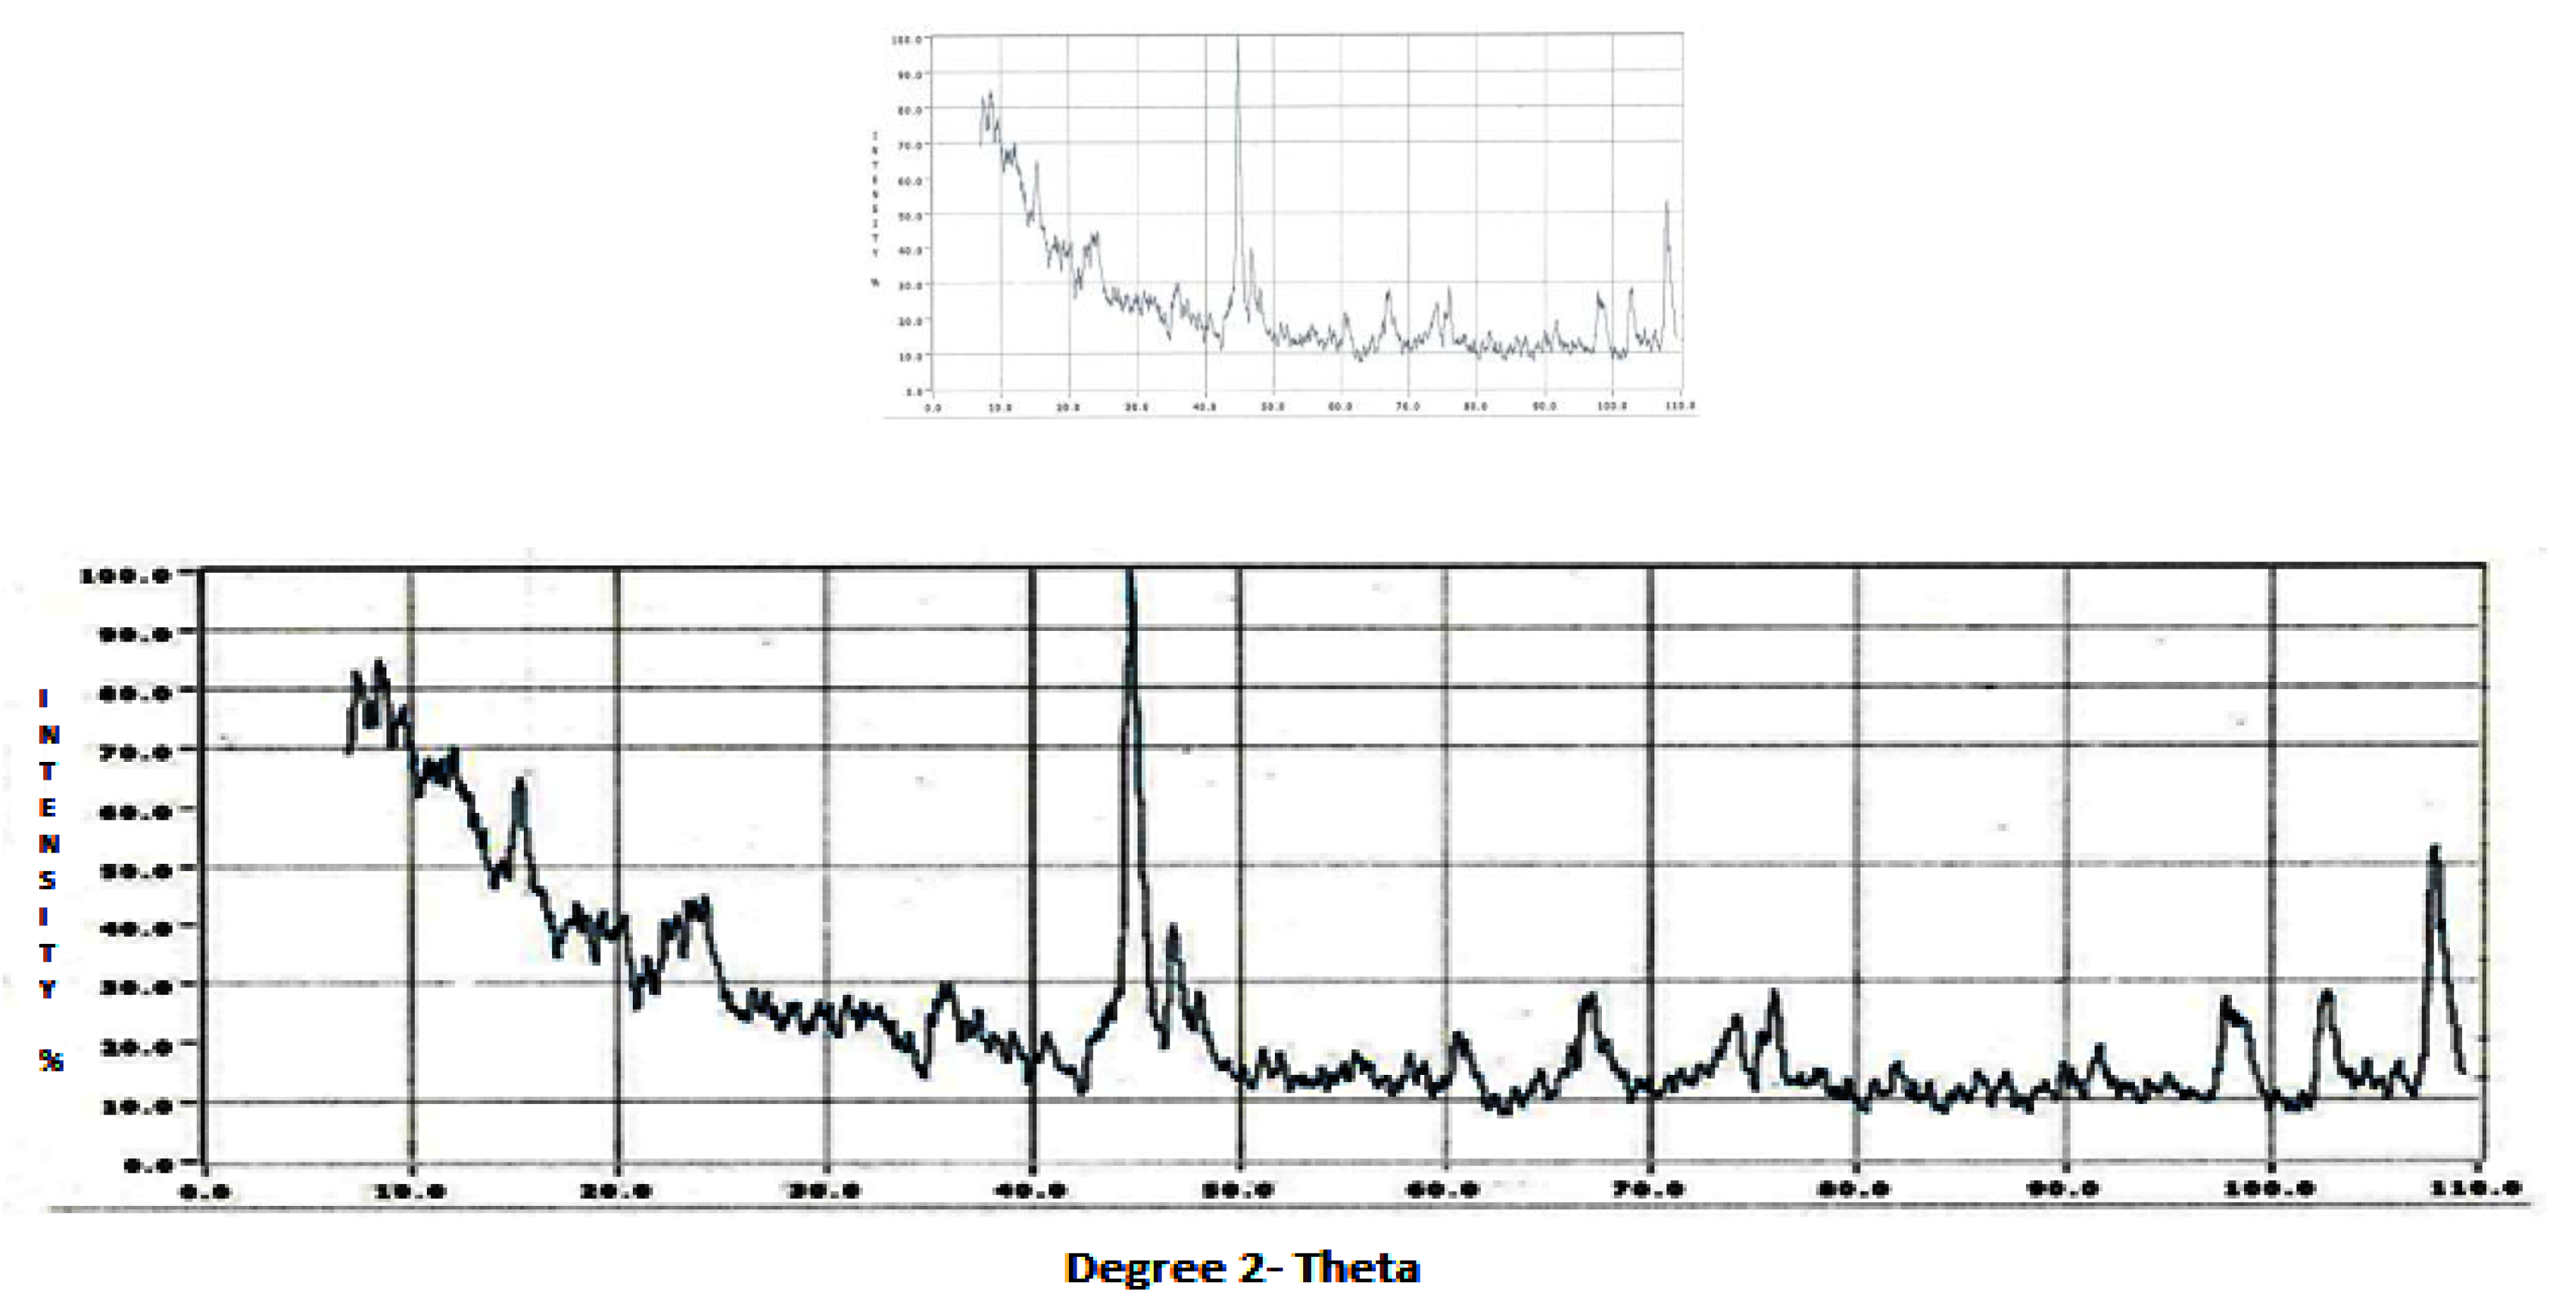
The XRD data revealed the soil oriented profile of the summer (Figure 3), winter dusts (Figure 4) and of composite (Figure 5). Composite dust represents the annual dust. Quartz is the main mineral, followed by illite, chlorite, montmorillonite, kaolinite, calcite, magnetite, hematite, and mixed-layer silicates. Feldspars are represented by plagioclase, microcline, and albite. The profiles of X-ray reflections are as per the standard Joint Committee on Powder Diffraction Standards (JCPDS) [19].
According to the JCPDS [19], in XRD patterns, one can observe the major and lesser reflections of minerals. Among the major XRD reflections according to the JCPDS standard patterns, quartz gives reflections at 3.34, 4.23, 1.8, 1.54, and 2.45Å. Subsequently, the mixed layer clay minerals give reflections at 12 Å;illite gives reflections at 10, 4.48, 3.33, 2.61, and 1.53 Å; kaolinite gives reflections at 7.17, 3.57, 1.62, 1.48, and 4.36 Å; chlorite gives reflections at 7.07, 14.1, 3.54, 4.72, and 2.84 Å; orthoclase (alkali feldspar) gives reflections at 3.31, 3.77, 4.22, 3.24, and 3.29 Å; albite (plagioclase feldspar) gives reflections at 3.19, 3.78, 6.39, 3.68, and 4.03 Å; calcite gives reflections at 3.03, 2.28, 2.09, 1.01, and 1.87Å; hematite gives reflections at 2.69, 1.69, 2.51, 1.83, and 1.48Å; magnetite gives reflections at 2.53 and 2.42 Å; and montmorillonite gives reflections at 15, 4.0, 5.01, 3.02, and 1.5 A°(Figure 3, Figure 4 and Figure 5). Themineralogical results are based on major and lesser reflections.
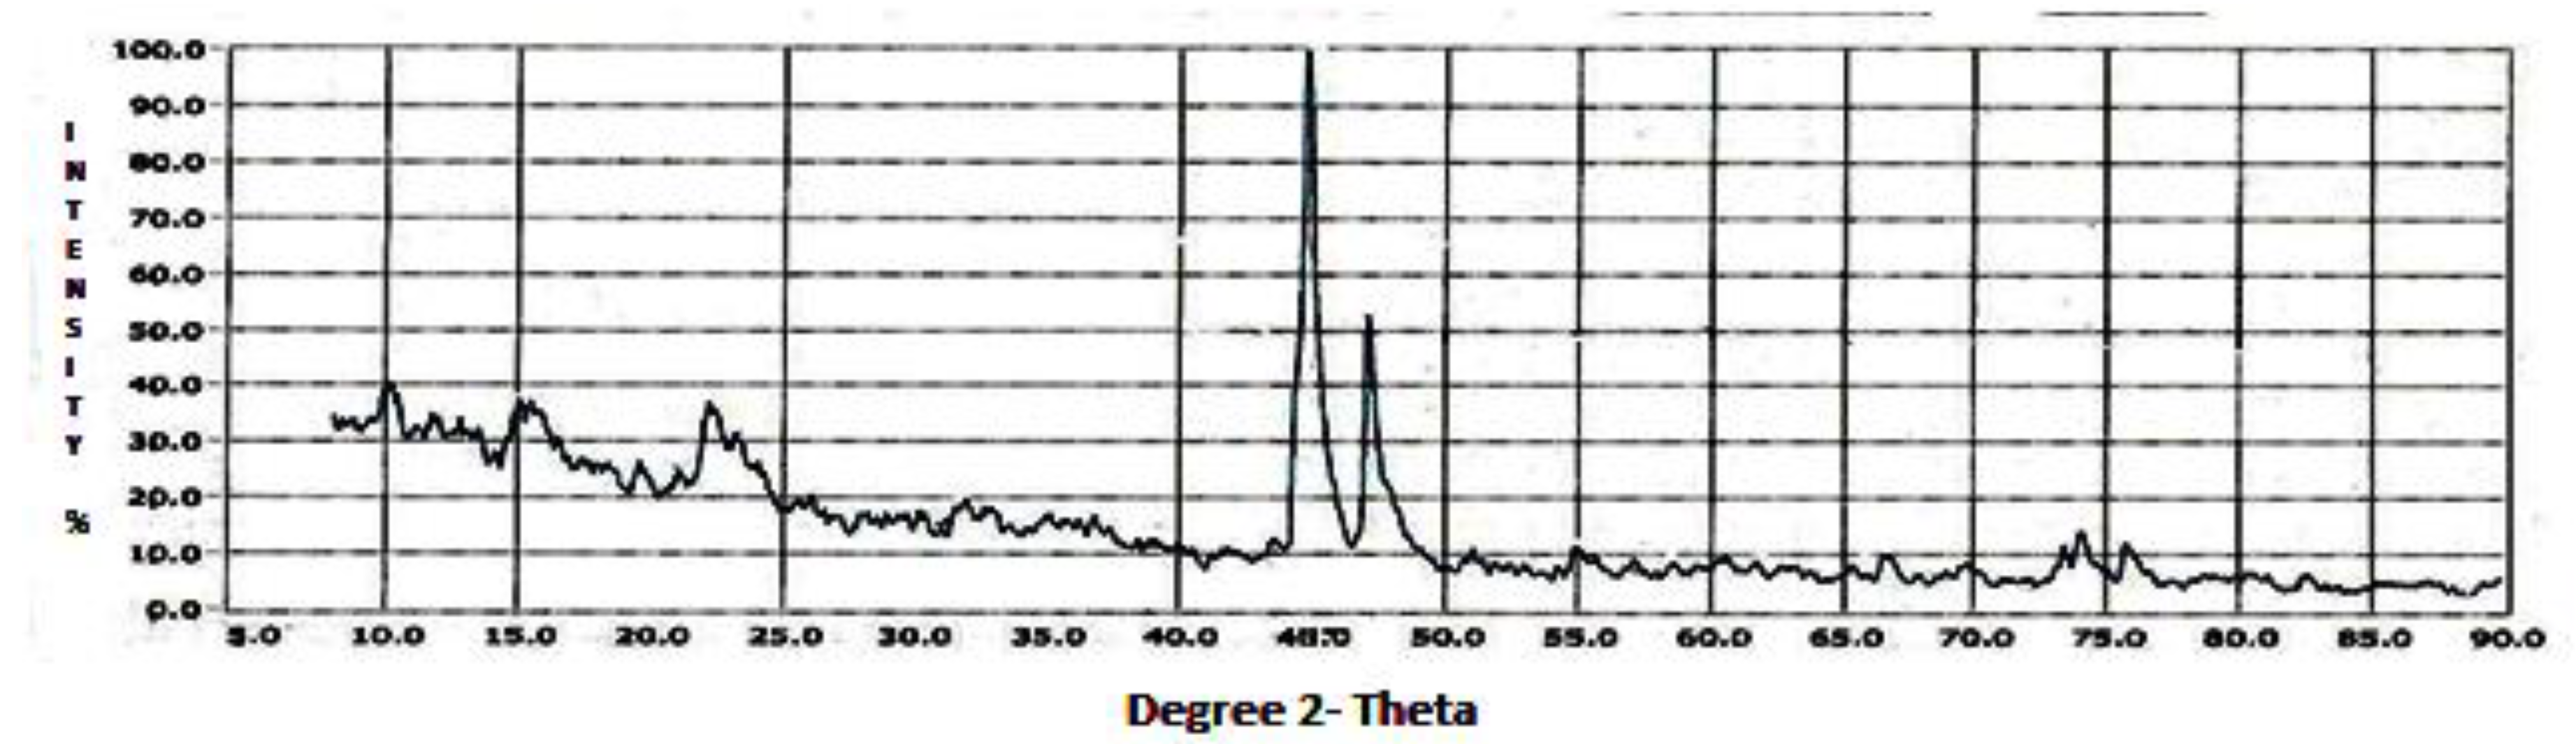
The XRD results of the marble black crust gave the effect of water percolation on the marble matrix, impact of cyanobacteria, and impact of soil-oriented minerals. With the joint action of water, cyanobacteria, and soil minerals on the marble, the weathering effects could be assessed. Calcium oxalate hydrate could be the result of the action of oxalic acid secreted by the cyanobacteria. Ankerite formation may be due to the action of iron oxides on the marble, while calcium carbonate hydrate may have been formed by the action of water. The impact of airborne dust on the marble black crust could be seen by the presence of illite, kaolinite, and hematite. Hematite may be from the soil or from anthropogenic sources. The IR spectra of marble black crust gave similar results. The spectral features showed the presence of calcite and soil minerals on the marble viz. montmorillonite, kaolinite, hematite, quartz, and organic carbon.
The airborne dust profiles of the composite, summer, and winter showed the input of crustal minerals into the dust. The airborne dust incorporated coarse and fine aerosols. Composite dust or the annual profile of the dust showed a wide range of minerals. Under soil mineralogical considerations, the dust represented the minerals of the local soil. The airborne dust gave a soil-oriented profile which becameairborne with the action of wind and meteorological phenomena. Among the minerals, calcite, quartz, and feldspars can be considered in the coarse particle mode [20].
Other minerals like kaolinite, montmorillonite, and illite can be considered in the intermediate particle mode, while magnetite and hematite can be considered in the fine particulate mode. The composite dust representing the annual dust gave a broad signature of the airborne minerals. The magnetic mineral magnetite was present in the composite (annual) dust profile. Apart from these, the other minerals were similar in the summer and winter seasons, depicting that identical minerals were present within the area. Since the nature of the dust represents the parent material, which is the soil, the dust showed that the dust was illitic as the soil material was illitic, corresponding to an earlier study on the soils of the geographical region of Agra [21].
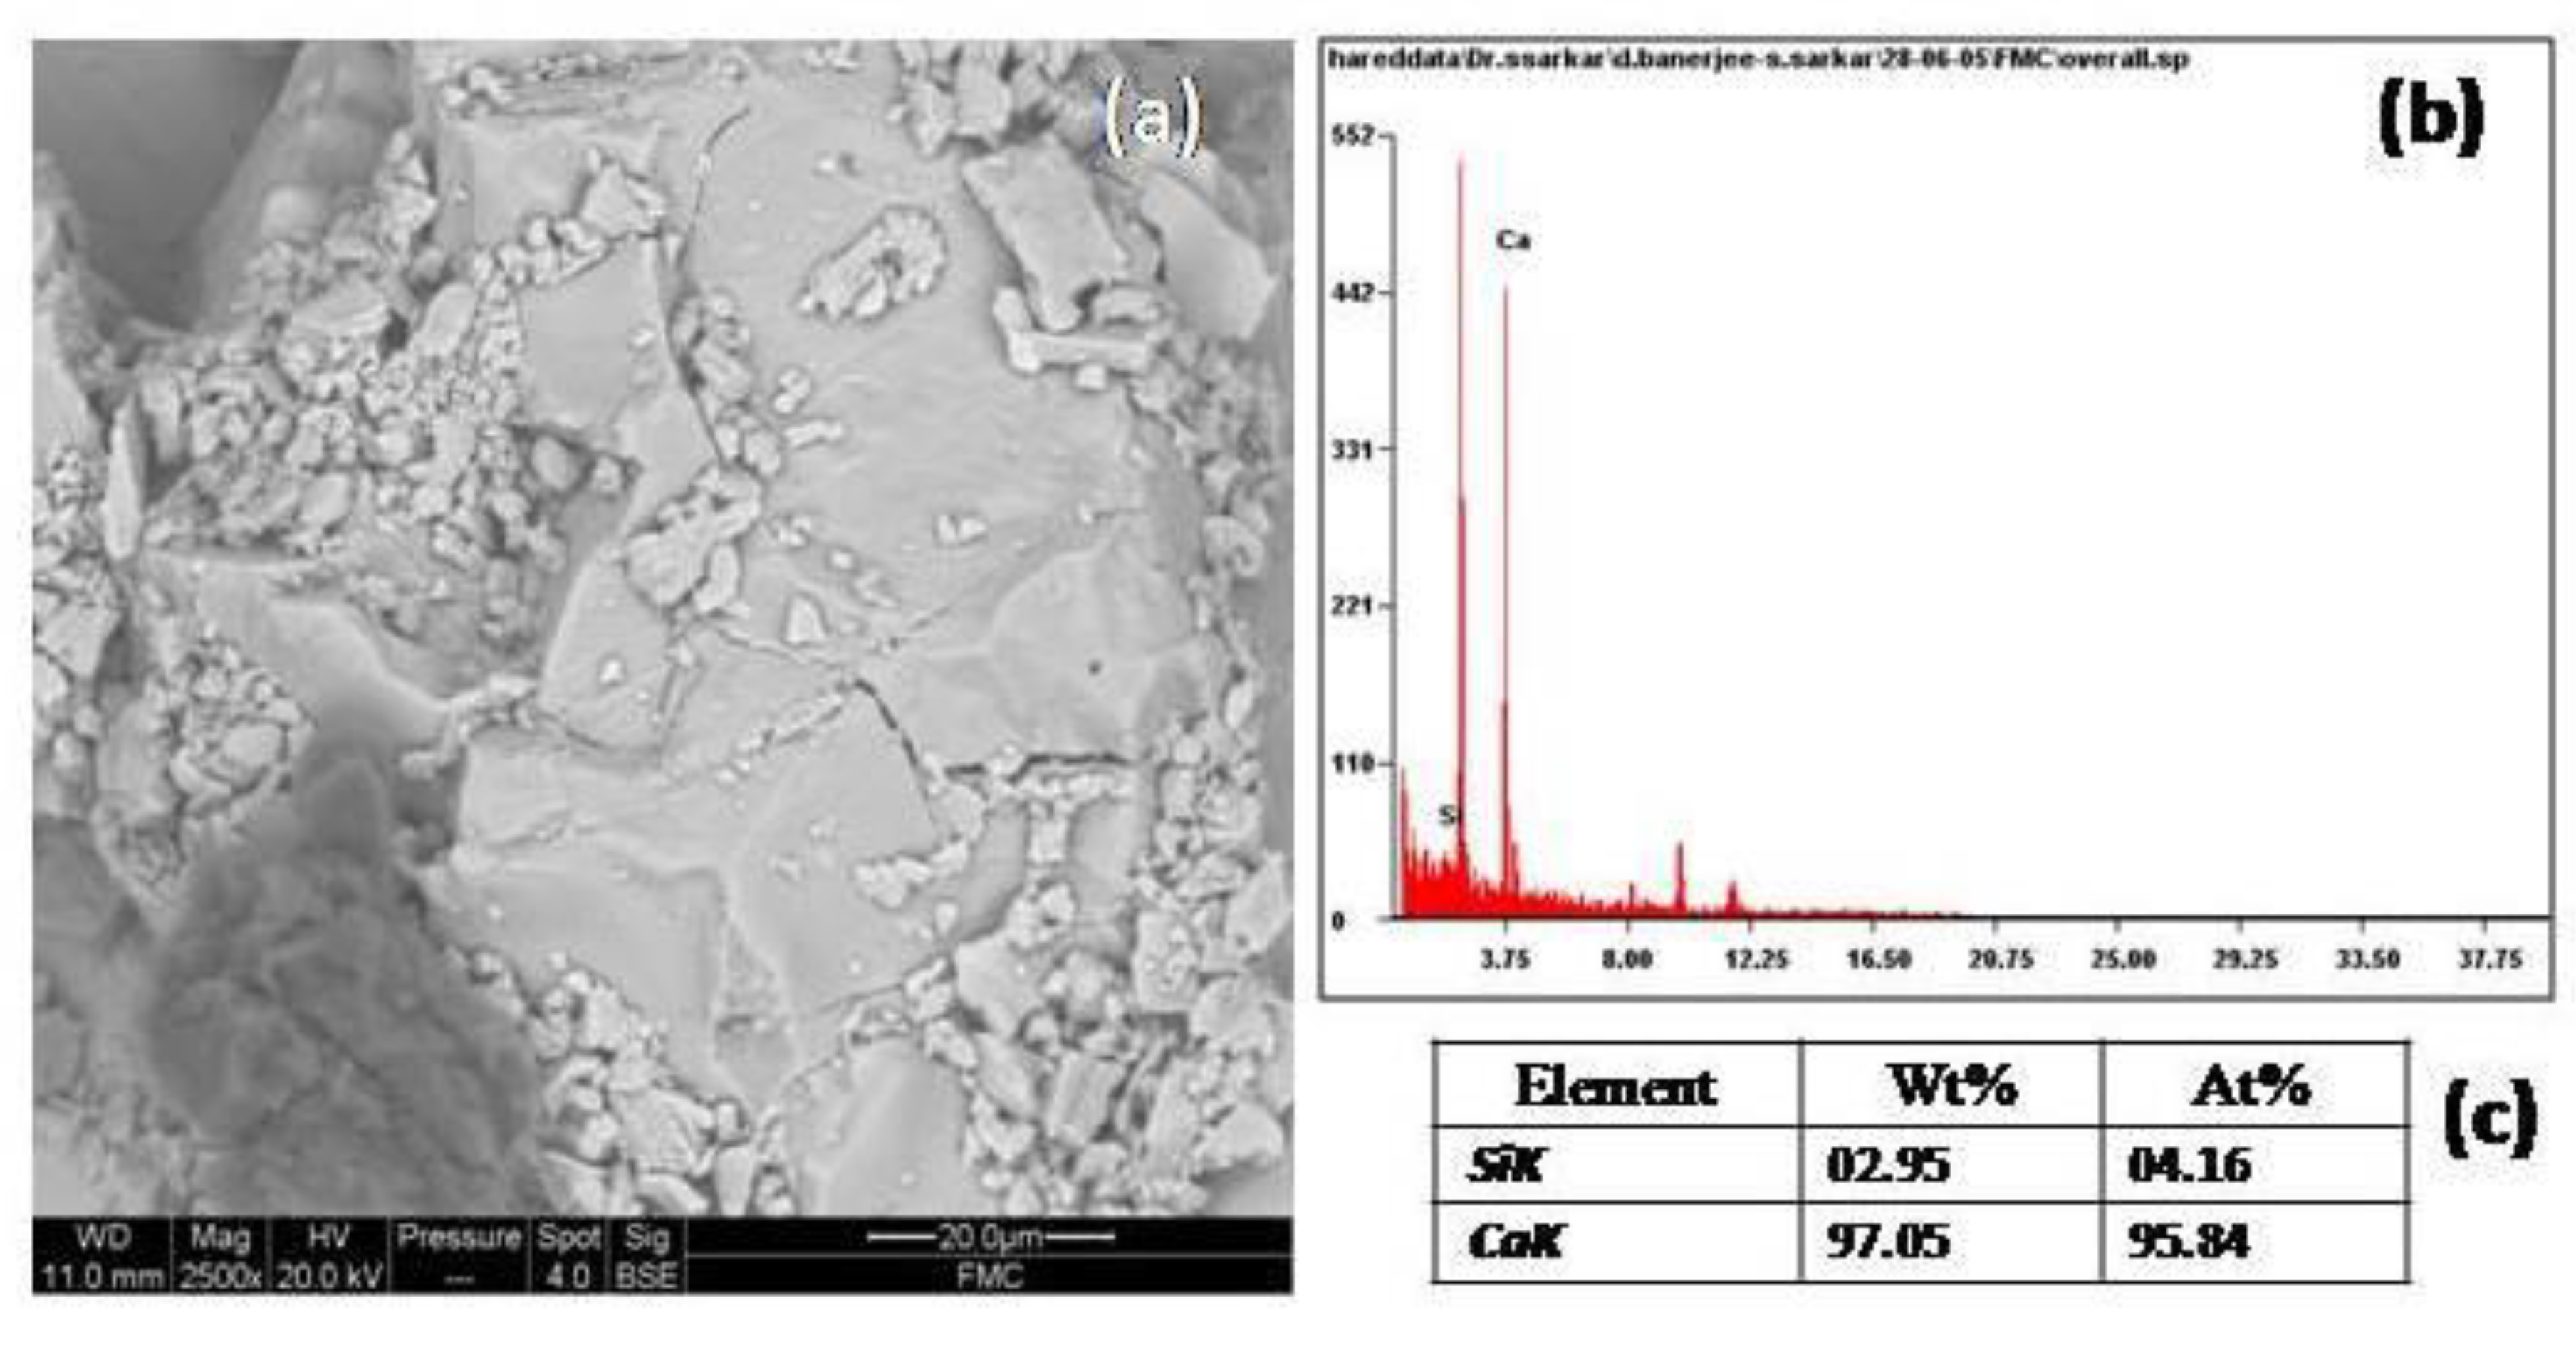
4.1. Marble Characterization (Table 4)
4.1.1. Fresh Marble (Figure 6)
The fresh marble used in conservation showed all reflections of the calcite mineral. Calcite mineral showed a typical marble texture with distinct mineral patterns. The matrix showed an area with high crystalline features characteristic of perfect crystallographic lattices. The interfaces within the marble matrix were coherent.
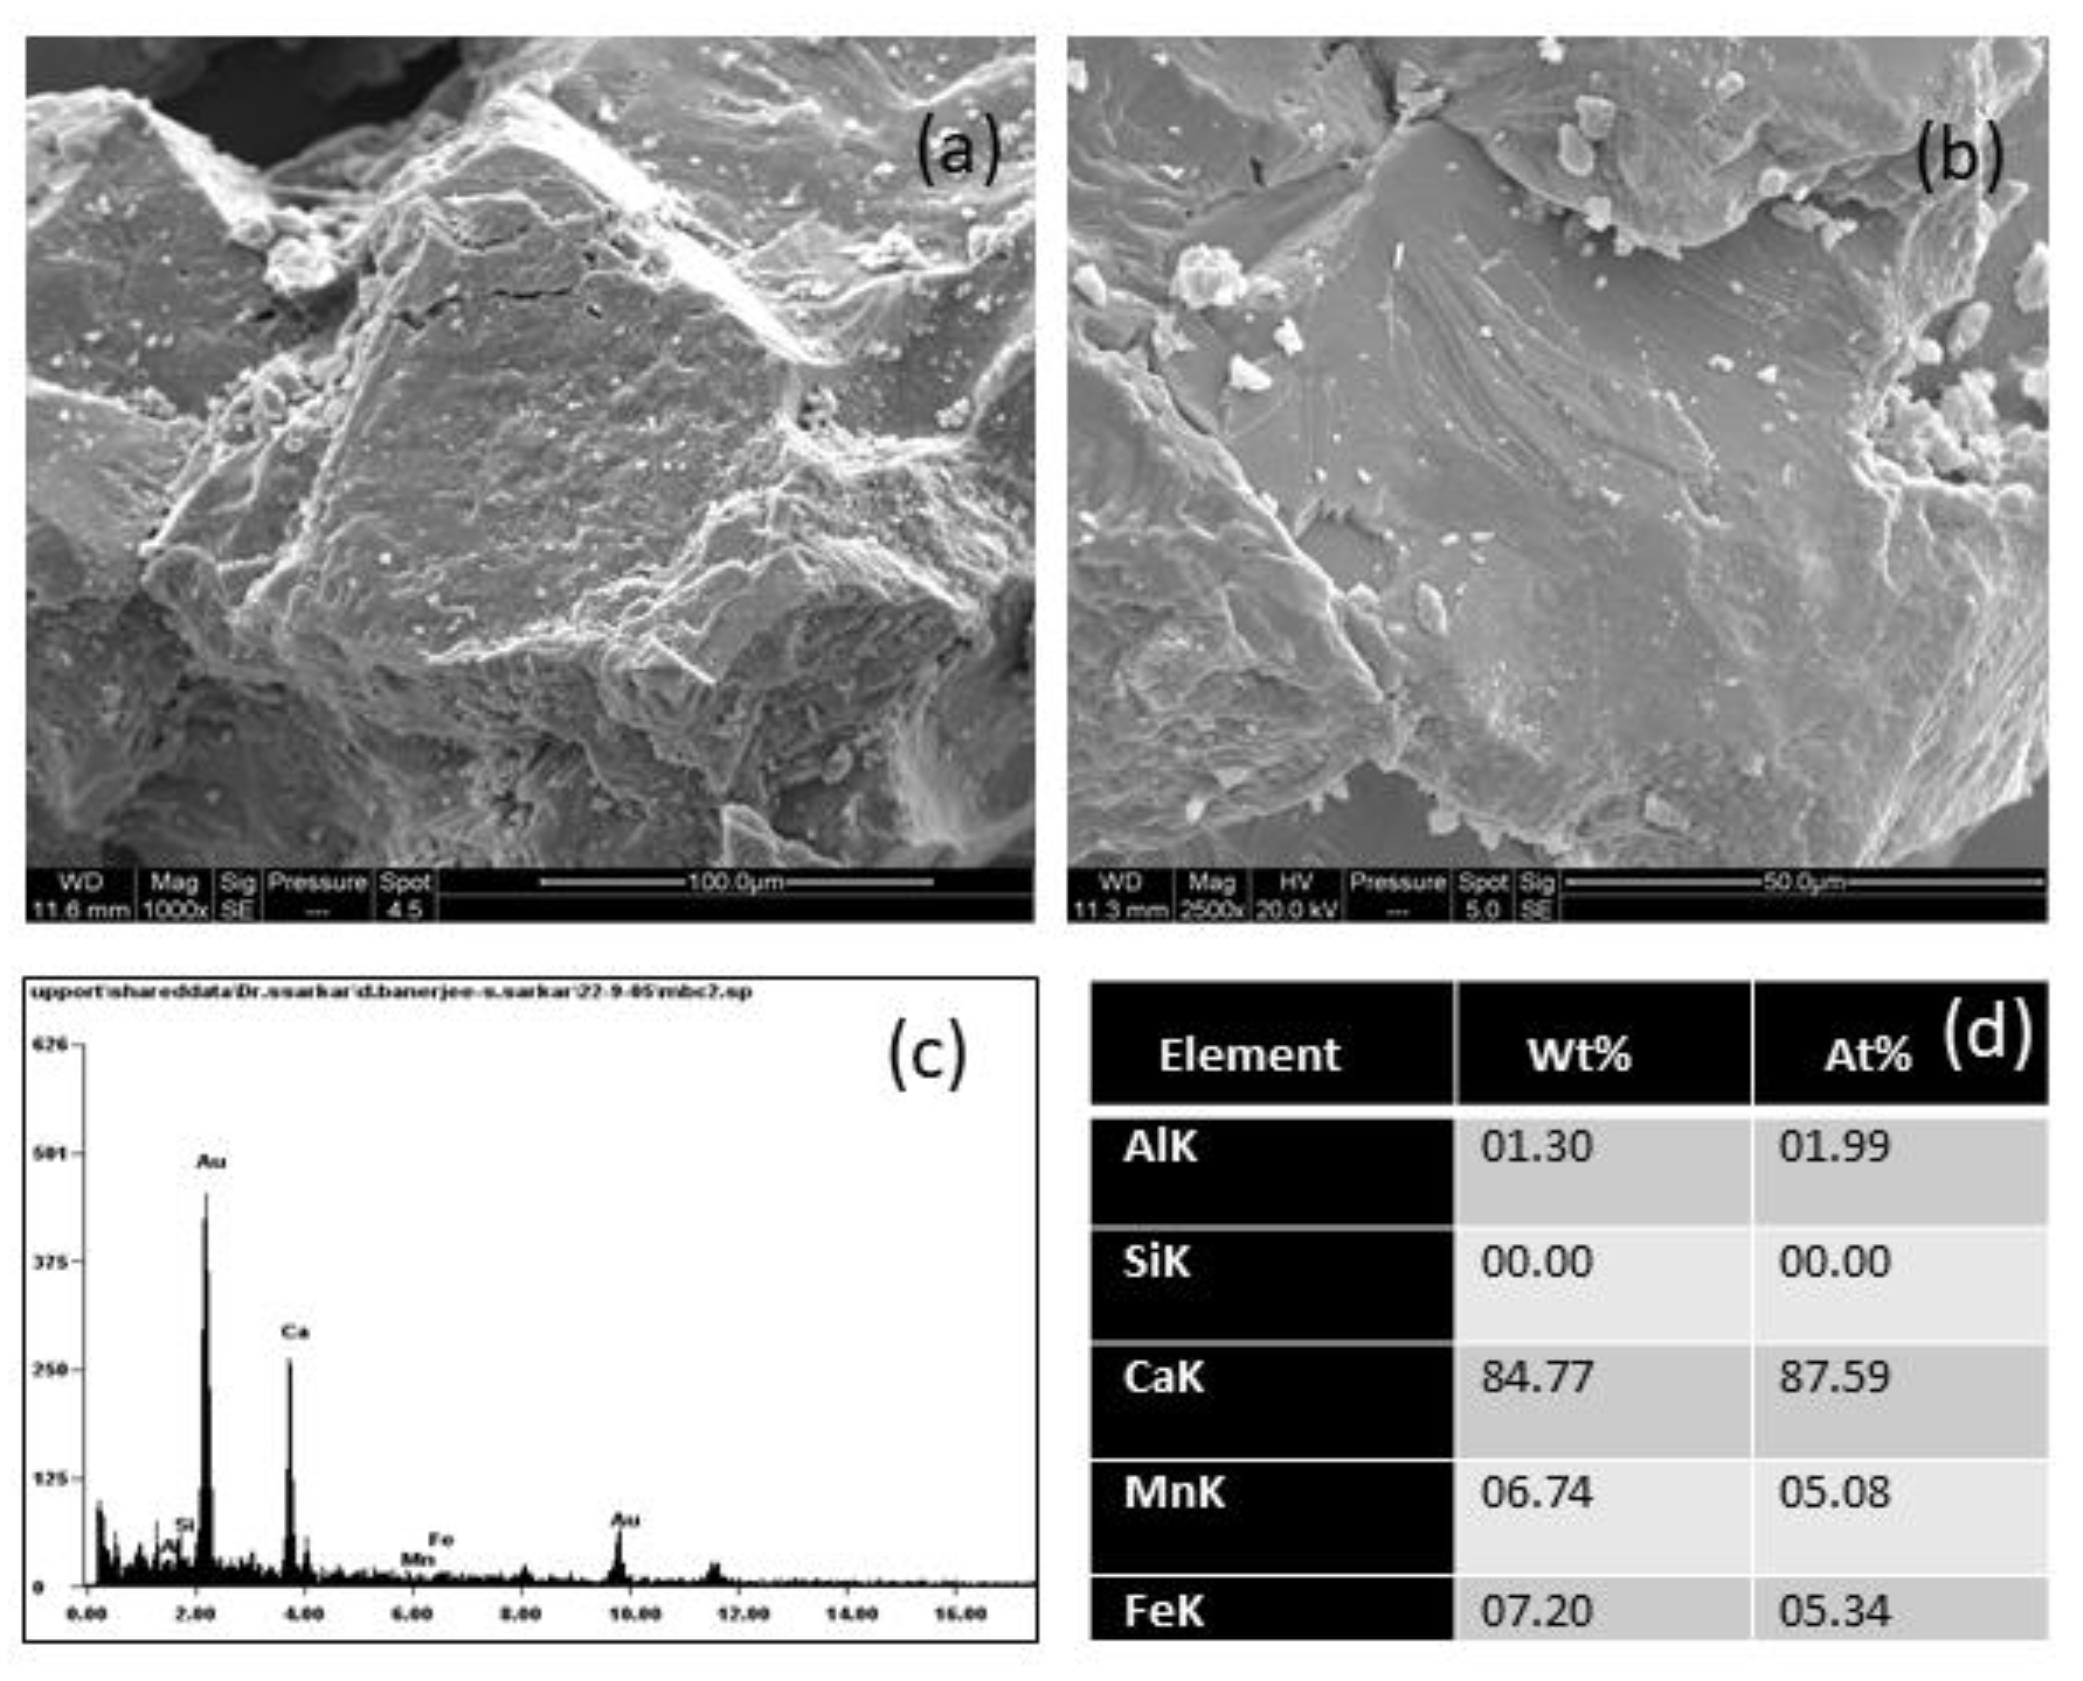
4.1.2. Marble with Black Crust (Figure 7)
The weathered marble with black crust showed weathering profiles and input of the soil-oriented matter within its structure. The weathered mass depicted the impact of hydration combined with allied physical and chemical aspects. Hydration is a process resulting in the weathering of mineral matrices. Low crystalline zones were visible in the images. The zones gave the impact of hydration along with the presence of amorphous layers. Amorphous layers within the marble naturally have a lower crystallinity. Loss of coherence between the interfaces could be assessed. The weathering products present in the black crust weresoil inputs from dust like quartz, illite, and magnetite. Marble weathering profiles were represented by calcium oxalate hydrate, ankerite, and calcium carbonate hydrate.
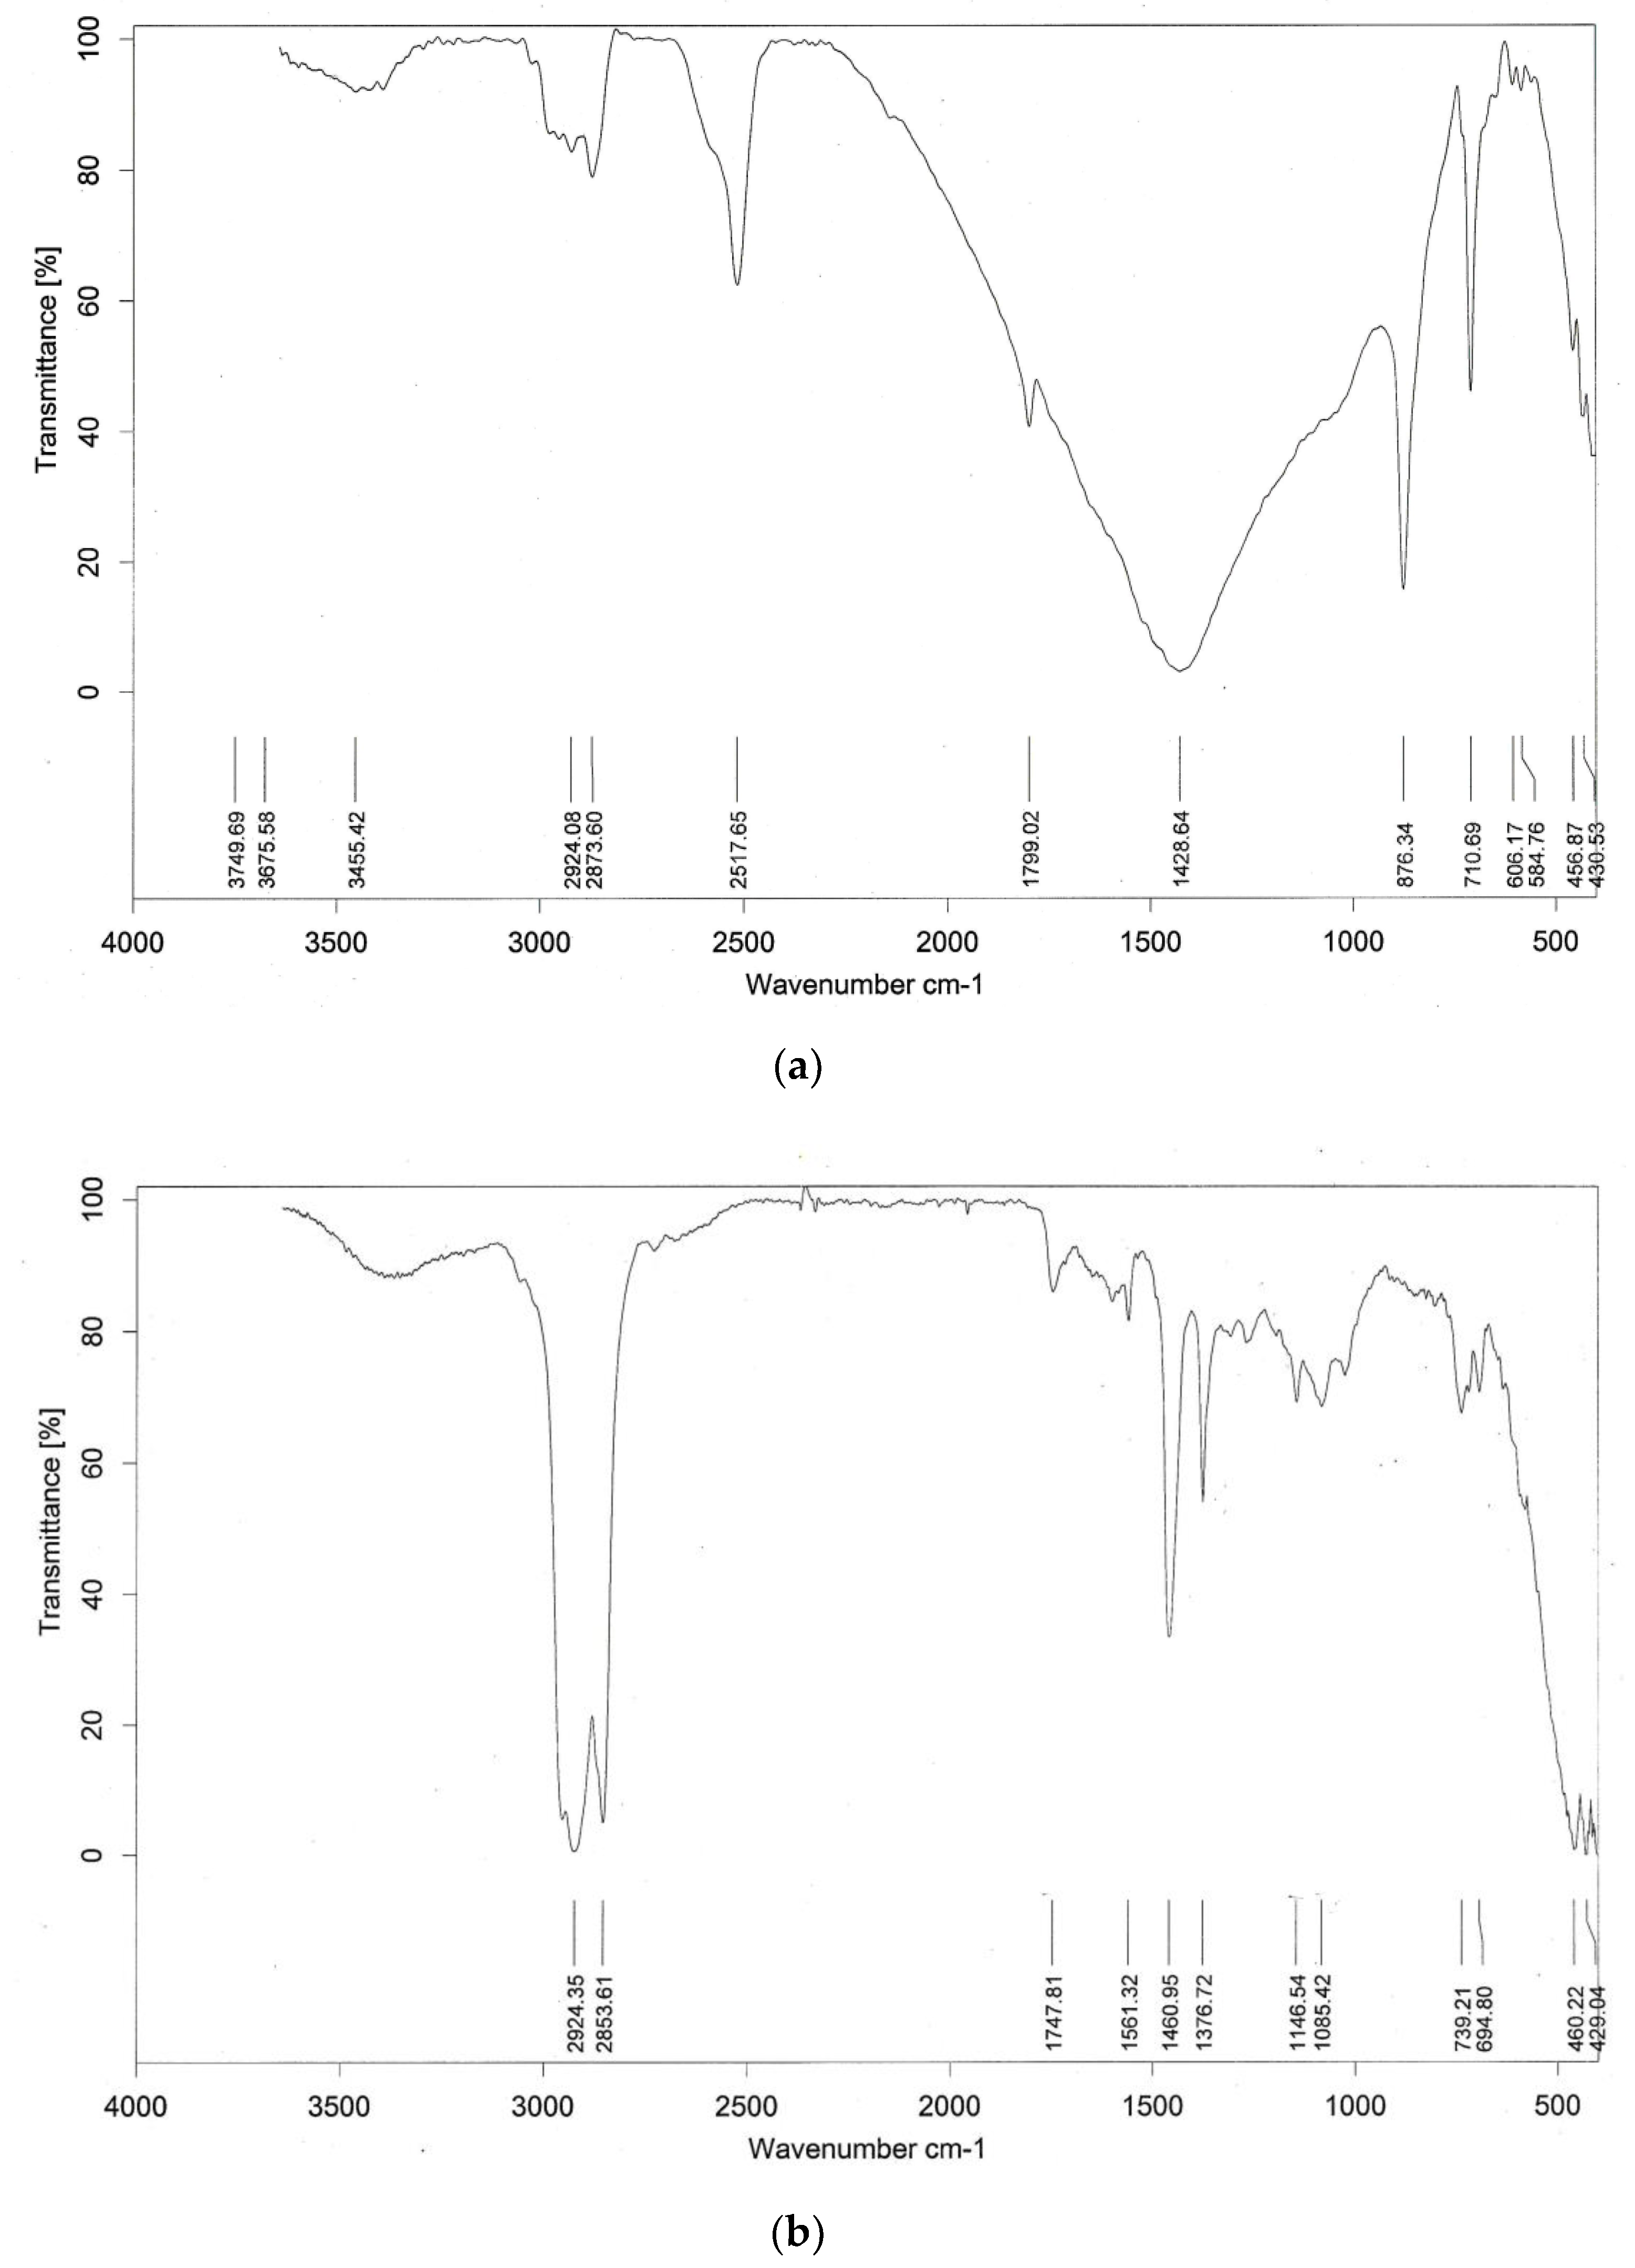
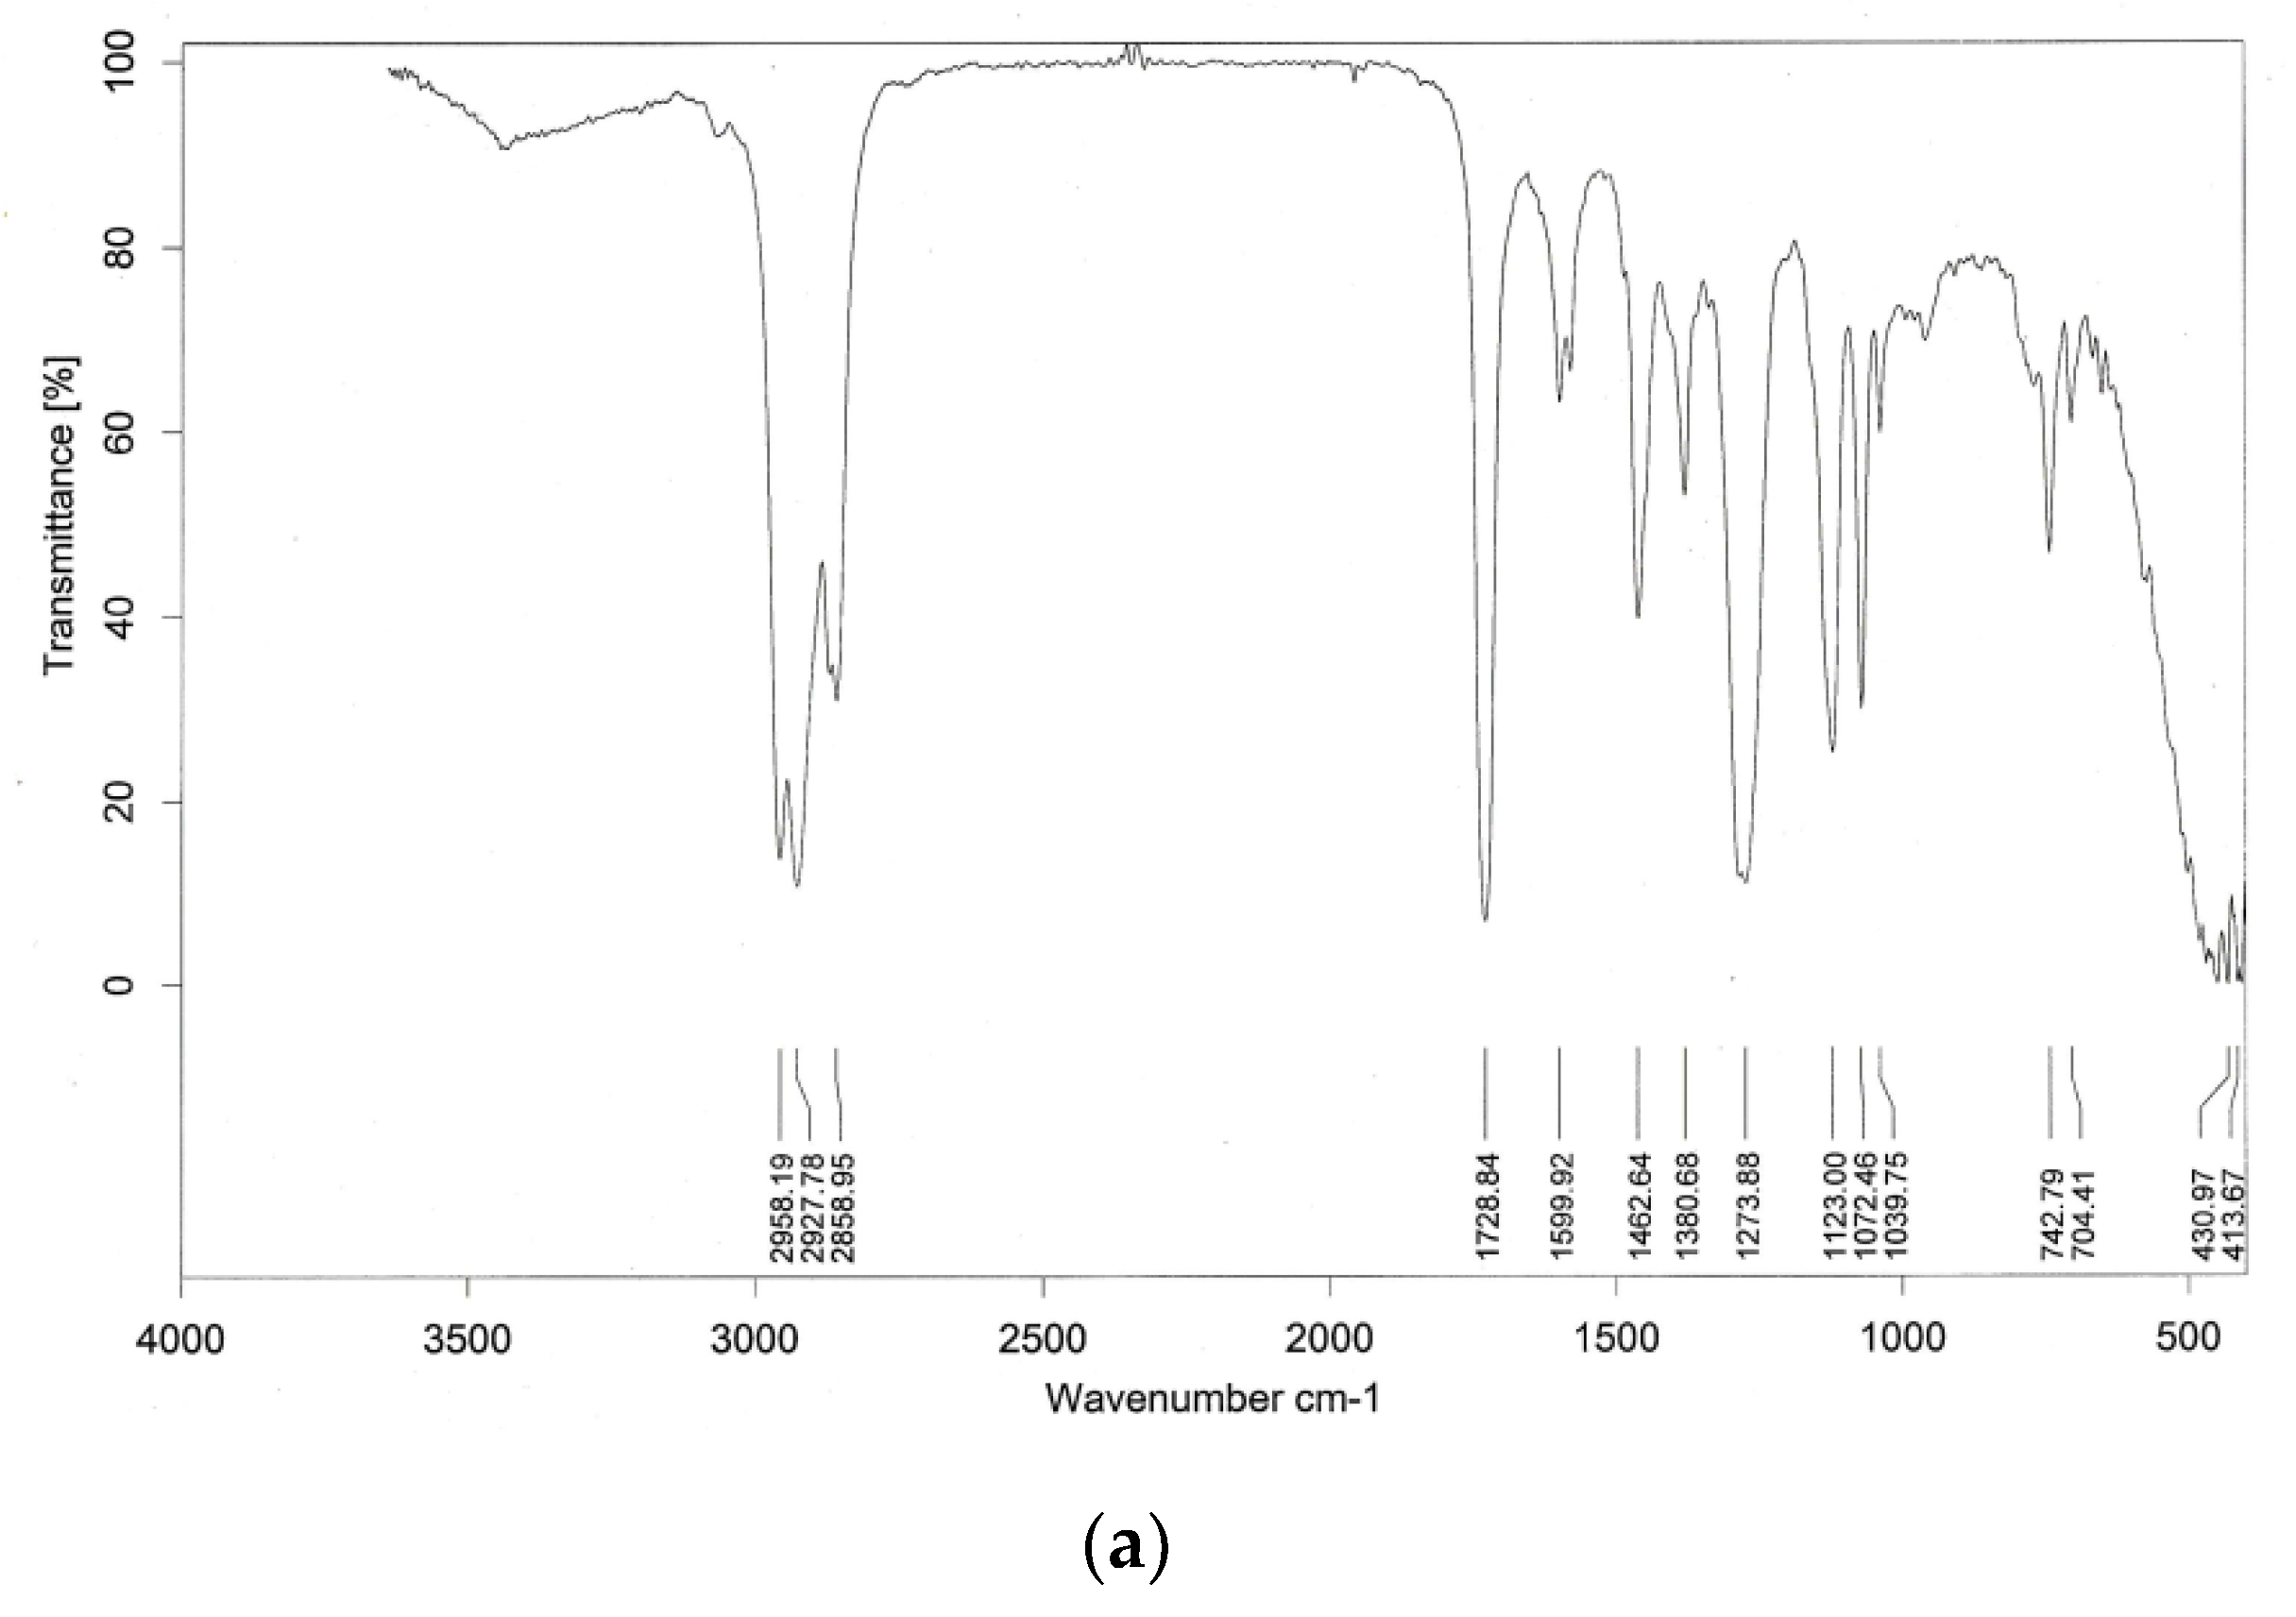
4.1.3. FTIR of Marble Black Crust (Figure 8a)
The IR spectra of marble black crust revealed carbonate bands at 2517 cm−1, 1799 cm−1, 1428 cm−1, 876 cm−1, and 711 cm−1. The other mineral components are montmorillonite [22] at 606 cm−1, hematite [23] at 585 cm−1 corresponding to the IR band range of 584–588 cm−1, quartz [23] at 457 cm−1 corresponding to the IR band range of 455–450 cm−1, kaolinite [23] at 430 cm−1,and organic carbons (as C-H vibration) at 2924 cm−1 and 2873 cm−1.
4.1.4. FTIR of Organic Content of the Marble Black Crust (Figure 8b)
The organic content of the marble black crust showed symmetric CH2 at 2924 cm−1 and asymmetric CH2 at 2852 cm−1; the presence of esters at 1748 cm−1; substituted aromatics at 1561 cm−1; the deformation of CH3 and CH2 [24] at 1477 cm−1 and 1377 cm−1, respectively; asymmetric or symmetric stretching of esters and carbohydrates at 1146 cm−1; aliphatic ethers [25] at 1085 cm−1; and aryl mono-substituted features at 739 cm−1.
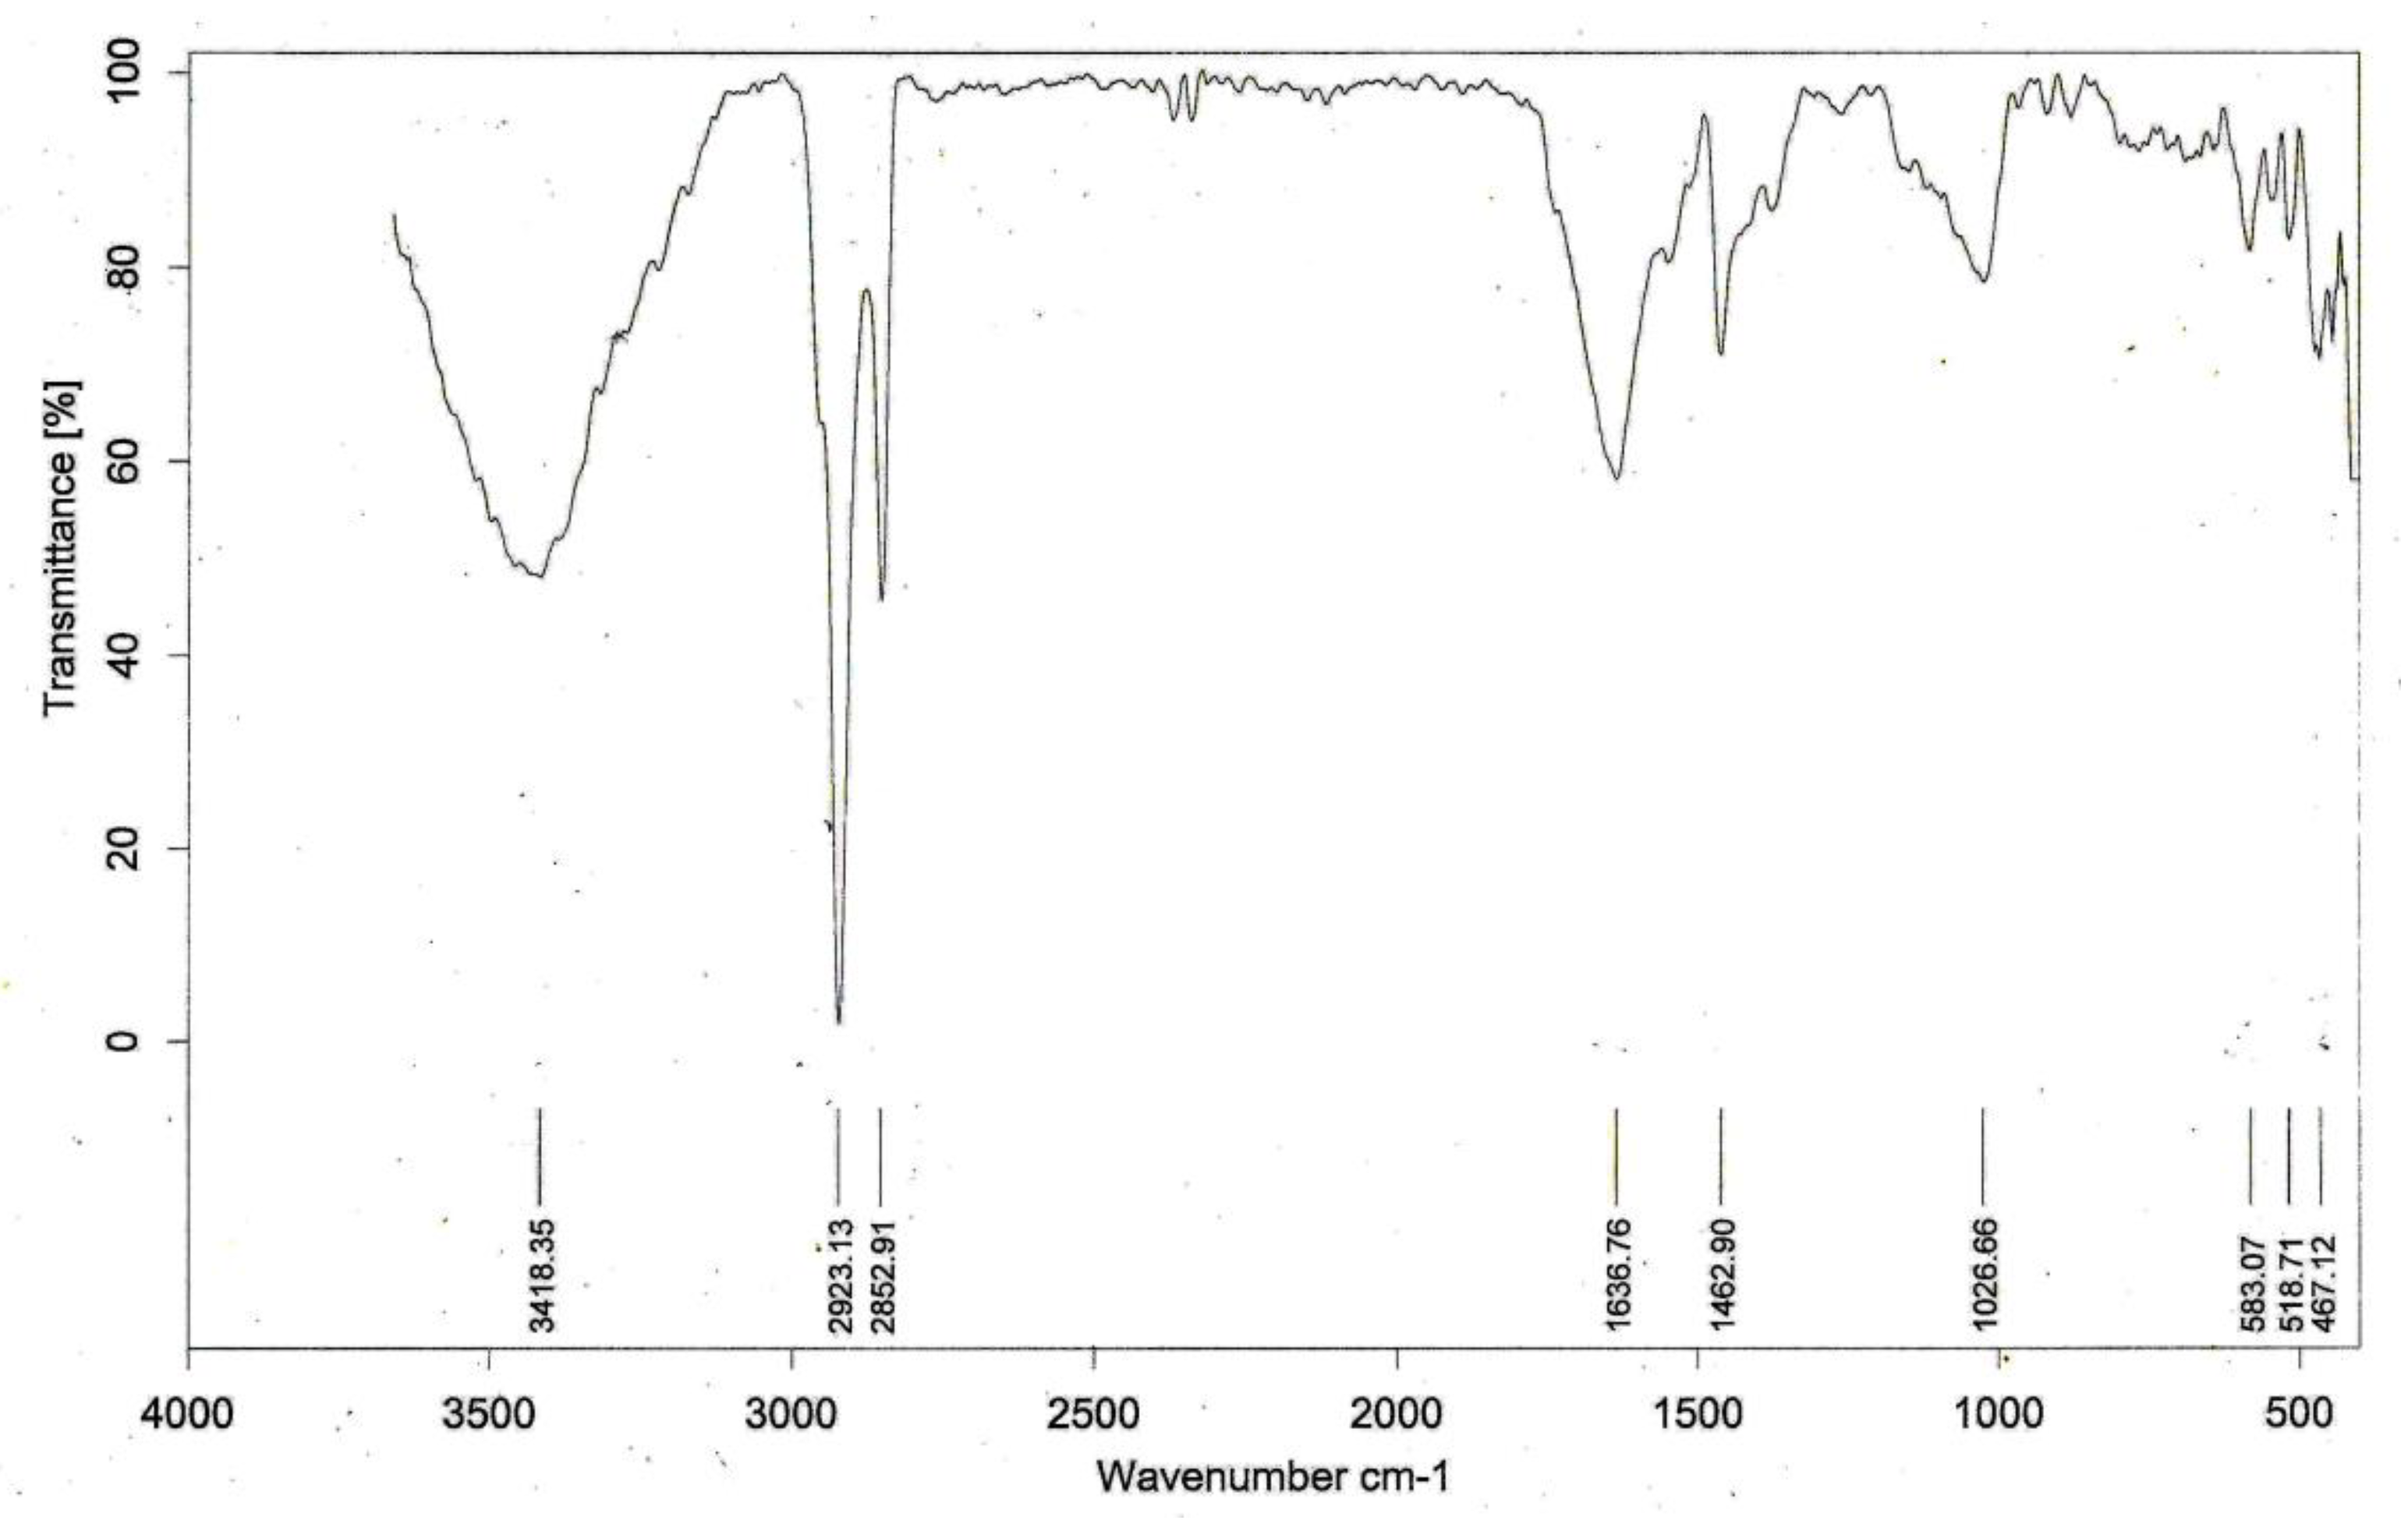
4.2. Algal Characterization (Figure 9)
The FTIR spectra of the blue-green algae showed a water absorption band at 3418 cm−1 conjugated with a protein structure; lipid bands [26] at 2923 cm−1 and 2852 cm−1; protein amide [27] at 1637 cm−1; C-H deformations of CH2 or CH3 groups in aliphatics [27] at 1463 cm−1; carbohydrates [28] at 1026 cm−1; mixed Si-O deformations and octahedral sheet vibrations at 583 cm−1 and 518 cm−1, respectively; and quartz at467 cm−1 [23].
The IR spectrum of blue-green algae showed the presence of proteins, amide, lipids, aliphatic carbon, amides, and carbohydrates, and the adsorption of clay minerals on the algal surface. The exterior surfaces have a composition of proteins and carbohydrates with which metallic species react. This view is based on the analysis by Cristet al. [29].
Associated silicates were also visible, which get attached to the algae by algal cell wall interactions with silicates within their proximity. According to Dodson etal., during the interaction of the metallic ions with the algae, crystalline Al2O3 and SiO2 are present in the heterogeneous matrix of the algal cell wall [30].
4.3. FTIR of Water-SolubleFractions of Aerosols (Figure 10)
4.3.1. Summer Season Water-Soluble Fraction of Aerosols (Figure 10a)
The summer season water-soluble fractions of aerosols revealed asymmetric stretching [24] of CH2; symmetric stretching [31] of C-H; stretching of CH2 [31];C = O of carboxylic, ketone, or ester [32] at 1729 cm−1 corresponding to the IR band at 1725 cm−1; stretching of aromatic C = C [33] at 1600 cm−1 corresponding to the IR band range of 1595–1630 cm−1; C-H deformation of CH2 and CH3 [32] groups at 1462 cm−1; O-H deformation of C-O stretching of the phenolic O-H group or COO- stretching and C-H deformation of CH3 groups [34] at 1380 cm−1; C-O stretching and O-H deformation [31] of COOH and phenolics at 1274 cm−1 corresponding to the IR band range of 1260–1280 cm−1; aryl sulfonic acid [35] at 1123 cm−1 corresponding to the IR band of 1121 cm−1; C-O stretching and O-H deformation of COOH and phenolics [31] at 1072 cm−1; aliphatic C-O-C or polysaccharides [31] at 1039 cm−1; and tri-substituted aromatic rings [35] at 743 cm−1 corresponding to the IR band at 745 cm−1.
4.3.2. Rainy Season Water-Soluble Fraction of Aerosols (Figure 10b)
The rainy season water-soluble fraction of aerosols showed symmetric stretching of C-H at 2924 cm−1; stretching of the CH2 group at 2853 cm−1; stretching of aromatic C = C [33] at 1597 cm−1 corresponding to the IR band range of 1595–1630 cm−1; C-H bending of CH2 and CH3 groups; COO anti-symmetric stretching [34] at 1380 cm−1;and C-O stretching and secondary skeletal vibrations of aliphatic groups [36] at 1019 cm−1 corresponding to the IR band range of 1150–1000 cm−1.
The IR spectra of the water-soluble fractions of the seasonal dust fall samples showed functional groups of a wide range of organic compounds. Within these carboxylic acids, ketones, esters, aromatics, phenolics, aryl sulfonic acids, polysaccharides, and sulfoxides could be assessed. It was interesting to note that the water-soluble portion of the rainy season profile gave few signatures of organic compounds due to obvious atmospheric scavenging of the aerosols during the rainy season. The summer season water-soluble fraction had the most organic compound signatures. The input of substituted benzene ring compounds could be assessed from the IR spectra of summer and winter season water-soluble fractions. The water-soluble compounds in all the seasons were dominated by humic-like substances (HULIS). HULIS have the characteristics of natural organic matter. Natural organic matter is generally dominated by humic and fulvic substances. Some aspects of the IR spectra showed the presence of soot in the water-soluble samples [37]. Bands at 1729, (summer and winter seasons), 1600 (summer and rainy season), and 1039 cm−1 (summer season) were in good agreement with bands of soot at 1720, 1620, and 1040 cm−1 [37]. The presence of humic acids could also be assessed from a similar study [38]. The water-soluble fraction of summer season aerosols showed signatures of C-H at 2958 and 2928 cm−1 and CH2 at 2859 cm−1. Humic-like substances were represented at 1729, 1600, 1462, 1274, and 1039 cm−1. Aryl sulfonic acids showed their presence by a band at 1123 cm−1. Therefore, an organo-sulfur particulate input was observed during summers. Phenolics and organic acids gave a signature at 1072 cm−1 and carbohydrates/aliphatic could be assessed at 1039 cm−1, while the band at 745 cm−1 could be assigned to aromatic structures. The water-soluble winter season aerosols showed C-H asymmetric stretching at 2924 and stretching of CH2 at 2854 cm−1. Bands at 1749, 1455, and 1268 cm−1 could be attributed to humic-like substances (HULIS). Sulfur compounds showed their presence with alkyl sulfonic acid at 1379 cm−1 and subsequently, the S=O group in sulfoxides was represented by a band at 1086 cm−1, showing a considerable amount of organo-sulfur compounds in the winter season. The presence of stretching and secondary vibrations of aliphatic groups could be assigned to a band at 1145 cm−1. The winter season soluble aerosol also showed interesting features of aromatic structures: tri-substituted aromatic rings at 740 cm−1 and C-H deformation modes of a mono-substituted benzene ring at 696 cm−1. The winter season in North India is characterized by unstable atmospheric conditions, along with the stagnation of aerosols. Therefore, the presence of aromatic structures in such an environment could be ascertained. The rainy season water-soluble fraction showed asymmetric stretching of C-H at 2924 cm−1 and stretching of CH2 at 2853 cm−1. C-O stretching of aliphatic groups was represented at 1019 cm−1, while humic-like substances gave their presence at 1463 and 1378 cm−1. A previous study showed that humic acids were enriched in hydroxyl, carbonyl, carboxyl, and aliphatic groups and relatively lacking in aromatic groups [38].
4.3.3. Winter Season Water-Soluble Fraction of Aerosols (Figure 10c)
The winter season water-soluble fraction of aerosols showed symmetric stretching of C-H at 2924 cm−1; stretching of CH2 at 2854 cm−1; ester, aldehyde, or ketone [35] at 1749 cm−1 corresponding to the IR band range of 1750–1700 cm−1; CH2 and CH3 asymmetric bending of aliphatics [21] at 1455 cm−1; alkyl sulfonic acid [35] at 1376 cm−1 corresponding to the IR band at 1379 cm−1; C-O stretching and O-H deformation of COOH and phenolics [31] at 1268 cm−1 corresponding to the IR band range of 1260–1280 cm−1; C-O stretching and secondary skeletal vibrations of aliphatic groups [36] at 1145 cm−1 corresponding tothe IR band range of 1150–1000 cm−1; stretching vibrations of the S = O group in sulfoxides [35] at 1086 cm−1 corresponding to the IR band at 1087 cm−1; tri-substituted aromatic rings [35] at 740 cm−1 corresponding to the IR band at 745 cm−1;and aryl monosubstituted [39] or C-H at 696 cm−1.
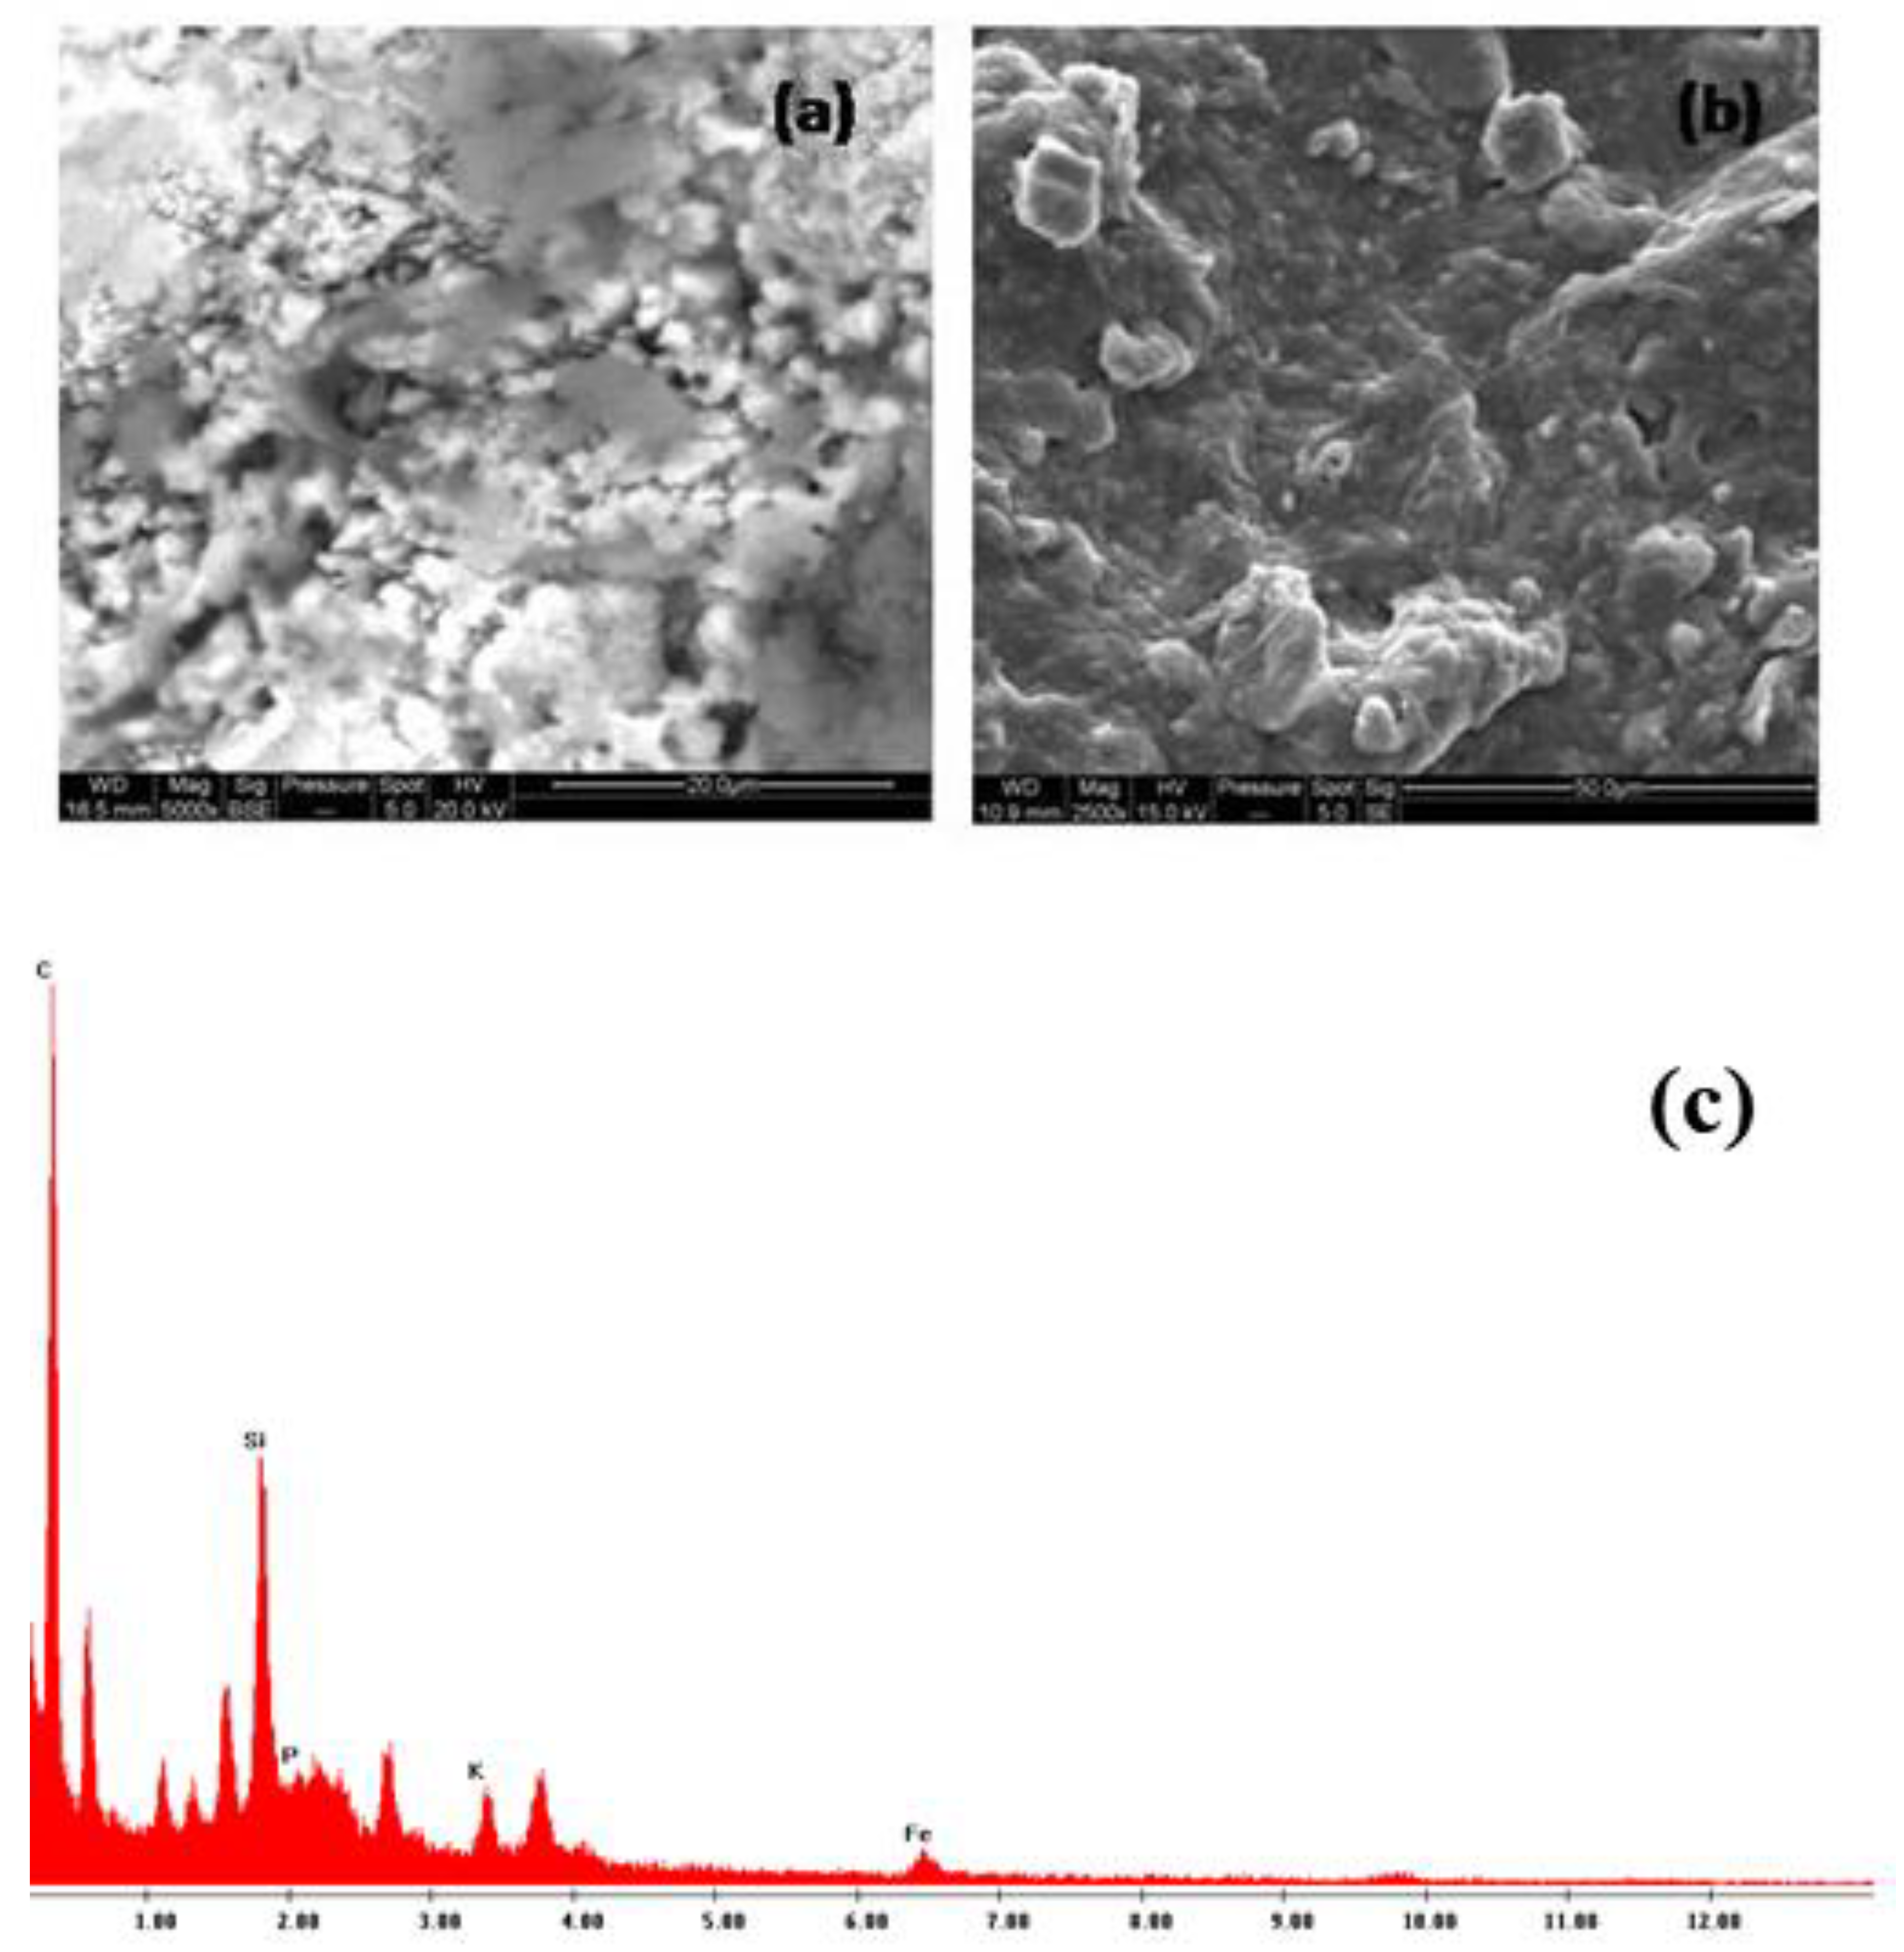
4.4. SEM Study on Algal Growth (Figure 11a)
To supplement the effect of the impact of algal attack on marble, weathered marble with algal inclusion was subjected to analysis under SEM. The algal growth and its impact on the weathered marble showed a structure similar to an organo-mineral complex [11]. The fibrillar nature of the cyanobacterial cell wall had penetrated into the marble matrix. The calcite grains showed invasion by small agglomerations of cyanobacterial cells closely attached to each other. Close associations of the algal cell formations showed that the weathered zones which had become more degraded had been inhabited by the blue-green algae. Invasion by the cyanobacteria in the calcite mass was evidenced by cyanobacterial inclusions in the pores, pits, and cleavages. The morphology indicated a major role of the algal invasion and subsequent colonization on the marble.
The SEM images of the algal growth on marble gave imprints of invasion by algal unicellular masses into the marble substrate showing colonization. An organo-mineral assemblage showed that the algal invasion was prominent within the system. The weathered marble mass was impregnated with cyanobacterial colonies scattered within the area. Such algal invasions could naturally result in the secretion of metabolic organic acids by which calcium oxalate hydrate salts were formed on the surface.
4.4.1. EDS Analysis of Algae (Figure 11b)
The blue-green algae was subjected to qualitative elemental and morphological analysis by an SEM-EDS system, which revealed the following.
The EDS spectra of the blue-green algae showed the presence of P(for phosphates) and C(for carbohydrates). Apart from these, the spectra showed the presence of elements like Fe, Si, and K associated with the cell structure. The algae takes these elements from the airborne dust and utilizes them in its metabolic cycle. The presence of soil-oriented elements like Fe, Si, and K in the EDS spectra of the algae addresses the same process. The SEM images of the algae showed that the algal cell walls had a chlorophyllous structure, testifying the organic nature. Within this structure, the presence of micro particles showed the possible adsorption of metal particles on the algal cell walls. According to Crist et al.,in this scenario, Si, Fe, and Al elements concentrate at the cell wall surface by adsorbing onto the surface functional groups [29].
4.4.2. EDS Analysis (Figure 11c)
The blue-green algae (cyanobacteria) which grows on the calcitic mass of the monument showed a chlorophyllous matrix cell structure based on natural organic polymers like proteins, sugars, and phosphates. Some evidence of other microbial mass like fungal strains could also be ascertained.
Evidence of possible metal particulates embedded on the algal mass could be identified by EDS in the SEM images. The essentially plant-based morphological structure also showed traces of metal particle inclusions on the chlorophyllous base. The elemental analysis by EDS gave imprints of phosphates and carbon, and traces of Si, K, and Fe adsorbed on the surface of the algae.
The SEM image of fresh marble shows (Figure 12a) a closed knit structure, wherein the grain boundaries were well-defined. The structure was a compact one. The matrix showed perfect crystalline features, and the interfaces in the structure were coherent. The calcium percentage in the EDS (Figure 12b,c) was around 97%, with some silica (around 3%).
The SEM images showed the weathering features of the marble, as compared with the fresh marble sample. Pits, pores, and cracks were visible in the crust. The presence of an amorphous layer may have been formed by the action of water and further transformations in the physical and chemical profile. The fractures were uneven, which showed the impact of water percolation. Since the amorphous layer of the crust was less crystalline compared to the fresh marble, the interfaces showed that the existing matrix had less coherence in the calcite grains and boundaries compared with the fresh marble. The EDS spectra showed less weight % of Ca compared with the fresh marble and also the presence of Fe and Mn as additional transition metals on the crust.
The SEM image (Figure 13a,b) of a black crust sample showed a topography where the grain boundaries in the calcitic mass were loose and scattered; an amorphous-like coating was visible; and the weathering pattern was visible in the form of pits, pores, cracks, and crevices. Amorphous layers indicated the lower crystalline nature of the specimen. The structure had imprints of weathered marble mass. The impact of hydration could be assessed, which naturally indicated a lower crystalline structure. The EDS spectra (Figure 13c,d)showed the presence of elements like Mn, Fe, Al, and Si apart from the calcite. The presence of Si was from the calcite structure, whereas Al, Mn, and Fe could have been from the crustal input or from anthropogenic sources.
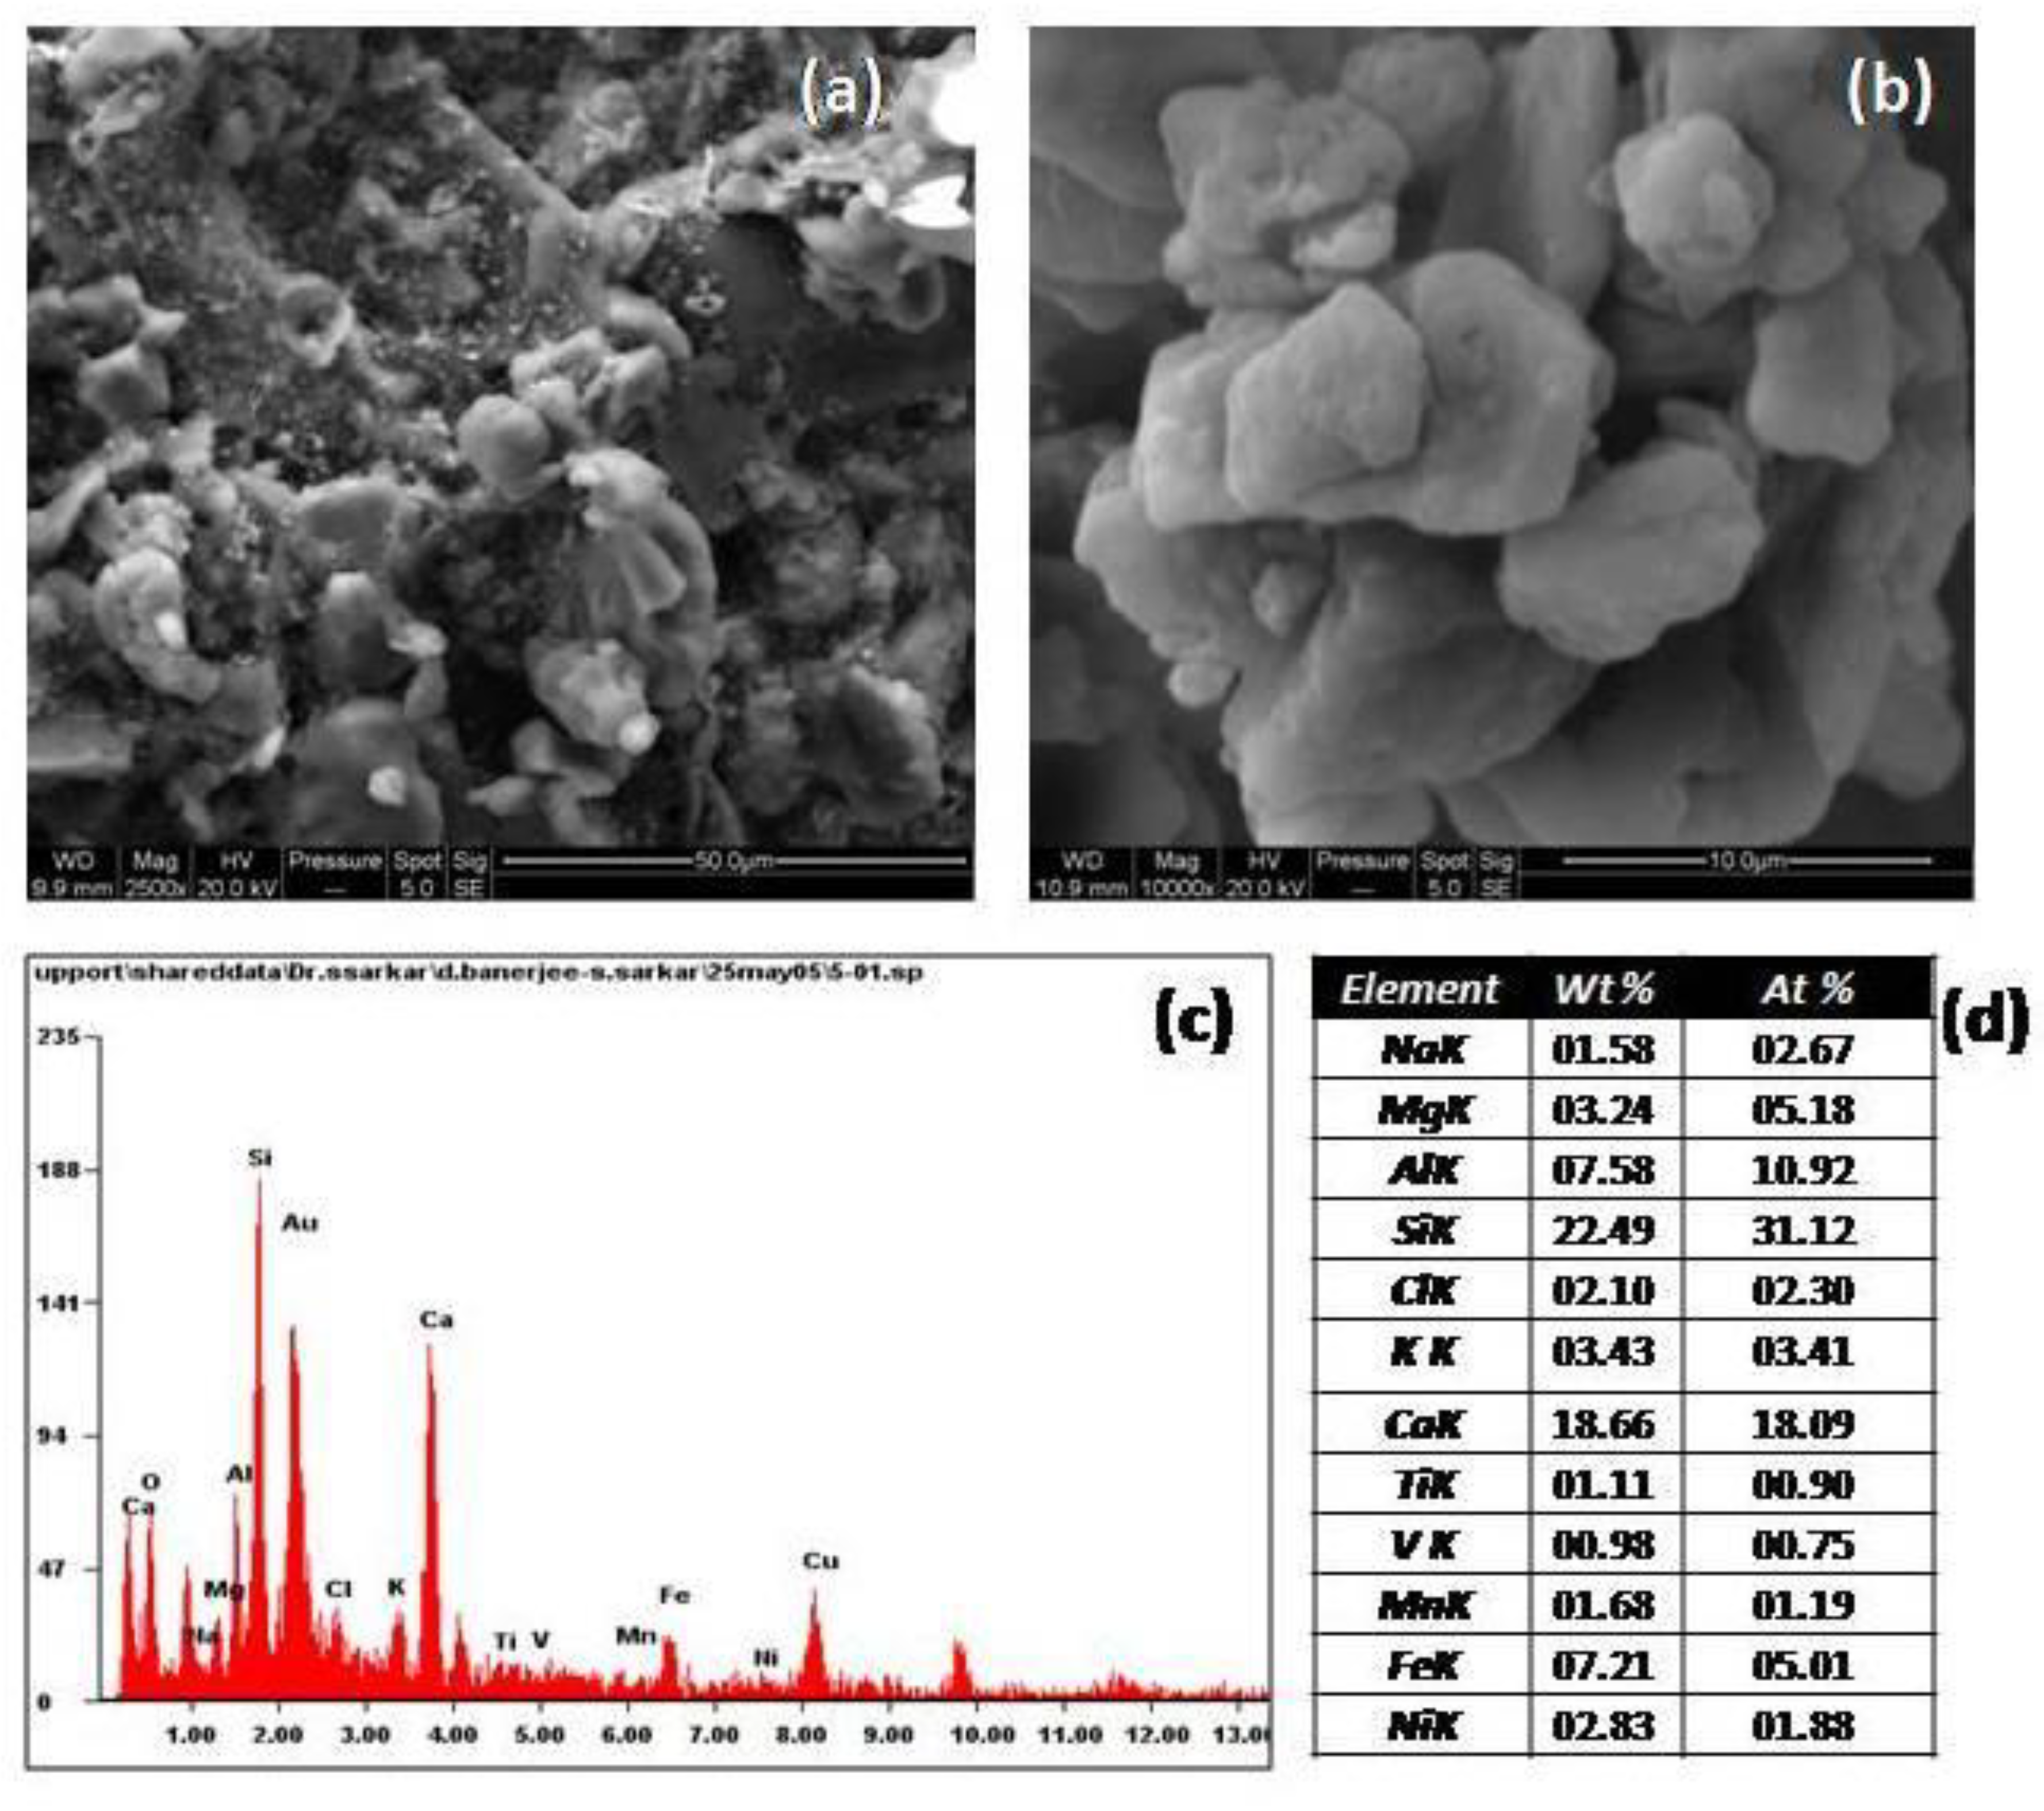
4.5. SEM-EDS Spectra of Airborne Dust (Figure 14)
The EDS spectra of airborne dust represented an annual pattern of composite airborne dust. The elemental composition depicted a profile dominated by soil-oriented elements (crustal elements), like Na, Mg, Al, Si, K, and Ca. Some impressions of anthropogenic elements could be assessed by the presence of Ti, V, Mn, Fe, and Ni. Fe could be from soil sources, as well as from anthropogenic inputs.
The elemental composition of the dust by EDS gave the soil-oriented elemental profile. Some elements like Na, Mg, Al, Si, K, and Ca had a crustal origin; Fe and Mn could have been from soils or an anthropogenic source; and Ni, Cu, V, and Ti indicated an anthropogenic origin. In the overall elemental characterization, the base of the dust had a crustal origin, while inputs of industrial signatures were visible. The airborne dust composition showed features of a typical crustal aerosol. The EDS spectrum showed that the ratio of Si/Al was 2.96 and ratio of Fe/Al was 0.95. These were in agreement with the Si/Al ratio of 2.7 and the Fe/Al ratio of 1.3 for crustal aerosols, as reported by Rahn [40]. The elements represented showed the lithophillic nature of the dust. The elemental K/Fe ratio obtained by EDS analysis was 0.47, which was in good agreement with a value of 0.4 for airborne coarse crustal material [41].
The wt% of Fe as analyzed by EDS in the airborne dust was 7.2%, which was near the average weight % value of 6.7% of Asian dust. Therefore, the airborne dust represented a characteristic feature which resembled the nature of Asian dust [42].
The SEM images of the airborne dust in lesser magnifications showed a soil mineral matrix. The particles demonstrated a major aluminosilicate matrix with certain additions. The additions were the presence of micro metal particles embedded within the dust. The soil mineral particles were characterized by irregular-shaped, rectangular, or rhomboidal particles. The aluminosilicate particles were associated with agglomerate formations in which the particles were closely attached to each other.
The SEM images showed dust particles with irregular habits: octagonal and rhomboidal. Morphological analysis showed that small particles were attached to large particles. The dust particles were attached in close proximity; this could be due to the strong cohesive forces within the particles. The presence of a dry environment like Agra, which falls in to the category of a semi-arid zone of India, could be a factor for such a particle habit. Some voids and minute gaps could be seen due to the presence of these odd-shaped particles. Iron oxides in the dust get deposited on the monument surfaces by wind action. Iron aids in crust formation. Iron-rich particles can act as catalysts in various mechanisms, leading to stone decay. Such a phenomenon has been reported by Schiavonet al. [43].
The microorganisms present in the weak zones of the monument can utilize the iron oxides and related elements for their metabolic activity.SEM images of the dust particles gave a soil-oriented profile and also indicated particles that could be from anthropogenic activity. The SEM images were dominated by irregular-shaped particles, which indicated crustal material, but to some extent, some metal input like iron oxides, as shown by EDS analysis, could be assessed.
Airborne dusts tend to accumulate on the sensitive and weak weathered zones of the monument and can aid in crust formation. Such a study was given by Torok etal., which opined that dust and black crust samples from limestone buildings could be used as environmental indicators since both dust and crust accumulate air pollutants and act as memories of the past pollution level [44].
Calcium can be leached from limestone surfaces or chelated, once solubilized from the matrix, by hexauronic acids, and carboxyl and hydroxyl groups [45].Organic acids like oxalic, citric, gluconic, malic, succinic, amino, and uronic acids may react with the stone via salt formation and complexation [46].According to SaizJiminez and Hermosin, the black crust coatings on the structures of building materials located in urban environments have all kinds of organic compounds present in aerosols and particulate matter, which are transferred by dry or wet deposition. The composition of each crust is governed by the composition of the vehicular emissions, and diesel engines have a strong influence [47]. However, the direct impact of humic-like matter on the marble substrate was difficult to assess. Finally, careful examination of the black crust on marble by EMS imaging clearly showed the presence of airborne carbon particulate matters. The latest search ofsuch particulates has revealed that these, in appreciable quantity, contain carbon under a nano domain as carbon nano tube, graphene oxide, and nano carbon dots. Such nano carbons are known to produce reactive oxygen species (ROS) inair and sunlight [48,49,50]. The readily available gaseous nitrogenous pollutants produced by auto exhausts and refineries whenreacting with ROS readily produce reactive nitrogen species (RNS). These are capable ofdestroying marble surfaces, inflicting permanent damage to monuments like the Taj Mahal. The presence of nano carbon dots of sizes smaller than 5 nm in the black crust can be clearly visualized in the TEM images (Figure 15).
5. Conclusion
Characterization of the airborne atmospheric species from abiological and biological natural sources and from anthropogenic origins that interact with the surface of the Taj Mahal monument has been conducted. Ingredients present in the environmental pollutant have been shown to be natural, which were augmented by anthropogenic activity. It is stressed here that beyond common dust, pollutant gases, and carbon particulates, the atmospheric aerosol was also comprised of microbial species and carbon dust with a size under the nano domain. These highly reactive species participate in allied metabolic processes upon the marble matrix of the monument. In this process, inorganic crustal minerals like airborne dust and airborne carbon particulates including nano carbons, organic aerosols, natural bio-organic matter like Hulis, and cyanobacterial cellular events, act to create the weathering phenomena of the marble surface a complex one. The visible impact of such an amalgamated complex reaction has been the degradation and discoloration of the marble surface. The atmospheric inputs get added to a process of more complex biochemicals involving free radical-like reactive oxygen species [48,49,50] to contribute to the weathering mechanisms. A recent report on the erosion of the Aravalli mountain range showed that human activity extending the Thar Desert that enhanced dust storms drifted by the wind current toward the site of the discussion augmented the degradation process [51].
A clear strategy needs to be developed to prevent the accumulation of such reactive species on the surface of the monument vis-a-vis its surrounding environment. However, it is true that we have to maintain a globally clean environment. It will not help much to clean only the nearby zone as aerosol particles are global and are not confined to the place of their origin, but drift all over the globe. At present , a massive tree plantation in the nearby area with frequent surface monitoring, maintenance, and restoration of the affected surface of the monument by certified treatment would be the only viable option to add life span to the monument.
Author Contributions
D.B. collected samples through field work from the building site and other sources and the raw images and the relevant data were extracted from the samples in the laboratory and analyzed under the supervision of S.S. The first draft manuscript was written by D.B. and then both the authors worked on this draft, which was finally checked by S.S. Both the authors have given approval to the final version of the manuscript.
Funding
Initial funding for this research was provided by a UNESCO nominated PhD grant to D.B. The sustained financial support from SERB-DST, Government of India, New Delhi, to S.S. is gratefully acknowledged.
Acknowledgments
DB thanks Dr. Christian Manhart of the UNESCO for nominating the author for a PhD grant. Thanks are also due to Dr. D. V. Sharma, Dr. N. K. Samadhiya, Dr. K. P. Poonhacha, Mrs. Kasturi Gupta Menon, DGASI for their keen interest in the work. SS thanks DST-SERB, Government of India, N. Delhi, for sustained research funding.
Conflicts of Interest
The authors declare no conflict of interest.
Abbreviations
| ROS | Reactive Oxygen Species |
| TTZ | Taj Trapezium Zone |
| PM | Particulate Matter |
| ADA | Agra Development Authority |
| DG | Diesel Generator |
| SPM | Suspended Particulate Matter |
| SEM-EDS | Scanning Electron Microscopy (SEM) cum Energy Dispersive Spectroscopy(EDS) |
| TEM | Transmission Electron Microscopy |
| HULIS | humic like substances |
| RNS | reactive nitrogen species |
| XRD | X-Ray Diffraction |
| HSD | High Speed Diesel |
| LPG | Liquefied petroleum gas |
| IR | Infra Red |
| FTIR | Fourier Transformed Infra Red |
References
- Agarwal, M.; Singh, B.; Rajput, M.; Marshall, F.; Bell, J.N.B. Effect of air pollution on peri-urban agriculture: A case study. Environ. Pollut. 2003, 126, 323–329. [Google Scholar]
- Atash, F. The Deterioration of urban environments in developing countries Mitigating the air pollution crisis in Tehran, Iran. Cities 2007, 24, 399–409. [Google Scholar]
- Agra Environment Management Plan; Central Pollution Control Board, Ministry of Environment & Forests, Government of India, Agra Office: Agra, Uttar Pradesh, India, January 2002.
- Hicks, B.B.; Kumari, M. Marble discoloration at the Taj Mahal: A proposed explanation. In Proceedings of the ICOMOS 8th General Assembly and International Symposium, Washington, DC, USA, 7–15 October 1987; pp. 325–332. [Google Scholar]
- Sharma, R.K.; Gupta, H.O. Dust Pollution at the Taj Mahal—A case study. In Proceedings of RILEM/UNESCO Congress; Thiel, M.J., Ed.; E & F. N. Spon: London, UK, 1993; pp. 11–18. [Google Scholar]
- Kumar, R.; Rani, A.; Kumari, K.M.; Srivastava, S.S. Direct measurement of atmospheric dry deposition to material surfaces in a semi arid region of north central India. J. Geophys. Res. 2003, 108, 4625. [Google Scholar] [CrossRef]
- Kumar, R.; Rani, A.; Singh, S.P.; Kumari, K.M.; Srivastava, S.S. Measurements of dry deposition of gaseous and particulate sulphur on marble at a suburban site. Ind. J. Radio Sp. Phys. 2002, 31, 88–92. [Google Scholar]
- Kulshreshtha, U.C.; Saxena, A.; Kumar, N.; Kumari, K.M.; Srivastava, S.S. Mass size distribution of aerosols at a suburban site of Agra. Ind. J. Radio Sp. Phys. 1995, 24, 178–183. [Google Scholar]
- Bergin, M.H.; Tripathi, S.N.; Jaidevi, J.; Gupta, T.; Mckenzie, M.; Rana, K.S.; Shafer, M.M.; Villalobos, A.M.; Schauer, J.J. The discolouration of the Taj Mahal due to particulate Carbon and dust deposition. Environ. Sci. Technol. 2015, 49, 808–812. [Google Scholar]
- Tabasso, M.L. ICCROM Report of the Mission to Agra. Satdhara and Sanchi UNESCO Contract no 3970367; ICCROM: Rome, Italy, March 1997; pp. 16–24. [Google Scholar]
- Banerjee, D.; Sarkar, S. Chemistry and Deposition of Airborne Particulates on the Taj Mahal at Agra India. Natursteinsanierung. In Proceedings of the Natural and Building Stones, Stuttgart, Germany, March 11–12 2016; pp. 119–129. [Google Scholar]
- Toniolo, L.; Zerbi, C.M.; Bugini, R. Black layers on historical architecture. Environ.Sci. Pollut. Res. 2009, 16, 218–226. [Google Scholar]
- Del Monte, M.; Ausset, P.; Lefevre, R.A. Evidence of pre-industrial air pollution from the Heads of the kings of Juda statues from NotreDame Cathedral in Paris. Sci. Total Environ. 2001, 273, 101–109. [Google Scholar]
- Genestar, C.; Pons, C.; Cerro, J.C.; Cerda, V. Different decay patterns observed in a nineteenth-century building (Palma, Spain). Environ. Sci. Pollut. Res. 2014, 21, 8663–8672. [Google Scholar] [CrossRef]
- Parmar, R.S.; Satsangi, G.S.; Kumari, M.; Lakhani, A.; Srivastava, S.S.; Prakash, G.S. Study of size distribution of atmospheric aerosol at Agra. Atmos. Environ. 2001, 35, 693–702. [Google Scholar]
- Office of the Registrar General 2011, Tables on Houses, Household Amenities and Assets, Census of India, Vital Statistics Division; Ministry of Home Affairs: New Delhi, India, 2011.
- District Profile. Available online: https://agra.nic.in/district-profile/ (accessed on 8 July 2019).
- Kumar, R.; Srivastav, S.S.; Kumari, K.M. Characteristics of Aerosols over Suburban and Urban Site of Semiarid Region in India: Seasonal and Spatial variations. Aerosol. Air Qual. Res. 2007, 7, 531–549. [Google Scholar]
- Swanson, H.E.; Tatge, E. Standard X-ray Diffraction Powder Patterns; National Bureau of Standards: Washington, DC, USA, 1962. [Google Scholar]
- Keene, G.; van der Merwe, D. Classification of Toxic Cyanobacterial Blooms by Fourier Transform Infrared Technology. Adv. Microbiol. 2013, 3, 1–8. [Google Scholar]
- Filip, Z.; Hermann, S. An Attempt to differentiate Pseudomonas spp. And other soil bacteria by FTIR spectroscopy. Eur. J. Soil Biol. 2001, 37, 137–143. [Google Scholar]
- Artz, R.R.E.; Chapman, S.J.; Robertson, A.H.J.; Potts, J.M.; Defarge, F.L.; Gogo, S.; Comont, L.; Disnar, J.R.; Francez, A.J. FTIR spectroscopy can be used as a screening tool for organic matter quality in regenerating cutover peatlands. Soil Biol. Biochem. 2008, 40, 515–527. [Google Scholar]
- Ramasamy, V.; Ponnusamy, V. Analysis of air suspended particles in Coimbatore—A FTIR study. Ind. J. Phys. 2009, 83, 301–312. [Google Scholar]
- Gualteri, M.; Andrioletti, M.; Mantecca, P.; Vismara, C.; Camatini, M. Impact of tire debris on in vitro and in vivo systems. Part. FibreToxicol. 2005, 2, 1. [Google Scholar] [CrossRef]
- Chun, Y.; Shing, G.; Chiou, L.T. Evaluation of Current Techniques for Isolation of Chars as Natural Adsorbents. Environ. Sci. Technol. 2004, 38, 4227–4232. [Google Scholar]
- Centrone, A.; Brambilla, L.; Renouard, T.; Gherghel, L.; Mathis, C.; Mullen, K.; Zerbi, G. Structure of new carbonaceous materials: The role of vibrational spectroscopy. Carbon 2005, 43, 1593–1609. [Google Scholar]
- Bennett, D.; Angove, M.J.; Wells, J.D.; Johnson, B.B.; Baldwin, D. Characterisation of bushfire residues and their leachates, 3rd Australian New Zealand Soil Conference, SuperSoil 2004, 5–9 December 2004, University of Sydney, Australia, Published on CDROM. Website. Available online: www.regional.org.au/au/asssi/ (accessed on 5 December 2004).
- Havers, N.; Burba, P.; Lambert, J.; Klockow, D. Spectroscopy Characterisation of Humic Like Substances in Airborne Particulate Matter. J. Atmos. Chem. 1998, 29, 45–54. [Google Scholar]
- Guo, V.; Bustin, R.M. FTIR spectroscopy and reflectance of modern charcoals and fungal decayed woods: Implications for studies of intertinite in coals. Int. J. Coal Geol. 1998, 37, 29–53. [Google Scholar]
- Enev, V.; Pospisilova, L.; Klucakova, M.; Liptaj, T.; Doskocil, L. Spectral characterization of selected Humicsubstances. Soil Water Res. 2014, 9, 9–17. [Google Scholar]
- Khare, P.; Baruah, B.P.; Rao, P.G. Water soluble organic compounds (WSOMs) in PM2.5 and PM10 at a subtropical site of India. Tellus 2011, 63, 990–1000. [Google Scholar]
- Senesi, N.; Tetsini, C.; Polemio, M. Chemical and spectroscopic characterization of soil organic matter fractions isolated by sequential extraction procedure. J. Soil Sci. 1983, 34, 801–813. [Google Scholar]
- Chatterjee, R.K.; Gupta, D.S. Clay minerals in some Western Uttar Pradesh soils. J. Ind. Soc. Soil Sci. 1970, 18, 391–396. [Google Scholar]
- Usher, C.R.; Michel, A.E.; Grassian, V.H. Reactions on mineral dust. Chem. Rev. 2003, 103, 4883–4939. [Google Scholar]
- White Joe, L. Interpretation of infrared spectra of soil minerals. Soil Sci. 1971, 112, 22–31. [Google Scholar]
- Rahn, K.A. Silicon and aluminium in atmospheric aerosols: Crust-air fractionation. Atmos. Environ. 1976, 10, 597–601. [Google Scholar]
- Lawson, D.R.; Winchester, J.W. Sulfur and crustal reference elements in non urban aerosols from Squaw mountain, Colorado. Environ. Sci. Technol. 1978, 12, 716–721. [Google Scholar]
- Jeong, G.Y.; Park, M.Y.; Kandler, K.; Nousiainen, T.; Kempinen, O. Mineralogical properties and internal structures of individual fine particles of Saharan dust. Atmos. Chem. Phys. 2016, 16, 12397–12410. [Google Scholar] [Green Version]
- Schiavon, N.; Zhou, L. Magnetic chemical and microscopical characterization of urban soiling on historical monuments. Environ. Sci. Technol. 1996, 30, 3624–3629. [Google Scholar]
- Torok, A.; Licha, T.; Simon, K.; Siegesmund, S. Urban and rural limestone weathering; the contribution of dust to black crust formation. Environ. Earth Sci. 2010, 63, 675–693. [Google Scholar] [CrossRef]
- Crist, R.H.; Oberhoser, K.; Shank, N.; Nguyen, M. Nature of bonding between metallic ions and algal cell walls. Environ. Sci.Technol. 1981, 15, 1212–1217. [Google Scholar]
- Dodson, J.K.; Aronson, J.M. Cell wall composition of Enteromorpha intestinalis. Bot. Mar. 1978, 21, 241–246. [Google Scholar]
- Chughtai, R.; Jassim, J.A.; Peterson, J.H.; Stedman, D.H.; Smith, D.M. Spectroscopic and solubility characteristics of oxidized soots. Aerosol Sci. Technol. 1991, 15, 112–126. [Google Scholar]
- Peng, P.; Zhao, J.; Song, J.; Ma, S. Humic acid, Kerogen and black carbon isolated from atmospheric Total Suspended Particulate from Gungzhoun China. Aerosol Sci. Technol. 2013, 47, 1342–1352. [Google Scholar]
- Perry, T.D.; Duckworth, O.W.; McNamara, C.J.; Martin, S.T.; Mitchell, R. Effects of the Biologically Produced Polymer Alginic acid on Macroscopic and Microscopic Calcite Dissolution Rates. Environ. Sci. Technol. 2004, 38, 3040–3046. [Google Scholar]
- Sand, W.; Jozsa, P.G.; Mansch, R. Environmental Microbiology; G. Briton Ltd.: New York, NY, USA, 2002; Volume 6, pp. 3364–3375. [Google Scholar]
- Jiminez, C.S.; Hermosin, B. Black crusts in the European built environment. Corr. Rev. 2004, 22, 381–393. [Google Scholar]
- Dutta, T.; Sarkar, R.; Pakhira, B.; Ghosh, S.; Sarkar, R.; Barui, A.; Sarkar, S. ROS generation by reduced graphene oxide (rGO) induced by visible light showing antibacterial activity: Comparison with graphene oxide (GO). RSC Adv. 2015, 5, 80192–80195. [Google Scholar]
- Sonkar, S.K.; Tripathi, S.; Sarkar, S. Activation of aerial oxygen to superoxide radical by carbon nano tubes in indoor spider web trapped aerosol. Curr. Sci. 2009, 97, 1227–1230. [Google Scholar]
- Tripathi, K.M.; Singh, A.; Bhati, A.; Sarkar, S.; Sonkar, S.K. Sustainable Feasibility of the Environmental Pollutant Soot to Few-Layer Photoluminescent Graphene Nanosheets for Multifunctional Applications. ACS Sustain. Chem. Eng. 2016, 4, 6399–6408. [Google Scholar]
- Available online: https://www.downtoearth.org.in/news/environment/behind-intense-dust-storms-in-north-west-india-lies-withered-aravallis-60873 (accessed on 19 June 2018).
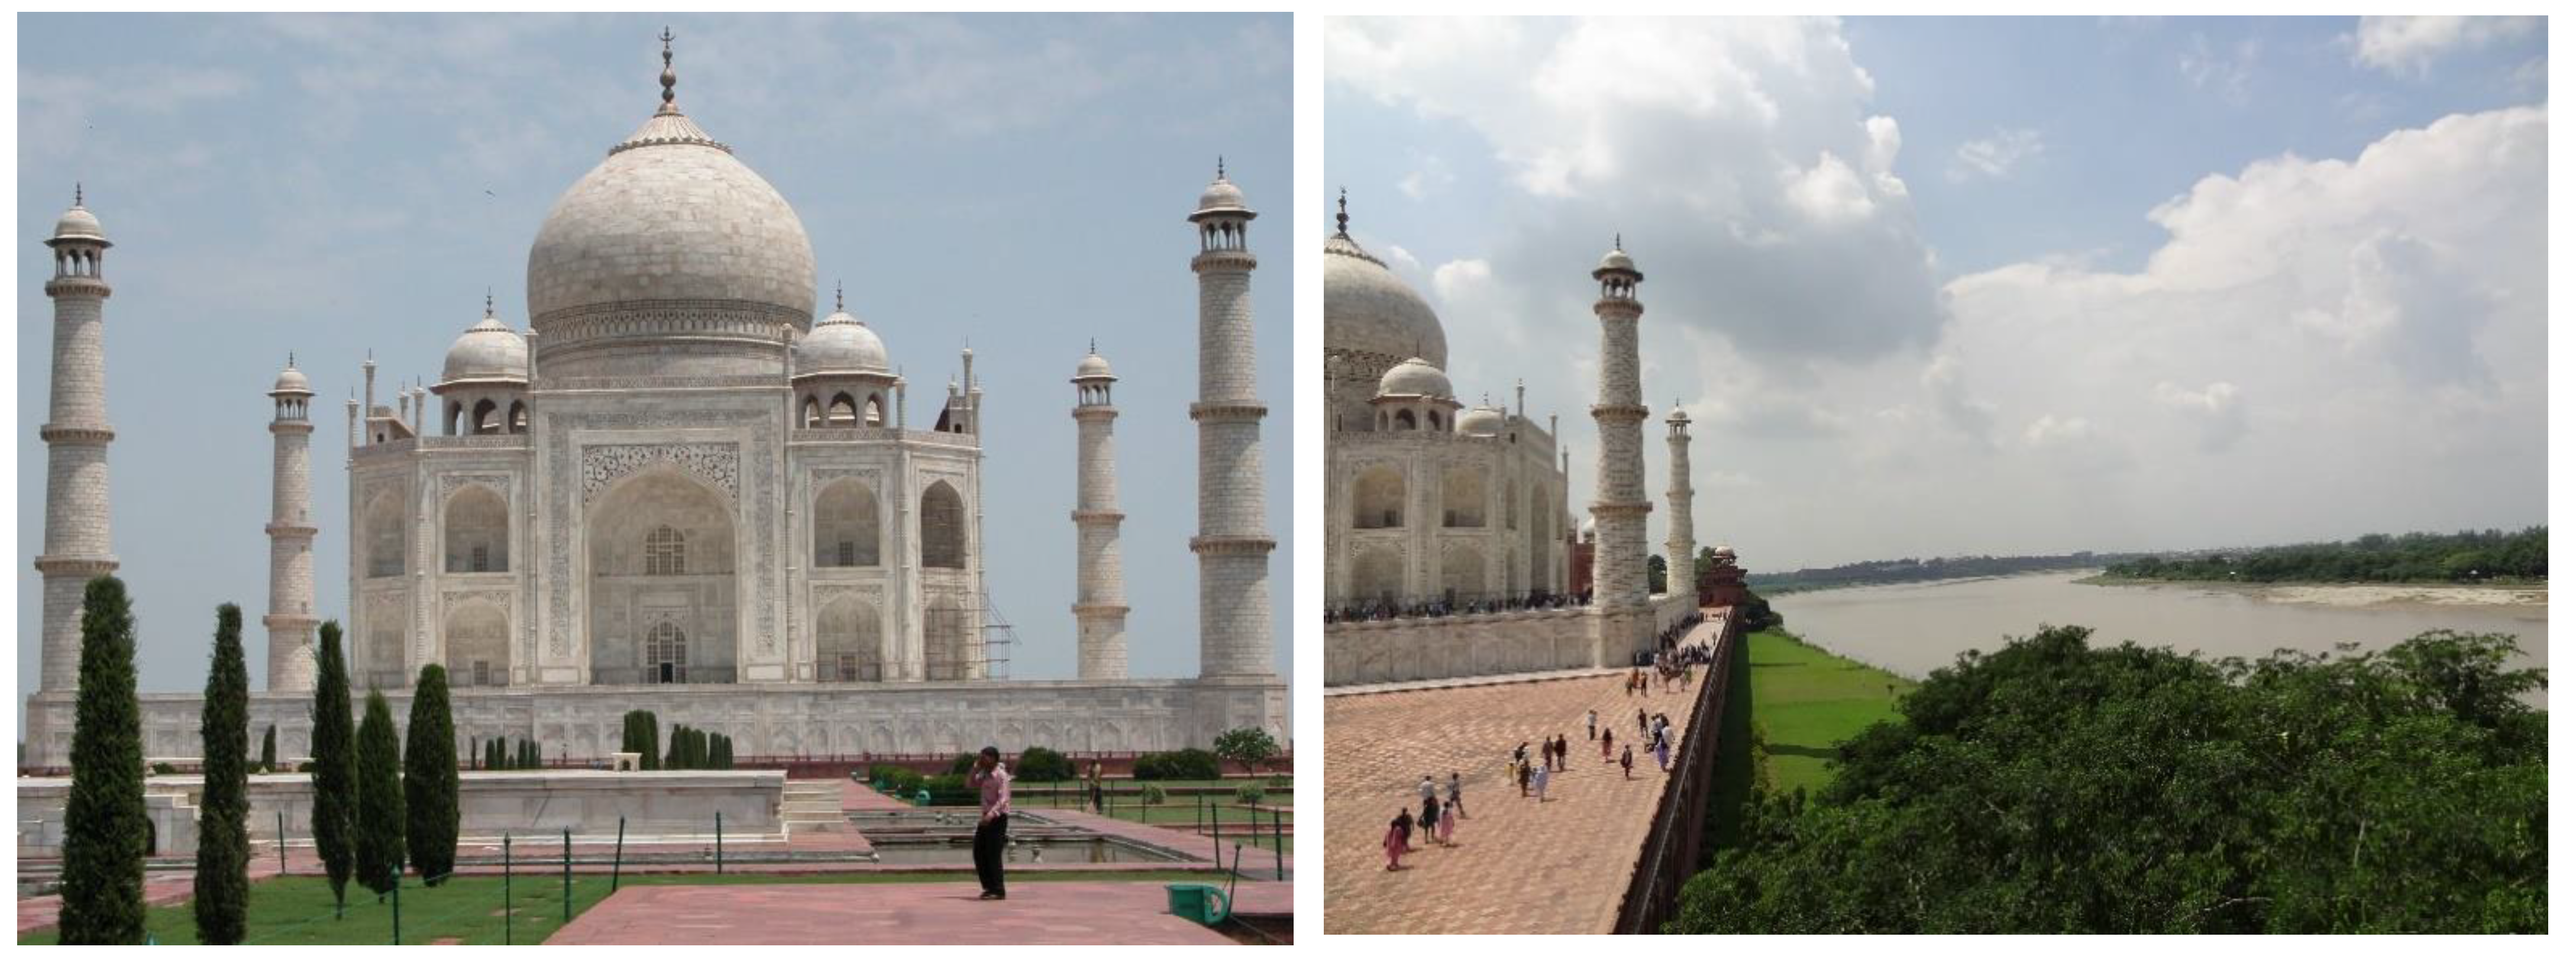
Figure 1.
Taj Mahal (UNESCO World Heritage): front view and side view on the bank of the river Yamuna, at Agra, India.
Figure 1.
Taj Mahal (UNESCO World Heritage): front view and side view on the bank of the river Yamuna, at Agra, India.

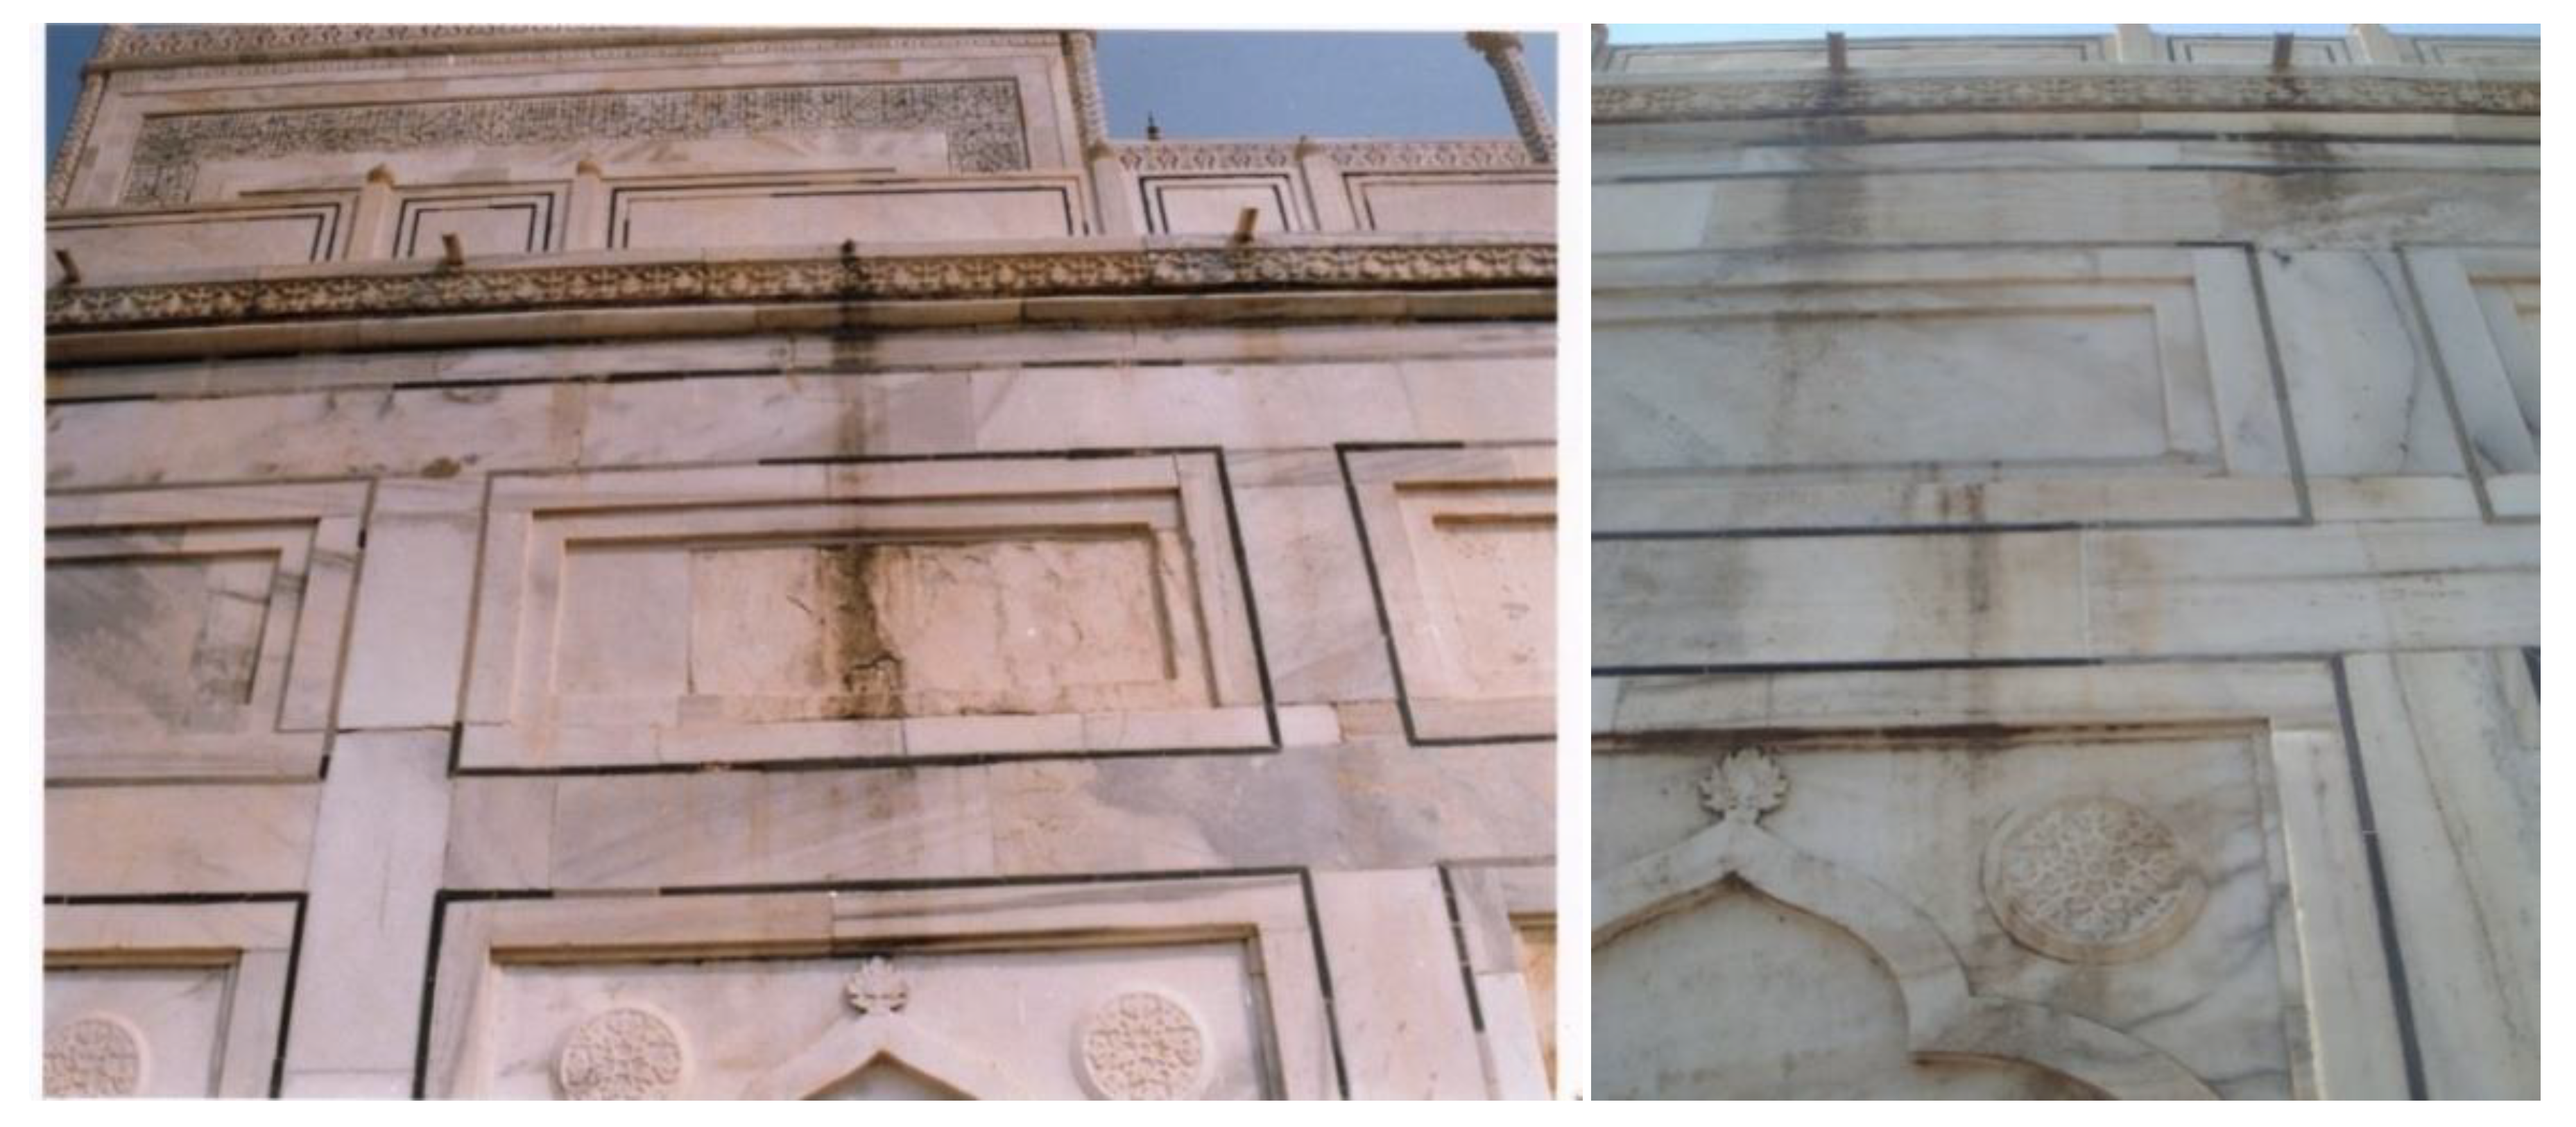
Figure 2.
Areas near water spouts exhibiting black crust zones on the Taj Mahal.

Figure 3.
XRD of summer dust.

Figure 4.
XRD of winter dust.

Figure 5.
XRD of composite dust.

Figure 6.
XRD of fresh marble used in conservation.

Figure 7.
XRD spectra of marble with black crust.

Figure 8.
FTIR spectra of (a) marble with black crust, and (b) organic content of the marble black crust.
Figure 8.
FTIR spectra of (a) marble with black crust, and (b) organic content of the marble black crust.

Figure 9.
FTIR spectrum of blue-green algae.

Figure 10.
FTIR spectra of the (a) summer, (b) rainy season, and (c) winter season water-soluble fractions of aerosols.
Figure 10.
FTIR spectra of the (a) summer, (b) rainy season, and (c) winter season water-soluble fractions of aerosols.


Figure 11.
Scanning electron microscopy (SEM) image of (a) algal growth on marble and (b) algae, and (c) the energy dispersive spectroscopy(EDS) spectrum of algae.
Figure 11.
Scanning electron microscopy (SEM) image of (a) algal growth on marble and (b) algae, and (c) the energy dispersive spectroscopy(EDS) spectrum of algae.

Figure 12.
(a) SEM image of fresh marble (marble used in conservation); (b) EDS spectrum, (c) element analysis data from EDS
Figure 12.
(a) SEM image of fresh marble (marble used in conservation); (b) EDS spectrum, (c) element analysis data from EDS

Figure 13.
(a,b) Scanning electron microscopy (SEM) images of Taj Mahal marble black crust, and (c) EDS spectra with (d) elemental anlysis
Figure 13.
(a,b) Scanning electron microscopy (SEM) images of Taj Mahal marble black crust, and (c) EDS spectra with (d) elemental anlysis

Figure 14.
(a,b) Scanning electron microscopy (SEM) and (c) energy dispersive spectroscopy(EDS) spectrum of composite airborne dust (d) elemenatal anlysis
Figure 14.
(a,b) Scanning electron microscopy (SEM) and (c) energy dispersive spectroscopy(EDS) spectrum of composite airborne dust (d) elemenatal anlysis

Figure 15.
Transmission electron microscopy (TEM) images: Left side: low resolution showing the presence of assorted nano carbon particles of different shapes and sizes. Right side: a focused zoomed resolution image showing the nano carbon particles (black dense spots) of less than a 5 nm size.
Figure 15.
Transmission electron microscopy (TEM) images: Left side: low resolution showing the presence of assorted nano carbon particles of different shapes and sizes. Right side: a focused zoomed resolution image showing the nano carbon particles (black dense spots) of less than a 5 nm size.


Table 1.
XRD data of summer dust.
| d Å Std | d Å Exp | PDF Card no | Mineral Component |
|---|---|---|---|
| 7.12 | 7.79 | 78-2110 | Kaolinite, Al4(OH)8Si4O10 |
| 7.07 | 6.97 | 13-3 | Chlorite, Mg2Al3(Si3Al)O10(O8) |
| 6.39 | 6.31 | 9-458, 003-0016 | Plagioclase Feldspar, NaAlSi3O8-CaAl2Si2O8 Montmorillonite, (6.5)(NaCa)O3(AlMg)2Si4O10(OH)2nH2O |
| 4.26 | 4.28 | 19-926 | Microcline, KAlSi3O8 (Potassium Aluminium Silicate) |
| 3.34 | 3.32 | 46-1045 | Quartz, SiO2 |
| 3.24 | 3.23 | 19-931 | Orthoclase Feldspar, KAlSi3O8 Montmorillonite, (3.25) (NaCa)O,3(AlMg)2Si4O10(OH)2nH2O |
| 3.03 | 3.01 | 05-0586 | Calcite, CaCO3 |
| 2.7 | 2.75 | 33-0664 | Hematite, Fe2O3 |
Table 2.
XRD data of winter dust.
| d Å Std | d Å Exp | PDF Card no | Mineral Component |
|---|---|---|---|
| 7.12 | 7.5 | 78-2110 | Kaolinite Al4(OH)8Si4O10 |
| 5.16 | 5.16 | 003-0016 | Montmorillonite (NaCa)O,3(AlMg)2Si4O10(OH)2nH2O |
| 4.72 | 4.75 | 13-3 | Chlorite Mg2Al3(Si3Al)O10(O8) |
| 4.48 | 4.34 | 31-968 | IlliteKAl2(Si3AlO10)(OH)2 |
| 4.22 | 4.22 | 19-926 | Microcline KAlSi3O8 (Potassium Aluminum Silicate) |
| 3.34 | 3.32 | 46-1045 | Quartz SiO2 |
| 3.03 | 3.32 | 05-0586 | Calcite CaCO3 |
| 3.34 | 3.32 | 31-968 | Illite (KAl2(Si3AlO10)(OH)2) |
| 2.7 | 2.85 | 33-0664 | Hematite Fe2O3 |
| 2.53 | 2.4 | 46-1045 | Quartz SiO2 |
| 1.69 | 1.66 | 33-0664 | Hematite Fe2O3 |
Table 3.
XRD data of composite dust.
| d Å Std | DÅ Exp | PDF Card no. | Mineral Component |
|---|---|---|---|
| 12.0 | 12.23 | Mixed layer silicates | |
| 10 | 10.4 | 31-968 | IlliteKAl2(Si3Al10)(OH)2 |
| 6.5 | 6.8 | 003-0016 | Montmorillonite (NaCa)O.3(AlMg)2SiO10(OH)2nH2O |
| 7.12 | 7.23 | 78-2110 | Kaolinite Al4(OH)8Si4O10 |
| 5.0 | 5.17 | 31-968,003-0016 | IlliteKAl2(SiAlO10)(OH)2, Montmorillonite (AlMg)2(Si4O10)(OH)2nH2O |
| 4.7 | 4.7 | 13-3 | Chlorite Mg2Al3(SIAl)O10(O8) |
| 4.2 | 4.36 | 19-926/46-1045 | Microcline KAlSi3O8/Quartz SiO2(4.42) |
| 4.22 | 4.20 | 19-926 | Microcline KAlSi3O8 (PotasiumAluminium- Silicate) |
| 3.66 | 3.66 | 20-554 | Albite NaAlSi3O8 |
| 3.34 | 3.31 | 46-1045 | Quartz SiO2 |
| 3.03 | 3.00 | 05-0586 | Calcite CaCO3 |
| 2.95 | 2.95 | 19-926 | Microcline KAlSi3O8 |
| 2.70 | 2.68 | 33-0664 | Hematite Fe2O3 |
| 2.53 | 2.53 | 76-1849 | Magnetite Fe3O4 |
| 2.51 | 2.50 | 33-0664 | Hematite Fe2O3 |
| 2.49 | 2.47 | 05-0586 | Calcite CaCO3 |
| 2.28 | 2.29 | 05-0586 | Calcite CaCO3 |
Table 4.
XRD of fresh marble and marble with black crust.
| Sample | d ÅStd | d ÅExp | PDF Card no | Mineral Component |
|---|---|---|---|---|
| fresh marble | 2.45 | 2.49 | 05-0586 | CaCO3 |
| 2.27 | 2.28 | 05-0586 | ||
| 2.10 | 2.09 | 05-0586 | ||
| 1.90 | 1.91 | 05-0586 | ||
| 1.87 | 1.87 | 05-0586 | ||
| Marble with black crust | 12.0 | 11.79 | Mixed layer clays | |
| 10.02 | 10.32 | 31-968 | Illite,KAl2(Si3AlO10)(OH)2 | |
| 5.93 | 5.93 | 75-1313 | Calcium oxalate hydrate (Whewellite), CaC2O4H2O | |
| 5.02 | 5.08 | 31-968 | Illite,KAl2(Si3AlO10)(OH)2 | |
| 4.91 | 4.98 | 31-968 | Illite,KAl2(Si3AlO10)(OH)2 | |
| 4.33 | 4.33 | 15-20 | Calcium carbonate hydrate, CaCO3H2O | |
| 3.57 | 3.58 | 78-2110 | Kaolinite, Al4(OH)8Si4O10 | |
| 3.03 | 3.01 | 05-0586 | Calcite, CaCO3 | |
| 2.9 | 2.86 | 33-282 | Ankerite,Ca(FeMg)(CO3) | |
| 2.63 | 2.66 | 15-20 | Calcium carbonate hydrate, CaCO3H2O | |
| 2.53 | 2.56 | 19-629 | Magnetite, Fe3O4 | |
| 2.45 | 2.45 | 46-1045 | Quartz, SiO2 | |
| 2.08 | 2.08 | 05-0586 | Calcite CaCO3 | |
| 1.91 | 1.91 | 05-0586 | Calcite CaCO3 | |
| 1.87 | 1.86 | 05-0586,33-0664 | Calcite CaCO3,Fe2O3,(1.83) |
© 2019 by the authors. Licensee MDPI, Basel, Switzerland. This article is an open access article distributed under the terms and conditions of the Creative Commons Attribution (CC BY) license (http://creativecommons.org/licenses/by/4.0/).
Share and Cite
MDPI and ACS Style
Banerjee, D.; Sarkar, S. Chemical and Biochemical Onslaught of Anthropogenic Airborne Species on the Heritage Monument of the Taj Mahal. Heritage 2019, 2, 2137-2159. https://doi.org/10.3390/heritage2030129
AMA Style
Banerjee D, Sarkar S. Chemical and Biochemical Onslaught of Anthropogenic Airborne Species on the Heritage Monument of the Taj Mahal. Heritage. 2019; 2(3):2137-2159. https://doi.org/10.3390/heritage2030129
Chicago/Turabian StyleBanerjee, Deepankar, and Sabyasachi Sarkar. 2019. "Chemical and Biochemical Onslaught of Anthropogenic Airborne Species on the Heritage Monument of the Taj Mahal" Heritage 2, no. 3: 2137-2159. https://doi.org/10.3390/heritage2030129