Potential Driven Non-Reactive Phase Transitions of Ordered Porphyrin Molecules on Iodine-Modified Au(100): An Electrochemical Scanning Tunneling Microscopy (EC-STM) Study


Abstract
:
1. Introduction
2. Materials and Methods
- for the base vector of the Au(100) lattice (x = 1,2);
- and for the base vectors of the iodine lattice (x = 1,2); and,
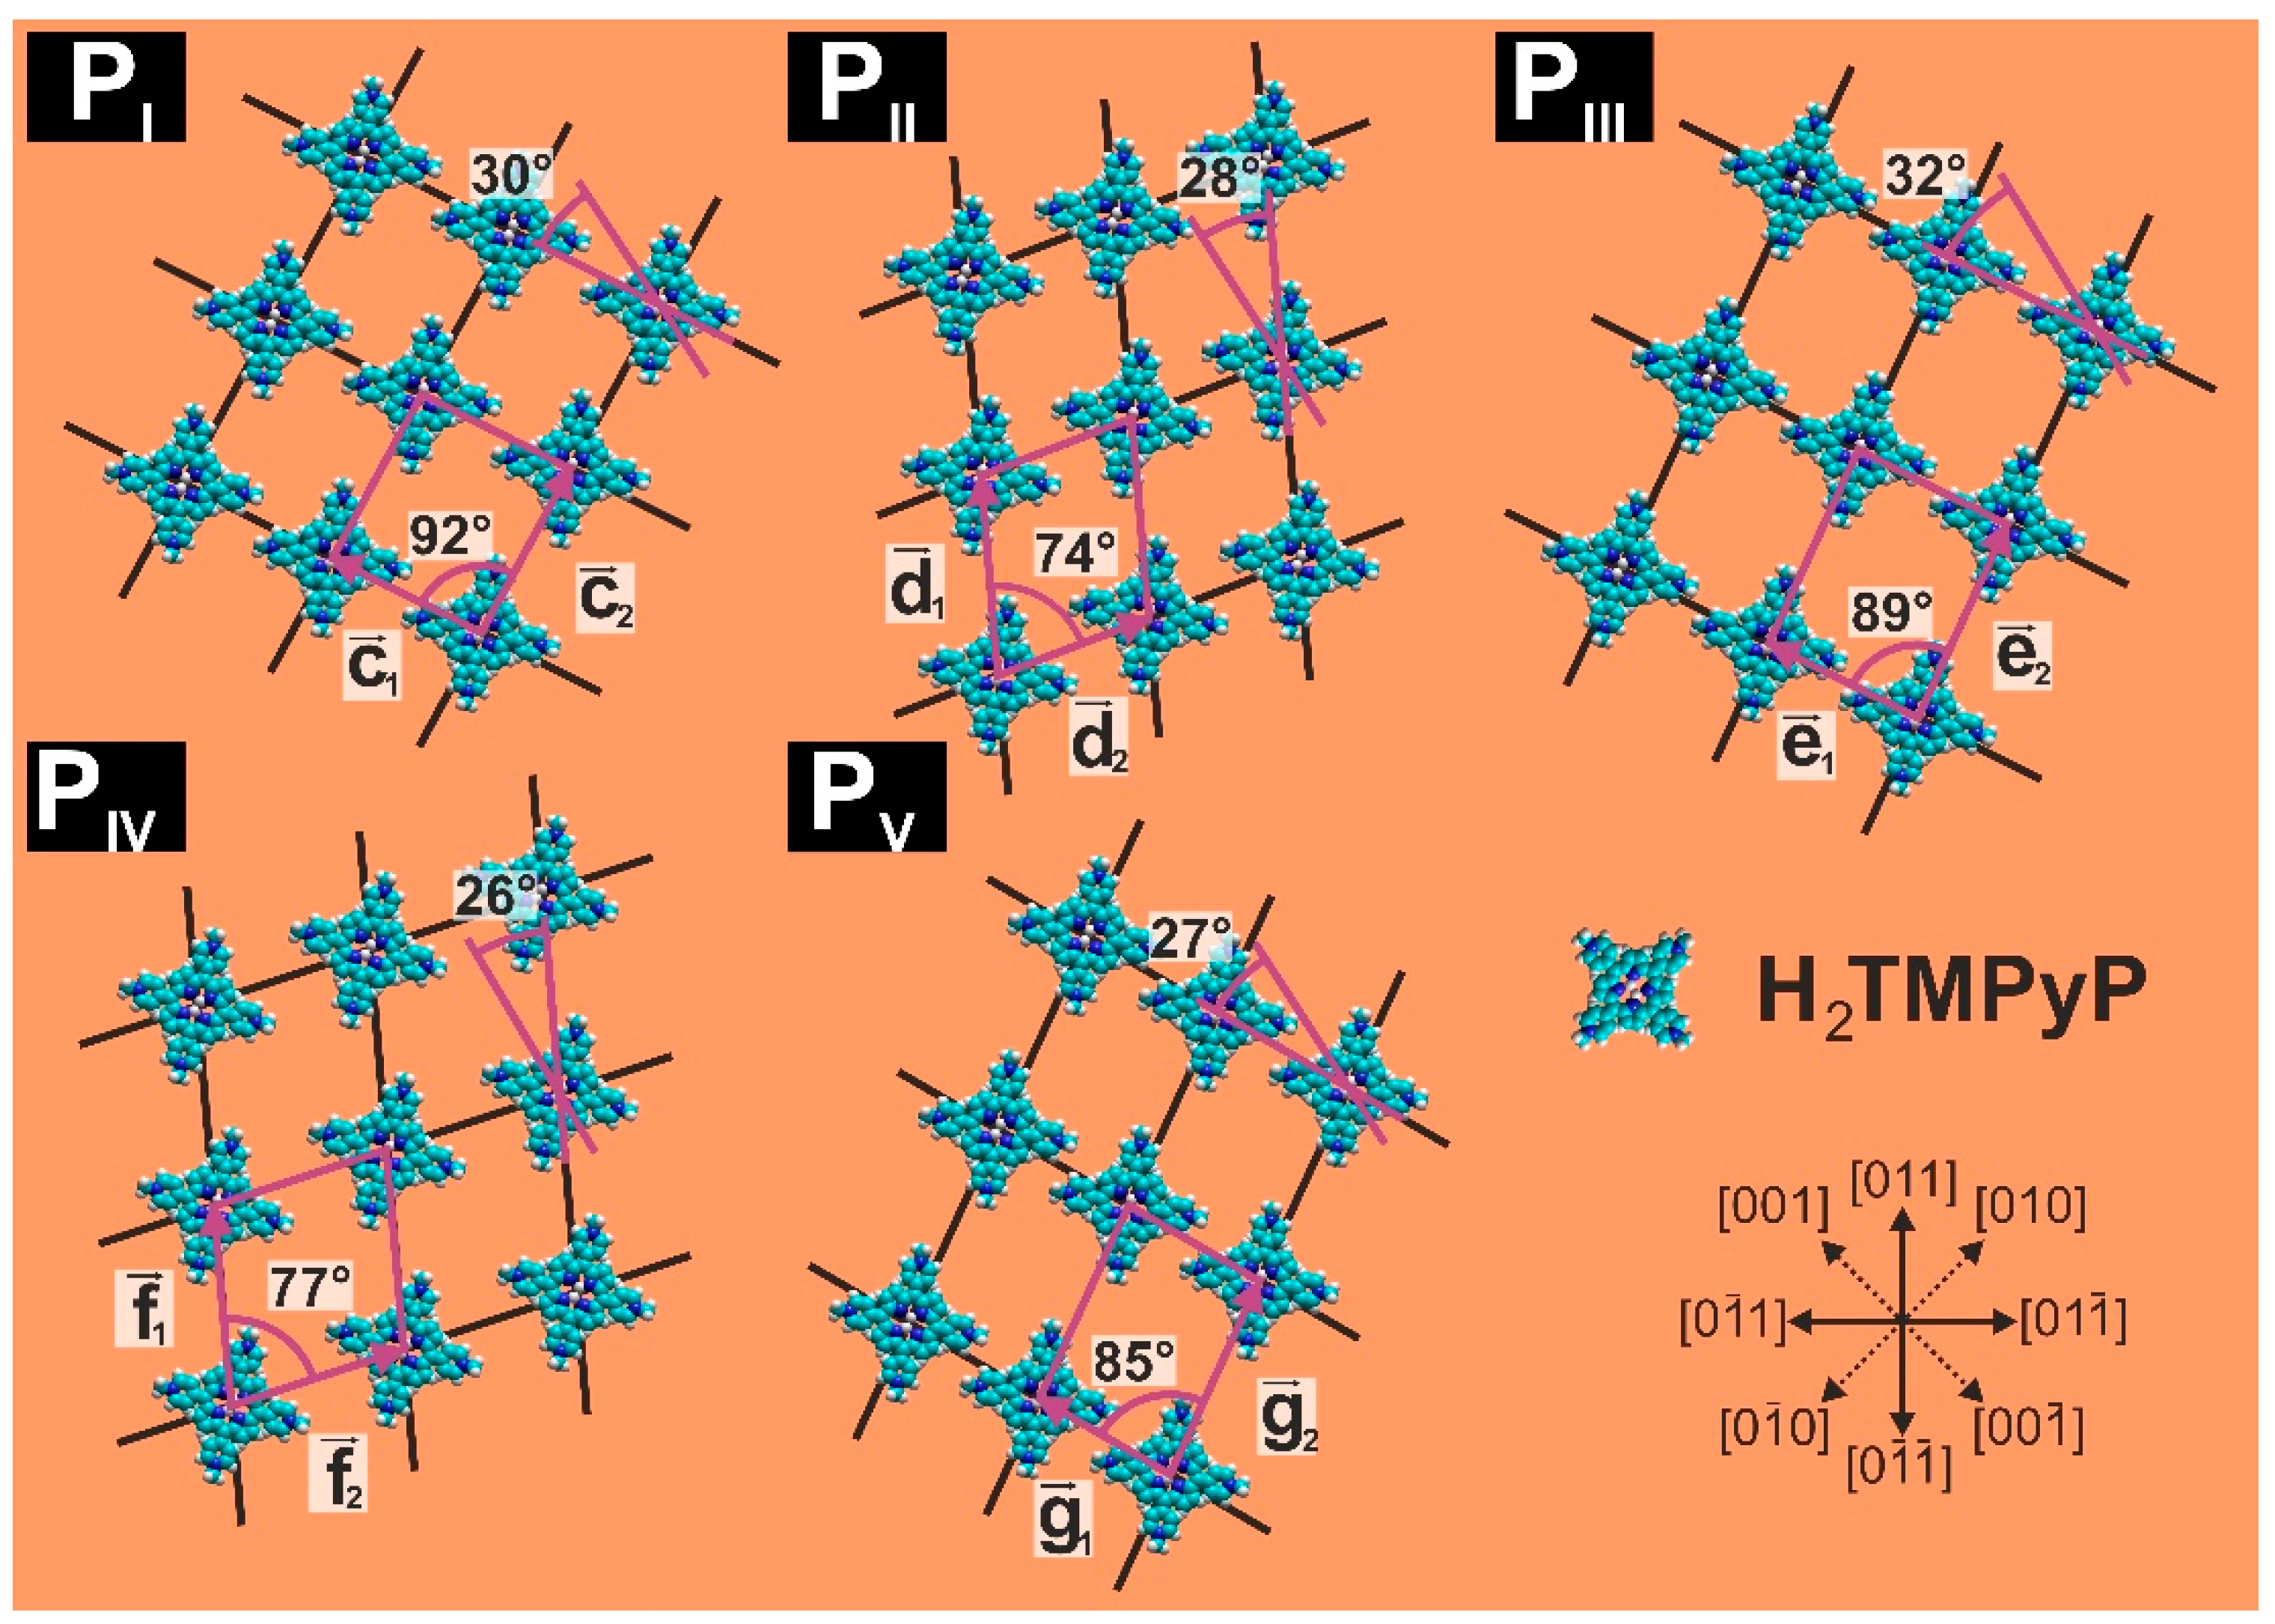
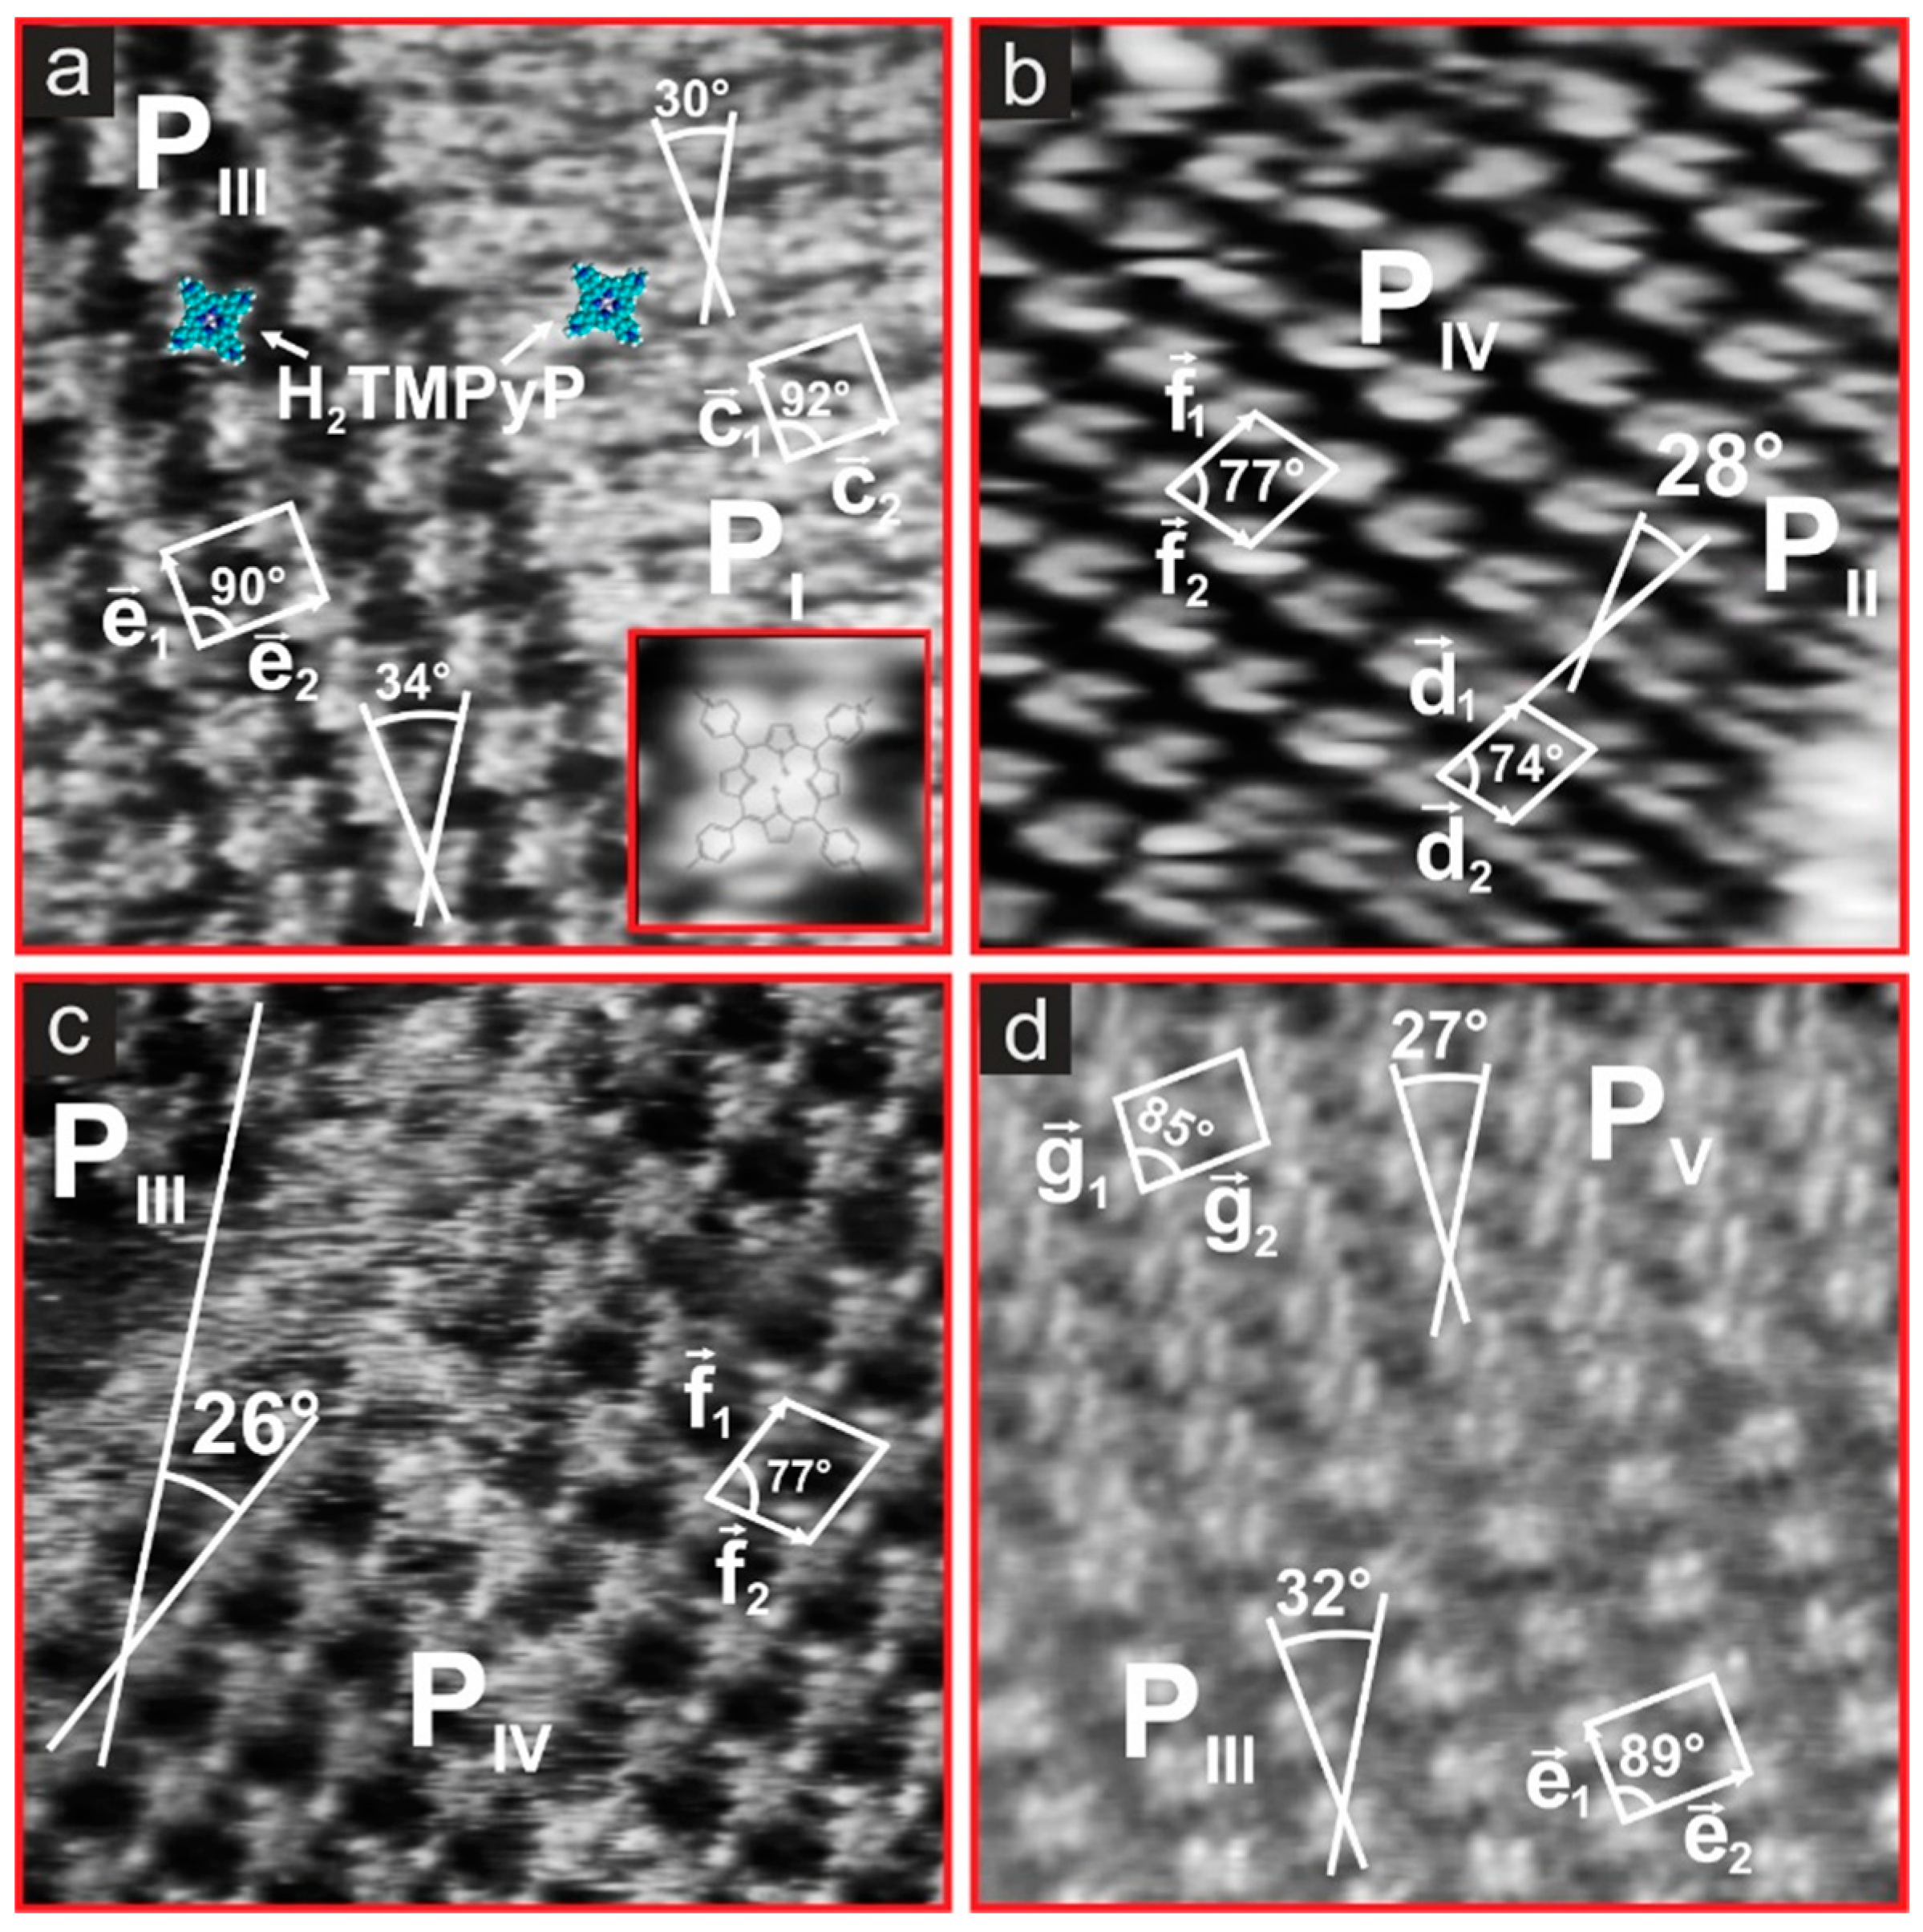
- ,, , and for the base vectors of the porphyrin phases PI–PV (x = 1,2).
3. Results and Discussion
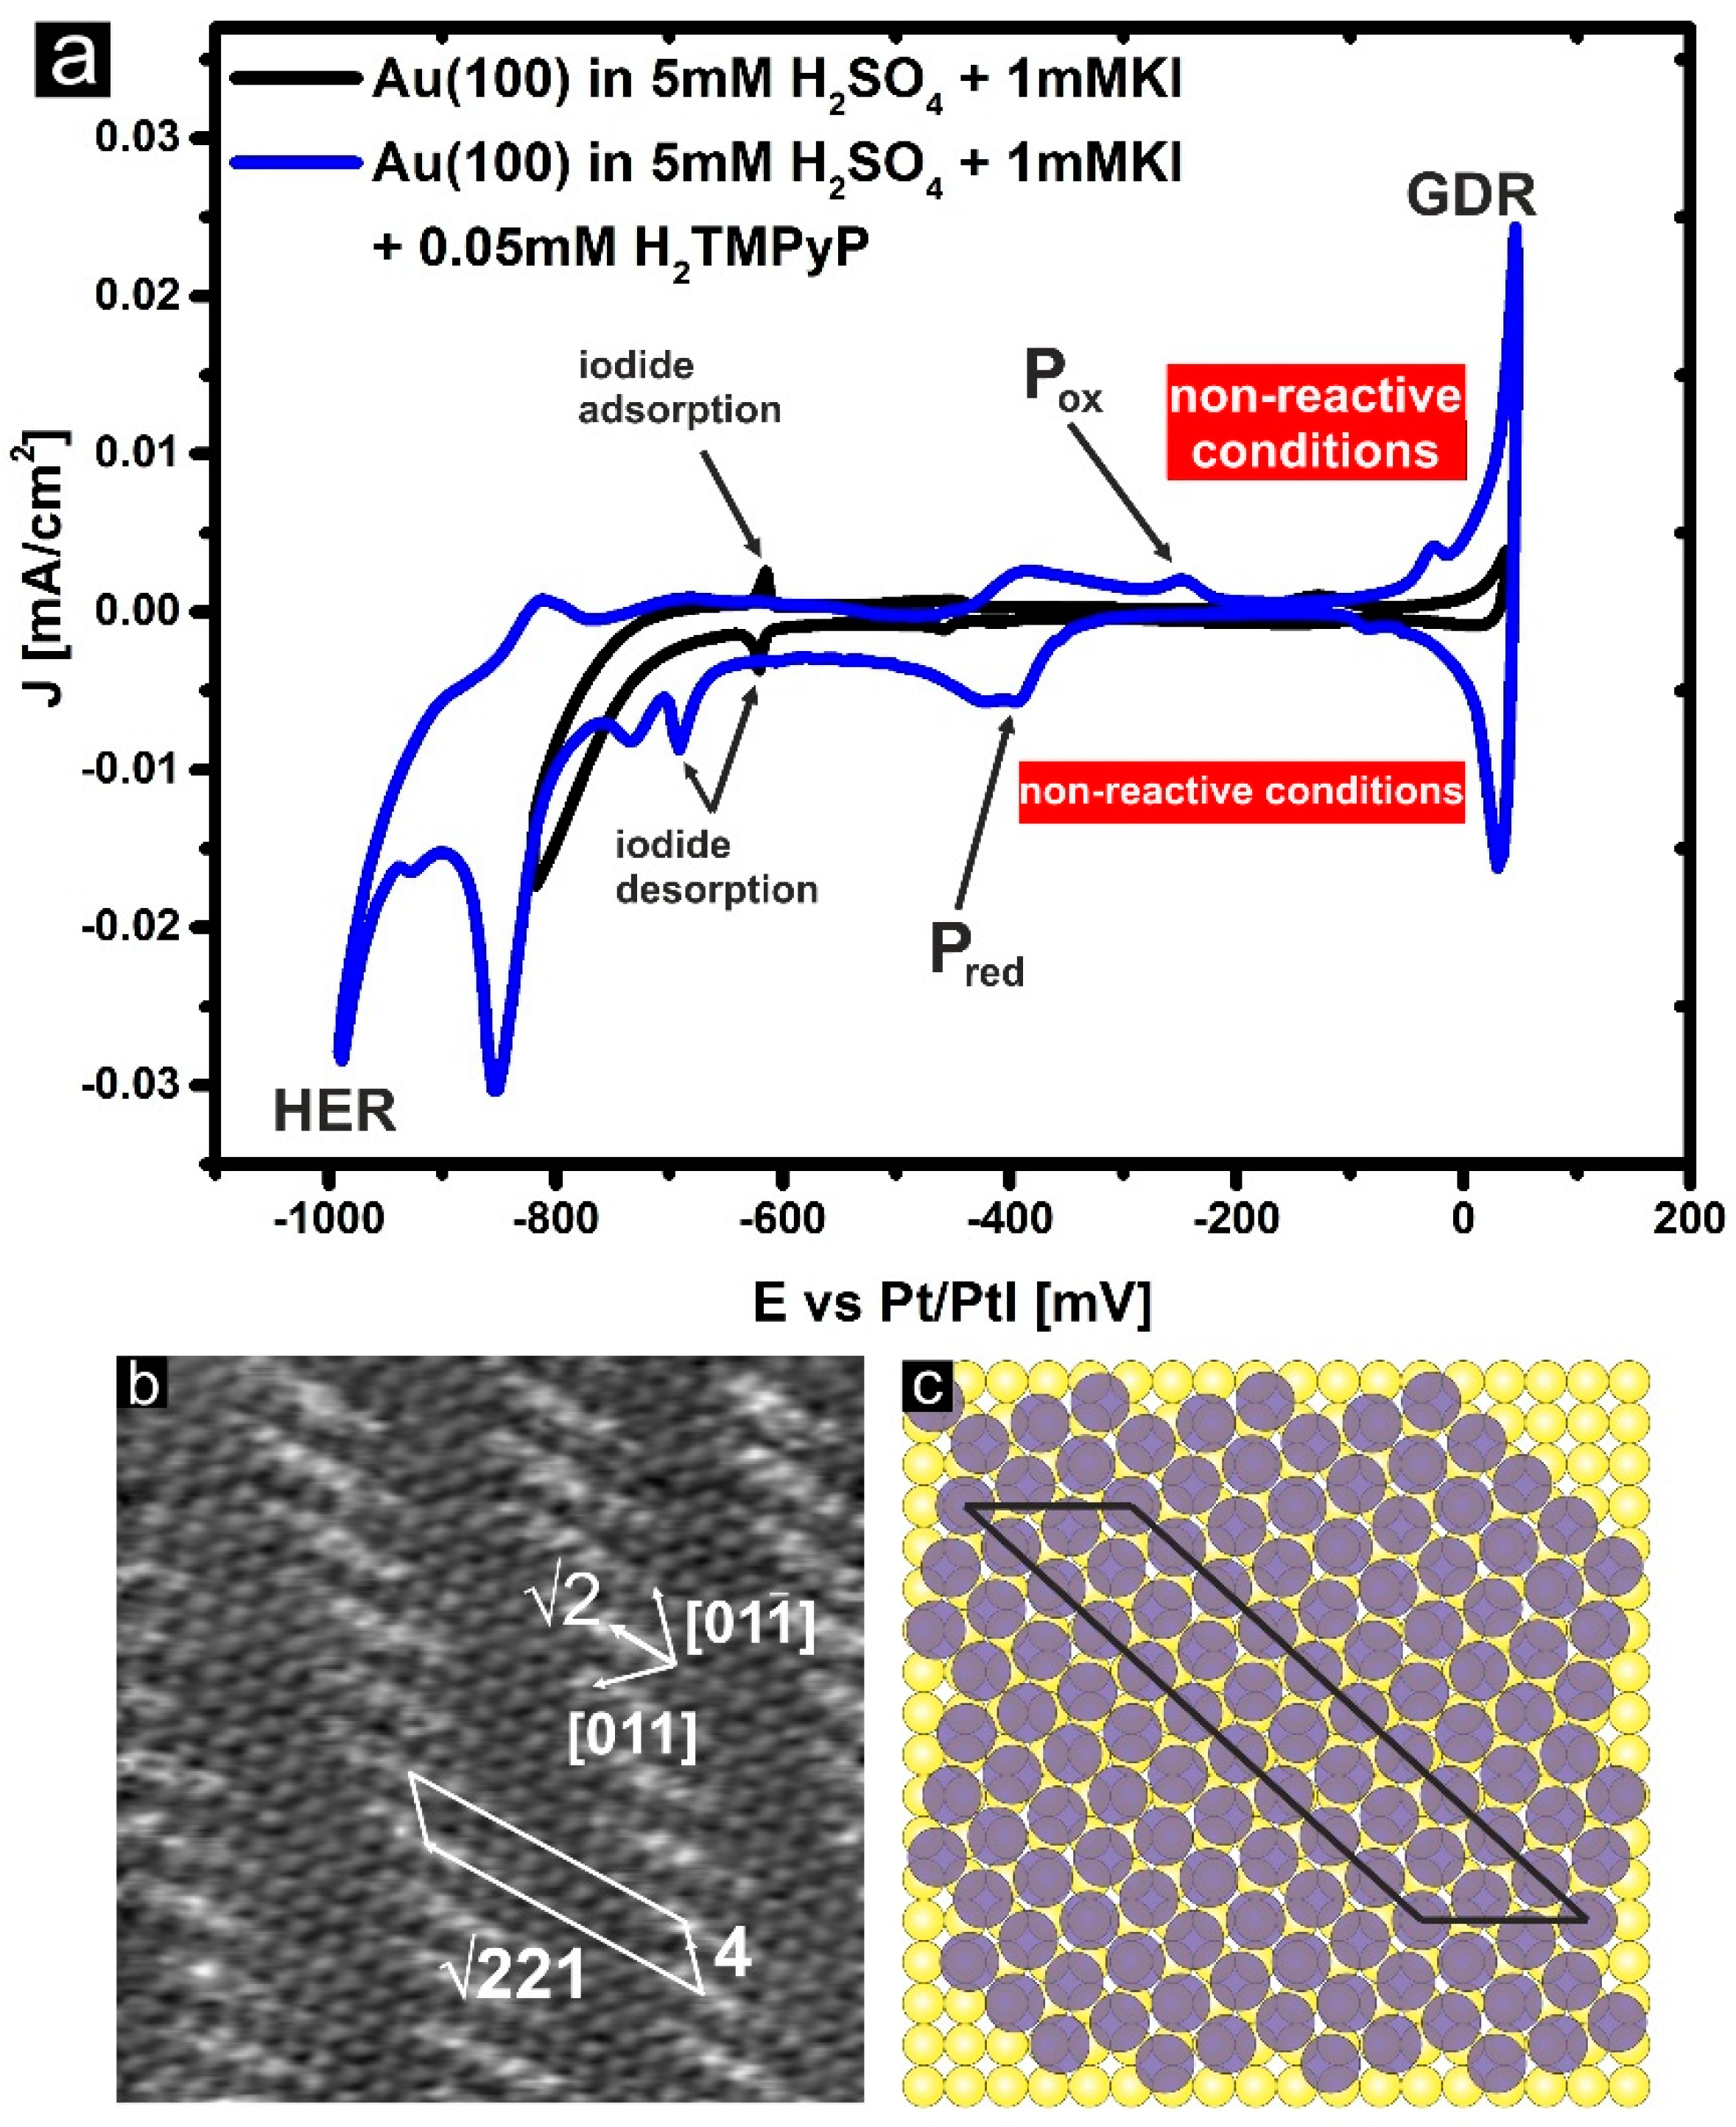
3.1. Cyclic Voltammetry and H2TMPyP Structures
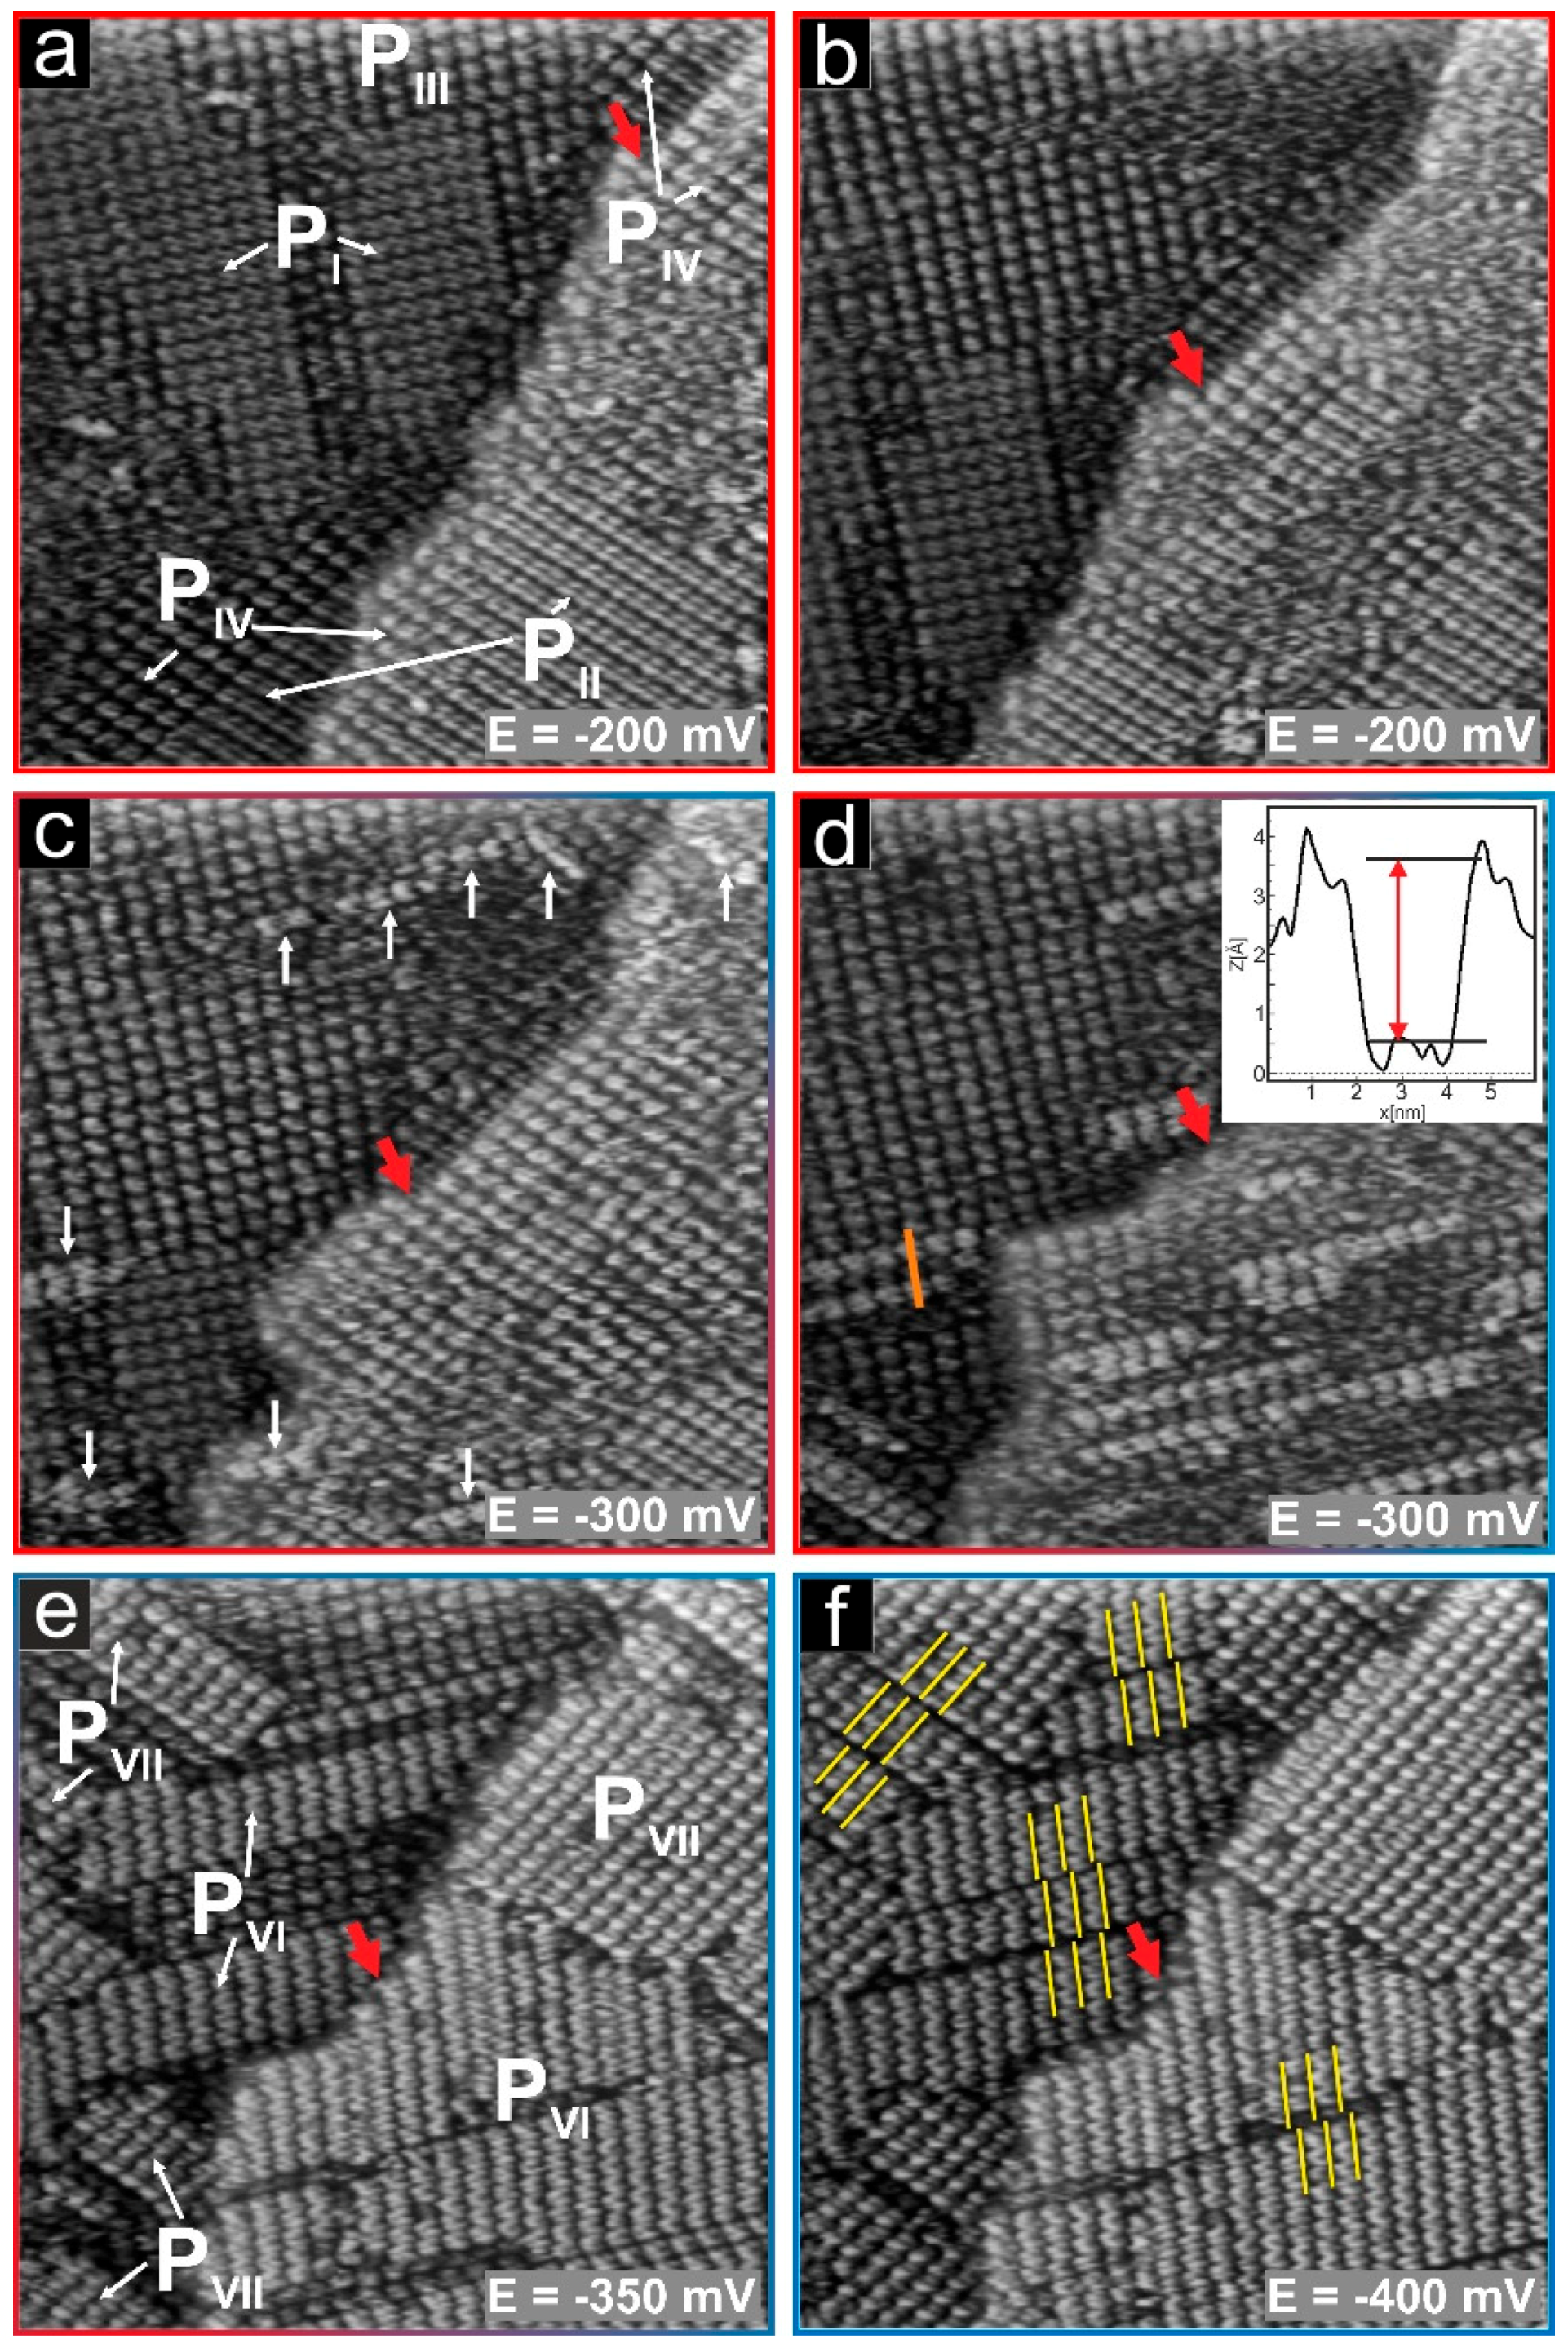
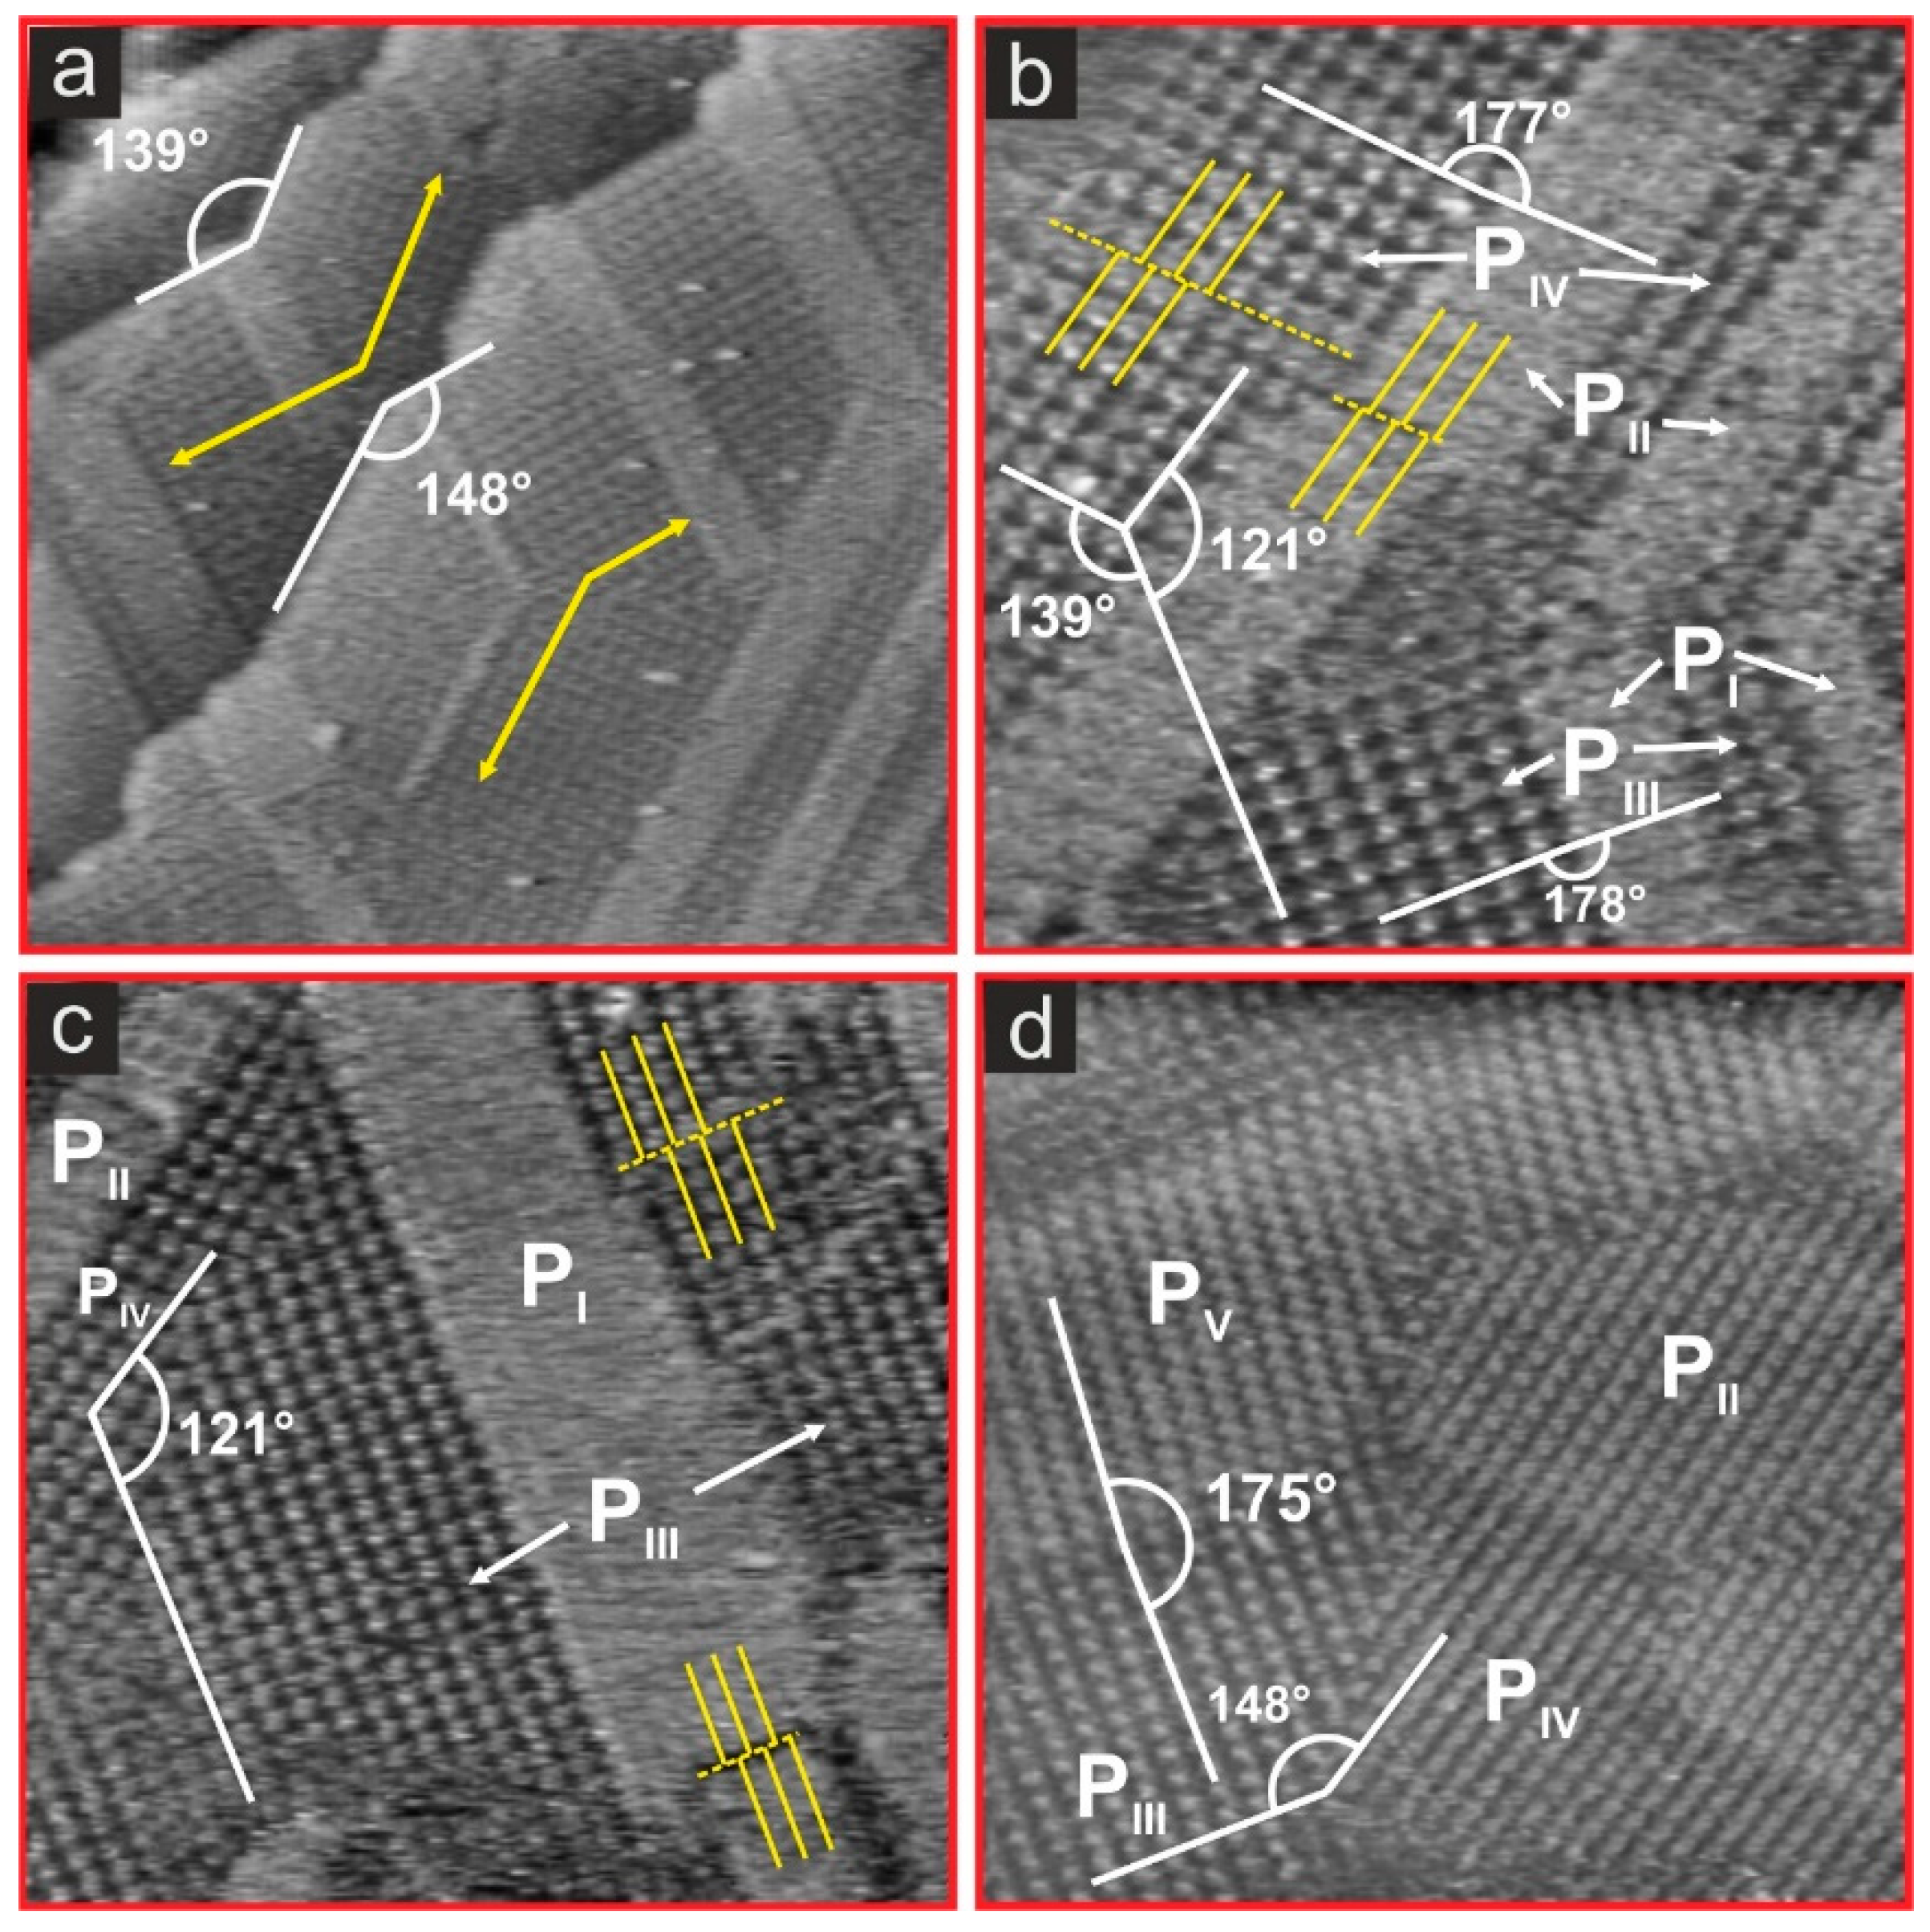
3.2. Electrode Potential Stability of H2TMPyP Phases on I/Au(100)
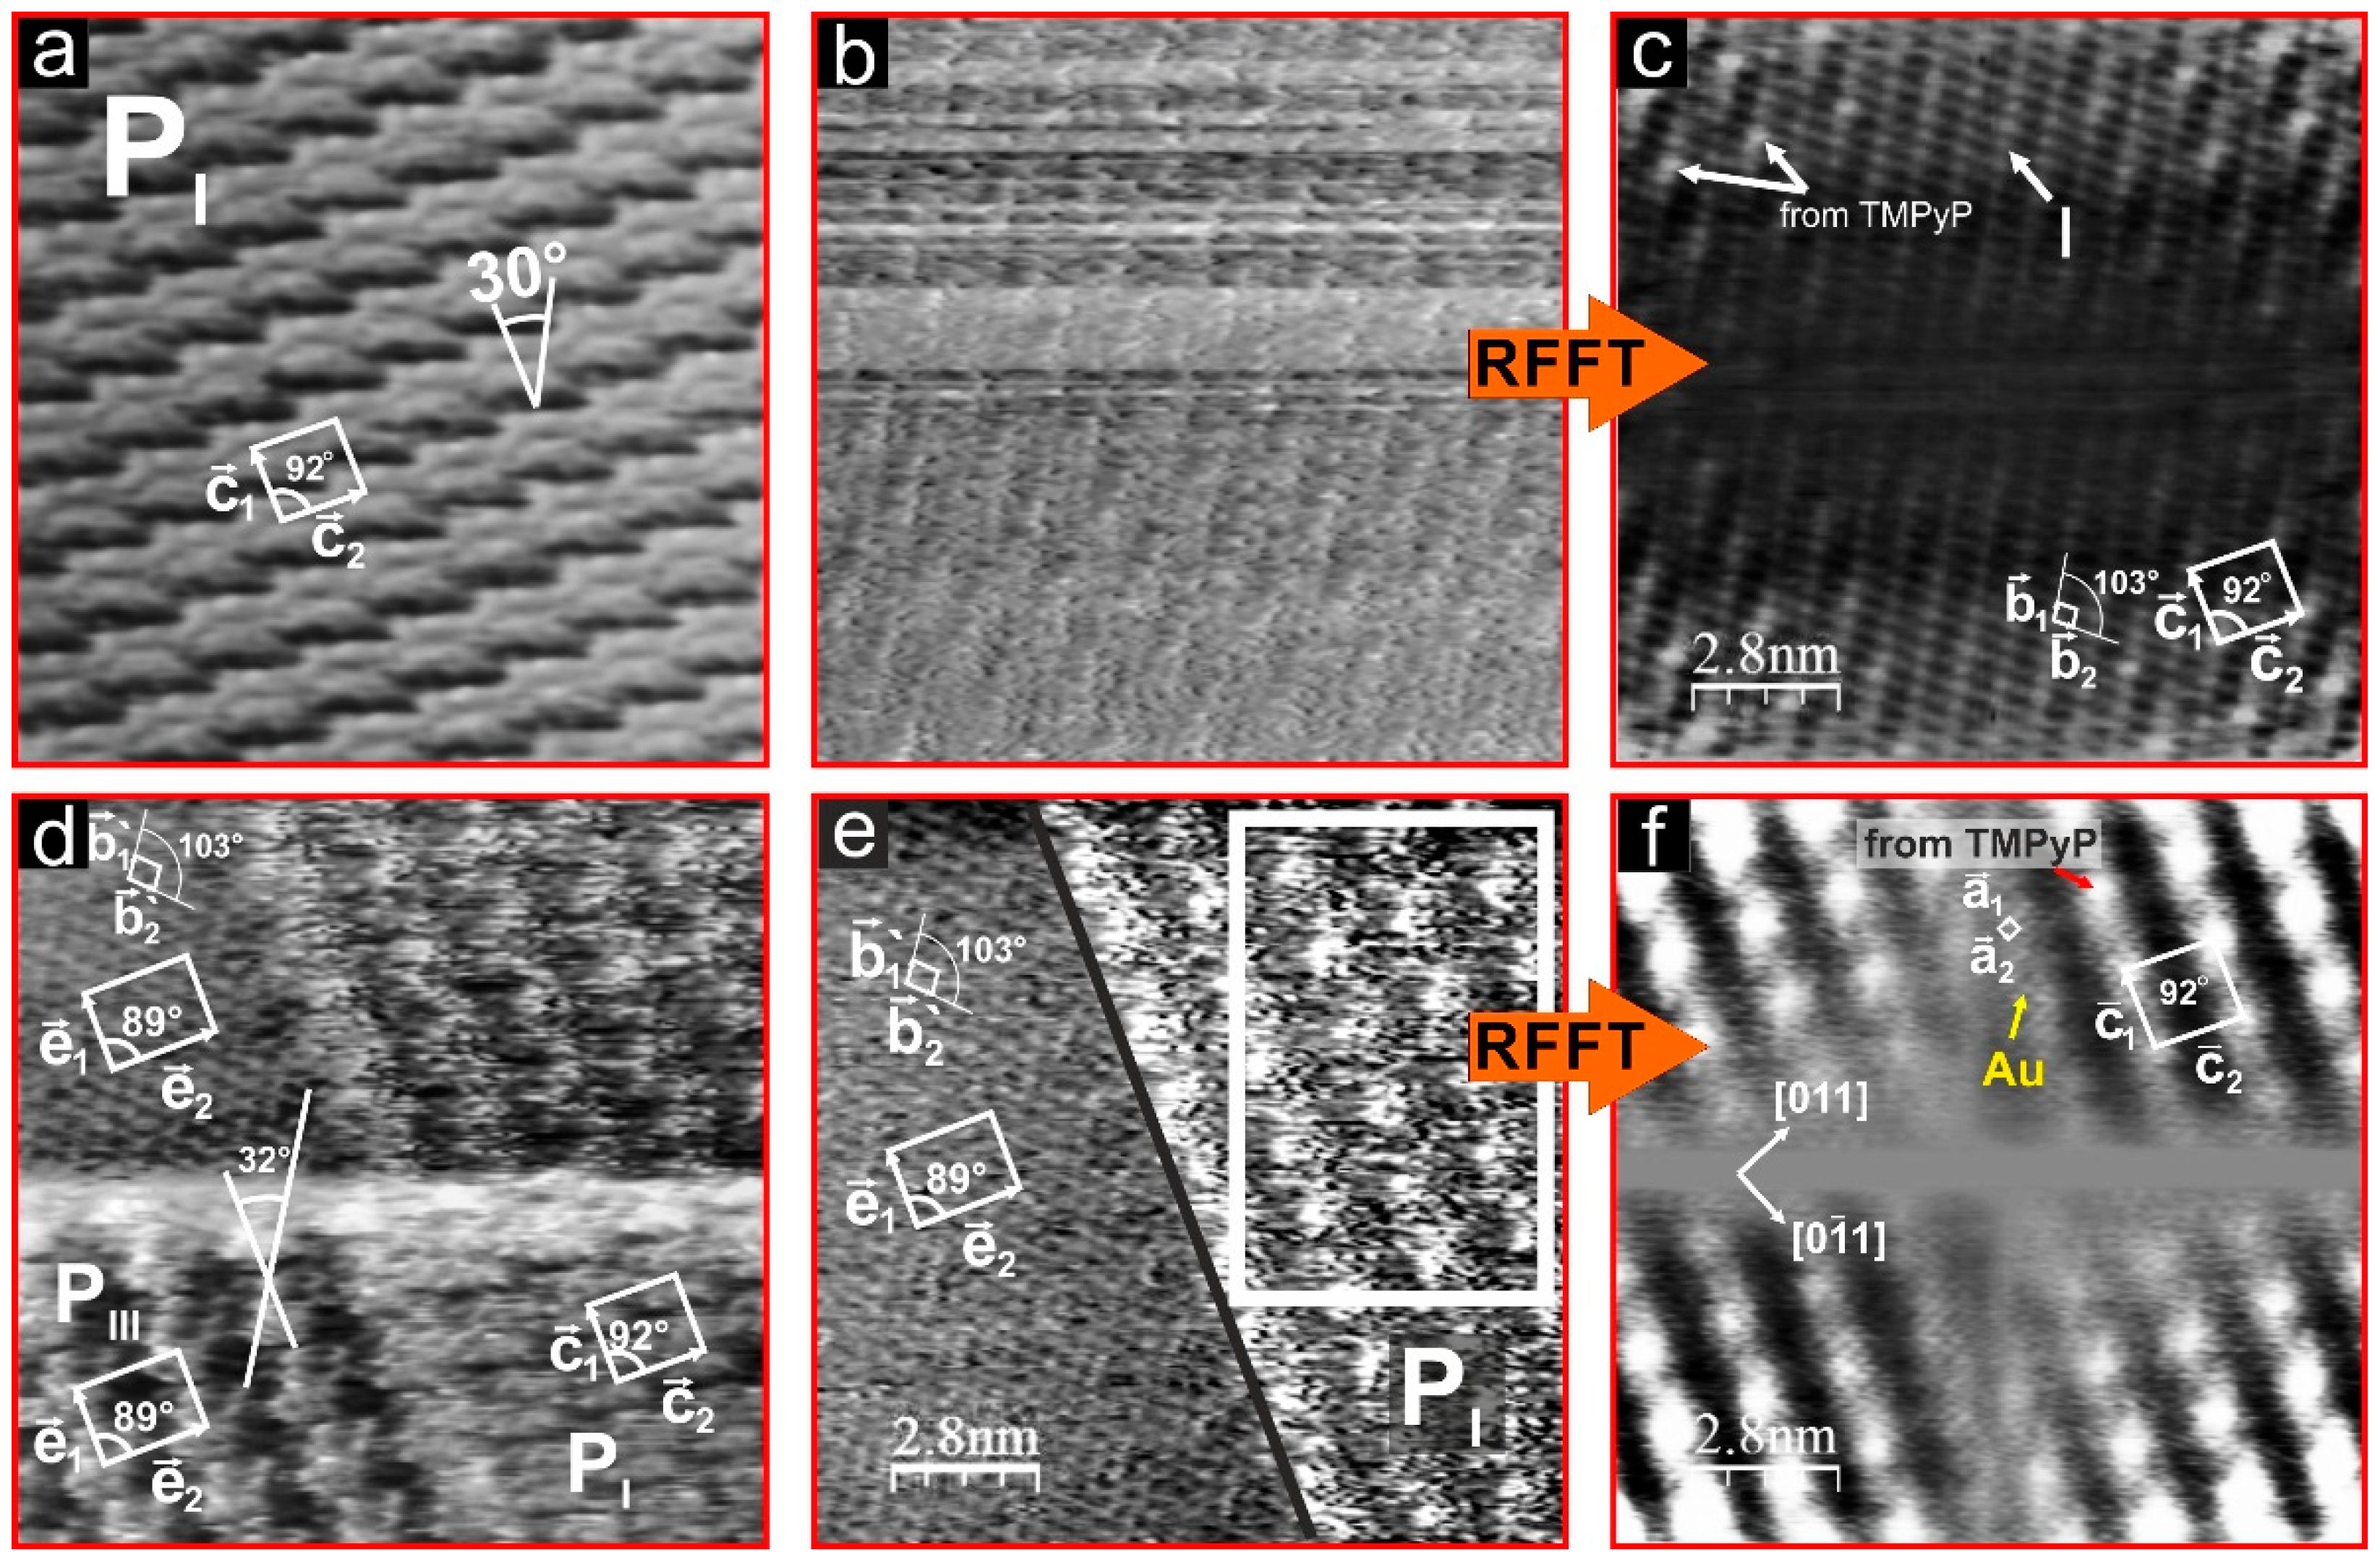
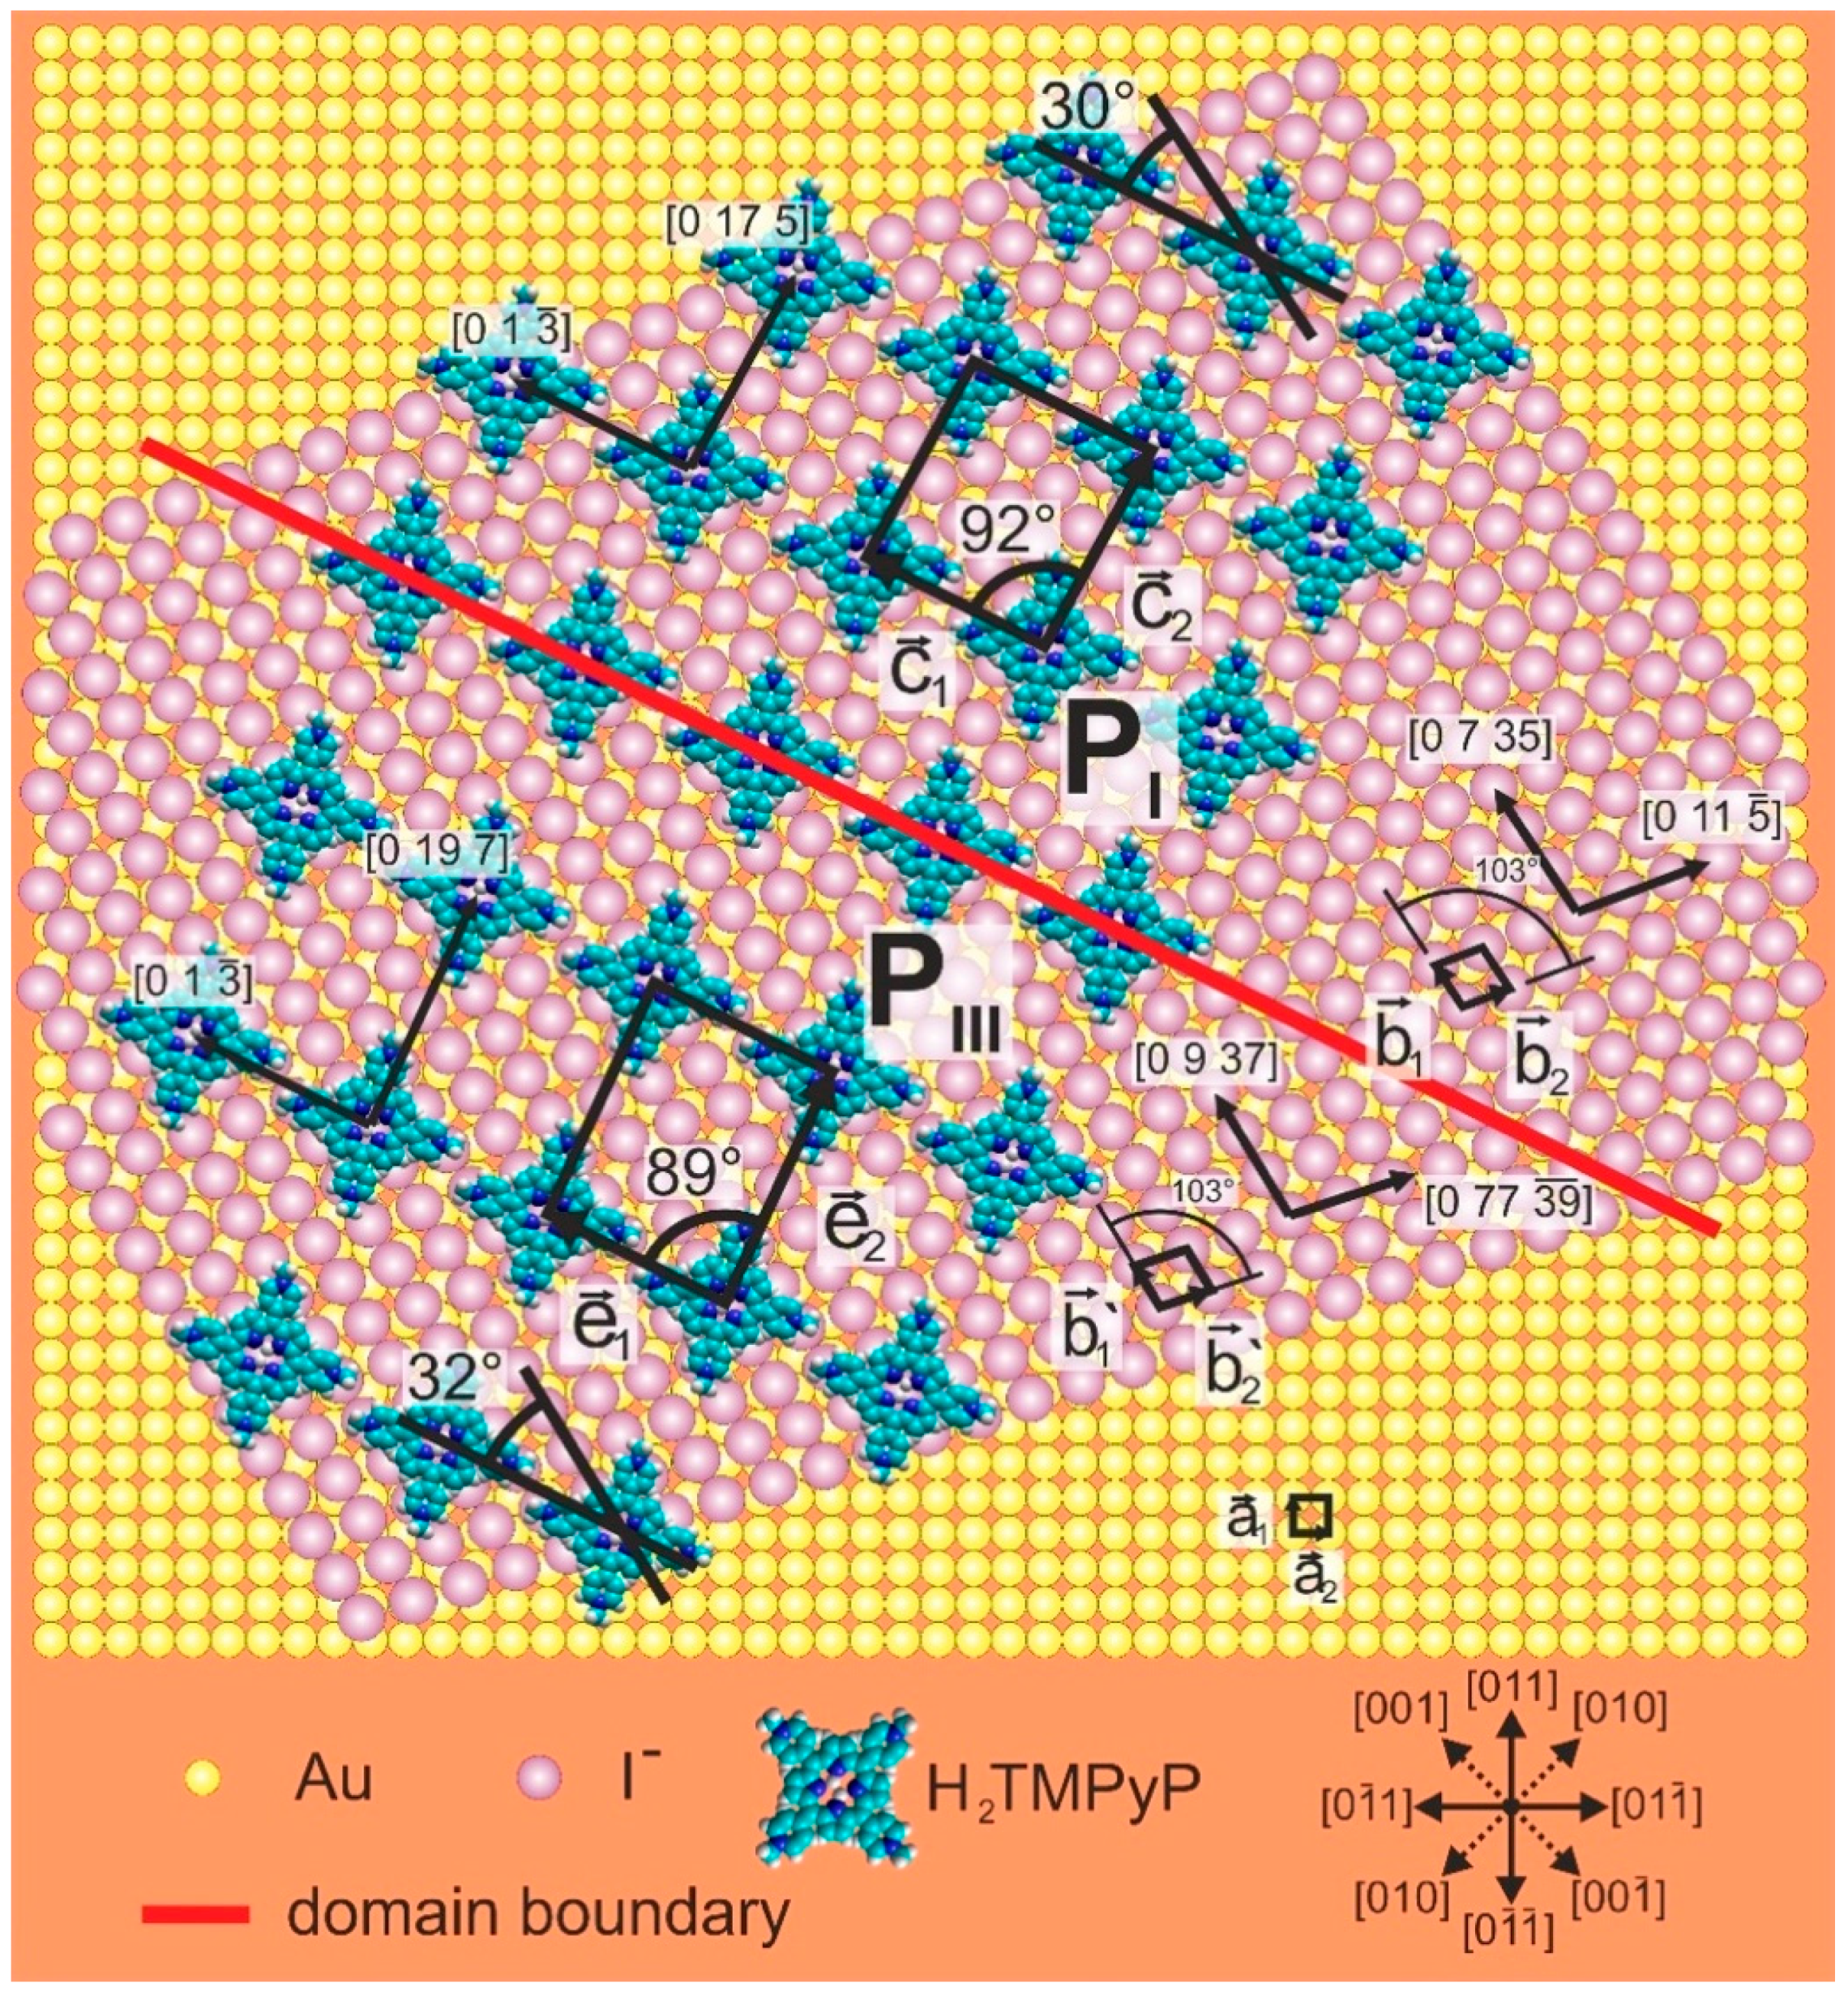
3.3. Substrate-Adlayer Structure Correlations
3.3.1. Phases PI, PIII
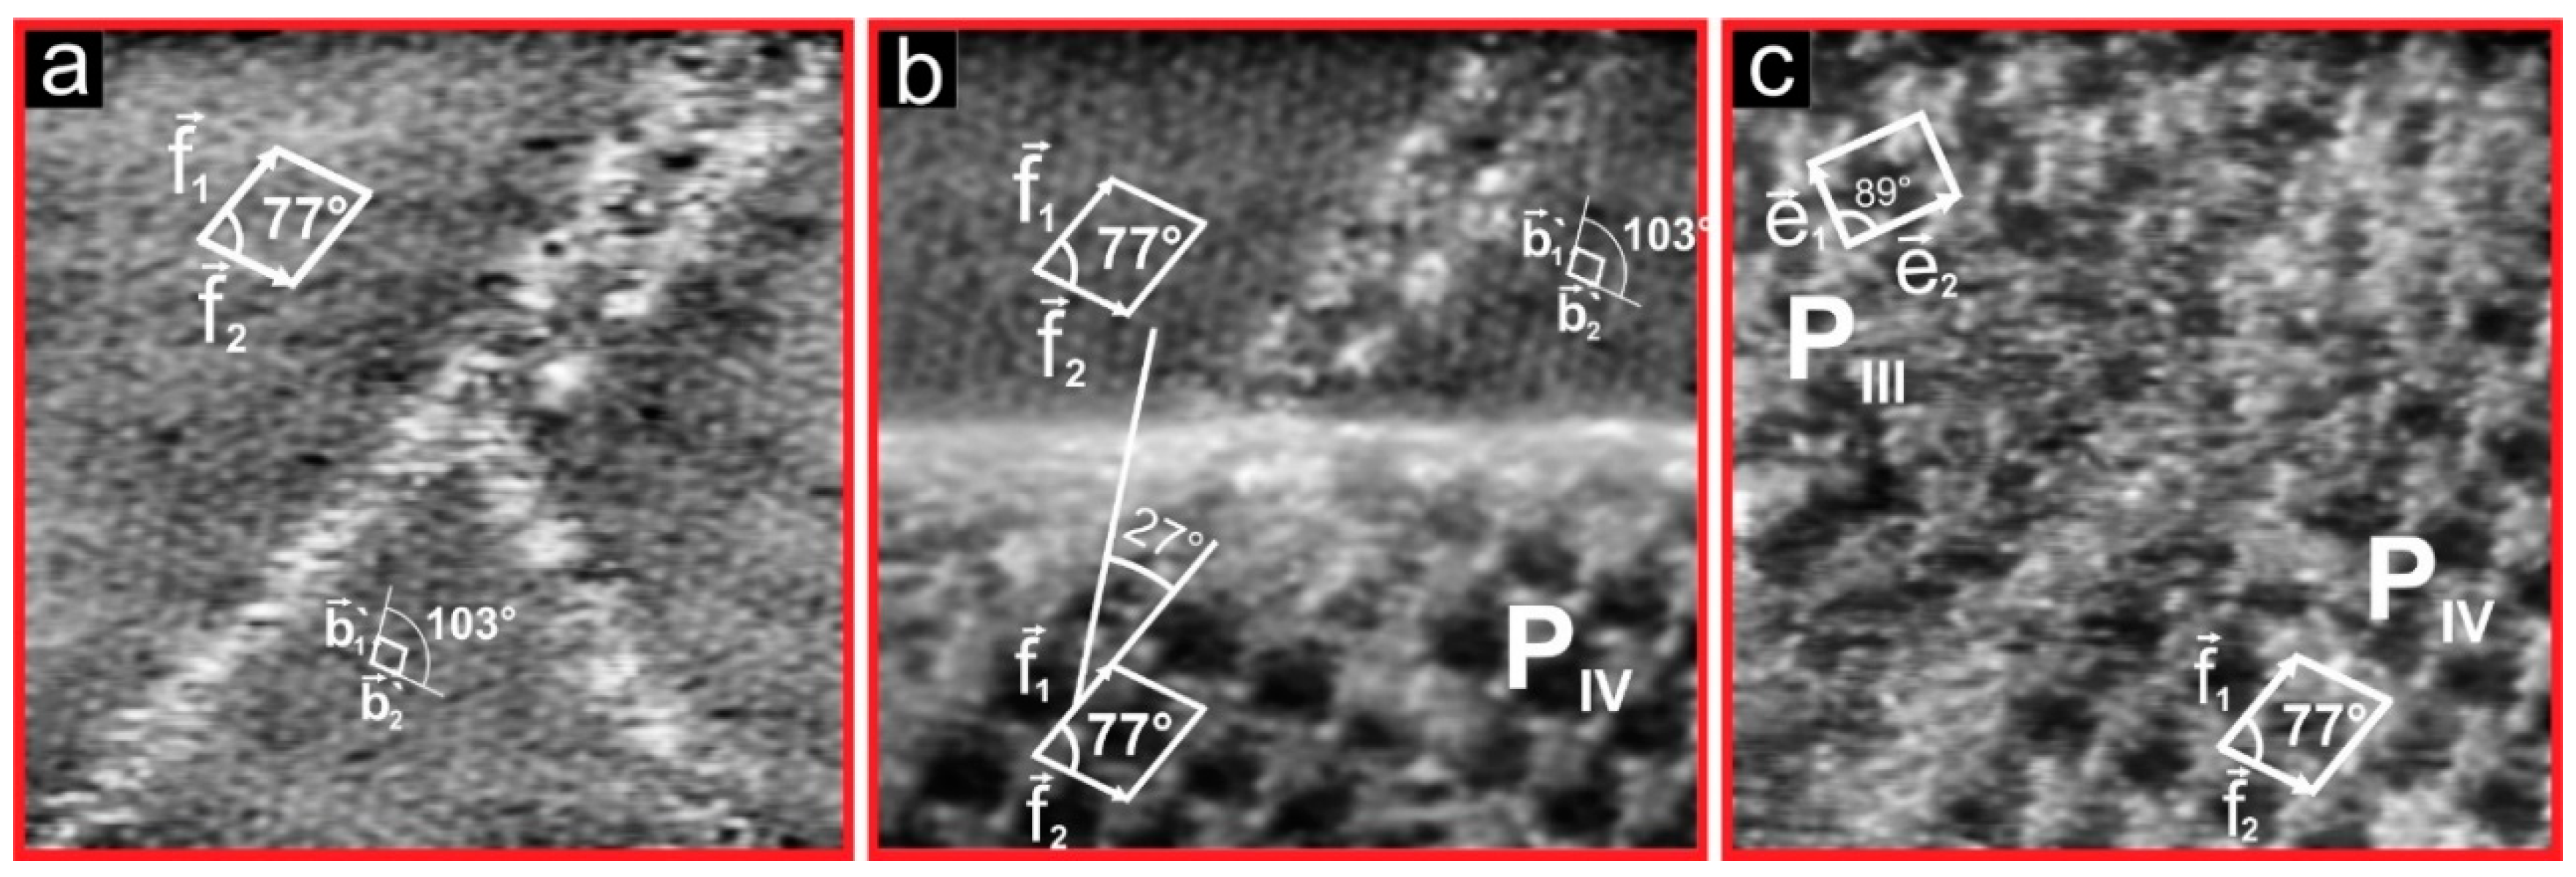
3.3.2. Phases PIII, PIV
4. Conclusions
Author Contributions
Funding
Acknowledgments
Conflicts of Interest
References
- Madueno, R.; Räisänen, M.T.; Silien, C.; Buck, M. Functionalizing hydrogen-bonded surface networks with self-assembled monolayers. Nature 2008, 454, 618–621. [Google Scholar] [CrossRef] [PubMed]
- Li, Z.; Wandlowski, T. Structure formation and annealing of isophthalic acid at the electrochemical Au(111)-electrolyte interface. J. Phys. Chem. C 2009, 113, 7821–7825. [Google Scholar] [CrossRef]
- Barth, J.V.; Weckesser, J.; Lin, N.; Dmitriev, A.; Kern, K. Supramolecular architectures and nanostructures at metal surfaces. Appl. Phys. A Mater. Sci. Process. 2003, 76, 645–652. [Google Scholar] [CrossRef]
- Dmitriev, A.; Lin, N.; Weckesser, J.; Barth, J.V.; Kern, K. Supramolecular assemblies of trimesic acid on a Cu(100) surface. J. Phys. Chem. B 2002, 106, 6907–6912. [Google Scholar] [CrossRef]
- Whitesides, G.M. Self-Assembly at All Scales. Science 2002, 295, 2418–2421. [Google Scholar] [CrossRef] [PubMed]
- Desiraju, G.R. Chemistry beyond the molecule. Nature 2001, 412, 397–400. [Google Scholar] [CrossRef] [PubMed]
- Sosa-Vargas, L.; Kim, E.; Attias, A.J. Beyond “decorative” 2D supramolecular self-assembly: Strategies towards functional surfaces for nanotechnology. Mater. Horiz. 2017, 4, 570–583. [Google Scholar] [CrossRef]
- Safarowsky, C.; Rang, A.; Schalley, C.A.; Wandelt, K.; Broekmann, P. Formation of 2D supramolecular architectures at electrochemical solid/liquid interfaces. Electrochim. Acta 2005, 50, 4257–4268. [Google Scholar] [CrossRef]
- Ciesielski, A.; Palma, C.A.; Bonini, M.; Samori, P. Towards supramolecular engineering of functional nanomaterials: Pre-programming multi-component 2D self-assembly at solid-liquid interfaces. Adv. Mater. 2010, 22, 3506–3520. [Google Scholar] [CrossRef] [PubMed]
- Gottfried, J.M. Surface chemistry of porphyrins and phthalocyanines. Surf. Sci. Rep. 2015, 70, 259–379. [Google Scholar] [CrossRef]
- Hai, N.T.M.; Gasparovic, B.; Wandelt, K.; Broekmann, P. Phase transition in ordered porphyrin layers on iodide modified Cu(111): An EC-STM study. Surf. Sci. 2007, 601, 2597–2602. [Google Scholar] [CrossRef]
- Phan, T.H.; Kosmala, T.; Wandelt, K. Potential dependence of self-assembled porphyrin layers on a Cu(111) electrode surface: In-Situ STM study. Surf. Sci. 2015, 631, 207–212. [Google Scholar] [CrossRef]
- Madry, B.; Morawski, I.; Kosmala, T.; Wandelt, K.; Nowicki, M. Porphyrin Layers at Cu/Au(111)–Electrolyte Interfaces: In Situ EC-STM Study. Top. Catal. 2018, 1–15. [Google Scholar] [CrossRef]
- Barth, J.V.; Costantini, G.; Kern, K. Engineering atomic and molecular nanostructures at surfaces. Nature 2005, 437, 671–679. [Google Scholar] [CrossRef] [PubMed]
- Castner, D.G.; Ratner, B.D. Biomedical surface science: Foundations to frontiers. Surf. Sci. 2002, 500, 28–60. [Google Scholar] [CrossRef]
- Lang, K.; Mosinger, J.; Wagnerová, D.M. Photophysical properties of porphyrinoid sensitizers non-covalently bound to host molecules; models for photodynamic therapy. Coord. Chem. Rev. 2004, 248, 321–350. [Google Scholar] [CrossRef]
- Vicente, M.G. Porphyrin-based sensitizers in the detection and treatment of cancer: Recent progress. Curr. Med. Chem. Anti-Cancer Agents 2001, 1, 175–194. [Google Scholar] [CrossRef] [PubMed]
- Lei, J.; Ju, H.; Ikeda, O. Supramolecular assembly of porphyrin bound DNA and its catalytic behavior for nitric oxide reduction. Electrochim. Acta 2004, 49, 2453–2460. [Google Scholar] [CrossRef]
- Ema, T.; Miyazaki, Y.; Shimonishi, J.; Maeda, C.; Hasegawa, J.Y. Bifunctional porphyrin catalysts for the synthesis of cyclic carbonates from epoxides and CO2: Structural optimization and mechanistic study. J. Am. Chem. Soc. 2014, 136, 15270–15279. [Google Scholar] [CrossRef] [PubMed]
- Purrello, R.; Gurrieri, S.; Lauceri, R. Porphyrin assemblies as chemical sensors. Coord. Chem. Rev. 1999, 190–192, 683–706. [Google Scholar] [CrossRef]
- Hirano, T.; Yui, T.; Okazaki, K.I.; Kajino, T.; Fukushima, Y.; Inoue, H.; Torimoto, T.; Takagi, K. Photo-Induced Electron Migrations in the Nano-Cavities of Mesoporous Silica Sensitized by a Cationic Porphyrin Dye. J. Nanosci. Nanotechnol. 2009, 9, 495–500. [Google Scholar] [CrossRef] [PubMed]
- Lehn, J.-M. Supramolecular Chemistry—Scope and Perspectives Molecules, Supermolecules, and Molecular Devices (Nobel Lecture). Angew. Chem. Int. Ed. Engl. 1988, 27, 89–112. [Google Scholar] [CrossRef]
- Phan, T.H.; Wandelt, K. Molecular self-assembly at metal-electrolyte interfaces. Int. J. Mol. Sci. 2013, 14, 4498–4524. [Google Scholar] [CrossRef] [PubMed]
- Pansu, R.B.; Delmarre, D.; Me, R. Heavy metal ions detection in solution, in sol ± gel and with grafted porphyrin monolayers. Photochem. Photobiol. 1999, 124, 23–28. [Google Scholar]
- He, Y.; Ye, T.; Borguet, E. Porphyrin self-assembly at electrochemical interfaces: Role of potential modulated surface mobility. J. Am. Chem. Soc. 2002, 124, 11964–11970. [Google Scholar] [CrossRef] [PubMed]
- Kunitake, M.; Batina, N.; Itaya, K. Self-Organized Porphyrin Array on Iodine-Modified Au(111) in Electrolyte Solutions: In Situ Scanning Tunneling Microscopy Study. Langmuir 1995, 11, 2337–2340. [Google Scholar] [CrossRef]
- Kunitake, M.; Akiba, U.; Batina, N.; Itaya, K. Structures and dynamic formation processes of porphyrin adlayers on iodine-modified Au(111) in solution: In Situ STM study. Langmuir 1997, 13, 1607–1615. [Google Scholar] [CrossRef]
- Hai, N.T.M. Preparation and characterization of copper-iodide thin films and organic supramolecular layers at copper/electrolyte interfaces. Ph.D. Dissertation, University of Bonn, Bonn, Germany, 2007. [Google Scholar]
- Ogaki, K.; Batina, N.; Kunitake, M.; Itaya, K. In Situ Scanning Tunneling Microscopy of Ordering Processes of Adsorbed Porphyrin on Iodine-Modified Ag(111). J. Phys. Chem. 1996, 100, 7185–7190. [Google Scholar] [CrossRef]
- Sashikata, K.; Sugata, T.; Sugimasa, M.; Itaya, K. In Situ Scanning Tunneling Microscopy Observation of a Porphyrin Adlayer on an Iodine-Modified Pt(100) Electrode. Langmuir 1998, 14, 2896–2902. [Google Scholar] [CrossRef]
- Wilms, M.; Kruft, M.; Bermes, G.; Wandelt, K. A new and sophisticated electrochemical scanning tunneling microscope design for the investigation of potentiodynamic processes. Rev. Sci. Instrum. 1999, 70, 3641. [Google Scholar] [CrossRef]
- Gao, X.; Edens, G.J.; Liu, F.-C.; Weaver, M.J.; Hamelin, A. Sensitivity of Electrochemical Adlayer Structure to the Metal Crystallographic Orientation: Potential-Dependent Iodide Adsorption on Au(100) in Comparison with Other Low-Index Surfaces. J. Phys. Chem. 1994, 98, 8086–8095. [Google Scholar] [CrossRef] [Green Version]
- Valenzuela-Benavides, J.; Herrera-Zaldívar, M. Structural transitions of chemisorbed iodine on Au(1 0 0): A STM and LEED study. Surf. Sci. 2005, 592, 150–158. [Google Scholar] [CrossRef]
- Magnussen, O.M. Ordered anion adlayers on metal electrode surfaces. Chem. Rev. 2002, 102, 679–725. [Google Scholar] [CrossRef] [PubMed]
- Su, G.-J.; Zhang, H.-M.; Wan, L.-J.; Bai, C.-L.; Wandlowski, T. Potential-Induced Phase Transition of Trimesic Acid Adlayer on Au(111). J. Phys. Chem. B 2004, 108, 1931–1937. [Google Scholar] [CrossRef] [Green Version]
- Cunha, F.; Jin, Q.; Tao, N.J.; Li, C.-Z. Structural phase transition in self-assembled 1,10′ phenanthroline monolayer on Au(111). Surf. Sci. 1997, 389, 19–28. [Google Scholar] [CrossRef]
- Bai, Y. Photoelectron Spectroscopic Investigations of Porphyrins and Phthalocyanines on Ag(111) and Au (111): Adsorption and Reactivity. Friedrich-Alexander-Universität Erlangen-Nürnberg. 2010. Available online: http://opus4.kobv.de/opus4-fau/frontdoor/deliver/index/docId/1146/file/YunBaiDissertation.pdf (accessed on 13 May 2016).
- Mizutani, W.; Shigeno, M.; Ono, M.; Kajimura, K. Voltage-dependent scanning tunneling microscopy images of liquid crystals on graphite. Appl. Phys. Lett. 1990, 56, 1974–1976. [Google Scholar] [CrossRef]
- Claypool, C.L.; Faglioni, F.; Goddard, W.A.; Gray, H.B.; Lewis, N.S.; Marcus, R.A. Source of Image Contrast in STM Images of Functionalized Alkanes on Graphite: A Systematic Functional Group Approach. J. Phys. Chem. B 1997, 101, 5978–5995. [Google Scholar] [CrossRef]
- Huemann, S.; Hai, N.T.M.; Broekmann, P.; Wandelt, K.; Zajonz, H.; Dosch, H.; Renner, F. X-ray diffraction and STM study of reactive surfaces under electrochemical control: Cl and I on Cu(100). J. Phys. Chem. B 2006, 110, 24955–24963. [Google Scholar] [CrossRef] [PubMed]
- Röefzaad, M. Ordnungsphänomene redox-aktiver Moleküle auf Elektrodenoberflächen unter reaktiven Bedingungen. Ph.D. Thesis, University of Bonn, Bonn, Germany, 2011. [Google Scholar]


| Parameter | PI | PII | PIII | PIV | PV |
|---|---|---|---|---|---|
| lattice constants [±0.05 nm] | c1 = 1.61 c2 = 1.80 | d1= 1.94 d2 = 1.56 | e1 = 1.61 e2 = 2.06 | f1 = 1.94 f2 = 1.76 | g1 = 1.46 g2 = 2.06 |
| angle [±1°] | 92° | 74° | 89° | 77° | 85° |
| molecule rotation [α ±1°] | +30° vs. | −28° vs. | +32° vs. | +26° vs. | +27° vs. |
| surface concentration [molecules/cm2] | 3.453 × 10¹³ | 3.437 × 10¹³ | 3.016 × 10¹³ | 3.014 × 10¹³ | 3.333 × 10¹³ |
| Parameter | PI | PIII | PIV | |
|---|---|---|---|---|
| Au lattice parameters | vectors direction | | ||
| lattice constant | a1 = 0.289 nm a2 = 0.289 nm | |||
| Iodine lattice parameters | vectors direction | | | |
| lattice constant | b1 = 0.404 nm b2 = 0.410 nm | b′1 = 0.388 nm b′2 = 0.439 nm | b′1 = 0.388 nm b′2 = 0.439 nm | |
| Θ* | 0.52 ML | 0.50 ML | 0.50 ML | |
| Matrix with respect to Au(100) | ||||
| Porphyrins lattice parameters | vectors direction | | | |
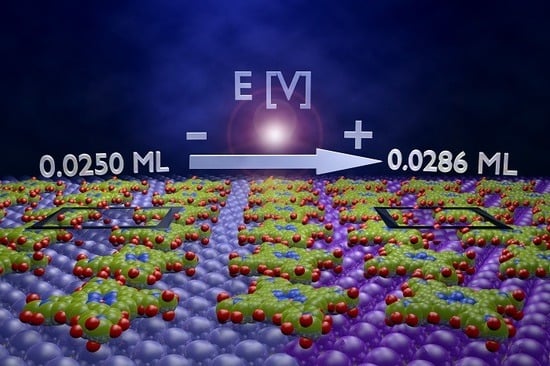
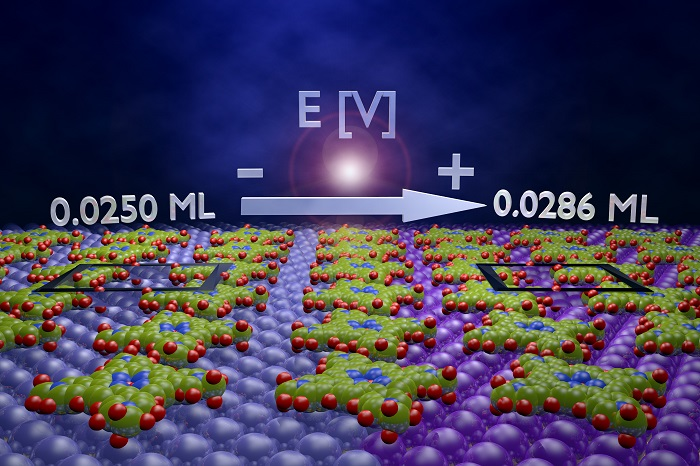
| Θ* | 0.0286 ML | 0.0250 ML | 0.0250 ML | |
| Matrix with respect to iodine | ||||
| Matrix with respect to Au(100) | ||||
© 2018 by the authors. Licensee MDPI, Basel, Switzerland. This article is an open access article distributed under the terms and conditions of the Creative Commons Attribution (CC BY) license (http://creativecommons.org/licenses/by/4.0/).
Share and Cite
Kosmala, T.; Blanco, M.; Granozzi, G.; Wandelt, K. Potential Driven Non-Reactive Phase Transitions of Ordered Porphyrin Molecules on Iodine-Modified Au(100): An Electrochemical Scanning Tunneling Microscopy (EC-STM) Study. Surfaces 2018, 1, 12-28. https://doi.org/10.3390/surfaces1010003
Kosmala T, Blanco M, Granozzi G, Wandelt K. Potential Driven Non-Reactive Phase Transitions of Ordered Porphyrin Molecules on Iodine-Modified Au(100): An Electrochemical Scanning Tunneling Microscopy (EC-STM) Study. Surfaces. 2018; 1(1):12-28. https://doi.org/10.3390/surfaces1010003
Chicago/Turabian StyleKosmala, Tomasz, Matías Blanco, Gaetano Granozzi, and Klaus Wandelt. 2018. "Potential Driven Non-Reactive Phase Transitions of Ordered Porphyrin Molecules on Iodine-Modified Au(100): An Electrochemical Scanning Tunneling Microscopy (EC-STM) Study" Surfaces 1, no. 1: 12-28. https://doi.org/10.3390/surfaces1010003