


Remote Sens. 2024, 16(8), 1454; https://doi.org/10.3390/rs16081454 (registering DOI) - 19 Apr 2024
Abstract
Traditional GIS-based statistical models are intended to extrapolate patterns of settlements and their interactions with the environment. They contribute significantly to our knowledge of past human–land relationships. Yet, these models are often criticized for their empiricism, lopsided specific factors, and for overlooking the
[...] Read more.
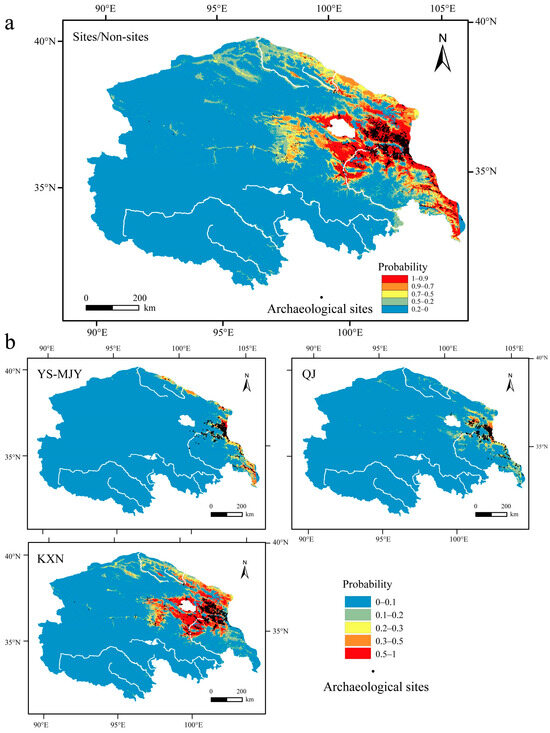
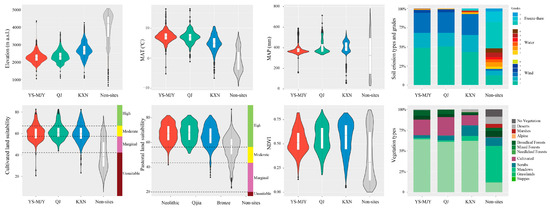
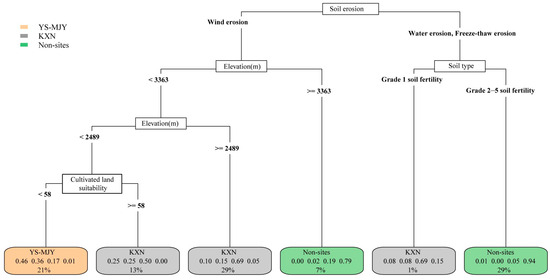
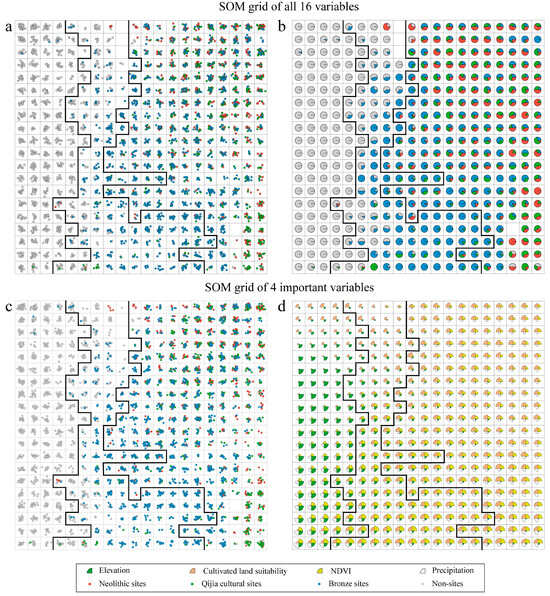
Traditional GIS-based statistical models are intended to extrapolate patterns of settlements and their interactions with the environment. They contribute significantly to our knowledge of past human–land relationships. Yet, these models are often criticized for their empiricism, lopsided specific factors, and for overlooking the synergy between variables. Though largely untested, machine learning and artificial intelligence methods have the potential to overcome these shortcomings comprehensively and objectively. The northeastern Tibetan Plateau (NETP) is characterized by diverse environments and significant changes to the social system from the Neolithic to Bronze Age. In this study, this area serves as a representative case for assessing the complex relationships between settlement locations and geographic environments, taking full advantages of these new models. We have explored a novel modeling case by employing GIS and random forests to consider multiple factors, including terrain, vegetation, soil, climate, hydrology, and land suitability, to construct classification models identifying environmental variation across different cultural periods. The model exhibited strong performance and a high archaeological prediction value. Potential living maps were generated for each cultural stage, revealing distinct environmental selection strategies from the Neolithic to Bronze Age. The key environmental parameters of elevation, climate, soil erosion, and cultivated land suitability were calculated with high weights, influencing human environmental decisions synergistically. Furthermore, we conducted a quantitative analysis of temporal dynamics in climate and subsistence to understand driving mechanisms behind environmental strategies. These findings suggest that past human environmental strategies were based on the comprehensive consideration of various factors, coupled with their social economic scenario. Such subsistence-oriented activities supported human beings in overcoming elevation limitation, and thus allowed them to inhabit wider pastoral areas. This study showcases the potential of machine learning in predicting archaeological probabilities and in interpreting the environmental influence on settlement patterns.
Full article
(This article belongs to the Section Environmental Remote Sensing)
►
Show Figures
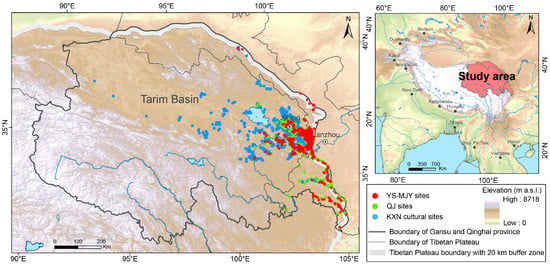
Figure 1


