
Finding a Direct Method for a Dynamic Process: The DD (Direct and Dynamic) Cell-Tox Method


Abstract
:1. Introduction
2. Results
2.1. Toxicity Assessment of Various Compounds with Different Methods
2.2. Toxicity Evaluation of DD Cell-Tox Method in Complex Cell-Based Liver Model in Comparison to Clinical Data
3. Discussion
- Limitations
4. Materials and Methods
4.1. Cells
- Human blood macrophages called TLT (CVCL_6C16), a spontaneously immortalized cell line previously isolated and characterized at the University of Maribor (Slovenia), were used. TLT cells were cultured in colourless Williams E medium (Thermo Fisher Scientific, Waltham, MA, USA) supplemented with 5 wt.% foetal bovine serum (Gibco, Thermo Fisher Scientific, Waltham, MA, USA). L-glutamine (2 mM, Sigma-Aldrich, San Luis, MO, USA), penicillin (100 U mL−1, Sigma-Aldrich), and streptomycin (1 mg/mL−1, Fluka, Buchs, Switzerland) were also added. Cells were cultured in 25 cm2 culture flasks (Corning, New York, NY, USA) at 37 °C and 5% CO2.
- A liver model was built by coculturing liver sinusoidal endothelial cells (LSEC), human stellate cells (HSC), Kupffer cells (nonparenchymal liver cells, NPC) from ZEN-BIO (Durham, NC, USA), and hepatocytes from Lonza (Basel, Switzerland). NPC and hepatocytes were grown separately in a 25 cm2 flask (NUNC, Roskilde, Denmark) in a controlled environment at 37 °C and 5% CO2 and later seeded together in a 96 well microplate (NUNC, Denmark) to build the liver model.
4.2. Chemicals
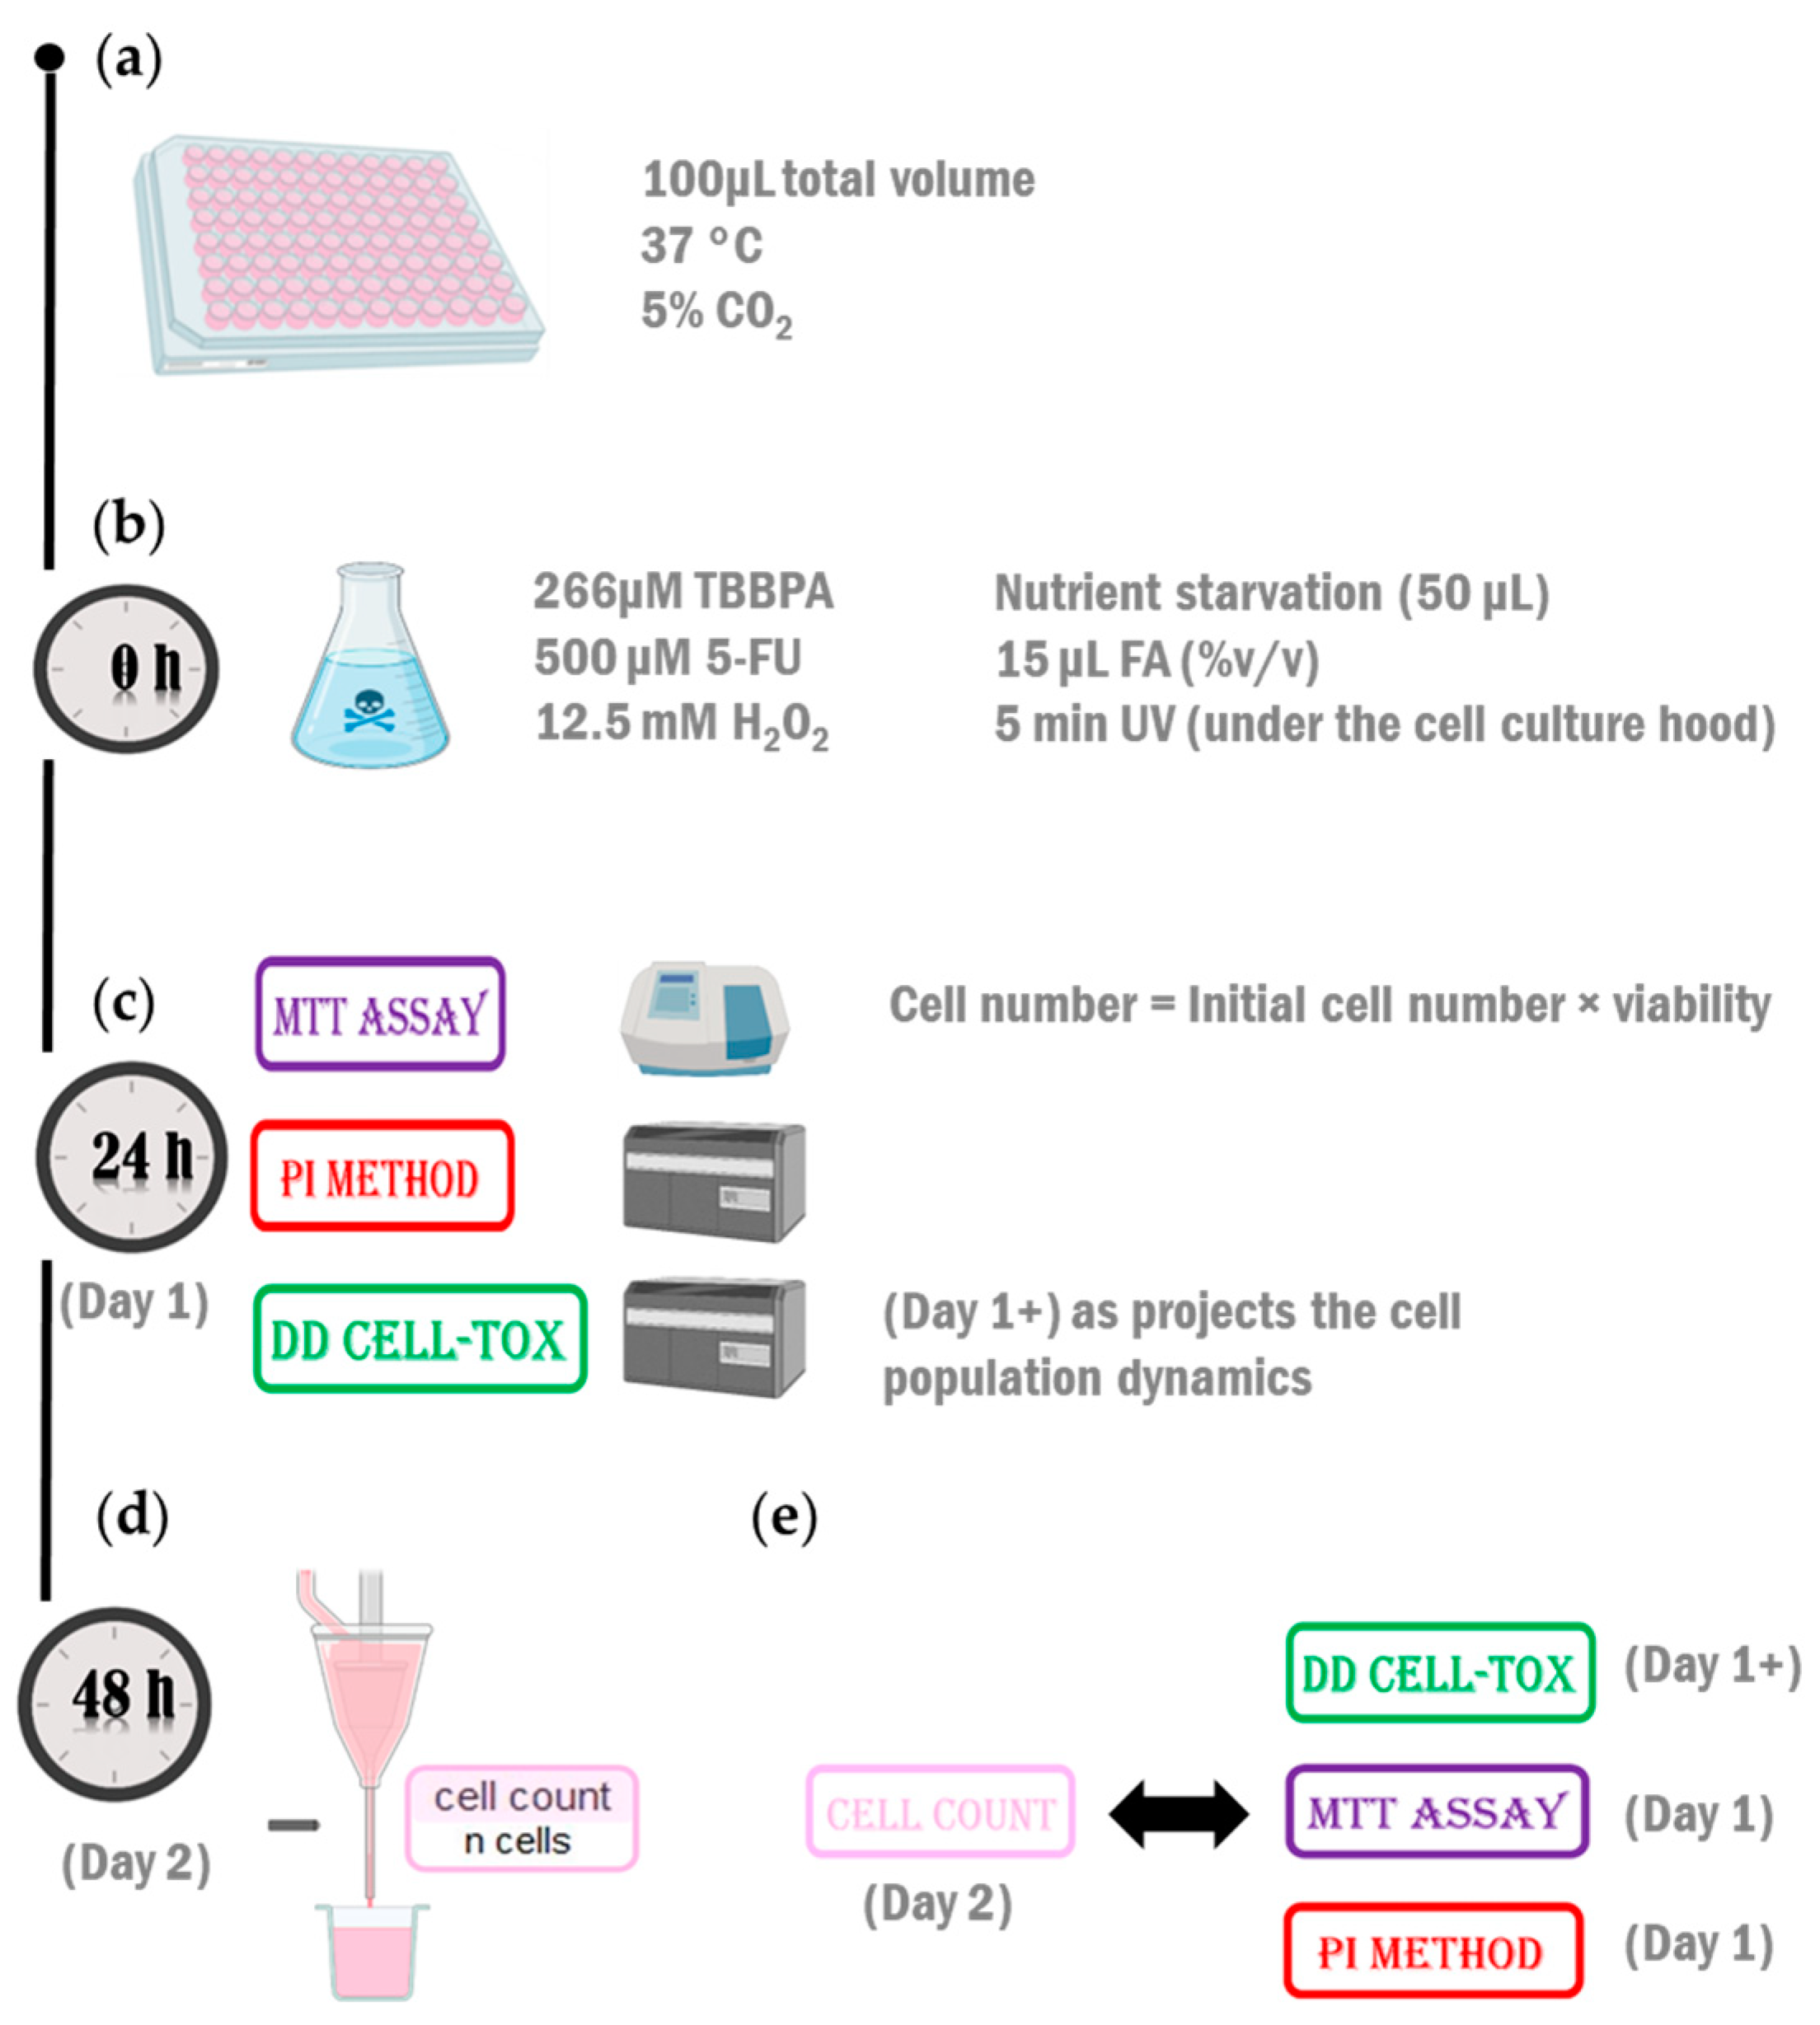
4.3. Protocol
4.4. Testing the Method in the First Configuration (Monoculture)
4.5. Testing the Method in the Second Arrangement (Coculture Model)
4.6. Statistical Analysis
5. Conclusions
Author Contributions
Funding
Institutional Review Board Statement
Informed Consent Statement
Data Availability Statement
Conflicts of Interest
References
- Galluzzi, L.; Vitale, I.; Aaronson, S.A.; Abrams, J.M.; Adam, D.; Agostinis, P.; Alnemri, E.S.; Altucci, L.; Amelio, I.; Andrews, D.W.; et al. Molecular mechanisms of cell death: Recommendations of the Nomenclature Committee on Cell Death 2018. Cell Death Differ. 2018, 25, 486–541. [Google Scholar] [PubMed]
- Elmore, S. Apoptosis: A Review of Programmed Cell Death. Toxicol. Pathol. 2007, 35, 495–516. [Google Scholar] [CrossRef] [PubMed]
- Gupta, K.H.; Goldufsky, J.W.; Wood, S.J.; Tardi, N.J.; Moorthy, G.S.; Gilbert, D.Z.; Zayas, J.P.; Hahm, E.; Altintas, M.M.; Reiser, J.; et al. Apoptosis and Compensatory Proliferation Signaling Are Coupled by CrkI-Containing Microvesicles. Dev. Cell 2017, 41, 674–684.e5. [Google Scholar] [CrossRef]
- Gudipaty, S.A.; Conner, C.M.; Rosenblatt, J.; Montell, D.J. Unconventional Ways to Live and Die: Cell Death and Survival in Development, Homeostasis, and Disease. Annu. Rev. Cell Dev. Biol. 2018, 34, 311–332. [Google Scholar] [CrossRef]
- Alenzi, F.Q. Links between apoptosis, proliferation and the cell cycle. Br. J. Biomed. Sci. 2004, 61, 99–102. [Google Scholar] [CrossRef]
- Krafts, K. Tissue Repair. In Encyclopedia of Toxicology, 3rd ed.; Wexler, P., Ed.; Academic Press: Oxford, UK, 2014; pp. 577–583. [Google Scholar]
- Joeng, L.; Hayes, A.; Bakand, S. Validation of the Dynamic Direct Exposure Method for Toxicity Testing of Diesel Exhaust In Vitro. ISRN Toxicol. 2013, 2013, 139512. [Google Scholar] [CrossRef] [PubMed]
- Vaidya, T.R.; Franco, Y.L.; Ait-Oudhia, S. A Three-dimensional and Dynamic (3DD) Cell Culture System for Evaluation of Pharmacokinetics, Safety and Efficacy of Anti-cancer Drugs. Curr. Pharmacol. Rep. 2019, 5, 460–467. [Google Scholar] [CrossRef]
- Azqueta, A.; Stopper, H.; Zegura, B.; Dusinska, M.; Møller, P. Do cytotoxicity and cell death cause false positive results in the in vitro comet assay? Mutat. Res. Genet. Toxicol. Environ. Mutagen. 2022, 881, 503520. [Google Scholar] [CrossRef] [PubMed]
- Damiani, E.; Solorio, J.A.; Doyle, A.P.; Wallace, H.M. How reliable are in vitro IC50 values? Values vary with cytotoxicity assays in human glioblastoma cells. Toxicol. Lett. 2019, 302, 28–34. [Google Scholar] [CrossRef]
- Gajski, G.; Čimbora-Zovko, T.; Rak, S.; Osmak, M.; Garaj-Vrhovac, V. Antitumour action on human glioblastoma A1235 cells through cooperation of bee venom and cisplatin. Cytotechnology 2016, 68, 1197–1205. [Google Scholar] [CrossRef]
- Cusack, R.P.; Chawke, L.; O’Brien, D.J.; O’Connor, B.; O’Connor, T.M. Predictors of hepatotoxicity among patients treated with antituberculous medication. QJM Int. J. Med. 2016, 110, 219–225. [Google Scholar] [CrossRef]
- Vincenzi, B.; Imperatori, M.; Picardi, A.; Vespasiani Gentilucci, U.; Gallo, P.; Fausti, V.; Spalato Ceruso, M.; Santini, D.; Tonini, G. Liver toxicity in colorectal cancer patients treated with first-line FOLFIRI-containing regimen: A single institution experience. Expert. Rev. Anticancer Ther. 2015, 15, 971–976. [Google Scholar] [CrossRef]
- National Institute of Diabetes and Digestive and Kidney Diseases. LiverTox: Clinical and Research Information on Drug-Induced Liver Injury [Internet]-Fluorouracil. 2018. Available online: https://www.ncbi.nlm.nih.gov/books/NBK548781/ (accessed on 26 October 2022).
- Institute of Diabetes and Digestive and Kidney Diseases. LiverTox: Clinical and Research Information on Drug-Induced Liver Injury [Internet]-Rifampicin. 2018. Available online: https://www.ncbi.nlm.nih.gov/books/NBK548314/ (accessed on 26 October 2022).
- National Institute of Diabetes and Digestive and Kidney Diseases. LiverTox: Clinical and Research Information on Drug-Induced Liver Injury [Internet]-Ibuprofen. 2018. Available online: https://www.ncbi.nlm.nih.gov/books/NBK547845/ (accessed on 26 October 2022).
- Messam, C.A.; Pittman, R.N. Asynchrony and Commitment to Die during Apoptosis. Exp. Cell Res. 1998, 238, 389–398. [Google Scholar] [CrossRef]
- Aragane, Y.; Kulms, D.; Metze, D.; Wilkes, G.; Pöppelmann, B.; Luger, T.A.; Schwarz, T. Ultraviolet light induces apoptosis via direct activation of CD95 (Fas/APO-1) independently of its ligand CD95L. J. Cell Biol. 1998, 140, 171–182. [Google Scholar] [CrossRef]
- Bernard, S.; Herzel, H. Why do cells cycle with a 24 hour period? Genome Inform. 2006, 17, 72–79. [Google Scholar]
- Nishikawa, S.; Takamatsu, A. Effects of cell death-induced proliferation on a cell competition system. Math. Biosci. 2019, 316, 108241. [Google Scholar] [CrossRef]
- Ryoo, H.D.; Bergmann, A. The role of apoptosis-induced proliferation for regeneration and cancer. Cold Spring Harb. Perspect. Biol. 2012, 4, a008797. [Google Scholar] [CrossRef]
- Luo, N.; Li, J.; Wei, Y.; Lu, J.; Dong, R. Hepatic Stellate Cell: A Double-Edged Sword in the Liver. Physiol. Res. 2021, 70, 821–829. [Google Scholar] [CrossRef]
- Zeisberg, M.; Yang, C.; Martino, M.; Duncan, M.B.; Rieder, F.; Tanjore, H.; Kalluri, R. Fibroblasts Derive from Hepatocytes in Liver Fibrosis via Epithelial to Mesenchymal Transition. J. Biol. Chem. 2007, 282, 23337–23347. [Google Scholar] [CrossRef]
- Xiang, J.; Wan, C.; Guo, R.; Guo, D. Is Hydrogen Peroxide a Suitable Apoptosis Inducer for All Cell Types? BioMed Res. Int. 2016, 2016, 7343965. [Google Scholar] [CrossRef]
- Sun, L.; Wang, H.; Wang, Z.; He, S.; Chen, S.; Liao, D.; Wang, L.; Yan, J.; Liu, W.; Lei, X.; et al. Mixed lineage kinase domain-like protein mediates necrosis signaling downstream of RIP3 kinase. Cell 2012, 148, 213–227. [Google Scholar] [CrossRef]
- Zhang, Y.; Chen, X.; Gueydan, C.; Han, J. Plasma membrane changes during programmed cell deaths. Cell Res. 2018, 28, 9–21. [Google Scholar] [CrossRef] [PubMed]
- Zhang, Y.; Wang, X.; Chen, C.; An, J.; Shang, Y.; Li, H.; Xia, H.; Yu, J.; Wang, C.; Liu, Y.; et al. Regulation of TBBPA-induced oxidative stress on mitochondrial apoptosis in L02 cells through the Nrf2 signaling pathway. Chemosphere 2019, 226, 463–471. [Google Scholar] [CrossRef] [PubMed]
- Cho, K.H.; Choi, S.M.; Kim, B.C.; Lee, S.H.; Park, M.S.; Kim, M.K.; Kim, J.K. 5-fluorouracil-induced oligodendrocyte death and inhibitory effect of cycloheximide, Trolox, and Z-VAD-FMK in murine cortical culture. Cancer 2004, 100, 1484–1490. [Google Scholar] [CrossRef]
- Noguchi, M.; Hirata, N.; Tanaka, T.; Suizu, F.; Nakajima, H.; Chiorini, J.A. Autophagy as a modulator of cell death machinery. Cell Death Dis. 2020, 11, 517. [Google Scholar] [CrossRef]
- Li, J.; Cao, F.; Yin, H.L.; Huang, Z.J.; Lin, Z.T.; Mao, N.; Sun, B.; Wang, G. Ferroptosis: Past, present and future. Cell Death Dis. 2020, 11, 88. [Google Scholar] [CrossRef]
- Salucci, S.; Burattini, S.; Battistelli, M.; Baldassarri, V.; Maltarello, M.C.; Falcieri, E. Ultraviolet B (UVB) irradiation-induced apoptosis in various cell lineages in vitro. Int. J. Mol. Sci. 2012, 14, 532–546. [Google Scholar] [CrossRef]
- Aldewachi, H.S.; Wright, N.A.; Appleton, D.R.; Watson, A.J. The effect of starvation and refeeding on cell population kinetics in the rat small bowel mucosa. J. Anat. 1975, 119 Pt 1, 105–121. [Google Scholar] [PubMed]
- Goodlad, R.A.; Wright, N.A. The effects of starvation and refeeding on intestinal cell proliferation in the mouse. Virchows Arch. B Cell Pathol. Incl. Mol. Pathol. 1984, 45, 63–73. [Google Scholar] [CrossRef]
- Tessitore, L. Apoptosis and Cell Proliferation Are Involved in the Initiation of Liver Carcinogenesis by a Subnecrogenic Dose of Diethylnitrosamine in Refed Rats. J. Nutr. 2000, 130, 104–110. [Google Scholar] [CrossRef]
- Ghoshal, K.; Jacob, S.T. An alternative molecular mechanism of action of 5-fluorouracil, a potent anticancer drug. Biochem. Pharmacol. 1997, 53, 1569–1575. [Google Scholar] [CrossRef]
- Granada, A.E.; Jiménez, A.; Stewart-Ornstein, J.; Blüthgen, N.; Reber, S.; Jambhekar, A.; Lahav, G. The effects of proliferation status and cell cycle phase on the responses of single cells to chemotherapy. Mol. Biol. Cell 2020, 31, 845–857. [Google Scholar] [CrossRef] [PubMed]
- Gérard, C.; Goldbeter, A. The balance between cell cycle arrest and cell proliferation: Control by the extracellular matrix and by contact inhibition. Interface Focus 2014, 4, 20130075. [Google Scholar] [CrossRef]
- Chitu, V.; Yeung, Y.-G.; Yu, W.; Nandi, S.; Stanley, E.R. Measurement of macrophage growth and differentiation. Curr. Protoc. Immunol. 2011, 92, 14.20.1–14.20.26. [Google Scholar] [CrossRef] [PubMed]
- Deng, Y.; Luo, X.; Li, X.; Xiao, Y.; Xu, B.; Tong, H. Screening of Biomarkers and Toxicity Mechanisms of Rifampicin-Induced Liver Injury Based on Targeted Bile Acid Metabolomics. Front. Pharmacol. 2022, 13, 925509. [Google Scholar] [CrossRef]
- Mazaleuskaya, L.L.; Theken, K.N.; Gong, L.; Thorn, C.F.; FitzGerald, G.A.; Altman, R.B.; Klein, T.E. PharmGKB summary: Ibuprofen pathways. Pharmacogenet Genom. 2015, 25, 96–106. [Google Scholar] [CrossRef]
- Peters, G.J.; Backus, H.H.; Freemantle, S.; van Triest, B.; Codacci-Pisanelli, G.; van der Wilt, C.L.; Smid, K.; Lunec, J.; Calvert, A.H.; Marsh, S.; et al. Induction of thymidylate synthase as a 5-fluorouracil resistance mechanism. Biochim. Biophys. Acta 2002, 1587, 194–205. [Google Scholar] [CrossRef]
- Advani, P.P.; Fakih, M.G. 5-FU-induced hyperammonemic encephalopathy in a case of metastatic rectal adenocarcinoid successfully rechallenged with the fluoropyrimidine analog, capecitabine. Anticancer Res. 2011, 31, 335–338. [Google Scholar] [PubMed]
- Zhang, C.; Wang, H.; Ning, Z.; Xu, L.; Zhuang, L.; Wang, P.; Meng, Z. Serum liver enzymes serve as prognostic factors in patients with intrahepatic cholangiocarcinoma. Onco Targets Ther. 2017, 10, 1441–1449. [Google Scholar] [CrossRef]
- Rodrigues, D.; de Souza, T.; Coyle, L.; Di Piazza, M.; Herpers, B.; Ferreira, S.; Zhang, M.; Vappiani, J.; Sévin, D.C.; Gabor, A.; et al. New insights into the mechanisms underlying 5-fluorouracil-induced intestinal toxicity based on transcriptomic and metabolomic responses in human intestinal organoids. Arch. Toxicol. 2021, 95, 2691–2718. [Google Scholar] [CrossRef]
- Barguilla, I.; Maguer-Satta, V.; Guyot, B.; Pastor, S.; Marcos, R.; Hernández, A. In Vitro Approaches to Determine the Potential Carcinogenic Risk of Environmental Pollutants. Int. J. Mol. Sci. 2023, 24, 7851. [Google Scholar] [CrossRef]
- Audebert, M.; Assmann, A.S.; Azqueta, A.; Babica, P.; Benfenati, E.; Bortoli, S.; Bouwman, P.; Braeuning, A.; Burgdorf, T.; Coumoul, X.; et al. New approach methodologies to facilitate and improve the hazard assessment of non-genotoxic carcinogens-a PARC project. Front. Toxicol. 2023, 5, 1220998. [Google Scholar] [CrossRef]
- Loftus, L.V.; Amend, S.R.; Pienta, K.J. Interplay between Cell Death and Cell Proliferation Reveals New Strategies for Cancer Therapy. Int. J. Mol. Sci. 2022, 23, 4723. [Google Scholar] [CrossRef]
- Madorran, E.; Stožer, A.; Arsov, Z.; Maver, U.; Rožanc, J. A Promising Method for the Determination of Cell Viability: The Membrane Potential Cell Viability Assay. Cells 2022, 11, 2314. [Google Scholar] [CrossRef]
- Rieger, A.M.; Nelson, K.L.; Konowalchuk, J.D.; Barreda, D.R. Modified annexin V/propidium iodide apoptosis assay for accurate assessment of cell death. J. Vis. Exp. JoVE 2011, 50, e2597. [Google Scholar]
- van Meerloo, J.; Kaspers, G.J.; Cloos, J. Cell sensitivity assays: The MTT assay. Methods Mol. Biol. 2011, 731, 237–245. [Google Scholar]
- Luk, H.Y.; McFarlin, B.K.; Vingren, J.L. Using image-based flow cytometry to monitor satellite cells proliferation and differentiation in vitro. Methods 2017, 112, 175–181. [Google Scholar] [CrossRef]
- Madorran, E.; Kocbek Šaherl, L.; Rakuša, M.; Munda, M. In Vitro Human Liver Model for Toxicity Assessment with Clinical and Preclinical Instrumentation. Pharmaceutics 2024, 16, 607. [Google Scholar] [CrossRef]


| Group | Number of Initial Cells | Number of Final Cells | Dead Cells (%) | Division Cells (%) |
|---|---|---|---|---|
| Control | 11,329 | 12,130 | 12 | 20 |
| 5-FU | 11,329 | 7327 | 7 | 26 |
| FA | 11,329 | 7318 | 35 | 0 |
| H2O2 | 11,329 | 5564 | 33 | 0 |
| NS | 11,329 | 10,694 | 12 | 39 |
| TBBPA | 11,329 | 4064 | 45 | 3 |
| UV | 11,329 | 6797 | 26 | 7 |
| Group | Number of Initial Cells | Number of Final Cells | Cell Number Increase (%) | Dead Cells (%) | Division Cells (%) |
|---|---|---|---|---|---|
| Control | 25,000 | 72,797 | 291 | 3 | 2 |
| 5-FU | 25,000 | 63,056 | 252 | 4 | 3 |
| IBU | 25,000 | 67,919 | 272 | 3 | 4 |
| RIF | 25,000 | 68,995 | 276 | 2 | 2 |
Disclaimer/Publisher’s Note: The statements, opinions and data contained in all publications are solely those of the individual author(s) and contributor(s) and not of MDPI and/or the editor(s). MDPI and/or the editor(s) disclaim responsibility for any injury to people or property resulting from any ideas, methods, instructions or products referred to in the content. |
© 2024 by the authors. Licensee MDPI, Basel, Switzerland. This article is an open access article distributed under the terms and conditions of the Creative Commons Attribution (CC BY) license (https://creativecommons.org/licenses/by/4.0/).
Share and Cite
Madorran, E.; Kocbek Šaherl, L.; Rakuša, M.; Takač, I.; Munda, M. Finding a Direct Method for a Dynamic Process: The DD (Direct and Dynamic) Cell-Tox Method. Int. J. Mol. Sci. 2024, 25, 5133. https://doi.org/10.3390/ijms25105133
Madorran E, Kocbek Šaherl L, Rakuša M, Takač I, Munda M. Finding a Direct Method for a Dynamic Process: The DD (Direct and Dynamic) Cell-Tox Method. International Journal of Molecular Sciences. 2024; 25(10):5133. https://doi.org/10.3390/ijms25105133
Chicago/Turabian StyleMadorran, Eneko, Lidija Kocbek Šaherl, Mateja Rakuša, Iztok Takač, and Miha Munda. 2024. "Finding a Direct Method for a Dynamic Process: The DD (Direct and Dynamic) Cell-Tox Method" International Journal of Molecular Sciences 25, no. 10: 5133. https://doi.org/10.3390/ijms25105133