


Anti-Gravity 3D Pulsating Heat Pipe for Cooling Electric Vehicle Batteries


1
School of Mechanical Engineering, College of Engineering, Chungbuk National University, 1 Chungdae-ro, Cheongju 28644, Republic of Korea
2
Space & Energy Technology Team, Innovation Technology Research Division, Korea Research Institute for Defense Technology Planning and Advancement, 160 Galma-ro, Daejeon 35287, Republic of Korea
*
Author to whom correspondence should be addressed.
†
These authors contributed equally to this work.
Energies 2024, 17(10), 2283; https://doi.org/10.3390/en17102283
Submission received: 18 March 2024
/
Revised: 4 May 2024
/
Accepted: 6 May 2024
/
Published: 9 May 2024
(This article belongs to the Topic Advanced Battery Thermal Management Solution for Electric Vehicles)
Abstract
:This study proposes an anti-gravity 3D pulsating heat pipe (PHP) for cooling pouch batteries in electric vehicles. The 3D PHP envelops the battery cells and rapidly transfers heat generated from the batteries to the bottom cold plate. While the batteries generate heat on their frontal surface during charging and discharging, structural characteristics lead to localized heat accumulation at the electrode lead tabs. Therefore, to address frontal heating, Pattern A with a consistent height for the 3D PHP and Pattern B with varying heights to enhance heat transfer in the localized heating area were designed. The target application involved creating a battery simulator for 340 × 100 mm pouch battery cells, considering the battery’s heat generation characteristics. The experiments for the thermal characteristics were conducted, considering factors such as the working fluid (methanol, Novec7100), filling ratio, supplied heat, and orientation. Additionally, to observe internal flow mechanisms, a special experimental apparatus was used, employing transparent fluorine rubber tubes to observe the flow mechanism of the 3D PHP. In the results of the thermal characteristics, the optimal filling ratio was 15% when heat generation levels of 50 W and 100 W were supplied and 20% when 150 W was supplied. The impact of orientation yielded varied results depending on the pattern and working fluid, attributed to the complex interplay of flow momentum due to orientation changes and the influence of the working fluid’s buoyancy under anti-gravity conditions. Pattern B, designed with the goal of applying a localized heat model, exhibited relatively decreased heat transfer performance in areas with varying heights. As the distance from the varying height portion increased, temperature oscillations and heat transfer became more active. These results suggest that variations in the shape of the 3D PHP could be a primary design variable for crafting localized heat models. Observations of internal flow revealed that the 3D PHP, with its unique shape and operation under anti-gravity conditions, exhibits longer and more irregular cycles compared to gravity-assist PHPs, transferring heat through rapid oscillations of internal working fluid liquid/vapor slug/plug. The potential of 3D PHPs for cooling electric vehicle batteries is suggested by these findings, and further experimentation is planned to evaluate the optimal design and applicability.
1. Introduction
The urgent need for sustainable transportation solutions, combined with growing environmental awareness, has driven a significant shift in the automotive industry toward electrification. Electric vehicles (EVs) have emerged as pivotal players in this transition, offering reduced emissions, improved energy efficiency, and decreased dependence on finite fossil fuels compared to traditional internal combustion engine vehicles. However, the widespread adoption of EVs relies heavily on the development of robust battery systems capable of delivering high performance, extended range capabilities, and dependable operation across diverse conditions [1,2,3,4].
Among the numerous challenges facing EV battery technology, effective thermal management stands out as a critical area of focus. Thermal issues such as heat accumulation during charging and discharging cycles can profoundly impact battery performance, longevity, and safety. Inadequate heat dissipation can lead to accelerated degradation, reduced energy efficiency, and even thermal runaway, posing significant safety risks. Thus, the implementation of efficient cooling solutions is essential to ensure optimal operation and longevity of EV battery systems [5,6,7].
To address these challenges, various solutions for EV battery cooling have been proposed. Presently, the predominant method involves indirect liquid cooling, which dissipates heat from pouch batteries via a bottom cold plate. However, the increasing capacity and energy density of EV batteries necessitate more advanced cooling solutions. One technology garnering significant attention is the utilization of direct liquid cooling employing dielectric fluids and phase change heat pipes [8,9]. In this context, our study proposes a novel approach utilizing a three-dimensional (3D) pulsating heat pipe (PHP) for battery cell cooling.
The PHP, conceptualized by Akachi in 1990, diverges from conventional heat pipes in its mode of operation [10]. Unlike conventional heat pipes, which separate and circulate vapor and liquid spaces, the PHP transfers heat by forming rapidly oscillating vapor-liquid plugs/slugs. As shown in Figure 1, crafted by bending small-diameter tubes to form a container subsequently filled with a working fluid, a typical PHP facilitates heat transfer primarily through surface tension and buoyancy-driven bubble movement within its channels. As bubbles generated at the evaporator at the bottom ascend swiftly to the condenser at the top, the vapor and liquid phases coexist and oscillate rapidly within the small tubes, influenced by surface tension. Research on PHPs entails an extensive analysis of heat transfer mechanisms via flow visualization of internal working fluids, alongside investigations into variables influencing heat transfer, such as filling ratio, number of bends, and internal diameter, among others, owing to their intricate operational mechanism [11,12,13,14].
In this study, anti-gravity 3D PHP technology for cooling batteries in automobiles under upper heating and lower cooling conditions is proposed. The proposed 3D PHP, depicted in Figure 2a, is designed to encase pouch batteries, thereby increasing the condensation area compared to planar 2D PHPs and enhancing the cooling efficiency. Additionally, it is anticipated that when applied at the cell level and inserted between the battery and the lower cold plate of the vehicle, as shown in Figure 2b, it will absorb vibrations from the vehicles and improve heat transfer performance. Furthermore, hot spots often occur in current batteries due to localized heating depending on the position of the lead tabs [15]. To disperse heat concentrated in these hot spots, we considered variations in the height of the 3D PHP. The height of the 3D PHPs was increased in areas expected to experience high heating to maximize the heating area, while pipes with lower heights were positioned in areas anticipated to have relatively low heating to achieve uniform heat distribution.
Furthermore, assessments were carried out using methanol and Novec7100 as working fluids. Methanol is well-suited as a working fluid for a PHP operating under anti-gravity conditions due to its relatively low density [16]. On the other hand, Novec7100 is an engineering fluid primarily employed for the direct cooling of electronic devices as an electrical insulating fluid. It offers the advantage of preventing fires resulting from fluid leakage due to external impacts on the working fluid, owing to its electrical wire insulation properties [17].
The application of PHPs for battery cooling is continuously evolving, as evidenced by numerous notable research endeavors. For instance, Chi et al. [16] introduced an innovative method for cooling lithium-ion batteries in EVs using an oscillating heat pipe (OHP), effectively addressing the limitations of traditional cooling methods. Their study underscored the critical role of efficient battery cooling technologies in mitigating heat-related issues during charging and discharging processes, thus preventing capacity degradation and extending battery lifespan. Similarly, Chen et al. [18] explored the utilization of a pulsating heat pipe (PHP) with TiO2 nanofluid for thermal management of EV lithium-ion batteries, demonstrating effective suppression of battery temperature rise and ensuring optimal performance within the desired temperature range. Additionally, Zhou et al. [19] investigated a hybrid oscillating heat pipe (OHP) charged with carbon nanotube nanofluids for EV battery cooling, showcasing superior heat transfer performance and presenting a promising cooling solution.
Furthermore, Chung et al. [20] conducted an in-depth analysis into optimizing a pulsating heat pipe (PHP) cooling system for cylindrical 18,650 cells in electric vehicles. Their comprehensive study explored various parameters such as the number of turns, working fluid, and condenser length, concluding that a specific PHP system configuration offered optimal cooling performance, which is critical for enhancing electric vehicle efficiency. Lv et al. [21] contributed significantly by investigating the thermal management of power battery modules using a TiO2 nanofluid pulsating heat pipe (TiO2-CLPHP) and cooling fan. Their proposed optimal thermal efficiency strategies and performance tests under diverse conditions showcased significant temperature reduction and enhanced efficiency, indicating effective thermal management for power battery modules.
Moreover, Hongkun et al. [22] discussed the utilization of oscillating heat pipes (OHPs) in battery thermal management systems (BTMSs), exploring various OHP applications aimed at enhancing cooling efficiency and maintaining optimal battery temperatures. Despite advancements, they identified a lack of spatial optimization for BTMSs and limited thermal power transfer under moderate battery temperatures. This prompted the proposal of a novel battery liquid-cooling system with a ⊥-shaped OHP to enhance volumetric utilization and heat transfer efficiency.
Considering the complex fluid dynamics and heat transfer characteristics inherent to PHPs, research on three-dimensional PHPs has gained momentum since the late 2010s. Notable examples include work by Qu et al. [23], who investigated enhancing the thermal performance using a phase change material coupled with oscillating heat pipes (OHPs). Similarly, He et al. [24] proposed a three-dimensional closed-loop pulsating heat pipe (CLPHP) design to enhance heat dissipation, revealing significant reductions in thermal resistance and improvements in heat transfer efficiency. Additionally, Yu et al. [25] introduced a novel three-dimensional oscillating heat pipe (3D-OHP) utilizing liquid metal and ammonia as working fluids to tackle high-power and high-heat-flux dissipation challenges. Their innovative approach demonstrated significant advancements in heat transfer efficiency, offering promising solutions for future battery cooling applications in electric vehicles and beyond.
Furthermore, ongoing research efforts aim to explore the potential of PHPs in addressing critical challenges in electric vehicle battery cooling. For instance, advancements in nanofluid-based PHPs, as showcased by Chen et al. [18] and Lv et al. [21], highlight the importance of leveraging nanotechnology to enhance heat dissipation and thermal uniformity in battery modules. Similarly, the exploration of hybrid PHP configurations, as demonstrated by Zhou et al. [19], offers new avenues for improving heat transfer performance and optimizing the cooling efficiency in electric vehicle applications.
In this context, a comprehensive experimental investigation into the performance of a novel 3D PHP system designed specifically for EV battery cooling is presented. The primary objective is to evaluate the thermal characteristics and operational performance of the 3D PHP system under a range of experimental conditions. Through advanced experimental techniques, meticulous analysis, and insightful discussions, we aim to unravel the complex interplay between system parameters, fluid dynamics, and heat transfer mechanisms.
In subsequent sections, the experimental methodology (Section 2) is detailed, results and discussions (Section 3) analyzing the impact of various parameters on the thermal performance of the 3D PHP system are presented, and conclusions (Section 4) are drawn by summarizing key findings, highlighting implications for future research, and providing recommendations for advancing 3D PHP technology in EV battery cooling applications. Through this comprehensive analysis, we aspire to contribute to the ongoing evolution of thermal management technologies for electric vehicles, fostering innovation and sustainability in the automotive sector.
2. Experiment
2.1. Experiment Design
2.1.1. Experiment of Thermal Characteristics
In this study, a method was devised using a 3D PHP-embedded thermal pad to transfer heat to the bottom cold plate. Experiments were conducted accordingly. The concept involved shaping the pulsating heat pipe, as depicted in Figure 2, and attaching it to pouch battery cells to transfer heat to the lower dissipating part. Experiments were conducted with changes made to the shape of the pipe to observe its characteristics.
The variables were selected as shown in Table 1 [26]. The pulsating heat pipe utilized a flexible copper tube with an internal diameter chosen according to the operating fluid, methanol, and Novec7100, using the following Equation (1) [27,28].
where is the gravity acceleration, is the density of the liquid phase, is the density of the vapor phase, is the surface tension and D is the inner diameter of PHPs. The ends of the PHP were closed-end types, and battery simulators were used to simulate heat generation. The thermodynamic properties of the working fluids are shown in Table 2 [29,30,31] and the heat generation from the batteries was calculated based on a 340 × 100 mm pouch battery 2P (Parallel), considering a maximum heat generation of 150 W, corresponding approximately to the 4C-rate, which is the maximum heat the battery simulators can withstand.
Studies on the positioning of battery lead tabs and the distribution of cell temperatures indicate that heat concentration in battery cells occurs primarily in areas where the positive electrode tabs are located. Additionally, the temperature distribution of battery cells is greatly influenced by the placement of the electrode lead tabs. Therefore, CT (Counter Tab)-type battery cells, where electrode tabs are positioned at both ends of the battery, tend to exhibit smaller temperature variances within the cell compared to NT (Nominal Tab)-type cells, where both positive and negative electrodes are positioned on one side [15,32,33,34,35,36,37,38,39,40].
Currently, vehicles equipped with electric vehicle dedicated platforms (which consume high currents) are typically fitted with CT-type batteries, as illustrated in Figure 3a. However, in some cases, NT-type batteries, as depicted in Figure 3b, are also utilized concurrently [37,39]. Consequently, this study aims to design a 3D PHP system considering the heat generation according to the electrode tab location of the battery. Two patterns are proposed: Pattern A, targeting CT-type applications, and Pattern B, targeting NT-type applications, which are shown in Figure 3. Experimental investigations were conducted accordingly.
Figure 4 shows the heat generation of a battery caused by a chemical reaction, according to the C-rate (Current(A)/Battery capacity(Ah)). The heat is calculated by following Equation (2) [41].
where Q is the total heat generation of the battery, is the reaction heat, is the polarization heat, is the side-reaction heat and is the Joule heat. During the simulation of battery heating using a battery simulator, the polarization heat and side-reaction heat were disregarded, with a focus instead on reaction heat and Joule heat for the design. The determination of reaction heat and Joule heat can be accomplished using Equations (3) and (4) [41].
where n is the number of battery cells, m is the mass of the positive and negative materials, I is the charge/discharge current, M is the molar mass, F is the Faraday constant and R is the total ohmic resistance of the battery.
2.1.2. Experiment to Verify the Flow Mechanism of Anti-Gravity 3D PHP
The internal flow visualization experiment of the 3D PHP involved connecting the middle section of the piping to a copper tube using transparent fluorine rubber tubes (HAKKOH, E-SJ-2-20M), as shown in Figure 5. The flexible copper tube used had an inner diameter of 1 mm, while the transparent fluorine rubber tube had an inner diameter of 2 mm. Methanol was chosen as the working fluid and filled to 15% capacity. A heat input of 40 W was applied to the system for consistent conditions throughout the experiment.
2.2. Experimental Setup and Procedure
2.2.1. Experiment of Thermal Characteristics
The experimental setup began with constructing a battery simulator, as depicted in Figure 6. Made of aluminum, it housed a carbon wire heater for heat distribution. Thermal grease was applied to minimize resistance, with the carbon wire heater boasting a specific resistance of 65 Ω/m for a 6 K carbon fiber heating element, totaling approximately 167.4 Ω.
Next, the 3D PHP was attached to the periphery of the battery simulator, as illustrated in Figure 6. A 1 mm thick thermal pad with a conductivity of 6 W/mk and silicone pads were utilized to optimize contact and insulate against heat dissipation. Power was supplied via an AC power supply (Max. 240 V), with precise voltage and current measurements taken to regulate heat.
The setup, detailed in Figure 6, featured a custom-designed support stand for angle adjustments. Cooling water was circulated through the base of the 3D PHP through a chiller (DRC 8, CPT INC., Gunpo-si, Republic of Korea). The 3D PHP, constructed from flexible copper, had inner and outer diameters of 1 mm and 2 mm, respectively.
Heat was applied to the battery simulator using the AC power supply, while cooling water was supplied to the condensation section (bottom) of the 3D PHP, as depicted in Figure 6. Temperature data were collected using Yokogawa MX-100 (Yokogawa Electric Corporation, Japan) and thermocouples placed on the PHP and heater, as shown in Figure 7, which meet K-type specifications. The error margin for the K-type thermocouples was ±0.75% [42], and for the MX-100, it was ±0.05% [43].
A vacuum pump (V-i2120, Zhejiang Value Mechanical & Electrical Products Co., Ltd., Zhejiang, China) created a vacuum pressure of up to 69 Pa. The working fluid was charged using a 1 cc syringe in increments of 0.01 cc. The internal volumes of the 3D PHPs were as follows: Pattern A, 3.26 cc, and Pattern B, 2.58 cc.
Voltage measurements were taken using a Fluke87 True RMS multimeter (Fluke Corporation, Japan) with an error margin of ±1% [44]. Current measurements were taken using a Fluke324 True RMS clamp meter multimeter (Fluke Corporation, Japan) with a maximum error tolerance of ±2%, ensuring reliable and reproducible outcomes [45].
2.2.2. Experiment to Verify the Flow Mechanism of Anti-Gravity 3D PHP
The flow visualization experiment for the 3D PHP was conducted following the setup shown in Figure 8. To ensure controlled heating, two polyimide film heaters were used. These heaters, each capable of delivering a maximum power of 100 W and measuring 150 × 120 mm, were strategically placed to evenly distribute a total heat input of 40 W across both ends of the 3D PHP.
Efficient cooling and stable operating temperatures were maintained by fully immersing the condenser section of the 3D PHP in a tank filled with cooling water. This water was kept cool by a cold plate connected to a chiller unit (RBC 9, Human Science, Hanam, Republic of Korea).
Capturing the dynamic flow pattern of the 3D PHP required the use of a high-resolution camera equipped with advanced optics. The main lens of the camera had a 48 MP resolution, a 24 mm focal length, and an ƒ/1.78 aperture. The footage recorded was of 4 K quality at 60 fps.
To ensure optimal visibility and minimize potential distortions in the recorded imagery, illumination was provided by three LED lights. Two LED lights emitted 1000 nit each, while one emitted 2000 nit. This carefully selected lighting configuration ensured uniform brightness without any flickering issues, thereby enhancing the clarity and precision of the captured footage.
3. Results and Discussion
As mentioned earlier, when heat was applied to the battery simulator, the characteristics of the 3D PHP were analyzed based on the temperature of the evaporator and condenser, through thermal resistance and temperature distribution. The thermal resistance used in this analysis is calculated using the following Equation (5) [46,47,48].
where is the mean temperature of battery simulator, is the mean temperature of condenser and Q is the supplied heat to the battery simulator, which is calculate by Equation (6) [20].
where V is the input voltage and I is the electric current. Experimental uncertainties in directly measuring the temperature (T), voltage (V), and current (I) were synthesized based on the system uncertainty analysis, as demonstrated by the thermal resistance Equation (7) [20,49].
where is the total uncertainty error and is the partial and total uncertainty errors, respectively. Based on Equation (7), the maximum uncertainty for thermal resistance in the current was ±1.78%.
3.1. Results of Thermal Characteristics
3.1.1. Effect of Filling Ratio
The analysis conducted when a heat supply of 50 W was provided reveals variations in the thermal performance of the 3D PHP with different filling ratios and working fluids. Notably, at filling ratios of 10% and 15%, the thermal resistance is observed to be at its lowest, as shown in Figure 9. This finding emphasizes the critical influence of filling ratio on the thermal characteristics of the PHP system.
It is interesting to note that Novec7100, characterized by a higher density compared to methanol, exhibits the lowest thermal resistance at a filling ratio of 10%. Conversely, methanol presents a relatively higher thermal resistance under similar conditions. This performance difference can be attributed to the operational dynamics of the 3D PHP under upper heating and lower cooling conditions. The relatively lower density of methanol facilitates smoother operation, enabling it to secure the necessary momentum for effective heat transfer within the system.
Further investigation into the optimal operating conditions reveals that the lowest thermal resistance occurs with 15% methanol filling, Pattern A, and vertical orientation, achieving an impressive thermal resistance of 0.476 °C/W. Across various experimental configurations, the 15% filling ratio consistently demonstrates superior operating performance under a condition of Q = 50 W.
Moreover, it is noteworthy that when considering both the heat supply and fluid filling amount, methanol proves most effective at a 15% filling ratio when 50 W of heat is supplied. This highlights the intricate interplay between fluid properties, filling ratio, and operational parameters in optimizing the thermal performance of the 3D PHP system for battery cooling applications.
Figure 10 depicts the thermal resistance under a heat supply of 100 W, offering insights similar to those observed with a 50 W supply. This comparative analysis sheds light on the thermal behavior of the system across varying heat loads. The finding that Novec7100 exhibits the lowest thermal resistance at a 15% filling ratio further accentuates its suitability for effective heat transfer within the system. This observation suggests that at this specific filling ratio, the fluid possesses adequate momentum to facilitate efficient circulation and heat dissipation, optimizing thermal performance.
Delving deeper into the specifics, Novec7100 demonstrates superior thermal resistance at a 15% filling ratio, Pattern A, and a 30-degree inclination, registering a commendable value of 0.472 °C/W. Conversely, methanol showcases its optimal performance under different conditions, excelling at a 15% filling ratio, Pattern A, and a vertical orientation, with a thermal resistance of 0.433 °C/W.
Thus, when faced with a heat supply of 100 W, the comprehensive analysis reaffirms the 15% filling ratio as the optimal condition across diverse operational configurations. This understanding emphasizes the critical role of fluid dynamics and system parameters in achieving efficient thermal management, particularly in high-power applications like battery cooling for electric vehicles.
As depicted in Figure 11, an observable trend emerges wherein an increase in the supplied heat correlates with a decrease in thermal resistance, particularly noticeable at filling ratios of 15% and 20%. This observation highlights the dynamic interplay between heat supply, fluid dynamics, and system performance.
Of particular interest is the consistent observation of the lowest thermal resistance at a 20% filling ratio of methanol under vertical conditions, showcasing a remarkably low value of 0.401 °C/W. Furthermore, this trend extends to Novec7100, with thermal resistance also exhibiting a reduction at a 20% filling ratio.
The study demonstrates interesting characteristics by showing that the device has the unique working mechanism of the PHP, which has an inverted position of evaporation and condensing part compared to the conventional system of PHPs. The preliminary study of the concept of top heating and bottom cooling systems in PHPs was conducted by Chi et al. (2019) [16]. The system which has a massive upper evaporating area and a relatively small condensing area is not an ideal formation for the OHP to work properly, even though the device worked at a certain range of conditions. Figure 12 indicates the thermal resistance according to the filling ratio of the PHP in both of the studies.
For case (a) in Figure 12, the device that has a 2 mm outer diameter and 1 mm inner diameter showed the lowest thermal resistance as 2.088 °C/W at a 14.7% filling ratio for Methanol as a working fluid when supplied 20 W heat. To improve the result of the study by chi et al. [16], enlarging the area of the condensing part was proposed as a solution. By composing the condensing part in a three-dimensional structure, the contact surface of the cooling part was maximized, maintaining the identical inner and outer diameter for the device. In Figure 12b, the thermal resistance increased after hitting the low point when supplied 50 W of heat at a 15% filling ratio, resulting in 0.476 °C/W for methanol and 0.522 °C/W for Novec7100, respectively, which indicates a similar tendency to the case of (a) in Figure 12.
Consequently, it is conceived that there is a tendency for the optimal filling ratio for PHP to consist of a range from 10% to 15% as increasing the condensing area leads to a reduction in thermal resistance.
These findings prompt a deeper exploration into the underlying mechanisms governing fluid behavior and heat transfer within the system. It is suggested that at higher heat supply levels, the working fluid acquires sufficient momentum to counteract gravitational forces, thereby enhancing fluid circulation and heat dissipation.
Conversely, at a 10% filling ratio, the proportion of the working fluid is comparatively lower, potentially impeding its ability to facilitate adequate heat transfer relative to the supplied heat load. This underscores the critical role of filling ratio in optimizing the thermal performance and emphasizes the necessity of tailored fluid dynamics for efficient heat management in diverse operating conditions.
The categorization of battery heat generation into specific rates provides insights into the varying heat dissipation levels across different charging scenarios. Under typical conditions, electric vehicles operate at approximately a 3C-rate during periods of maximum acceleration. Consequently, a filling ratio of 15% is deemed optimal for discharge processes, ensuring efficient heat management and battery performance.
However, the dynamics change during rapid charging sessions, where the utilization of a maximum 5C-rate becomes common. This shift introduces complexities in determining the ideal filling ratio for optimal performance. Therefore, further experiments and evaluations are imperative to comprehensively understand and address the implications of these charging dynamics on battery thermal management, crucial for enhancing the efficiency and longevity of electric vehicle battery systems.
3.1.2. Effect of Inclination
Figure 13 illustrates the operational behavior of Pattern A with a 15% filling ratio of methanol concerning variations in inclination angle. This analysis delves into the impact of inclination angle on the thermal characteristics of the system under consideration.
In the context of the specified operating conditions, as shown in Figure 13a, it becomes evident that an increase in inclination angle correlates with a corresponding increase in thermal resistance. This observation highlights the importance of considering the geometric configuration, such as inclination angle, in optimizing the thermal performance of the system.
However, upon closer examination, it is intriguing to note that when a heat supply of 150 W is provided, the extent of the increase in thermal resistance with the inclination angle is relatively modest. Specifically, the thermal resistance increases from 0.406 °C/W to 0.443 °C/W in the case of a vertical orientation. This observation suggests that while inclination angle does exert some influence on thermal resistance, its impact appears to be mitigated to some extent. This phenomenon can be attributed to the system’s ability to maintain sufficient momentum in the flow of the working fluid, despite variations in the inclination angle.
Figure 13b–d depict the results of FFT (Fast Fourier Transform) analysis for the evaporator (T17) under the condition of 50 W heat input, Pattern A, with varying angles. In these results, a notable amplitude at 0.2724 Hz is observed under the vertical condition compared to other frequency ranges. However, with an increase in the inclination angle, the temperature oscillations become irregular, vibrating at non-constant frequencies, and the amplitude tends to decrease. These findings align with the trend of increasing thermal resistance as the angle increases, as shown in Figure 13a. Furthermore, they support the observation that under the conditions of Pattern A, methanol 15%, the heat transfer efficiency decreases as the angle increases.
Figure 14 presents a detailed analysis of the operational characteristics of Pattern A, specifically focusing on the behavior observed with a 15% filling ratio of Novec7100 and its response to variations in the inclination angle. This investigation offers valuable insights into the interaction of different operating parameters with the system’s performance.
In contrast to methanol, which was previously examined, the utilization of Novec7100 reveals intriguing nuances in thermal behavior. Notably, when subjected to heat supplies of 100 W and 150 W, it is observed that the thermal resistance is minimized at an inclination angle of 30 degrees.
However, the thermal resistance shifts when the supplied heat is reduced to 50 W. Under these conditions, in Figure 14a, the lowest thermal resistance is recorded in the vertical orientation, measuring 0.522 °C/W. Conversely, at an inclination angle of 15 degrees, the highest thermal resistance is noted, reaching 0.604 °C/W. This variation in thermal behavior across different inclination angles highlights the importance of understanding how system parameters interact to influence performance outcomes.
Figure 14b–d present the results of FFT analysis for the evaporator (T17) under the condition of 50 W heat input, Pattern A, with Novec7100 filled to 15%, varying by angle. In these results, under the vertical condition, the 1st mode appears at 0.2778 Hz with an amplitude of 0.1253. As the angle increases, the 1st mode frequency relatively increases, but there is a notable decrease in amplitude. These findings suggest a decrease in heat transfer performance when considering the heat transfer mechanism of the PHP. However, under conditions of upper heating and lower cooling, as depicted in Figure 15, the influence of the gravity of the working fluid cannot be disregarded. With increasing angle, although the amplitude of the evaporator temperature decreases relatively, considering the effect of fluid flow due to the gravity of the liquid inside the PHP (sinα) with the high density of Novec7100, the flow effect due to the self-gravity of the PHP internal liquid also decreases. Due to these complex relationships, it is inferred that the thermal resistance increases at an inclination angle of 15 degrees and decreases at 30 degrees.
The analysis of Pattern B with a 15% filling ratio of methanol, as presented in Figure 16, reveals intriguing insights into its thermal characteristics. Unlike Pattern A, where the thermal resistance generally increased with inclination angle, Pattern B demonstrates a contrasting behavior, showing a reduction in thermal resistance as the inclination angle increases. This unique phenomenon offers a new perspective on the interplay between system geometry and fluid dynamics in thermal management.
Upon closer examination, it becomes apparent that the observed decrease in thermal resistance is most pronounced when a heat supply of 50 W is provided. However, even under higher heat supply conditions of 100 W and 150 W, a subtle but consistent reduction in thermal resistance is observed with increasing inclination angle. These findings suggest a nuanced relationship between inclination angle and thermal behavior within Pattern B.
For instance, when subjected to a heat supply of 50 W, the thermal resistance notably decreases from 0.608 °C/W in the vertical orientation to 0.544 °C/W at a 30-degree inclination angle. Similarly, under 100 W conditions, the thermal resistance decreases from 0.516 °C/W in the vertical orientation to 0.504 °C/W at a 30-degree inclination angle. Likewise, for 150 W, the thermal resistance decreases from 0.477 °C/W in the vertical orientation to 0.469 °C/W at a 30-degree inclination angle.
When reviewing Figure 16b–d, a clear trend emerges in Pattern B. The FFT analysis results of the evaporator (T6) indicate that as the inclination angle increases, the 1st mode frequency also increases, while maintaining similar amplitudes. At the point where the inclination angle is 30 degrees, a relatively rapid temperature oscillation is observed, with a 1st mode frequency of 0.3582 Hz and an amplitude of 0.3105. Therefore, in Pattern B, it can be observed that as the inclination angle increases, the heat transfer performance also increases.
Such variations in thermal behavior can be attributed to the inherent non-uniformity of Pattern B. The fluctuating pipe height of the PHP in Pattern B introduces complexities in fluid flow dynamics, necessitating a relatively greater momentum for efficient flow. However, as the PHP tilts, the momentum requirement for fluid flow diminishes, resulting in a reduction in thermal resistance.
3.1.3. Effect of Patterns
The experimental analysis aimed to comprehensively investigate the operational performance of the 3D PHP under two distinct configurations: Pattern A, characterized by a consistent pipe height, and Pattern B, where the pipe height varies. Through testing, these configurations were examined to understand their respective impacts on the PHP’s functionality.
The findings, as presented in Figure 17, provide insights into the operational dynamics of Pattern A, particularly under conditions of a 15% filling ratio of methanol and vertical orientation. The results reveal notable temperature oscillations within both the evaporator and condenser sections, indicating effective heat transfer and fluid circulation within the PHP.
However, upon closer examination, a disparity in fluid circulation patterns across different regions of the PHP becomes apparent. While the central region displays vigorous oscillations of the working fluid, as depicted in Figure 17b,c, there is a noticeable suppression of fluid circulation towards the lateral sides. The right graphs of Figure 17b,c illustrate the FFT analysis results of T17 and T26, respectively. T17, positioned in the center, displays relatively large oscillations with a consistent frequency (1st mode: 0.2624 Hz, Amplitude: 0.057), as shown in the transient temperature graph over time. In contrast, T26, located on the side, exhibits highly irregular oscillations without a consistent frequency.
These results indicate that heat transfer is more active in the center than on the sides in Pattern A. This is expected due to the blocked-end configuration, which typically results in reduced flow in the lateral sections. However, closed-end PHPs ensure stable heat transfer performance with increasing turns, and closed-end PHPs with a certain number of turns exhibit comparatively minor changes in heat transfer performance due to inclination compared to closed-loop PHPs. Therefore, further evaluation of heat characteristics based on variations in the number of turns is deemed necessary in this study [50].
The results from Pattern B, where the pipe height varies, with a 15% methanol filling ratio and vertical orientation, are illustrated in Figure 18. Unlike Pattern A, which maintains a constant pipe height, Pattern B provides insights into how changes in pipe height affect the operational behavior of the 3D PHP.
Upon closer inspection of the findings depicted in Figure 18b,c, it is clear that the fluid oscillation is significantly reduced within sections where the pipe height varies. The FFT analysis outcomes for T23 and T6 are presented in the right graphs of Figure 18b,c, respectively. T6, situated on the side of Pattern B, shows substantial oscillations with a consistent frequency (1st mode: 0.2685 Hz, Amplitude: 0.1717), as indicated in the transient temperature graph over time. Conversely, T23, positioned in the variable height section, exhibits irregular oscillations without a consistent frequency. These findings suggest that in Pattern B, fluid flow differs from that in Pattern A, with more vigorous heat transfer observed toward the side as the height varies.
This observation implies that irregularities in pipe height may create stagnant flow areas, potentially compromising the overall efficiency of the PHP. However, interestingly, regions further away from the sections with varying pipe heights show notably vigorous fluid oscillations. This observation prompts inquiries into the complex interaction between fluid dynamics and geometric configurations within the PHP.
While the presence of stagnant flow regions within continuous pipes with varying heights poses a significant operational challenge, there are potential benefits in terms of localized heat dissipation. Given that battery cell heat dissipation characteristics often exhibit non-uniformity, a PHP design that accommodates these variations could be advantageous in addressing localized heat buildup.
3.2. Flow Mechanism of Anti-Gravity 3D PHP
The flow mechanism and internal flow pattern of the anti-gravity 3D PHP are depicted in Figure 19. As illustrated in Figure 19a, when heat is supplied from the top, it induces oscillations of the liquid plug at the bottom condenser (①), gradually moving as pressure gradients form to allow the liquid plug to ascend. Once the liquid plug reaches the upper evaporator, it instantaneously vaporizes and transfers heat as it moves to another section of the pipe.
The vapor generated at the upper evaporator swiftly descends to the lower condenser (②), displacing the liquid in the condenser and forming a liquid film on the walls of the PHP tube. As depicted in ③, the vapor is condensed at the bottom part of the device reboiling liquid plug back the upper evaporator to the lower condenser.
The flow behavior of the anti-gravity 3D PHP exhibits relatively slow and irregular patterns compared to the PHP under conditions of bottom heating and top cooling. However, once the momentum to overcome gravity and sustain flow is attained, the working fluid circulates rapidly until pressure equilibrium is achieved, facilitating heat transfer. Operation under anti-gravity conditions necessitates greater pressure gradients due to gravitational interference, resulting in longer irregular circulation cycles compared to conventional conditions.
In the internal abnormal flow of the anti-gravity 3D PHP, bubbly flow is not observed. This is because the working fluid accumulates in the lower condenser, causing the liquid phase of the working fluid not to be positioned at the evaporator at the beginning of operation. Specifically, as the liquid accumulates at the condenser, it vibrates itself with short and small-amplitude oscillations. Therefore, variety flow patterns are simultaneously observed when significant pressure gradients are formed inside the PHP, as shown in Figure 19b.
Annular flow is observed due to the phenomenon of vapor pushing out the liquid accumulated in the condenser and circulating rapidly, but it is not sustained continuously. Slug flow is also intermittently observed, mainly in pipes where annular flow is not formed. This is because the momentum generated as the liquid plug vaporizes at the upper evaporator initially pushes out the liquid at the bottom and forms annular flow, but as it moves to other pipes, the flow momentum decreases, leading to the observation of vapor/liquid slug/plug.
4. Conclusions
In this study, experimental research on the fundamental operational characteristics and performance of a uniquely shaped 3D PHP designed for cooling pouch batteries in electric vehicles was conducted. Various factors, including the type of working fluid, filling ratio, patterns, inclination angle, and supplied heat, were explored. The findings are summarized as follows:
- Effect of Filling Ratio and Supplied Heat: The optimal filling ratio for methanol in the 3D PHP, regardless of pattern, was found to be 15% under vertical conditions with 50 W and 100 W heat supply. At 100 W, Pattern A and vertical orientation showed the lowest thermal resistance at 0.433 °C/W. When heat supply increased to 150 W, the optimal filling ratio shifted to 20%, resulting in a thermal resistance of 0.400 °C/W. Similarly, for Novec7100, the 15% filling ratio was optimal at 50 W and 100 W heat supply, while at 150 W, it shifted to 20%. The lowest thermal resistance recorded was 0.437 °C/W at a 20% filling rate under vertical conditions with 150 W supply heat. Comparatively, the 3D PHP exhibited lower thermal resistance than the 2D PHP, which was evaluated by chi et al. [16], due to its larger condenser.
- Effect of Inclination Angle: When methanol was used as the working fluid, the thermal resistance increased with higher inclination angles in Pattern A, where the height remained fixed. Conversely, in Pattern B, which featured varying heights, there was a trend of decreasing thermal resistance as the inclination angle increased. These findings suggest that the irregular structure of Pattern B is advantageous for the working fluid to overcome gravity and acquire momentum for flow as the inclination angle rises. Furthermore, in Pattern A with Novec7100 as the working fluid, the highest thermal resistance was observed at a 15-degree inclination angle, while relatively lower thermal resistance was noted under vertical and 30-degree conditions. FFT analysis of the evaporator temperature indicated that even in Pattern A with Novec7100, temperature amplitude and oscillation characteristics were most favorable under vertical conditions. However, due to its relatively high density, the combined effects of nucleation-driven momentum at the evaporator and decreasing gravity with increasing inclination angle contributed to the complex thermal behavior.
- Effect of Patterns: The evaluation results of Pattern A (designed with uniform heat generation across the front) and Pattern B (designed for localized heat dissipation, with varying heights) are as follows. In the case of Pattern A, vigorous temperature oscillations are observed in the center, while weaker temperature oscillations are noted towards the sides. This phenomenon is attributed to the general tendency of reduced flow in the lateral sections due to the nature of closed-end PHPs, which could potentially be mitigated by varying the number of turns. For Pattern B, there is a significant decrease in heat transfer performance in the regions where the height varies, and as one moves away from these regions, there is a notable improvement in temperature oscillations and amplitudes. These results suggest, as hypothesized initially, that PHPs can be designed to accommodate localized battery heating based on the shape of the 3D PHP.
- Flow Mechanism: The flow mechanism of the anti-gravity 3D PHP involves longer and more irregular cycles compared to the short-cycle flow typically observed in conventional PHPs. Initially, the liquid plug undergoes rapid oscillations at the bottom condenser until a pressure gradient forms to overcome gravity, allowing it to ascend to the upper section. Subsequently, the liquid plug moves gradually to the upper evaporator, where it instantly vaporizes and transfers to another section of the piping. During this process, heat rapidly diffuses as gas moves within the 3D PHP. Eventually, when the internal pressure gradient decreases to the point where gravity cannot be overcome, the liquid gathers again at the bottom condenser.
Author Contributions
Conceptualization, J.-S.L. and S.-H.R.; Data curation, J.-S.L., S.-H.R. and W.-S.H.; Formal analysis, J.-S.L.; Funding acquisition, S.-H.R.; Investigation, J.-S.L. and S.-J.K.; Methodology, J.-S.L. and S.-H.R.; Project administration, S.-H.R.; Supervision, S.-H.R.; Visualization, S.-J.K.; Writing—original draft, J.-S.L.; Writing—review and editing, S.-J.K., S.-H.R. and W.-S.H. All authors have read and agreed to the published version of the manuscript.
Funding
This research was supported by the Basic Science Research Program through the National Research Foundation of Korea (NRF) funded by the Ministry of Education (grant number: NRF-2022R1I1A3054588).
Data Availability Statement
Data are contained within the article.
Acknowledgments
This work was conducted during the research year of Chungbuk National University in 2024.
Conflicts of Interest
The authors declare no conflicts of interest.
Nomenclature
| English | |
| D | Diameter, m |
| F | Faraday constant |
| I | Electric current, C/mol |
| m | Mass of the positive and negative material of battery, kg |
| n | Number of battery cells |
| Q | Total heat generation of the battery, W |
| The reaction heat, W | |
| The polarization heat, W | |
| The side-reaction heat, W | |
| The Joule heat, W | |
| R | Electric resistance, Ω |
| Thermal resistance, °C/W | |
| Average temperature of battery simulator, °C | |
| Average temperature of condenser, °C | |
| The total uncertainty error, % | |
| The partial uncertainty error, % | |
| V | Voltage, V |
| Greek | |
| Density of liquid phase, kg/m3 | |
| Density of vapor phase, kg/m3 | |
| Surface tension, dynes/cm |
References
- Etacheri, V.; Marom, R.; Elazari, R.; Salitra, G.; Aurbach, D. Challenges in the Development of Advanced Li-Ion Batteries: A Review—Energy & Environmental Science (RSC Publishing). Available online: https://pubs.rsc.org/en/content/articlelanding/2011/ee/c1ee01598b (accessed on 4 March 2024).
- Husain, I.; Ozpineci, B.; Islam, M.S.; Gurpinar, E.; Su, G.-J.; Yu, W.; Chowdhury, S.; Xue, L.; Rahman, D.; Sahu, R. Electric Drive Technology Trends, Challenges, and Opportunities for Future Electric Vehicles. Proc. IEEE 2021, 109, 1039–1059. [Google Scholar] [CrossRef]
- Álvarez Fernández, R. A More Realistic Approach to Electric Vehicle Contribution to Greenhouse Gas Emissions in the City. J. Clean. Prod. 2018, 172, 949–959. [Google Scholar] [CrossRef]
- Borge-Diez, D.; Icaza, D.; Açıkkalp, E.; Amaris, H. Combined Vehicle to Building (V2B) and Vehicle to Home (V2H) Strategy to Increase Electric Vehicle Market Share. Energy 2021, 237, 121608. [Google Scholar] [CrossRef]
- Shah, K.; Chalise, D.; Jain, A. Experimental and Theoretical Analysis of a Method to Predict Thermal Runaway in Li-Ion Cells. J. Power Sources 2016, 330, 167–174. [Google Scholar] [CrossRef]
- Wang, Q.; Ping, P.; Zhao, X.; Chu, G.; Sun, J.; Chen, C. Thermal Runaway Caused Fire and Explosion of Lithium Ion Battery. J. Power Sources 2012, 208, 210–224. [Google Scholar] [CrossRef]
- Wang, Z.; Ching, T.W.; Huang, S.; Wang, H.; Xu, T. Challenges Faced by Electric Vehicle Motors and Their Solutions|IEEE Journals & Magazine|IEEE Xplore. Available online: https://ieeexplore.ieee.org/abstract/document/9298789 (accessed on 5 March 2024).
- Chavan, S.; Venkateswarlu, B.; Prabakaran, R.; Salman, M.; Joo, S.W.; Choi, G.S.; Kim, S.C. Thermal Runaway and Mitigation Strategies for Electric Vehicle Lithium-Ion Batteries Using Battery Cooling Approach: A Review of the Current Status and Challenges. J. Energy Storage 2023, 72, 108569. [Google Scholar] [CrossRef]
- Yacoub Al Shdaifat, M.; Zulkifli, R.; Sopian, K.; Adel Salih, A. Basics, Properties, and Thermal Issues of EV Battery and Battery Thermal Management Systems: Comprehensive Review. Proc. Inst. Mech. Eng. Part D J. Automob. Eng. 2023, 237, 295–311. [Google Scholar] [CrossRef]
- Khandekar, S.; Groll, M. An Insight into Thermo-Hydrodynamic Coupling in Closed Loop Pulsating Heat Pipes. Int. J. Therm. Sci. 2004, 43, 13–20. [Google Scholar] [CrossRef]
- Shafii, M.B.; Faghri, A.; Zhang, Y. Thermal Modeling of Unlooped and Looped Pulsating Heat Pipes. J. Heat Transf. 2001, 123, 1159–1172. [Google Scholar] [CrossRef]
- Khandekar, S.; Charoensawan, P.; Groll, M.; Terdtoon, P. Closed Loop Pulsating Heat Pipes Part B: Visualization and Semi-Empirical Modeling. Appl. Therm. Eng. 2003, 23, 2021–2033. [Google Scholar] [CrossRef]
- Wu, H.; Niu, M.; Shao, Y.; Wang, M.; Li, M.; Liu, X.; Li, Z. Investigations of Li-Ion Battery Thermal Management Systems Based on Heat Pipes: A Review. ACS Omega 2024, 9, 97–116. [Google Scholar] [CrossRef] [PubMed]
- Zhao, X.; Su, L.; Jiang, J.; Deng, W.; Zhao, D. A Review of Working Fluids and Flow State Effects on Thermal Performance of Micro-Channel Oscillating Heat Pipe for Aerospace Heat Dissipation. Aerospace 2023, 10, 179. [Google Scholar] [CrossRef]
- Lee, J.-J.; Kim, J.-S.; Lee, D.-C.; Chang, H.; Kim, C.-W. Design Optimization of Tab Attachment Positions and Cell Aspect Ratio to Minimize Temperature Difference in 45-Ah LFP Large-Format Lithium-Ion Pouch Cells. Appl. Therm. Eng. 2021, 182, 116143. [Google Scholar] [CrossRef]
- Chi, R.-G.; Rhi, S.-H. Oscillating Heat Pipe Cooling System of Electric Vehicle’s Li-Ion Batteries with Direct Contact Bottom Cooling Mode. Energies 2019, 12, 1698. [Google Scholar] [CrossRef]
- Chen, P.; Harmand, S.; Ouenzerfi, S. Immersion Cooling Effect of Dielectric Liquid and Self-Rewetting Fluid on Smooth and Porous Surface. Appl. Therm. Eng. 2020, 180, 115862. [Google Scholar] [CrossRef]
- Chen, M.; Li, J. Nanofluid-Based Pulsating Heat Pipe for Thermal Management of Lithium-Ion Batteries for Electric Vehicles. J. Energy Storage 2020, 32, 101715. [Google Scholar] [CrossRef]
- Zhou, Z.; Lv, Y.; Qu, J.; Sun, Q.; Grachev, D. Performance Evaluation of Hybrid Oscillating Heat Pipe with Carbon Nanotube Nanofluids for Electric Vehicle Battery Cooling. Appl. Therm. Eng. 2021, 196, 117300. [Google Scholar] [CrossRef]
- Chung, W.-S.; Lee, J.-S.; Rhi, S.-H. Thermal Management System Using Pulsating Heat Pipe of Cylindrical Battery Cell. J. Mech. Sci. Technol. 2023, 37, 6711–6725. [Google Scholar] [CrossRef]
- Lv, W.; Li, J.; Chen, M. Experimental Study on the Thermal Management Performance of a Power Battery Module with a Pulsating Heat Pipe under Different Thermal Management Strategies. Appl. Therm. Eng. 2023, 227, 120402. [Google Scholar] [CrossRef]
- Hongkun, L.; Noor, M.M.; Wenlin, Y.; Kadirgama, K.; Badruddin, I.A.; Kamangar, S. Experimental Research on Heat Transfer Characteristics of a Battery Liquid-Cooling System with ⊥-Shaped Oscillating Heat Pipe under Pulsating Flow. Int. J. Heat Mass Transf. 2024, 224, 125363. [Google Scholar] [CrossRef]
- Qu, J.; Ke, Z.; Zuo, A.; Rao, Z. Experimental Investigation on Thermal Performance of Phase Change Material Coupled with Three-Dimensional Oscillating Heat Pipe (PCM/3D-OHP) for Thermal Management Application. Int. J. Heat Mass Transf. 2019, 129, 773–782. [Google Scholar] [CrossRef]
- He, Y.; Jiao, D.; Pei, G.; Hu, X.; He, L. Experimental Study on a Three-Dimensional Pulsating Heat Pipe with Tandem Tapered Nozzles. Exp. Therm. Fluid Sci. 2020, 119, 110201. [Google Scholar] [CrossRef]
- Yu, C.; Ji, Y.; Li, Y.; Liu, Z.; Chu, L.; Kuang, H.; Wang, Z. A Three-Dimensional Oscillating Heat Pipe Filled with Liquid Metal and Ammonia for High-Power and High-Heat-Flux Dissipation. Int. J. Heat Mass Transf. 2022, 194, 123096. [Google Scholar] [CrossRef]
- Mitra, A. The Taguchi Method. WIREs Comput. Stats 2011, 3, 472–480. [Google Scholar] [CrossRef]
- Bhagat, R.D.; Watt, K.M. Effect of Bond Number, Working Fluid and Operating Temperature on Thermal Performance of Closed Loop Pulsating Heat Pipe. In Proceedings of the 2016 International Conference on Electrical, Electronics, and Optimization Techniques (ICEEOT), Chennai, India, 3–5 March 2016; IEEE: Chennai, India, 2016. [Google Scholar]
- Charoensawan, P.; Khandekar, S.; Groll, M.; Terdtoon, P. Closed Loop Pulsating Heat Pipes: Part A: Parametric Experimental Investigations. Appl. Therm. Eng. 2003, 23, 2009–2020. [Google Scholar] [CrossRef]
- Methanol—Thermophysical Properties. Available online: https://www.engineeringtoolbox.com/methanol-methyl-alcohol-properties-CH3OH-d_2031.html (accessed on 7 April 2024).
- Lin, H.-C.; Kang, C.-H.; Cheng, H.-C.; Chang, T.-L.; Chen, P.-H. Saturated Boiling Enhancement of Novec-7100 on Microgrooved Surfaces with Groove-Induced Anisotropic Properties. Appl. Sci. 2024, 14, 495. [Google Scholar] [CrossRef]
- 3M. 3MTM NovecTM 7100 Engineered Fluid. Available online: https://multimedia.3m.com/mws/media/199818O/3m-novec-7100-engineered-fluid.pdf (accessed on 7 April 2024).
- Chen, M.; Bai, F.; Song, W.; Lv, J.; Lin, S.; Feng, Z.; Li, Y.; Ding, Y. A Multilayer Electro-Thermal Model of Pouch Battery during Normal Discharge and Internal Short Circuit Process. Appl. Therm. Eng. 2017, 120, 506–516. [Google Scholar] [CrossRef]
- Du, S.; Jia, M.; Cheng, Y.; Tang, Y.; Zhang, H.; Ai, L.; Zhang, K.; Lai, Y. Study on the Thermal Behaviors of Power Lithium Iron Phosphate (LFP) Aluminum-Laminated Battery with Different Tab Configurations. Int. J. Therm. Sci. 2015, 89, 327–336. [Google Scholar] [CrossRef]
- Kosch, S.; Rheinfeld, A.; Erhard, S.V.; Jossen, A. An Extended Polarization Model to Study the Influence of Current Collector Geometry of Large-Format Lithium-Ion Pouch Cells. J. Power Sources 2017, 342, 666–676. [Google Scholar] [CrossRef]
- Lee, D.-C.; Lee, J.-J.; Kim, J.-S.; Cho, S.; Kim, C.-W. Thermal Behaviors Analysis of 55 Ah Large-Format Lithium-Ion Pouch Cells with Different Cell Aspect Ratios, Tab Locations, and C-Rates. Appl. Therm. Eng. 2020, 175, 115422. [Google Scholar] [CrossRef]
- Lee, G. Electro-Thermal Analysis of a Pouch–Type Lithium–Ion Battery with a High Discharge Rate for Urban Air Mobility. Batteries 2023, 9, 476. [Google Scholar] [CrossRef]
- Lee, J.-J.; Kim, J.-S.; Chang, H.-K.; Lee, D.-C.; Kim, C.-W. The Effect of Tab Attachment Positions and Cell Aspect Ratio on Temperature Difference in Large-Format LIBs Using Design of Experiments. Energies 2020, 14, 116. [Google Scholar] [CrossRef]
- Li, Z.; Zhang, J.; Wu, B. Thermal design optimization of laminated lithium ion battery based on the analytical solution of planar temperature distribution. Sci. Sin. Technol. 2014, 44, 1154–1172. [Google Scholar] [CrossRef]
- Samba, A.; Omar, N.; Gualous, H.; Capron, O.; Van Den Bossche, P.; Van Mierlo, J. Impact of Tab Location on Large Format Lithium-Ion Pouch Cell Based on Fully Coupled Tree-Dimensional Electrochemical-Thermal Modeling. Electrochim. Acta 2014, 147, 319–329. [Google Scholar] [CrossRef]
- Song, W.; Chen, M.; Bai, F.; Lin, S.; Chen, Y.; Feng, Z. Non-Uniform Effect on the Thermal/Aging Performance of Lithium-Ion Pouch Battery. Appl. Therm. Eng. 2018, 128, 1165–1174. [Google Scholar] [CrossRef]
- Yuan, Q.; Xu, X.; Zhu, L.; Tong, G. Effects of Local Thermal Accumulation Conditions on the Thermal Characteristics of Lithium-Ion Batteries under High-Rate Charging. J. Energy Eng. 2020, 146, 04020072. [Google Scholar] [CrossRef]
- Calculating Thermocouple Measurement Error in DMM/Switch Temperature Measurement Systems—NI. Available online: https://knowledge.ni.com/KnowledgeArticleDetails?id=kA03q000000x0dBCAQ&l=en-US (accessed on 4 March 2024).
- Yokogawa Electric Corporation. MX100/MW100 Specifications. 2007. Available online: https://web-material3.yokogawa.com/GS04M10A01-01E.pdf (accessed on 16 March 2024).
- Fluke Corporation. Users Manual, True-RMS Multimeter. Available online: https://www.instrumart.com/assets/179-manual.pdf (accessed on 16 March 2024).
- Fluke Corporation. Users Manual, True-RMS Clamp Meters. Available online: https://www.fluke-direct.com/pdfs/cache/www.fluke-direct.com/fluke/clamp_meter/324/manual/fluke_324_clamp_meter_manual.pdf (accessed on 16 March 2024).
- Holman, J.P. Heat Transfer, 10th ed.; McGraw-Hill: New York, NY, USA, 2010. [Google Scholar]
- Ahmadi, M.H.; Sadeghzadeh, M.; Raffiee, A.H.; Chau, K. Applying GMDH Neural Network to Estimate the Thermal Resistance and Thermal Conductivity of Pulsating Heat Pipes. Eng. Appl. Comput. Fluid Mech. 2019, 13, 327–336. [Google Scholar] [CrossRef]
- Dreiling, R.; Zimmermann, S.; Nguyen-Xuan, T.; Schreivogel, P.; di Mare, F. Thermal Resistance Modeling of Flat Plate Pulsating Heat Pipes. Int. J. Heat Mass Transf. 2022, 189, 122668. [Google Scholar] [CrossRef]
- Moffat, R.J. Describing the Uncertainties in Experimental Results. Exp. Therm. Fluid Sci. 1988, 1, 3–17. [Google Scholar] [CrossRef]
- Jun, S.; Kim, S.J. Comparison of the Thermal Performances and Flow Characteristics between Closed-Loop and Closed-End Micro Pulsating Heat Pipes. Int. J. Heat Mass Transf. 2016, 95, 890–901. [Google Scholar] [CrossRef]
Figure 1.
The pulsating heat pipe.

Figure 2.
Cooling technology concept using 3D PHP: (a) Cooling concept of the battery cell using 3D PHP; (b) Application of the 3D PHP.
Figure 2.
Cooling technology concept using 3D PHP: (a) Cooling concept of the battery cell using 3D PHP; (b) Application of the 3D PHP.

Figure 3.
Shape of 3D PHPs according to applications: (a) Three-dimensional PHP for the CT (Counter Tab)-type battery cell, Pattern A; (b) Three-dimensional PHP for the NT (Nominal Tab)-type battery cell, Pattern B.
Figure 3.
Shape of 3D PHPs according to applications: (a) Three-dimensional PHP for the CT (Counter Tab)-type battery cell, Pattern A; (b) Three-dimensional PHP for the NT (Nominal Tab)-type battery cell, Pattern B.

Figure 4.
Calculation of pouch battery heat generation according to C-rate.

Figure 5.
Shape of the 3D PHP to verify the flow mechanism.

Figure 6.
Experimental apparatus and set-up.

Figure 7.
Positions of Thermocouples: (a) Positions of thermocouples on battery simulator; (b) Positions of thermocouples on 3D PHP, Pattern A; (c) Positions of thermocouples on 3D PHP, Pattern B.
Figure 7.
Positions of Thermocouples: (a) Positions of thermocouples on battery simulator; (b) Positions of thermocouples on 3D PHP, Pattern A; (c) Positions of thermocouples on 3D PHP, Pattern B.

Figure 8.
Experimental procedure to verify the flow mechanism.

Figure 9.
Thermal resistance of 3D PHP according to filling ratio, Q = 50 W.

Figure 10.
Thermal resistance of 3D PHP according to filling ratio, Q = 100 W.

Figure 11.
Thermal resistance of 3D PHP according to filling ratio, Q = 150 W.

Figure 12.
Thermal resistance of anti-gravity PHP: (a) Thermal resistance of OHP according to filling ratio, Chi et al. (2019) [16]; (b) Thermal resistance of 3D PHP according to filling ratio.
Figure 12.
Thermal resistance of anti-gravity PHP: (a) Thermal resistance of OHP according to filling ratio, Chi et al. (2019) [16]; (b) Thermal resistance of 3D PHP according to filling ratio.

Figure 13.
Thermal performance of 3D PHP according to inclination, Pattern A, methanol 15%: (a) Thermal resistance according to inclination angle, Pattern A, methanol 15%; (b) FFT result of T17, Q = 50 W, vertical; (c) FFT result of T17, Q = 50 W, inclination angle = 15°; (d) FFT result of T17, Q = 50 W, inclination angle = 30°.


Figure 14.
Thermal performance of 3D PHP according to inclination, Pattern A, Novec7100: (a) Thermal resistance according to inclination angle, Pattern A, Novec7100 15%; (b) FFT result of T17, Q = 50 W, vertical; (c) FFT result of T17, Q = 50 W, inclination angle = 15°; (d) FFT result of T17, Q = 50 W, inclination angle = 30°.


Figure 15.
Effect of gravity inside the 3D PHP.

Figure 16.
Thermal performance of 3D PHP according to inclination, Pattern B, methanol 15%: (a) Thermal resistance according to inclination angle, Pattern B, methanol 15%; (b) FFT result of T6, Q = 100 W, vertical; (c) FFT result of T6, Q = 100 W, inclination angle = 15°; (d) FFT result of T6, Q = 100 W, inclination angle = 30°.
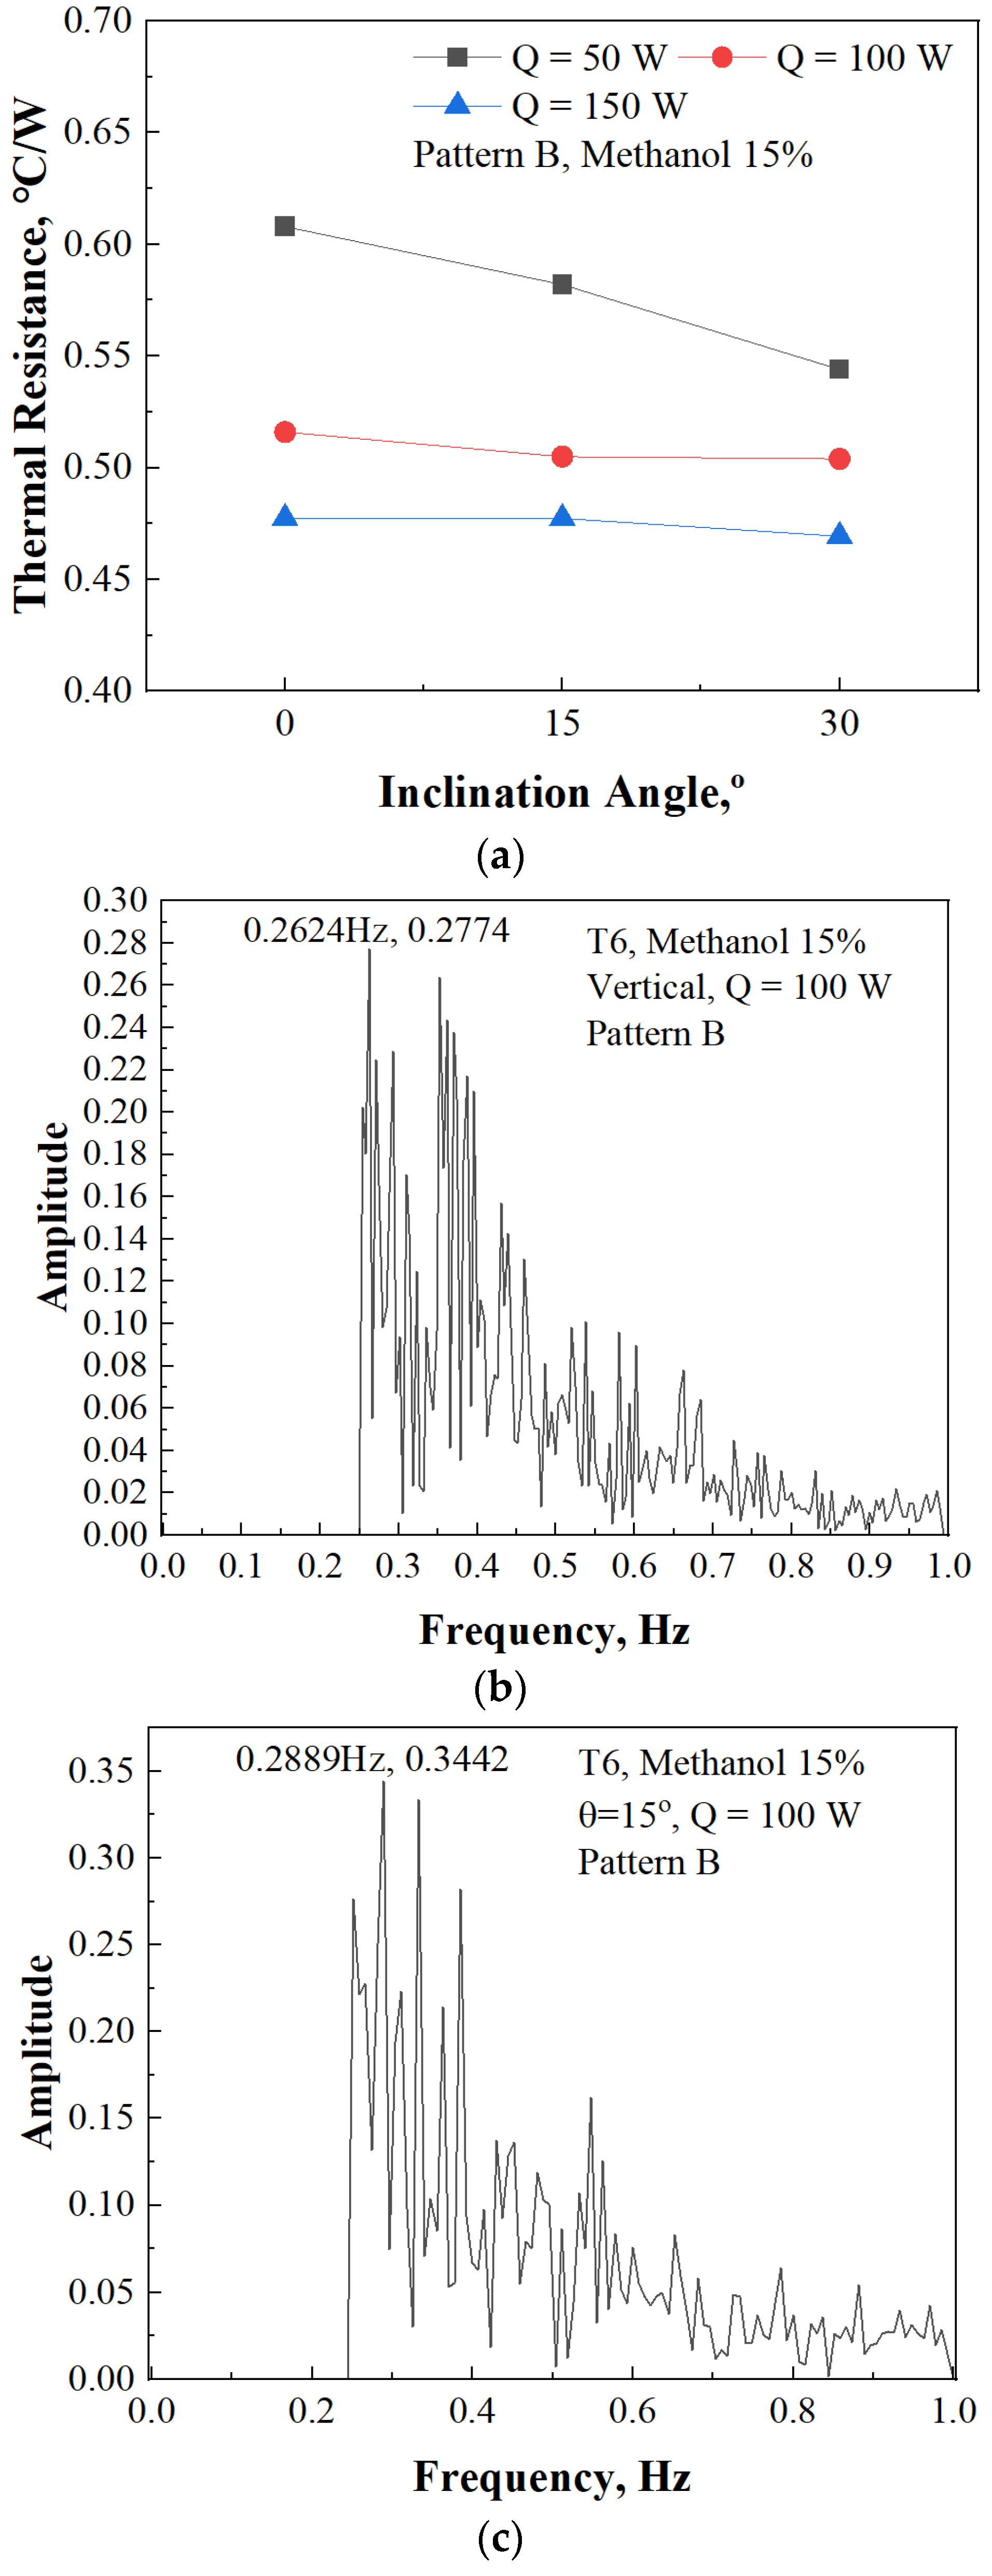

Figure 17.
Temperature variables and FFT result of 3D PHP, Pattern A, methanol 15%, vertical: (a) Temperature variations of 3D PHP(all numbered thermocouple positions, Pattern A; (b) Temperature variations (Thermocouples of highlighted yellow region) and FFT result (T17) of 3D PHP in center line, Pattern A; (c) Temperature variations (Thermocouples of highlighted yellow region) and FFT result (T26) of 3D PHP in side, Pattern A.

Figure 18.
Temperature variables and FFT result of 3D PHP, Pattern B, methanol 15%, vertical: (a) Temperature variables of 3D PHP(all numbered thermocouple positions, Pattern B; (b) Temperature variables (Thermocouples of highlighted yellow region) and FFT result (T23) of 3D PHP in center line, Pattern B; (c) Temperature variables (Thermocouples of highlighted yellow region) and FFT result (T6) of 3D PHP in side, Pattern B.

Figure 19.
Flow mechanism and patterns of anti-gravity 3D PHP, methanol 15%: (a) Flow mechanism of anti-gravity 3D PHP; (b) Flow patterns in anti-gravity 3D PHP.
Figure 19.
Flow mechanism and patterns of anti-gravity 3D PHP, methanol 15%: (a) Flow mechanism of anti-gravity 3D PHP; (b) Flow patterns in anti-gravity 3D PHP.


Table 1.
Experimental variable settings.
| Independent Variables | Value | Explanation |
|---|---|---|
| Patterns of 3D PHPs | A and B type | Refer to Figure 3 |
| No. of Turns | 8 Turns | |
| Working Fluid | Methanol, Novec7100 | |
| Filling Ratio | 10, 15, 20, 25, 30% | Filling Ratio = : Internal volume of the PHP : Volume of the working fluid |
| Inner Diameter of the PHP | 1 mm | Inner diameter of the pipe |
| Supplied Heat | 50, 100, 150 W | Supplied heat from power supply |
| Inclination Angle | 0, 15, 30 degrees |  |
| Properties | Methanol | Novec7100 |
|---|---|---|
| Density of Liquid [kg/m3] at 25 °C | 786 | 1520 |
| Density of Vapor [kg/m3] at 25 °C | 0.22 | 10.12 |
| Latent Heat [kJ/kg] | 1165 | 125 |
| Surface Tension [dynes/cm] | 22.07 | 13.6 |
| Boiling Point [°C] | 64.7 | 61 |
| Dynamic Viscosity [mPa·s] | 0.544 | 0.61 |
| Specific Heat [kJ/kg·K] | 2.53 | 1.17 |
Disclaimer/Publisher’s Note: The statements, opinions and data contained in all publications are solely those of the individual author(s) and contributor(s) and not of MDPI and/or the editor(s). MDPI and/or the editor(s) disclaim responsibility for any injury to people or property resulting from any ideas, methods, instructions or products referred to in the content. |
© 2024 by the authors. Licensee MDPI, Basel, Switzerland. This article is an open access article distributed under the terms and conditions of the Creative Commons Attribution (CC BY) license (https://creativecommons.org/licenses/by/4.0/).
Share and Cite
MDPI and ACS Style
Lee, J.-S.; Kim, S.-J.; Han, W.-S.; Rhi, S.-H. Anti-Gravity 3D Pulsating Heat Pipe for Cooling Electric Vehicle Batteries. Energies 2024, 17, 2283. https://doi.org/10.3390/en17102283
AMA Style
Lee J-S, Kim S-J, Han W-S, Rhi S-H. Anti-Gravity 3D Pulsating Heat Pipe for Cooling Electric Vehicle Batteries. Energies. 2024; 17(10):2283. https://doi.org/10.3390/en17102283
Chicago/Turabian StyleLee, Ji-Su, Su-Jong Kim, Woo-Sung Han, and Seok-Ho Rhi. 2024. "Anti-Gravity 3D Pulsating Heat Pipe for Cooling Electric Vehicle Batteries" Energies 17, no. 10: 2283. https://doi.org/10.3390/en17102283
Note that from the first issue of 2016, this journal uses article numbers instead of page numbers. See further details here.