Article

A Numerical Simulation and Experimental Study of Fluidization Characteristics of a Bubbling Fluidized Bed in Biomass Gasification

1
School of Electrical Engineering, Guangzhou City University of Technology, Guangzhou 510800, China
2
Guangzhou Institute of Energy Conversion, Chinese Academy of Sciences, Guangzhou 510640, China
3
Chinese Academy of Sciences (CAS) Key Laboratory of Renewable Energy, Guangzhou 510640, China
4
College of Mechanical and Electrical Engineering, Zhongkai University of Agriculture and Engineering, Guangzhou 510225, China
*
Authors to whom correspondence should be addressed.
Energies 2024, 17(10), 2302; https://doi.org/10.3390/en17102302
Submission received: 4 March 2024 / Revised: 30 April 2024 / Accepted: 30 April 2024 / Published: 10 May 2024
(This article belongs to the Section I3: Energy Chemistry)

Abstract

:
Traditional fossil energy sources still dominate the world energy structure. And fully utilizing biomass is a viable approach for energy transition. A bubbling fluidized bed has better heat and mass transfer, while particle agglomeration limits the development of its industrial application. In this paper, two-phase flow characteristics of a bubbling fluidized bed are investigated by combining numerical simulations and fluidized bed gasification experiments. Numerical simulations found that the bed fluidization height reached twice the initial fluidization height at the 0.054 m initial fluidization height with uniform particle distribution. Fluidized bed gasification experiments found that syngas yield increased with increasing temperature. The carbon conversion efficiency reached 79.3% and the effective gas production was 0.64 m3/kg at 850 °C. In addition, when the water vapor concentration reached 15%, the carbon conversion efficiency and effective gas production reached the maximum values of 86.01% and 0.81 m3/kg, respectively.

1. Introduction

Nowadays, fossil energy is depleting rapidly, caused by overuse, but still occupies a dominant position in the energy structure [1,2,3]. And the application of new energy sources will become a speed-controlling step in energy development [4,5]. Biomass, the fourth largest source of energy, is the world’s unique sustainable source of organic carbon, which is expected to replace fossil energy sources [4,6]. And the biomass utilization consists of combustion, thermochemical conversion, and biochemical conversion [6,7]. The combustion biomass combustion process utilizes the heat in the biomass through simple incineration, while its thermal efficiency is low, resulting in energy waste [8,9,10]. And the biochemical conversion is the degradation of organic matter in biomass by microorganisms and its transformation into a more valuable fuel or biofuel [11,12]. However, it is difficult to apply biomass energy at a large scale due to its long production cycle and low efficiency [13,14,15]. Thermochemical conversion provides energy to crack solid particles in biomass into small gaseous molecules [16,17]. And the gaseous products can be further processed to produce fuels or synthetic chemicals. Therefore, thermochemical conversion is considered a viable route for its short reaction time and high conversion efficiency.
Fluidized bed technology has a particularly important role in the thermochemical conversion of biomass [18,19,20]. By the carrier gas, the closely arranged solid-phase particles are separated uniformly, significantly reducing the friction between the particles. And the suspended state of motion is obtained due to the solid particles being subjected to the lift force and its own gravity tends to balance. At this time, the fluidized bed has a higher mixing rate and heat and mass transfer efficiency, which can improve the gasification efficiency of biomass particles [21,22,23]. Solid materials in a fluidized state allow for continuous input and output, which are the basis for industrial applications. In addition, the fluid and moving solid particles allow for better heat transfer properties in fluidized beds because the heat transfer coefficient can be enhanced by applying the optimal superficial gas velocity and suspension density [24]. However, particle agglomeration seriously affected the fluidization state of the particles in a bubbling fluidized bed, which is the fundamental reason for the unstable operation of the fluidized bed [25,26]. On the one hand, the agglomerated bed material blocks the gas distribution plates and requires regular downtime for maintenance, resulting in economic losses [27,28]. On the other hand, it will decrease the reaction activity of the bed material, which reduces the gasification efficiency. Therefore, it is necessary to explore the influence of the internal environment of the fluidized bed on the fluidized bed particles to obtain a more stable state to be applied to the biomass gasification process. Some researchers analyze the complex hydrodynamic phenomena from the two-phase flow characteristics in fluidized beds to solve the particle agglomeration. Cardoso J et al. [29] used numerical simulations to predict the fluidization process in a bubbling fluidized bed. It was found that the solid-phase particle distributions were very similar between 2D and 3D simulations. However, the 2D simulation has a large error in predicting the expansion height of the fluidized bed particles. Based on the experimental data of a circulating fluidized bed, Armstrong L M et al. [30] found that the prediction of axial velocities by 3D CFD was in agreement with the experimental data, whereas the 2D simulation results slightly overestimated the particle velocities at the center of the fluidized bed. Therefore, 2D simulation can be used for qualitative assessment while 3D simulation was used for accurate prediction. Bahramian A used the Euler–Euler two-fluid model to consider Gidaspow resistance correlation and different boundary conditions [31]. The simulation results show that suitable mesh can optimize computational time considerably. And the hexahedral structure and near-wall mesh refinement and free-slip boundary conditions give the closest data to the actual experiments. Glicksman determines the need to ensure the same Reynolds number, Froude number, particle-to-fluid density ratio, dimensionless particle size distribution, and sphericity values in small-size reactors [32]. Pallarès et al. divide the fluidized bed experimental model into six fluid dynamics regions and show how a selected collection of these local models can be related to the overall model of the fluid dynamics of the entire CFB cycle. The results show that good agreement can be achieved between the overall model and experimental data from industrial installations [33]. Mirek presented the results of laboratory tests on a scaled-down model of a 966 MW fluidized bed boiler operating at the Lagisza Power Plant, which was built to a scale of 1:20 while maintaining geometric similarity [34]. The results show that the apparent gas of the bubbling bed has an important influence on the flow quality, and the lower the velocity is, the more favorable it is for the bubbles in the bed to fully make contact with the bed material.
Furthermore, the bed material of the fluidized bed particles has an important influence on the heat and mass transfer [35,36,37]. And a large amount of material was used as fluidized bed particles to assist in biomass gasification. Quartz sand is widely used in fluidized bed particles because of its good wear resistance and high temperature stability [38,39]. However, quartz sand involves a difficulty to catalyze the volatile components in biomass to form more syngas due to its low reactivity [40]. Hematite has better reactivity compared to quartz sand. It has been shown that hematite precipitates lattice oxygen at high temperatures, which promotes an incomplete oxidation of biomass volatiles and the formation of high-quality syngas [40,41].
Therefore, a combination of numerical simulations and fluidized bed experiments was used to investigate the effect of flow field characteristics in a fluidized bed on biomass gasification. Numerical simulations were used to analyze in depth the variation of the expansion height and gas flow rate at different filling heights. And the effect on the biomass gasification was explored through fluidized bed experiments. In addition, the gasification yields were analyzed when quartz sand and hematite were used as fluidized bed particles to obtain higher syngas yields by means of waste utilization.

2. Experiment and Simulations

2.1. Materials

2.1.1. Biomass Feedstock

Waste woods were used as biomass feedstock, which was collected from Guangzhou, Guangdong province. Waste woods were crushed by the crusher and passed through a 60–80-mesh sieve to obtain samples. The samples were dried in a desiccator at 105 °C for 48 h, and kept sealed for later use. And the proximate and ultimate analyses of waste woods are listed in Table 1.

2.1.2. Fluidized Bed Material

Hematite was used for fluidized bed material, which was collected from Shi Jiazhuang, Hebei province. Briefly, the hematite was calcined and crushed, then passed through a 60–80-mesh sieve to obtain the desired particle size. The density of hematite was 4800–5300 kg/m3. And the as-prepared hematite was analyzed by XRF spectroscopy and their compositional results are listed in Table 2. Fe2O3 was the dominant component in hematite, with small amounts of SiO2, CaO, and Al2O3. Further, the quartz sand (QS) was used as a control group, which was provided by Shanghai McLean Biochemical Technology. And the main component of quartz sand was SiO2. The density of quartz sand was 2600 kg/m3.

2.2. Geometric Modeling and Simulation Conditions

The geometric model constructed the fluidized region of gas-phase and solid-phase contact. Among them, the inner diameter of the fluidization region was 0.054 m and the length was 0.42 m, and the geometric model was meshed by the Mesh module. The partial encrypted mesh was applied to the inlet at the bottom of the fluidized bed and the particulate fluidization region to obtain a higher-quality unstructured mesh. And the number of cells in the grid was about 550,000.
During the simulation, multiphase flow calculations were based on the pressure-based separation solver and Simple algorithm. The RNG k- ε model was chosen for the turbulence model, and the Syamlal–O’Brien traction model was chosen for the traction model. The gas phase was defined as air with a density of 1.225 kg/m3. The outlet boundary condition was the pressure outlet, and the inlet boundary condition was the inlet velocity. The process of simulation maintained a time step of 0.001 s for a total of 3000 steps. And the maximum number of iterations per step was 20, to obtain the simulation results with a gas–solid phase mixing time of 3 s in the fluidized bed.
The numerical simulation was performed with a particle density ρ of 2600 kg/m3, a particle size d of 335 μm, and an inlet air velocity V of 0.13 m/s. Detailed conditions were shown in Table 3. The minimum fluidization rate was close to 0.13 m/s. The fluidized bed at the stationary initial moment was uniformly filled with particles. Above the air inlet, the volume fraction of the particles was set to 60%.

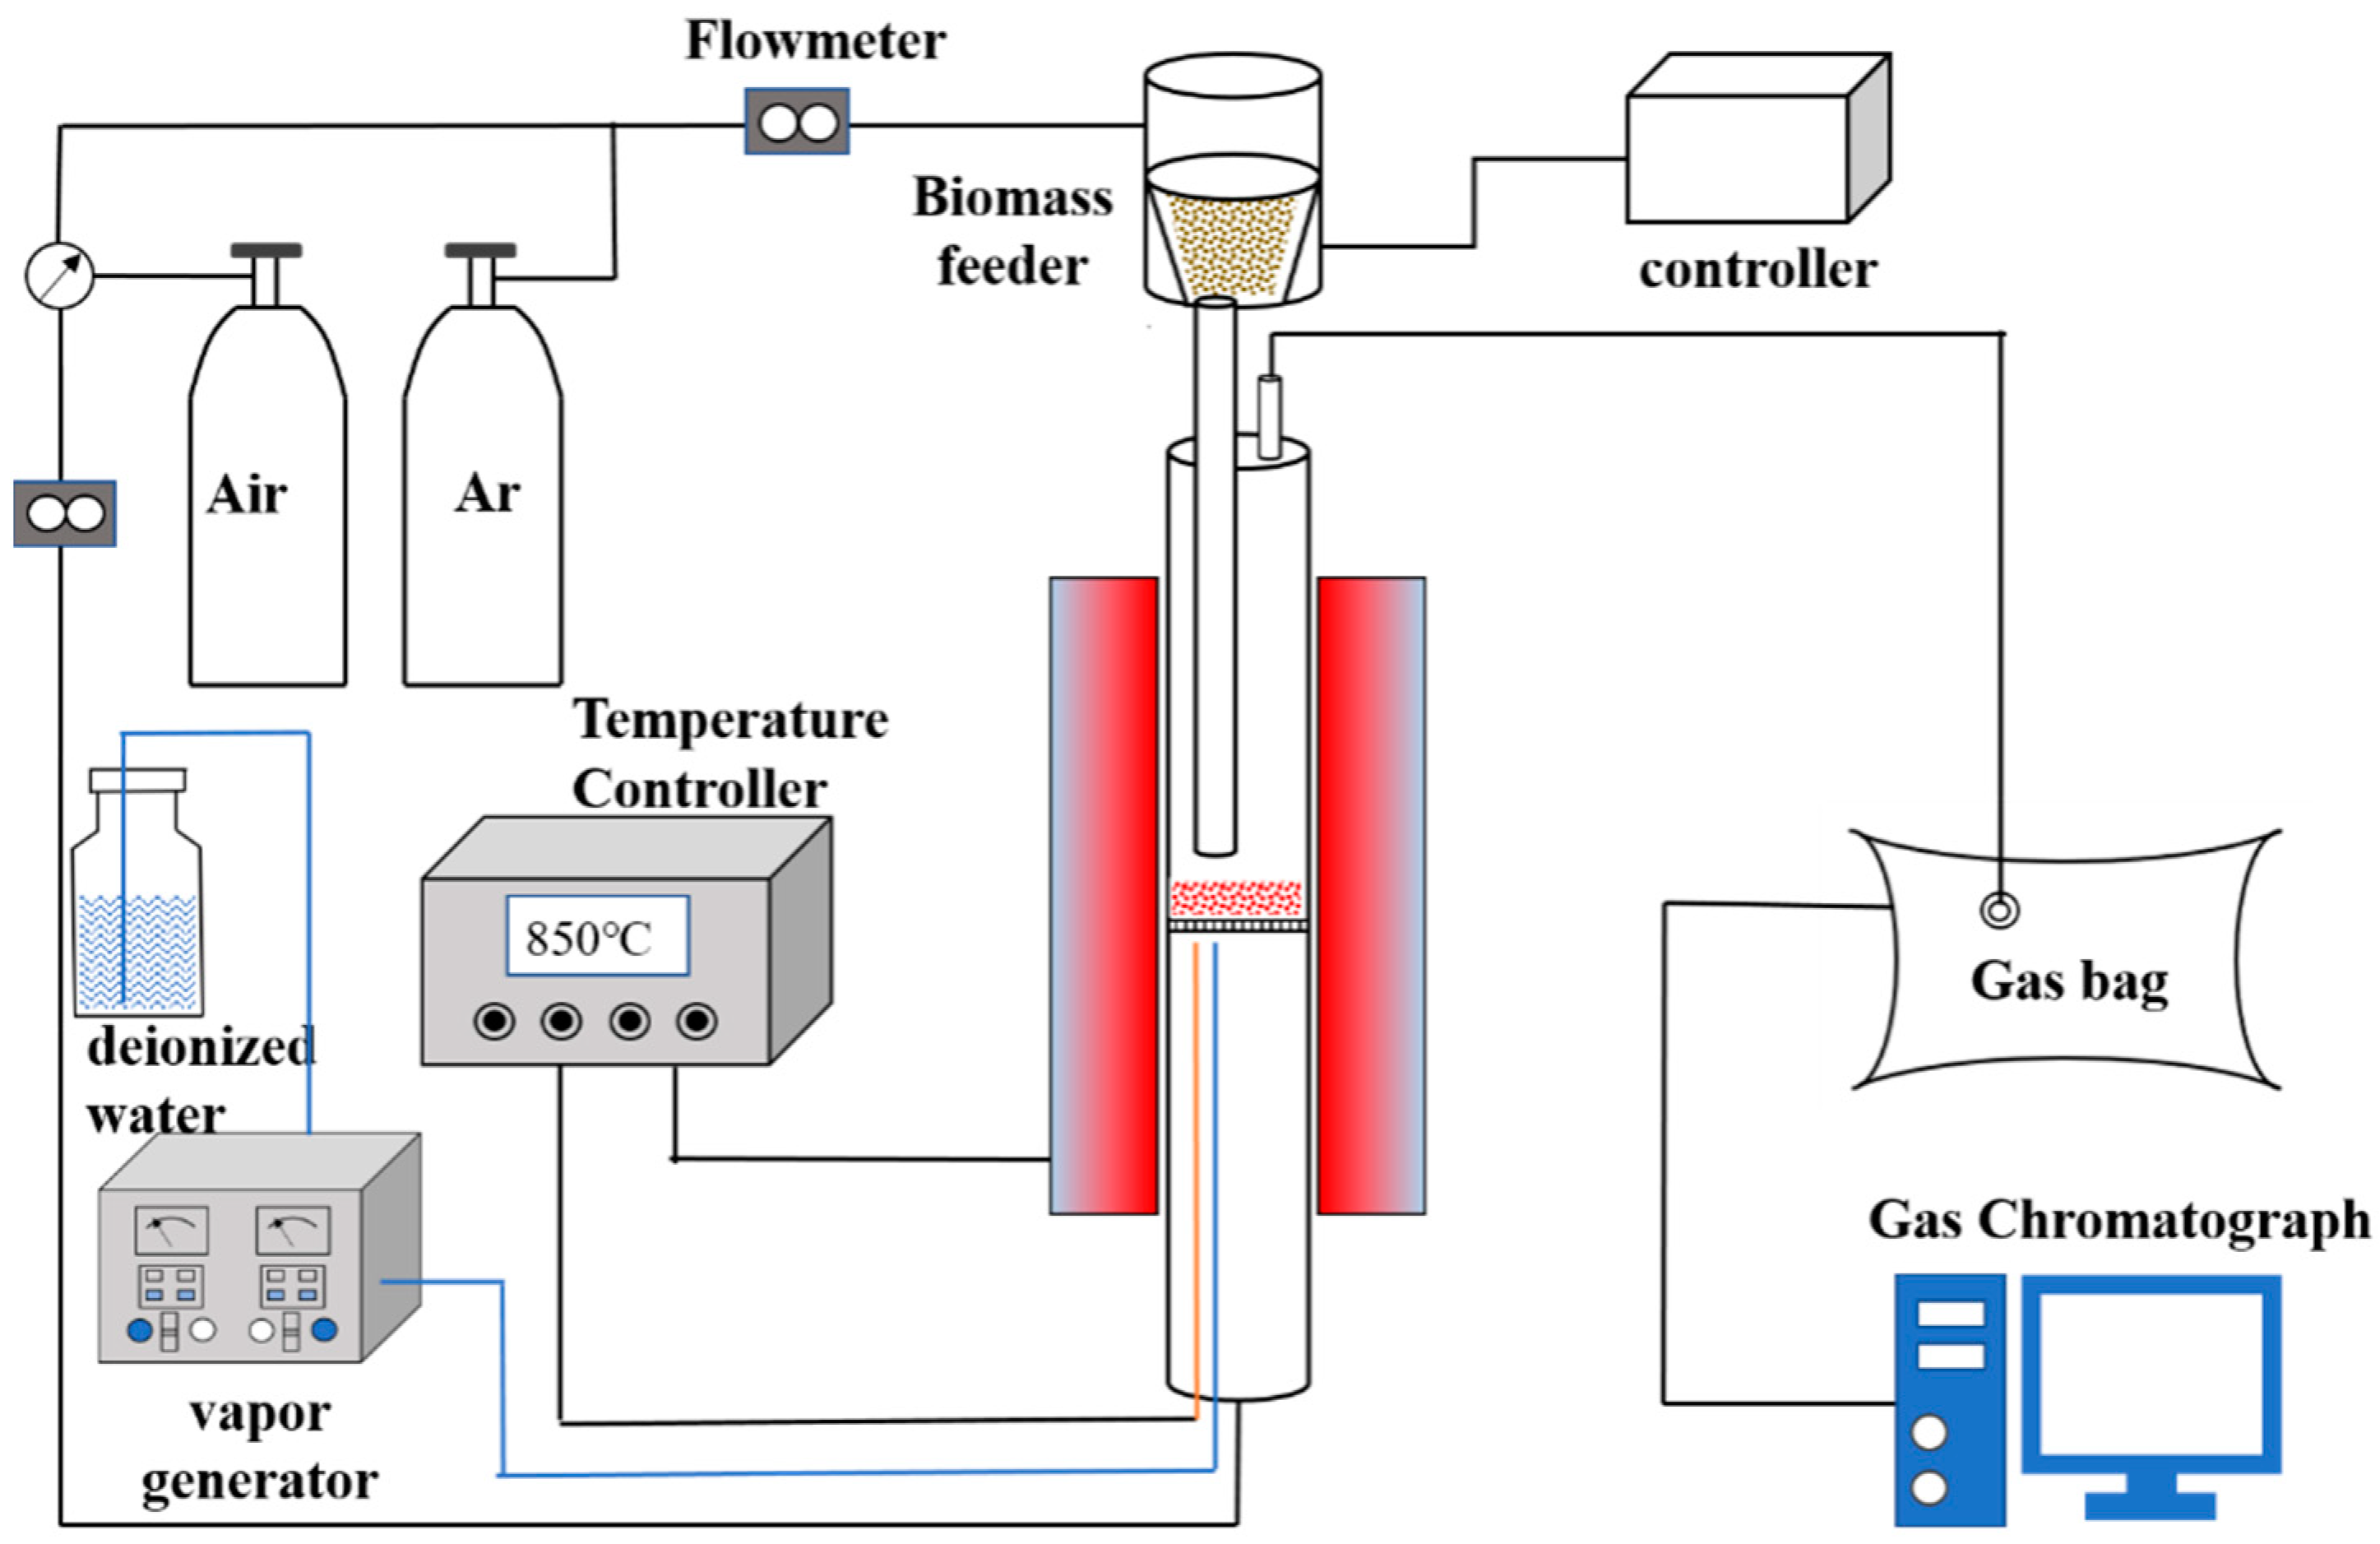
2.3. Experimental Procedure

In a bubbling fluidized bed, the hematite sample was placed in an autosampler connected to the top of the reactor, and the fluidized bed material particles were placed on a gas distribution plate. The feed pipe was directly inserted into the middle of the reactor. The upper inlet was connected with the coal feeder, and the lower outlet was 40 mm away from the air distribution plate. Their distribution plate was a quartz perforated plate with a circular shape of 54 mm in diameter. There were approximately 230 holes with a diameter of 0.5 mm evenly distributed on the plate [29]. After the temperature was stabilized at 850 °C, the hematite sample was uniformly placed in a fluidized bed reactor at 40 g/h for the reaction. The Ar gas and air gas were used as mixed carrier gas, which was recorded by a wet mass flowmeter and made the gas flow rate 0.13 m/s. Among them, the fluidization gas route was passed in from the bottom of the fluidized bed, and through the gas distributor. It ensured that the fluidized bed material reached the fluidized state. The equilibrium gas route entered the reactor through an autosampler to ensure that the biomass particles reached the gasification region smoothly. Furthermore, water vapor was co-entered into the reactor as a carrier gas along with the fluidization gas route. The total gas produced in 40 min was collected using a gas sampling bag and detected by gas chromatography with TCD. The movement of the fluidized bed was recorded by a high-speed camera; the experimental procedure is shown in Figure 1.
The gas yield of each component Xi (L) was calculated by
V i = V f × X i
where Vi (i = CO, CO, CH4, and H2) represents the volume of a single gas, L; Xi represents the volume fraction of each gas, %; and Vf represents the total volume of fluidized gas.
The total volume of gas Vout was calculated by
V out = V f 1 X CO X CO 2 X CH 4 X H 2
where Vout represents the total volume during the gasification reaction, L.
Carbon conversion efficiency ( φ ) was used to characterize the conversion of biomass in reactivity with fluidized bed material, which was calculated by
φ = 12 V out ( X CO + X CO 2 + X CH 4 ) 22.4 × C % × M
where φ represents the carbon conversion efficiency, %; C% represents the elemental carbon content of the biomass, and M represents the biomass feed in a gasification reaction, kg.
The effective gas yield ( γ ) refers to the combustible gases (CO, CH4, and H2) produced per unit mass of hematite, which was calculated by
γ = ( V CO + V H 2 + V CH 4 ) M
where γ represents the effective gas yield, m3/kg.

3. Fluidization Characterization

In industrial production, the initial stack height directly affects the contact area of the gasifying agent (e.g., air or steam) with the biomass particles. Higher stacking heights might lead to an increase in the time for the gasifier to pass through the bed, thus providing more time for gas–solid reactions, but might also lead to an uneven distribution of the gasifier, which affects the contact efficiency. The stacking height determines the formation and rupture behavior of bubbles within the bed; lower stacking heights might result in frequent contact of bubbles with the bottom of the bed, whereas higher stacking heights might result in the merging of bubbles as they rise through the bed, affecting the fluidization quality of the bed. The initial stacking height affects heat and mass transfer within the bed. Higher stacking might result in longer heat transfer paths, which might affect the efficiency of heat transfer, and might also affect the drying and gasification rates of the biomass pellets. The stack height has an important effect on the operational stability of the fluidized bed. Therefore, it was important to select the suitable bed height during the biomass gasification.
Figure 2 shows the effect of the filling height on the volume distribution of particles. When the filling height was 0.027 m, the center of the bed material showed a stacking phenomenon at 0.5 s. The stacking phenomenon was caused by the easy passage through the sidewalls, resulting in a decrease in gas flow through the center region. Meanwhile, the solid-phase flow field showed a uniform distribution with the gradual stabilization of the gas flow. Further, the bed expansion was low throughout the fluidization process. The lower expansion heights would be less efficient in the heat and mass transfer process. During biomass gasification, a decrease in the reaction rate might result in an incomplete conversion of the biomass and the formation of by-products such as tar, which could be harmful to the reactor.
When the filling height increased to 0.054 m, the swelling height of the particle bed reached twice the initial height and showed good particle distribution. The fluidized bed particles expanded to 1.5 times with the carrier gas at 0.5 s and showed a uniform distribution at 1 s. Among them, the expanded particle bed presented a stable fluidized state with a dense center and loose surroundings. There was frictional resistance of the fluid through the center region of the bed as compared to the surrounding region, causing the flow to pass more through the surrounding region. Further, good distribution could enhance the collision opportunities between the biomass volatiles and the fluidized bed particles, which could improve the syngas yield in the fluidized gasification experiments.
With a further increase in the initial packing up to 0.081 m and 0.108 m, the fluidized bed particles always showed a central region of agglomeration during a collision. The appearance of the agglomerated region was caused by the excessive pressure drop inside the reactor, which seriously affected the operation of the fluidized bed. In addition, the tailing region of a particle escape appeared when the filling heights were 0.081 m and 0.108 m. The escape of particles caused the waste of resources and harm to the downstream equipment of the fluidized bed.
Therefore, when the initial stacking height was 0.054 m (stacking height = reactor bottom diameter), the fluidized bed presented the best particle distribution. And the lower or higher initial filling height could have a bad effect on the reactor.
The fluidized bed particle fluidization velocity was further analyzed and the results are shown in Figure 3. At the axial heights of 0.027 m and 0.054 m of the fluidized bed, the particle flow rate showed an edge effect. Due to the higher frictional resistance in the center of the bed, the carrier gas passed more easily from all sides. The fastest particle flow rate was observed at an initial filling height of 0.027 m. However, the expansion height was not able to go up to 0.081 m. Therefore, although it had a good particle flow rate at lower heights, its smaller reaction zone was not conducive to the occurrence of a biomass gasification reaction. As the filling height increased, the particle flow rate gradually decreased. When the initial filling height was 0.054 m, the particle flow rate was kept at 0.04 m/s in the fluidized area. With a further increase in the stacking height, the particle velocity decreased to 0.03 m/s (0.081 m initial filling height) and 0.02 m/s (0.108 m initial filling height), respectively. The larger particle velocity facilitated two-phase mixing between bed particles and biomass pyrolysis gas. The flow velocity of the particles across the fluidization zone was lower for fill heights of 0.081 m and 0.108 m. In the bubbling fluidized bed, the mixing of the gas phase and solid phase was not uniform. With the initial filling height increased, the resistance of the gas phase to pass through the bed increased. The agglomeration and accumulation phenomenon of solid-phase particles would seriously affect the velocity distribution of particles, which leads to poor mixing efficiency of gas–solid two-phase flow. Therefore, the fluidized bed particles had a more optimal flow rate at a filling height of 0.054 m to have a better application in fluidized bed gasification experiments.
The fluidization characteristics of the fluidized bed particles were verified experimentally. The fluidized state of the initial bed height of 0.054 m was captured by a high-speed camera and the results are shown in Figure 4. During the experiments, the fluidized bed particles gradually rose under the carrier gas and contained small bubbles. And the bubbles grew as they rose and broke at the top. The bed particles underwent irregular movement under carrier gas, resulting in a gradual increase in bed height. With the generation and breakage of bubbles, the fluidized bed particles could exchange heat and mass with biomass volatiles, promoting the cracking of biomass volatiles and the formation of combustible syngas. With the stabilization of the carrier gas, the bed height reached twice the initial bed height, which is consistent with the simulation results. The elevation in the bed height provided more of a reaction zone to facilitate the cleavage of biomass volatiles. Therefore, the initial bed height of 0.054 m was the basis for the high reactivity of the bubbling fluidized bed.

4. Gasification Properties of Biomass

The reactivity of the prepared fluidized bed material was evaluated in fluidized bed experiments, and the results of which are shown in Figure 5. Fluidized bed material was an important influencing factor for biomass gasification. For the QS sample, the total syngas yield reached 12.9 L. During the process of gasification, the syngas was transformed from biomass through a series of thermochemical reactions. Typically, biomass underwent thermal cracking to decompose into fixed carbon and volatile fractions. Then, the volatile fractions were cracked to H2 and CO by dry reforming and steam reforming. Further, the water–gas reaction and the methane conversion reaction could optimize the gas components in the syngas product. Therefore, the CO gas was the highest component with 7.1 L, and the H2 and CH4 gas reached 2.7 L and 1.8 L. CO2 was at 1.3 L as the lowest component. And the available components reached 91% in the total gas. However, researchers found that the O atoms in SiO2 were difficult to remove from the lattice, resulting in the low catalytic activity of the QS sample [42,43]. As a result, its carbon conversion efficiency and effective gas yield only reached 67.81% and 0.59 kg/m3.
Compared to QS samples, the WH samples showed significantly higher syngas yield and carbon conversion efficiency. The main component of hematite was Fe2O3, which precipitated lattice oxygen during gasification to promote rapid gasification reactions [44,45,46]. Researchers had found that the Fe-O bonds in the Fe2O3 became weaken and break, which precipitated the lattice oxygen in the biomass gasification process [47,48]. Lattice oxygen could react quickly with biomass volatiles to form high-quality syngas. In addition, the precipitation of lattice oxygen distorted the internal lattice of hematite, forming a porous structure to adsorb tar molecules. The residence time of tar molecules on the surface of fluidized bed particles was prolonged to promote secondary cracking. Further, the formation of Fe0 was caused by the loss of lattice oxygen from Fe2O3. Researchers showed that Fe0 had good tar-cracking ability and was widely used in biomass tar-cracking reactions [49,50]. As a result, the total syngas increased to 17.0 L, with CO2 being the highest-growth item. The carbon conversion efficiency increased from 67.81% to 79.3%, and the effective gas yield increased from 0.59 m3/kg to 0.64 m3/kg.
The hematite exhibited superior reactivity in the biomass gasification, which was applied in subsequent experiments. Further, the effect of gasification temperature on the reactivity of fluidized bed material was further explored, as shown in Figure 6. As the temperature reached 750 °C, the total syngas reached 13.3 L, and the carbon conversion efficiency and effective gas yield were only 70.65% and 0.53 m3/kg. With increasing reaction temperature, the gas production of CO, CO2, and H2 tended to increase, while the CH4 gas production remained essentially stable. Reaction temperature was another important influence during biomass gasification, which promoted the breaking of chemical bonds [51,52]. It is generally believed that H2 in the biomass pyrolysis gasification process mainly comes from the biomass aromatic ring opening and recombination reaction. With the increase in temperature, the biomass pyrolysis of large molecules out of the gas would be intensified by the secondary cracking reaction to releasing more H2. The CO originated from the cleavage of oxygen-containing functional groups (carbonyl, carboxyl, and ether bonds), and the cleavage of some hydroxyl-carrying and oxygen-containing heterocyclic compounds would also be produced. Meanwhile, CO2 mainly originated from the decomposition of acids and aldehydes containing carbon–oxygen double bonds. Thus, large-molecule tars broke spontaneously into small-molecule aromatics, which further formed gas products. It was mentioned that the yield of CO2 in the syngas was gradually higher than the yield of H2, when the reaction temperature reached 800 °C. And the possible reason is that Fe2O3 enhanced the catalytic cleavage of acids and aldehydes containing carbon–oxygen double bonds at 800 °C.
When the gasification temperature was increased to 850 °C, the fluidized bed activity increased significantly, causing 16.4 L of total syngas. And the carbon conversion efficiency and the effective gas yield reached 79.3% and 0.64 m3/kg. However, the trend of syngas yield improvement slowed down during the increase from 850 °C to 950 °C. Its syngas yield only increased from 16.4 L to 17.9 L, while carbon conversion and effective gas yield increased to 84.13% and 0.69 m3/kg. This phenomenon might result from the agglomeration of active sites in hematite at high temperatures. In related fluidized bed particle deactivation studies, active sites with high surface energy spontaneously agglomerated into large particles through particle migration and Oswald ripening, leading to a decreased reactivity in the chemical looping gasification [53]. Further, the small amounts of alkali metal elements contained in hematite melted at high temperatures to plug the orifices, causing the deactivation of the fluidized bed particles. Huang used hematite as the oxygen carriers for the gasification of sewage sludge, and found that better carbon conversion and gas yield could be achieved at 850 °C. Therefore, the selection of 850 °C was optimal when using hematite as the fluidized bed particles.
The effect of water vapor on the fluidized bed reaction system was further explored at a reaction temperature of 850 °C and the results are shown in Figure 7. The total syngas yield gradually increased with increasing water vapor concentration. The syngas yield was 16.4 L without the vapor atmosphere, while the syngas increased to 18.1 L when the water vapor content was raised to 5%. The water vapor was a good gasification medium to be used as an oxygen source in the biomass gasification process to promote syngas production and increase H2 yield [54,55]. And the total syngas yield gradually increased with increasing water vapor content. While the CO and CH4 gas gradually decreased as the concentration of water vapor increased, H2 and CO2 gradually increased in relative concentration. During biomass gasification, water–gas shift reactions and methane-reforming reactions occur, consuming CO and CH4 to form H2 and CO2. And the increased amount of H2O would promote the positive progression of both reactions. When the water vapor concentration reached 15%, the tar conversion efficiency and effective gas yield peaked at 86.01% and 0.81 m3/kg, respectively.
Appropriate water vapor concentration could enhance the biomass gasification, but excessive water vapor would show the opposite effect [56]. When the water vapor concentration was 20%, the carbon conversion efficiency instead dropped to 84%. The addition of water vapor would accelerate the flow rate of the gas in the reactor to shorten the residence time of the gas products in the reactor, resulting in a weakening of the gas–solid reaction, which prevents part of the C in the biomass from being converted into syngas [57,58]. Further, excessive water vapor would absorb a large amount of heat, resulting in uneven temperature distribution in the reactor and reducing the reactivity of the water–gas shift reaction. Therefore, 15% water vapor concentration was the optimal gas path in fluidized bed gasification experiments.

5. Conclusions

In summary, the effect of two-phase flow on biomass gasification in a bubbling fluidized bed was investigated by a combination of numerical simulation and fluidized bed gasification experiments. Numerical simulation revealed that the fluidization height reached twice the initial packing height with uniformly distributed particles when the initial packing height was 0.054 m. The fluidized bed was uniformly distributed and accompanied by abundant bubbles to ensure the heat-mass exchange during the biomass gasification reaction in experiments. Through biomass gasification experiments, hematite was found to have good catalytic activity due to its good oxygen release properties. Its carbon conversion efficiency reached 79.3% at 850 °C, with an effective gas yield of 0.64 m3/kg. In addition, the fluidized bed gasification efficiency increased gradually with increasing gasification temperature and water vapor concentration. However, the enhancement trend slowed down when the temperature exceeded 850 °C and the water vapor concentration exceeded 15%. Considering the energy consumption and high-temperature sintering of the bed material, it was most suitable to choose 850 °C for the reaction temperature and 15% for the water vapor concentration of the bubbling fluidized bed.

Author Contributions

Conceptualization, N.G. and K.Z.; methodology, N.G.; software, K.Z.; validation, S.F., and L.D.; formal analysis, J.L.; investigation, N.G.; resources, N.G.; data curation, N.G.; writing—original draft preparation, N.G. and K.Z.; writing—review and editing, Y.L. and Z.H.; visualization, J.L.; supervision, H.H.; project administration, Y.L. and Z.H.; funding acquisition, Y.L. and Z.H. All authors have read and agreed to the published version of the manuscript.

Funding

The authors gratefully acknowledge the financial support from the National Natural Science Foundation of China (52076209, 52106285, 52306289), the Foundation and Applied Foundation Research of Guangdong Province (2022B1515020045, 2023A1515011930), the Young Talent Support Project of Guangzhou Association for Science and Technology (QT-2023-042), the China Postdoctoral Science Foundation (2023M733508), the Foundation and Applied Foundation Research of Guangzhou (2024A04J4601), and the program of GDSEI (2023CY-1-03).

Data Availability Statement

The original contributions presented in the study are included in the article, further inquiries can be directed to the corresponding author.

Conflicts of Interest

The authors declare no conflicts of interest.

References

  1. Liang, S.; Tian, B.L.; Guo, F.Q.; Dong, Y.C.; Du, S.L.; Qian, L. Porous silicon film overcoating biomass char-supported catalysts for improved activity and stability in biomass pyrolysis tar decomposition. Catal. Sci. Technol. 2021, 11, 5938–5951. [Google Scholar] [CrossRef]
  2. Liang, S.; Guo, F.Q.; Du, S.L.; Tian, B.L.; Dong, Y.C.; Jia, X.P.; Qian, L. Synthesis of Sargassum char-supported Ni-Fe nanoparticles and its application in tar cracking during biomass pyrolysis. Fuel 2020, 275, 117923. [Google Scholar] [CrossRef]
  3. Guo, F.Q.; Zhan, Y.B.; Jia, X.P.; Zhou, H.M.; Liang, S.; Qian, L. Fabrication of nitrogen-doped hierarchical porous carbons from Sargassum as advanced electrode materials for supercapacitors. New J. Chem. 2021, 45, 15514–15524. [Google Scholar] [CrossRef]
  4. Li, Y.; Chen, M.Q.; Li, Q.H.; Huang, Y.W. Effect of microwave pretreatment on the combustion behavior of lignite/solid waste briquettes. Energy 2018, 149, 730–740. [Google Scholar] [CrossRef]
  5. Guo, F.Q.; Liang, S.; Jia, X.P.; Peng, K.Y.; Jiang, X.C.; Qian, L. One-step synthesis of biochar-supported potassium-iron catalyst for catalytic cracking of biomass pyrolysis tar. Int. J. Hydrogen Energy 2020, 45, 16398–16408. [Google Scholar] [CrossRef]
  6. Guo, F.Q.; Liang, S.; Zhao, X.M.; Jia, X.P.; Peng, K.Y.; Jiang, X.C.; Qian, L. Catalytic reforming of biomass pyrolysis tar using the low-cost steel slag as catalyst. Energy 2019, 189, 116161. [Google Scholar] [CrossRef]
  7. Lin, F.; Xu, M.Z.; Ramasamy, K.K.; Li, Z.L.; Klinger, J.L.; Schaidle, J.A.; Wang, H.M. Catalyst Deactivation and Its Mitigation during Catalytic Conversions of Biomass. ACS Catal. 2022, 12, 13555–13599. [Google Scholar] [CrossRef]
  8. Yi, B.; Chen, M.; Gao, Y.; Cao, C.; Wei, Q.; Zhang, Z.; Li, L. Investigation on the co-combustion characteristics of multiple biomass and coal under O2/CO2 condition and the interaction between different biomass. J. Environ. Manag. 2023, 325, 116498. [Google Scholar] [CrossRef]
  9. Xia, Y.; Zhang, J.; Tang, C.; Pan, W. Research and application of online monitoring of coal and biomass co-combustion and biomass combustion characteristics based on combustion flame. J. Energy Inst. 2023, 108, 101191. [Google Scholar] [CrossRef]
  10. Mularski, J.; Li, J. A review on biomass ignition: Fundamental characteristics, measurements, and predictions. Fuel 2023, 340, 127526. [Google Scholar] [CrossRef]
  11. McCann, M.C.; Carpita, N.C. Biomass recalcitrance: A multi-scale, multi-factor, and conversion-specific property. J. Exp. Bot. 2015, 66, 4109–4118. [Google Scholar] [CrossRef] [PubMed]
  12. Cho, E.J.; Trinh, L.T.P.; Song, Y.; Lee, Y.G.; Bae, H.J. Bioconversion of biomass waste into high value chemicals. Bioresour. Technol. 2020, 298, 122386. [Google Scholar] [CrossRef] [PubMed]
  13. Hansen, S.; Mirkouei, A.; Diaz, L.A. A comprehensive state-of-technology review for upgrading bio-oil to renewable or blended hydrocarbon fuels. Renew. Sustain. Energy Rev. 2020, 118, 109548. [Google Scholar] [CrossRef]
  14. Osman, A.I.; Mehta, N.; Elgarahy, A.M.; Al-Hinai, A.; Al-Muhtaseb, A.H.; Rooney, D.W. Conversion of biomass to biofuels and life cycle assessment: A review. Environ. Chem. Lett. 2021, 19, 4075–4118. [Google Scholar] [CrossRef]
  15. Raheem, A.; Wan Azlina, W.; Taufiq Yap, Y.H.; Danquah, M.K.; Harun, R. Thermochemical conversion of microalgal biomass for biofuel production. Renew. Sustain. Energy Rev. 2015, 49, 990–999. [Google Scholar] [CrossRef]
  16. Qiu, B.B.; Tao, X.D.; Wang, J.H.; Liu, Y.; Li, S.T.; Chu, H.Q. Research progress in the preparation of high-quality liquid fuels and chemicals by catalytic pyrolysis of biomass: A review. Energy Convers. Manag. 2022, 261, 115647. [Google Scholar] [CrossRef]
  17. Sekar, M.; Mathimani, T.; Alagumalai, A.; Chi, N.T.L.; Duc, P.A.; Bhatia, S.K.; Brindhadevi, K.; Pugazhendhi, A. A review on the pyrolysis of algal biomass for biochar and bio-oil—Bottlenecks and scope. Fuel 2021, 283, 119190. [Google Scholar] [CrossRef]
  18. Fu, W.M.; Zhang, Y.N.; Cui, L.F.; Liu, H.; Maqsood, T. Experimental microwave-assisted air gasification of biomass in fluidized bed reactor. Bioresour. Technol. 2023, 369, 128378. [Google Scholar] [CrossRef] [PubMed]
  19. Hanchate, N.; Ramani, S.; Mathpati, C.S.; Dalvi, V.H. Biomass gasification using dual fluidized bed gasification systems: A review. J. Clean. Prod. 2021, 280, 123148. [Google Scholar] [CrossRef]
  20. Wang, S.; Shen, Y.S. Coarse-grained CFD-DEM modelling of dense gas-solid reacting flow. Int. J. Heat Mass Transfer. 2022, 184, 122302. [Google Scholar] [CrossRef]
  21. Molino, A.; Larocca, V.; Chianese, S.; Musmarra, D. Biofuels Production by Biomass Gasification: A Review. Energies 2018, 11, 811. [Google Scholar] [CrossRef]
  22. Karl, J.; Pröll, T. Steam gasification of biomass in dual fluidized bed gasifiers: A review. Renew. Sustain. Energy Rev. 2018, 98, 64–78. [Google Scholar] [CrossRef]
  23. Tezer, Ö.; Karabağ, N.; Öngen, A.; Çolpan, C.Ö.; Ayol, A. Biomass gasification for sustainable energy production: A review. Int. J. Hydrogen Energy 2022, 47, 15419–15433. [Google Scholar] [CrossRef]
  24. Blaszczuk, A.; Jagodzik, S. Investigation of Heat Transfer in a Large-Scale External Heat Exchanger with Horizontal Smooth Tube Bundle. Energies 2021, 14, 5553. [Google Scholar] [CrossRef]
  25. George, J.; Arun, P.; Muraleedharan, C. Experimental investigation on co-gasification of coffee husk and sawdust in a bubbling fluidised bed gasifier. J. Energy Inst. 2019, 92, 1977–1986. [Google Scholar] [CrossRef]
  26. Nijenhuis, J.; Korbee, R.; Lensselink, J.; Kiel, J.H.A.; van Ommen, J.R. A method for agglomeration detection and control in full-scale biomass fired fluidized beds. Chem. Eng. Sci. 2007, 62, 644–654. [Google Scholar] [CrossRef]
  27. Mirek, P. Air Distributor Pressure Drop Analysis in a Circulating Fluidized-Bed Boiler for Non-reference Operating Conditions. Chem. Eng. Technol. 2020, 43, 2233–2246. [Google Scholar] [CrossRef]
  28. Mirek, P.; Klajny, M. Air nozzle design criteria for protection against the backflow of solids in CFB boilers. Appl. Therm. Eng. 2018, 141, 503–515. [Google Scholar] [CrossRef]
  29. Cardoso, J.; Silva, V.; Eusébio, D.; Brito, P.; Boloy, R.M.; Tarelho, L.; Silveira, J.L. Comparative 2D and 3D analysis on the hydrodynamics behaviour during biomass gasification in a pilot-scale fluidized bed reactor. Renew. Energy 2019, 131, 713–729. [Google Scholar] [CrossRef]
  30. Armstrong, L.M.; Luo, K.H.; Gu, S. Two-dimensional and three-dimensional computational studies of hydrodynamics in the transition from bubbling to circulating fluidised bed. Chem. Eng. J. 2010, 160, 239–248. [Google Scholar] [CrossRef]
  31. Bahramian, A. Simultaneous effects of mesh refinement, grid configuration and wall boundary condition on prediction of pressure gradients and velocity profiles of microparticles in a conical fluidized bed. Particuology 2019, 43, 123–136. [Google Scholar] [CrossRef]
  32. Glicksman, L.R. Scaling relationships for fluidized beds. Chem. Eng. Sci. 1984, 39, 1373–1379. [Google Scholar] [CrossRef]
  33. Pallarès, D.; Johnsson, F. Macroscopic modelling of fluid dynamics in large-scale circulating fluidized beds. Prog. Energy Combust. Sci. 2006, 32, 539–569. [Google Scholar] [CrossRef]
  34. Mirek, P.; Ziaja, J. The influence of sampling point on solids suspension density applied in scaling of the hydrodynamics of a supercritical CFB boiler. Chem. Process. Eng. 2011, 32, 391–399. [Google Scholar] [CrossRef]
  35. Ruivo, L.C.M.; Pio, D.T.; Yaremchenko, A.A.; Tarelho, L.A.C.; Frade, J.R.; Kantarelis, E.; Engvall, K. Iron-based catalyst (Fe2-xNixTiO5 for tar decomposition in biomass gasification. Fuel 2021, 300, 120859. [Google Scholar] [CrossRef]
  36. Matamba, T.; Iglauer, S.; Keshavarz, A. A progress insight of the formation of hydrogen rich syngas from coal gasification. J. Energy Inst. 2022, 105, 81–102. [Google Scholar] [CrossRef]
  37. Ruoppolo, G.; Miccio, F.; Miccio, M.; Brachi, P.; Chirone, R. Sewage sludge ashes as a primary catalyst for the abatement of tar in biomass gasification: Bubbling versus spouted-fluidized bed configuration. Can. J. Chem. Eng. 2021, 99, 1706–1714. [Google Scholar] [CrossRef]
  38. Gokon, N.; Kumaki, S.; Miyaguchi, Y.; Bellan, S.; Kodama, T.; Cho, H. Development of a 5kWth internally circulating fluidized bed reactor containing quartz sand for continuously-fed coal-coke gasification and a beam-down solar concentrating system. Energy 2019, 166, 1–16. [Google Scholar] [CrossRef]
  39. Gokon, N.; Izawa, T.; Abe, T.; Kodama, T. Steam gasification of coal cokes in an internally circulating fluidized bed of thermal storage material for solar thermochemical processes. Int. J. Hydrogen Energy 2014, 39, 11082–11093. [Google Scholar] [CrossRef]
  40. Yang, H.T.; Wang, C.; Xu, S.P.; Liu, R. Biomass gasification over hematite in a decoupled dual loop gasifier. Fuel Process. Technol. 2019, 192, 140–146. [Google Scholar] [CrossRef]
  41. Jiang, C.; Jin, X.Y.; Xu, T.T.; Xiao, B.; Hu, Z.Q.; Wang, X. Biomass chemical looping gasification for syngas production using modified hematite as oxygen carriers. J. Environ. Sci. 2023, 125, 171–184. [Google Scholar] [CrossRef] [PubMed]
  42. Lu, Q.; Yuan, S.; Liu, C.; Zhang, T.; Xie, X.; Deng, X.; He, R. A Fe-Ca/SiO2 catalyst for efficient production of light aromatics from catalytic pyrolysis of biomass. Fuel 2020, 279, 118500. [Google Scholar] [CrossRef]
  43. Tomishige, K.; Miyazawa, T.; Asadullah, M.; Ito, S.I.; Kunimori, K. Syngas production from gasification of biomass over Rh/CeO/SiOcatalyst: Pyrogasification, steam reforming and CO reforming. Bull. Jpn. Pet. Inst. 2003, 46, 322–327. [Google Scholar] [CrossRef]
  44. Vasanthakumar, P.; Karvembu, R. Unmodified Maghemite from River Sand as a Selective Catalyst for Base-Free Transfer Hydrogenation of Furfural, Levulinic Acid, and o-Vanillin: A Pathway for Sustainable Biomass Conversions. ACS Sustain. Chem. Eng. 2020, 8, 17069–17078. [Google Scholar] [CrossRef]
  45. Li, M.; Sun, L.; Chen, L.; Feng, H.; Zhao, B.; Yang, S.; Xie, X.; Zhang, X. Syngas production from biomass chemical looping gasification with Fe2O3–CaO oxygen carrier. J. Therm. Anal. Calorim. 2022, 147, 7811–7817. [Google Scholar] [CrossRef]
  46. Qin, W.; Luo, L.; Chen, S.; Iqbal, T.; Xiao, X.; Dong, C. Efficient strategy of utilizing alkaline liquid waste boosting biomass chemical looping gasification to produce hydrogen. Fuel Process. Technol. 2021, 217, 106818. [Google Scholar] [CrossRef]
  47. Deng, J.; Gao, S.; Yang, T.; Ma, D.; Luo, X.D.; Liu, H.; Yuan, S.F. Investigating the promotion of Fe-Co catalyst by alkali and alkaline earth metals of inherent metal minerals for biomass pyrolysis. Renew. Energy 2023, 213, 134–147. [Google Scholar] [CrossRef]
  48. Wei, G.Q.; Yang, M.; Huang, Z.; Bai, H.C.; Chang, G.Z.; He, F.; Yi, Q.; Huang, Y.; Zheng, A.Q.; Zhao, K.; et al. Syngas production from lignite via chemical looping gasification with hematite oxygen carrier enhanced by exogenous metals. Fuel 2022, 321, 124119. [Google Scholar] [CrossRef]
  49. Lu, Q.X.; Yuan, S.F.; Li, J.F.; Chen, X.; Li, K.; Xie, X.G.; Fu, X.L.; He, Z.Y. Influence of Mg and Co addition on Fe based catalyst for in-situ biomass pyrolysis. J. Anal. Appl. Pyrolysis 2023, 169, 105832. [Google Scholar] [CrossRef]
  50. Zhang, S.P.; Wang, J.X.; Ye, L.; Li, S.; Su, Y.H.; Zhang, H.Y. Investigation into biochar supported Fe-Mo carbides catalysts for efficient biomass gasification tar cracking. Chem. Eng. J. 2023, 454, 140072. [Google Scholar] [CrossRef]
  51. Gao, N.B.; Li, A.M.; Quan, C. A novel reforming method for hydrogen production from biomass steam gasification. Bioresour. Technol. 2009, 100, 4271–4277. [Google Scholar] [CrossRef] [PubMed]
  52. Guo, F.Q.; Peng, K.Y.; Liang, S.; Jia, X.P.; Jiang, X.C.; Qian, L. Evaluation of the catalytic performance of different activated biochar catalysts for removal of tar from biomass pyrolysis. Fuel 2019, 258, 116204. [Google Scholar] [CrossRef]
  53. Xu, S.S.; Slater, T.J.A.; Huang, H.; Zhou, Y.T.; Jiao, Y.L.; Parlett, C.M.A.; Guan, S.L.; Chansai, S.; Xu, S.J.; Wang, X.R.; et al. Developing silicalite-1 encapsulated Ni nanoparticles as sintering-/coking-resistant catalysts for dry reforming of methane. Chem. Eng. J. 2022, 446, 137439. [Google Scholar] [CrossRef]
  54. Parthasarathy, P.; Narayanan, K.S. Hydrogen production from steam gasification of biomass: Influence of process parameters on hydrogen yield—A review. Renew. Energy 2014, 66, 570–579. [Google Scholar] [CrossRef]
  55. Shahbaz, M.; Yusup, S.; Inayat, A.; Patrick, D.O.; Ammar, M. The influence of catalysts in biomass steam gasification and catalytic potential of coal bottom ash in biomass steam gasification: A review. Renew. Sustain. Energy Rev. 2017, 73, 468–476. [Google Scholar] [CrossRef]
  56. Hejazi, B. Heat integration and waste minimization of biomass steam gasification in a bubbling fluidized bed reactor. Biomass Bioenergy 2022, 159, 106409. [Google Scholar] [CrossRef]
  57. Hoang, A.T.; Huang, Z.H.; Nizetic, S.; Pandey, A.; Nguyen, X.P.; Luque, R.; Ong, H.C.; Said, Z.; Le, T.H.; Pham, V.V. Characteristics of hydrogen production from steam gasification of plant-originated lignocellulosic biomass and its prospects in Vietnam. Int. J. Hydrogen Energy 2022, 47, 4394–4425. [Google Scholar] [CrossRef]
  58. Pang, Y.J.; Yang, C.; Wu, Y.T.; Chen, Y.S.; Li, H. Study on counter-flow steam gasification characteristics of biochar with Fe2O3/CaO in-situ catalysis in fixed bed. Appl. Energy 2022, 326, 120046. [Google Scholar] [CrossRef]
Figure 1. The experimental procedure of fluidized bed gasification.
Energies 17 02302 g001
Figure 2. Effect of filling height on particle volume distribution: (a) 0.027 m, (b) 0.054 m, (c) 0.081 m, (d) 0.108 m.
Energies 17 02302 g002
Figure 3. Axial height particle velocity distribution: (a) 0.027 m, (b) 0.054 m, (c) 0.081 m, (d) 0.108 m.
Energies 17 02302 g003
Figure 4. Axial height gas velocity distribution. The red line represents the upper interface of the bed in a static state, the blue line is the upper interface of the bed under bubbling conditions, and the blue circles are bubbles.
Energies 17 02302 g004
Figure 5. Effect of bed material on biomass gasification: (a) gas volume; (b) carbon conversion efficiency and effective gas yield.
Energies 17 02302 g005
Figure 6. Effect of temperature on biomass gasification: (a) gas volume; (b) carbon conversion efficiency and effective gas yield.
Energies 17 02302 g006
Figure 7. Effect of vapor on biomass gasification: (a) gas volume; (b) carbon conversion efficiency and effective gas yield.
Energies 17 02302 g007
Table 1. Proximate and ultimate analyses of waste woods.
SampleUltimate Analysis (wt%, ad a)Proximate Analysis (wt%, ad a)
CHO *NSMVFC *
Waste woods46.156.8141.815.120.112.0178.3314.79
* Calculated by differences. a Air-dried basis.
Table 2. XRF spectroscopy of hematite.
SampleFeO *SiCaAl
Hematite64.6431.362.031.390.21
* Calculated by differences.
Table 3. The conditions for numerical simulation.
ρ (kg/m3)d (μm)H (m)V (m/s)
A126003350.0270.13
A226003350.0540.13
A326003350.0810.13
A426003350.1080.13
Disclaimer/Publisher’s Note: The statements, opinions and data contained in all publications are solely those of the individual author(s) and contributor(s) and not of MDPI and/or the editor(s). MDPI and/or the editor(s) disclaim responsibility for any injury to people or property resulting from any ideas, methods, instructions or products referred to in the content.

