Article

Investigating the CO2 Geological Sequestration Potential of Extralow-Permeability Reservoirs: Insights from the Es1 Member of the Shahejie Formation in the Dawa Oilfield

1
School of Resources and Civil Engineering, Northeastern University, Shenyang 110819, China
2
New Energy Division, Liaohe Oilfield Company, CNPC, Panjin 124010, China
3
AGEO Engineering Service Pty Ltd., East Perth, WA 6004, Australia
*
Author to whom correspondence should be addressed.
Energies 2024, 17(9), 2221; https://doi.org/10.3390/en17092221
Submission received: 22 March 2024 / Revised: 19 April 2024 / Accepted: 26 April 2024 / Published: 5 May 2024
(This article belongs to the Section B3: Carbon Emission and Utilization)

Abstract

:
Extralow-permeability reservoirs have emerged as a significant area of focus for CO2 geological sequestration due to their stable subterranean structure and expansive storage capacity, offering substantial potential in addressing global climate change. However, the full extent of CO2 geological sequestration potential within these extralow-permeability reservoirs remains largely unexplored. To address this gap, this paper utilizes the Shahejie Formation (Es1 member) of the Shuang 229 block in the Liaohe oilfield, Bohai Bay Basin, as a case study. This section is characterized by its abundant oil-gas reserves and serves as an exemplar for conducting experimental research on CO2 storage within extralow-permeability reservoirs. The results demonstrate that the reservoir lithology of the Es1 member is fine sandstone and siltstone, with high compositional and structural maturity. Moreover, the average porosity is 14.8%, the average permeability is 1.48 mD, and the coefficient of variation of the reservoir is approximately 0.5, which indicates a low- to extralow-permeability homogeneous reservoir. In addition, the overburden pressure is >2.0 MPa, the fault can withstand a maximum gas column height of >200 m, and the reservoir exhibits favorable overburden and fault sealing characteristics. Notably, stepwise increasing gas injection in the Shuang 229-36-62 well reveals that the injected liquid CO2 near the wellhead exhibits a relatively high density, close to 1.0 g/cm3, which gradually decreases to approximately 0.78 g/cm3 near a depth of 2000 m underground. The injected fluid changes into a supercritical state upon entering the formation, and the CO2 injection speed is optimal, at 0.08 HCPV/a. According to these findings, it is predicted that the highest burial CO2 volume via the injection of 1.5 HCPVs in the Wa 128 block area is 1.11 × 10⁵ t/year, and the cumulative burial volume reaches approximately 2.16 × 10⁶ t. This shows that the CO2 sequestration potential of extralow-permeability reservoirs is considerable, providing confidence for similar instances worldwide.

1. Introduction

Indeed, with the acceleration of industrialization, the massive utilization of fossil fuel energy has led to a significant increase in atmospheric CO2 levels, which has further aggravated the global warming trend. This not only causes notable damage to the Earth’s ecosystems but also poses a considerable threat to the sustainable development of human society [1,2,3,4]. Therefore, reducing the atmospheric CO2 concentration has become a common challenge worldwide. Although reducing the utilization of fossil energy is the fundamental way to lower CO2 emissions, it is not realistic to completely replace fossil energy in the short term due to the imbalance in global economic development and the advantages of fossil energy in terms of cost and availability. Therefore, it is particularly important to establish other effective strategies for carbon reduction [4,5,6,7,8].
Within this context, CO2 capture and storage (CCS) technology was developed. CCS technology refers to the process of capturing CO2 produced in industrial processes through a series of technical means and then transporting it to a safe location for long-term sequestration, thereby preventing its emission into the atmosphere [9,10,11]. This technology not only provides significant environmental benefits, as it can effectively reduce the CO2 concentration in the atmosphere, but also helps to slow the global warming trend [9,10,11]. However, it should be noted that CCS technology research and development and its application still face many challenges. These include the high cost of capture and storage technologies, insufficient technological maturity, and safety issues associated with long-term sequestration.
CO2 geological sequestration, especially CO2 enhanced oil recovery (EOR) with burial technology, has become the focus of CCS research efforts [4,6,12,13]. With global oil and gas exploration shifting to unconventional resources, low-porosity and low-permeability reservoirs face the major problem of natural development with low recovery [12,14,15]. To effectively exploit residual petroleum, CO2 EOR technology has rapidly emerged and developed. Heterogeneous-phase flooding technology, an advanced chemical flooding technology that improves crude oil recovery by adding specific displacing agents, polymers and surfactants to change the physical–chemical properties of the reservoirs, is one of the best options and has been widely applied in the United States and Europe [12,13]. As specialized agents, the introduction of CO2 could potentially enhance oil recovery efficiency [16]. In fact, by increasing the amount of CO2 injected, optimizing the layout of the well network and using polymers as viscosity-enhancing additives, this technology can significantly reduce the residual oil saturation and greatly increase the oil recovery rate by 7–15% [12,13,17]. This not only improves the utilization rate of oil and gas resources but also provides a new economic impetus for geological CO2 sequestration, achieving a win-win situation between environmental and economic benefits. With the continuous progress of technology, the application prospects of CO2 EOR with burial technology will increase worldwide.
In China, the concept of CO2 capture, utilization, and storage (CCUS) originated from China’s Greenhouse Gas Reduction Strategy and Development published in 2005 and has been widely practiced in the field of oil and gas exploration [4,18]. At present, China has implemented CO2 flooding and storage technology pilot tests in Daqing, Hailar, Jilin, Shengli and other oilfield blocks [19,20]. Although certain achievements have been made, due to the complex geological conditions and constraints on the industrial chain, China’s CO2 flooding and sequestration technology still faces several challenges; in particular, the application in ultralow-permeability oil and gas reservoirs remains insufficient [21,22].
To investigate the CO2 sequestration potential of continental-scale ultralow-permeability oil reservoirs, this study examines the Qingshuiwa Depression, recognized as the most significant hydrocarbon-generating depression within the Liaohe Depression of the Bohai Bay Basin. The Dawa oilfield presents several advantages, including a unique correlation between oil and source, substantial resource potential, extensive development of extralow-permeability reservoirs within the Es1 member of the Shahejie Formation, and an integrated oil well layout [23,24]. However, challenges persist in the field of oil and gas extraction due to increasing difficulties. Therefore, it provides rare research examples for CO2 geological storage in large fault basins. Accordingly, a comprehensive geological analysis was conducted using the ultralow-permeability reservoir of the Paleogene Shahejie Formation in the Qingshuiwa Depression as an example. Moreover, combined with CO2 injection and production experiments, the CO2 geological sequestration potential of this reservoir was explored. This research not only helps to improve the application of CCUS technology in the field in China but also provides new ideas and methods for efficiently developing ultralow-permeability oil and gas reservoirs in the future.
Given that the exploration of CO2 geological sequestration, particularly within extralow-permeability reservoirs, remains predominantly in its initial stages, this study primarily aims to assess the storage potential and the factors potentially influencing the Es1 member of the Shahejie Formation. The importance of this research lies in expanding the examples of carbon dioxide storage in extralow-permeability reservoirs, thereby providing crucial materials for future systematic comparison and critical analysis within this field.

2. Geological Setting

The Qingshuiwa Depression, where the Dawa oilfield is located, is the largest regional subsidence center in the western depression of the Liaohe Basin (Figure 1a). During deposition of the Es1 member of the Shahejie Formation, the Qingshuiwa Depression continuously subsided and developed a steep NNE-trending anticline in the east and a flat anticline in the west. In addition, the eastern side of the Qingshuiwa Depression developed a controlled concave fracture along the NE direction, namely, the Taian–Dawa fault. Thereafter, during the depositional period of the Dongying Formation, the stress field in the Qingshuiwa Depression area changed to right-lateral strike-slip movement, generating nearly E–W compressional and nearly N–S tensile stresses, which generated a series of nearly E–W normal faults in the middle shallow layer.
The northern part of the Qingshuiwa Depression is the main oil and gas resource enrichment area and includes the main four well areas of Shuang 229, Shuang 246, Wa 128, and Wa 111 (Figure 1b). The source rocks in this area are dominated by dark mudstones of the Es3 member of the Shahejie Formation, with a thickness of 400–900 m, the organic matter type is dominated by I-II1, the organic carbon content is mostly higher than 2.0%, Ro is greater than 0.5%, the thermal evolution reaches the mature–high-maturity stage, the estimated maximum oil generation intensity is 8.4 × 10⁷ t/km2, and the maximum gas generation intensity is 5.2 × 10¹⁰ m3/km2 [23]. Regionally, the reservoir is dominated by the sand body of the Es1 member of the Shahejie Formation, the Es13 member of the Shahejie Formation contains five retrograde quasi-stratigraphic sand groups, each group encompasses relatively stable mudstone interbeds, with an average thickness of approximately 9.0 m, and the ratio of sand to mudstone is relatively low [24,25] (Figure 1c). The regional caprock is dominated by the mudstone of the Es1 member of the Shahejie Formation, which is a deep thick lacustrine layered mudstone with a cumulative thickness of 300–500 m. The rock sample breakthrough pressure difference is larger than 2.0 MPa, the breakthrough pressure is high, the physical property sealing ability is notable, the spatial distribution is wide, and the caprock is a high-quality regional caprock.
The primary focus of the CO2 sequestration test is on the oil-rich formation of the Shahejie Formation (Es1 member), which features stable regional mudstone formations both above and below. The overlying strata comprise mudstone formations interspersed with ES1 sandstone, exhibiting a cumulative thickness ranging from 300–500 m. Additionally, there are the Dongying Formation mudstone formations, characterized by a continuous thickness of up to 20–30 m and a cumulative thickness exceeding 400 m. The underlying strata consist of Shahejie Formation (Es2 and Es3 members) mudstone, boasting a cumulative thickness surpassing 1000 m. These conditions collectively offer an optimal environment for CO2 sequestration within the confined space of ES1.

3. Storage Potential of Extralow-Permeability Reservoirs

3.1. Storage Space of the Sand Body

The lithology of the sand section reservoir mainly comprises fine sandstone and siltstone, accounting for approximately 85.1% of the total length of the core (Figure 2a). Combined with logging and logging interpretation, it was found that fine sandstone accounted for 42% of the total composition, and siltstone accounted for 58% of the total composition. The sand-rock clastic composition was dominated by quartz and feldspar. X-ray diffraction (XRD) whole-rock quantitative analysis revealed that the average content of quartz is 57.7%, the average content of feldspar is 31.5% (Figure 2a), and the maturity of the composition is relatively high. The rounding degree of clastic particles is subrounded, sub-prism–subrounded, and the contact relationships are point–line and line contacts, which indicate a relatively high structural maturity (medium sorting) (Figure 3a–d). Interparticle filling with a miscellaneous base (mud-grade sediment) and self-generating rock cementation dominate, the storage space is of the pore type, and the pore space comprises mainly interparticle pores, intraparticle pores and particle dissolution pores (Figure 3a–d).
The core Hg data indicated that the average porosity of the sand section (Sanya section) was 14.8%, and the average permeability was 1.48 mD (Figure 2c,d). The effective reservoir pore throat radius mainly ranged from 0.065–55.9 μm, with an average pore throat radius of 5.31 μm, an average maximum pore throat radius of 31 μm, and a throat homogeneity coefficient of 0.22. The displacement pressure was generally less than 0.1 MPa, the mercury saturation at the maximum pressure was generally greater than 70%, and the demercurization efficiency was greater than 24%. The overall characteristics of the reservoir pore throats suggested medium-porosity, fine-to-extra-fine, and heterogeneous pore throats. In addition, the reservoir variation coefficient was approximately 0.5, which indicates a homogeneous reservoir (Figure 2c,d). Therefore, from a storage space perspective, the ES1 is a low- to extralow-permeability homogeneous reservoir.

3.2. Sand Body Distribution

The E3s13 member of the Shahejie Formation is the main oil-bearing layer and can be subdivided into five sand groups, namely, I, II, III, IV, and V (Figure 1c), among which the three sand groups E3s13 III, E3s13 IV, and E3s13 V are the main formation systems (Figure 1c). Dark gray mudstone with gray fine sandstone, siltstone and thin layers of brownish-gray oil shale occur in integrated contact with the underlying strata, and the strata are approximately 400–840 m thick. This may provide considerable storage space for CO2 sequestration, and the effectiveness of these spaces can be verified by oil-bearing rocks.
Adopting the Shuang 229 block in the Liaohe oilfield as an example, the proven petroleum geological reserves of the E3s13 member of the Shahejie Formation are 2.18 × 10⁷ t, the area of the oil-bearing ultralow–low-permeability homogeneous reservoir is 18.9 km2, the effective porosity of the reservoir is 12.7%, the permeability is 1.6 mD, and the coefficient of variation is 0.50 (Figure 2c,d). There are 70 wells that have been drilled and put into production in the Shuang 229 block of the E3s13 member of the Shahejie Formation, including 66 oil-producing wells, among which 37 are currently in production, with a daily oil production of 95.3 t, a cumulative oil production of 2.02 × 10⁵ t, and a cumulative gas production of 1.23 × 10⁷ m3. In addition, there are four test injection gas wells, including three nitrogen test injection wells with a cumulative nitrogen injection of 7.20 × 10⁶ m3, which exhibit suitable gas sequestration potential. Therefore, further CO2 sequestration tests were conducted to explore the possible geological influencing factors.
In summary, E3S1 in the S-229 block of the Liaohe Oilfield is a normal- to high-maturity and high-quality source rock, and the maximum oil production and gas intensity are 8400 × 104 t/km2 and 520 × 108 m3/km2, respectively. Most tectonic–lithological traps are developed, with an effective porosity of 12.7%, a permeability of 1.6 mD, and a coefficient of variation of 0.5. The formation water is of the NaHCO3 type, with an average mineralization of 11,799.3 mg/L. The reservoir pressure is 38.8 MPa, and the pressure coefficient is 1.1, which is a normal temperature-pressure system. Therefore, the S-229 block is an extralow-permeability homogeneous reservoir with a high sealing ability and exhibits very favorable conditions for CO2-EOR and storage.

4. CO2 Sequestration and Its Controlling Factors

4.1. Controlling Factors of CO2 Sequestration

4.1.1. Sealing Properties of the Caprock

Caprock sealing is the basis for effective CO2 sequestration, which is mainly achieved by the differences in physical properties between the caprock and reservoir, also known as capillary sealing. The pressure required for oil and gas to enter the maximum pores of the caprock is called the pressure potential of the caprock. Generally, the greater the pressure potential, the higher the corresponding sealing ability. When the pressure potential reaches >2.0 MPa, the physical property sealing ability of the reservoir is satisfactory. The section of sand in the study block is dominated by mud caprock, and through rock gas breakthrough pressure tests, it was found that the pressures are all much higher than 2.0 MPa (Table 1). From a regional perspective, the upper section of mudstone in sand is directly adjacent to the reservoir and is characterized by a pure and stable distribution of mud, with a thickness of 100–300 m, indicating that both the sealing and stability features of the caprock in the region are satisfactory. The structure provides a high physical closure ability. The middle and lower sections of Group D above S1 are also dominated by mudstone, with a few thin layers of powder and fine sandstone, and the cumulative thickness of mudstone is >400 m, which can be used as an effective upper caprock.

4.1.2. Sealing Properties of the Faults

Given that fractures are not widely developed in mud caprock, this does not have a significant impact on the sealing of the cap (Table 1); therefore, the sealing evaluation of fractures and micro-fractures was not discussed in detail in this study. Due to the development of faults in the study area, the evaluation of fault sealing is crucial for stable burial of CO2. Generally, fault sealing includes lateral and vertical sealing, which essentially depend on the displacement pressure differential. First, vertical sealing occurs, and vertical sealing is effective because there are no perforations through the overlying mudstone caprocks except for the boundary fault in the study area, and the fault spacing and extension distance are small. Based on this configuration, fault sealing in the study area largely depends on lateral sealing, which can be further divided into lithological joint sealing and fault rock sealing according to the lithological joint sealing mode on both sides of the fault. Corresponding to the 10 main faults in the study area, the main lithological joint sealing types are the No. 1 Dawa fault and the Nos. 3, 4, and 5 accumulation controlling faults (Table 2), among which the No. 1 fault exhibits a large fault spacing (>600 m) and notable mudstone smearing sealing, while the Nos. 3, 4, and 5 faults exhibit small fault spacings (~100 m) but also provide better sealing due to the low ratio of sandstone to mudstone (0.1–0.3) (Table 3). In contrast, the remaining six faults exhibit small fault spacings, mainly sand-sand jointing, and are characterized by fault rock sealing. Generally, the evaluation of fault sealing is predicated on the sandstone docking index and mudstone coating coefficient (SSF). A low score for both parameters suggest effective fault sealing. However, the precise criteria for determining these indices remain challenging to establish. Consequently, this study employs a relative evaluation system to categorize fault sealing as good, medium, or poor (Table 2; Figure 4a). Accordingly, except for the No. 10 fault, the overall sealing of the faults is favorable (Table 2).
Nevertheless, quantitative evaluation of fracture sealing remains important, especially for analyzing fracture weak points (Table 4). The weak points determine the injection pressure of the fault and the hydrocarbon column height, which can be obtained by calculating all the fault-bearing hydrocarbon column heights of the confined trapezoid. Notably, the shallowest horizontal hydrocarbon interface is located above the spillover point of the trapezoid. Through quantitative characterization of the bearing pressure difference at the depth of the weak points, hydrocarbon column height, bearing maximum pressure and other parameters of the Shuang 229 block main fault, it was found that the quantitative sealing effect of the faults is favorable, and the maximum gas column heights reach > 200 m, among which depression 111 can bear a maximum pressure of <36.3 MPa and depression 128 can bear a maximum pressure of <40.1 MPa (Figure 4b; Table 2 and Table 3).

4.1.3. Formation Temperature–Pressure–Fluid Medium

Based on measured formation pressure and formation temperature data for this area, relationships between the formation pressure and burial depth (Figure 2a) and between the formation temperature and burial depth (Figure 2b) were established. The temperature, pressure, and fluid properties of the medium in formations may affect the CO2 injection and sequestration efficiencies. Analysis of typical oil well strata in the study area through the equations of the burial depth versus the stratum pressure (PR = 0.0114D − 0.311) and stratum temperature (t = 0.0303(D − 30) + 9.99) (PR—stratum pressure, MPa; t—stratum temperature, °C; D—burial depth, m) revealed that the Shuang 229 oil layer is buried at a depth of 2900~3950 m, corresponding to a stratum temperature of 99.33~129.88 °C, a geothermal gradient of approximately 3.03 °C/100 m, and a corresponding stratum pressure of 33.06~45.03 MPa, with a pressure coefficient of 1.14 (Figure 2b), which is a normal temperature-pressure system. Moreover, the CO2 sequestration efficiency is not significantly affected.
Nevertheless, there are multiple fluid media in the formation, which may affect the CO2 sequestration efficiency. For this purpose, through separate water injection, nitrogen and CO2 contrast experiments, the CO2 test injection volume of a single well at ambient temperature and pressure is 60 m3/d, the suction intensity is 5.14 m3/d, the nitrogen test injection volume is 28,900–59,000 m3/d, the average suction intensity is 8.70 m3/d/m, and the carbon dioxide injection volume is approximately 1/1000 of that of nitrogen. However, under saturated conditions of bound water at 60 °C and 20 MPa, the permeability of CO2 in a 1-m long 0.1-mD sandstone sample is more than 40 times that of water and more than 5 times that of nitrogen, indicating that the supercritical state of CO2 exhibits higher permeability and injection capacity levels under the actual formation conditions. Therefore, whether nitrogen, carbon dioxide or other gases are injected, the reservoir exhibits notable suction capacity, but when multiple fluid media coexist in the formation, this may affect the CO2 sequestration efficiency (Figure 4b).

4.2. Pilot Test of CO2 Sequestration

As shown in Figure 5, a well network centered on Shuang 229-36-62 was selected for the CO2 sequestration test of ultralow-permeability reservoirs by stepwise increasing of gas injection for 72 days, which was divided into four stages of gas injection. At the first stage, the CO2 gas injection volume was 35 m3/d, and the corresponding collection oil pressure was 15.3 MPa. At the second stage, the CO2 daily gas injection volume was increased by 5 m3/d to 40 m3/d, and the corresponding collection oil pressure reached 17.5 MPa. At the third stage, the CO2 daily gas injection volume was increased by another 10 m3/d to 50 m3/d, and the corresponding collection oil pressure reached 19.2 MPa. At the fourth stage, the CO2 daily gas injection volume was increased by another 10 m3/d to 60 m3/d, and the corresponding collection oil pressure reached 22 MPa, with a cumulative injected CO2 gas volume of 3204 m3. In this process, it was observed through the pressure gradient and wellbore density that the injected liquid CO2 exhibited a relatively high density near the wellhead, close to 1.0 g/cm3, and it gradually decreased to approximately 0.78 g/cm3 near a depth of 2000 m underground, changing into a supercritical state upon entering the formation. In addition, the suction profile curve shows that all layers were pumped longitudinally, the pumping volumes at the different injection speeds were almost consistent, and the pumping index reached approximately 3.67 m3/MPa. However, it was initially confirmed that the reservoir exhibits a certain CO2 injection and gas absorption capacity, and gas injection can establish an effective drive system and improve the reservoir recovery rate.

4.3. Reservoir Numerical Simulation

To clarify carbon sequestration in practice, in this study, the Puddle 128 well area, which exhibits a large longitudinal span, suitable reservoir connectivity, and notable planar oil layer contiguity, was selected as the research object, and numerical reservoir simulations were conducted in advance for the study of carbon oil repulsion and carbon sequestration. The GEM module of CMG software 2021.10 was chosen for the establishment of a Pit 128 block component model. The target layers are E3s13 III, E3s13 IV, and E3s13 V. To establish a representative geological model, 82 × 76 × 9 = 56,088 grids were adopted, 9 layers occurred along the longitudinal direction, the size of all plane XY grids was 30 m, the average porosity was set to 14.8%, and the average permeability was set to 1.48 mD. The WinProp module was used to conduct fluid simulations for carbon drive and carbon sequestration research. Moreover, the WinProp module was employed for fluid PVT fitting and minimum mixed-phase pressure fitting. This PVT model stands for simulation in terms of pressure (P), volume (V), and temperature (T). Based on the well fluid composition and heavy fraction characteristics in the Puddle 128 well area, the crude oil fractions were divided into six fractions and compositions during numerical simulation (N2, 0.28 mol/%; CO2, 0.77 mol/%; CH4, 47.58 mol/%; C2–C6, 11.41 mol/%; C7–C10, 3.55 mol/%; C11+, 36.39 mol/%). A single degassing experiment at a formation temperature of 118.2℃ and a formation pressure of 26.8 MPa was performed involving the six proposed components for obtaining a numerical simulation fluid model of the Puddle 128 block, and the fitting accuracy reached more than 95%. On the basis of this model, a rock seepage characteristic model reflecting the reservoir seepage characteristics was established, and the oil–water two-phase seepage curves and oil–gas two-phase seepage curves are shown in Figure 6a,b. For the 14 production wells of Block 128, which do not contain water in the reservoir, daily oil production history fitting was conducted one at a time, and the fitting rate reached more than 95%, which conforms with the fitting accuracy requirements. Through numerical simulations, it was predicted that the recovery rate of the gas-driven energy development method reached 9.73%, the CO2 recovery rate reached 26.89%, which is 17.16% greater than that of the natural energy development method, and the effect of the gas-driven development method was notable (Figure 6c,d). The numerical simulation model indicated that the recovery rate of the CO2 mixed-phase drive method in the Shuang 229 block could reach 40.05%, which is 30.32% greater than that of the depletion development method. In addition, indoor core drive experiments were conducted. The indoor core drive experiments confirmed that CO2 injection could maximize the dissolution and viscosity reduction effects under the reservoir conditions of the Shuang 229 block and could realize mixed-phase drive, with an oil-driving efficiency up to 79.5%, which is higher than that of natural gas injection with near-mixed-phase drive, with an oil-driving efficiency of 68.75%. Therefore, the numerical model comprehensively confirmed that block development by the CO2 injection mixed-phase drive method could effectively improve the recovery rate and could realize effective CO2 geological storage.

4.4. Reservoir Engineering Design

On the basis of numerical simulation, the typical extralow-permeability reservoir of the Shuang 229 block was adopted as the design object, and the injection and extraction well network and well spacing were optimized by comprehensively considering the tectonic tendency, fracture direction, reservoir connectivity, balance of development methods and economic factors. Two sets of injection and extraction well network schemes were designed for this deployment (Table 4). Scheme 1 is the original rectangular anti-nine-point injection and extraction well network, with an injection and extraction well spacing of 210–420 m (Table 4). Scheme 2 is a rhombic anti-nine-point well network, with an injection and extraction well spacing of 210–235 m (Table 4). According to comparison of the schemes, Scheme 1 exhibits the smallest number of wells and lower investment, but the scale of injection and extraction is small, the connectivity is relatively poor, and the injection capacity is relatively low, with a recovery rate of only 27%. Scheme 2 exhibits more wells and greater investment, but it can effectively improve the degree of reservoir connectivity, increase the gas drive range, improve the injection capacity, and enhance the maximum principal stress. Moreover, the stratigraphic dip of the injection and extraction well spacing is relatively high, which can effectively reduce the gas flow. From a comprehensive perspective, option 2 is recommended to maximize the reservoir storage capacity by considering the formation dip angle and the direction of the main stress and by designing a diamond-shaped anti-nine-point injection and extraction well network. Through comparison of the numerical simulation results, the recovery rate of Scheme 2 is 40.05% higher than that of Scheme 1. By improving the degree of reservoir connectivity, the connectivity coefficient increases by more than 10%, increasing the gas drive range, enhancing the maximum principal stress and formation dip direction of larger injection wells, reducing the gas flow and effectively improving the final recovery rate of the gas drive.
To verify the burial effect, the oil displacement effect was observed under continuous injection of CO2. It is necessary to clarify and optimize the injection and extraction parameters. Comprehensive analysis of the reservoir conditions, extraction and injection tests and indoor experiments confirms that the block does not provide the conditions for water injection and development, and the water absorption capacity is low. The reservoir exhibits a high gas absorption capacity, and the CO2 injection test well group achieves stable injection conditions, but it is not possible to implement effective control methods, such as water and gas alternation and foam drive. Furthermore, compared to the injection of water, nitrogen and natural gas, CO2 has the highest EOR efficiency under the same PV conditions (Figure 7a) and is the optimal miscible replacement medium with high swelling and strong viscosity reduction. Therefore, a single CO2 medium continuous injection method should be designed. To reduce the influence of the pressure-sensitive effect on pore penetration, combined with a CO2 mixed-phase reservoir injection pressure of 31.8 MPa, the formation pressure coefficient should be maintained above 0.95 to ensure a better gas drive effect. The weak point at −3164 m can withstand a maximum gas column height of >200 m, the highest pressure is 36 MPa, and the converted geologically buried upper limit pressure coefficient is 1.14. The core drive experiments revealed that, as the injected PV oil-driving efficiency was increased to 79.5%, the increase in the injected PV oil-driving efficiency continued to improve, and the increase in the oil-driving efficiency under the injection of 0.5, 1.1, 1.5, and 2.0 HCPVs reached 16%, 6.5%, 2.5%, and 2.0 HCPVs, respectively. The increase in the oil-driving efficiency was 16%, 6.5% and 2.5% under the injection of 0.5, 1.1, 1.5 and 2.0 HCPVs, respectively. The gas-oil ratio doubled after 1.5 HCPVs, and the increase in the oil-driving efficiency decreased (Figure 7b). Further numerical simulation was conducted, and it was found that, when 1.5 HCPVs were injected, the increase in the recovery rate significantly slowed, so CO2 sequestration should adopt a cyclic injection mode. To optimize the injection speed, velocity gradients of 0.04, 0.06, 0.08, 0.1, and 0.12 HCPV/a were used in the simulation calculations (Figure 7a,b). A comparative analysis revealed that, when the CO2 gas injection speed was greater than 0.08 HCPV/a (Figure 4a), the oil well was prone to gas migration, and the oil production greatly decreased. It could be considered that the optimal CO2 gas injection speed is 0.08 HCPV/a, the maximum gas injection volume per well is 50 t/d, the predicted wellhead injection pressure is 25 MPa, and the bottom flow pressure is 58 MPa, which is less than the fracture pressure of the oil formation (68 MPa), corresponding to the gas injection volume and injection pressure of a single well in order to ensure reasonable and safe injection of a single well.

5. Results and Predictions of CO2 Sequestration

On this basis, the Wa 128 well area in the Shuang 229 block with a greater thickness of the oil layer and reserve scale was selected as the pilot test area for CO2 flooding and burial in this study. The average effective reservoir thickness in the Wa 128 well area is 24 m, the geological reserves are 3.58 × 10⁶ t, accounting for 39.4% of the total reserves, the connectivity coefficient of the reservoir is relatively high, approximately 68–75%, and the connectivity coefficient of the same layer is higher than that in the other well areas. Therefore, a high degree of gas drive control can be obtained under the same well network conditions. Based on the production capacity of the different well zones in the Shuang 229 block plane, the daily oil production, cumulative oil production and average single-well daily oil production and cumulative oil production of the Pit 128 well zone are relatively high, the well production capacity is better utilized, and the structure provides a high CO2 sequestration capacity. Therefore, the powerful reservoir numerical simulation (i.e., WinProp module; Section 4.3) and optimal CO2 injection parameters of 1.5 HCPV were determined (Section 4.4), and the effective geological parameters of the Wa 128 well area might have provided an important basis for the prediction in Figure 8. With Groups III, IV and V of the Pit 128 well area as the target layers and considering 358.2 × 10⁴ t of geological oil reserves, a set of development layer systems was adopted, a diamond-shaped anti-nine-point injection and extraction well network was designed (Table 4), 50 wells were deployed, the ratio of injection to extraction wells was 1:3.5, and the cumulative injection volume at the CCUS stage was set to 1.5 HCPVs, which indicates a high CO2 sequestration capacity. Adopting groups III, IV, and V within the Wa 128 well area as the target layers, 1.5 HCPV was injected into 50 wells each, and it was predicted that the highest CO2 burial volume of the carbon flooding and burial pilot test in the Wa 128 well area could reach 1.11 × 10⁵ t/a, the predicted cumulative CO2 burial volume would be 2.16 × 10⁶ t, the corresponding maximum oil production would be 7.17 × 10⁴ t/a, with an increase in the recovery rate of 32.5% to 40%, and the estimated cumulative oil production may reach 1.43 × 10⁶ t (Figure 8a,b). The recovery rate reached 40%, an increase of 32.5% over the original method.
While the CO2 geological sequestration in extralow-permeability reservoirs offers considerable potential for application and economic gain, it also carries inherent environmental and economic risks. The first risk is environmental. Due to the complexity and difficulty associated with accurately predicting terrestrial sedimentation, natural tectonic events or human construction can potentially lead to CO2 leakage into the atmosphere or groundwater. This could result in environmental pollution and ecological damage. The second risk is economic. The geological storage of CO2 requires a significant investment, which may increase the financial burden on enterprises. Therefore, it is crucial to enhance monitoring of CO2 sequestration in extralow-permeability reservoirs, strengthen technological research and development to reduce the cost of CO2 storage, and maximize its economic value by improving CO2 oil recovery efficiency in future studies.

6. Conclusions

This study aims to elucidate the potential for geological sequestration of CO2 in extralow-permeability reservoirs. To achieve this, we conducted experimental research on CO2 storage at the Shahejie Formation (Es1 member) of the Shuang 229 block in the Liaohe oilfield, located in the Bohai Bay Basin. The primary insights gained from this research are as follows:
(1)
The physical attributes of Shahejie Formation (Es1 member) have been elucidated to be low to extralow-permeability homogeneous reservoirs. The reservoir lithology is fine sandstone and siltstone, with high compositional and structural maturity, an average porosity of 14.8%, an average permeability of 1.48 mD, an average pore radius of 5.31 μm, a displacement pressure generally less than 0.1 MPa, a mercury saturation greater than 70% at the maximum pressure, a desorption efficiency greater than 24%, and a reservoir coefficient of variation of approximately 0.5, which suggests a low- to extralow-permeability homogeneous reservoir.
(2)
The optimal CO2 injection rate is determined to be 0.08 HCPV/a. The Shuang 229-36-62 well was subjected to stepwise increasing injection for 72 days, and a total of 3204 m3 of CO2 gas was injected. The density of the injected liquid CO2 was relatively high near the wellhead, close to 1.0 g/cm3, and gradually decreased to approximately 0.78 g/cm3 near a depth of 2000 m underground, which indicates that the injected liquid is transformed into a supercritical state upon entering the formation, with the optimal CO2 injection rate of 0.08 HCPV/a.
(3)
The cap rock and fault sealing characteristics of the Shuang 229 block have been successfully evaluated, indicating that it is conducive for sustainable geological storage of CO2. The discharge pressure of the Shuang 229 block cap layer is >2.0 MPa, and the fault can withstand a maximum gas column height of >200 m, with satisfactory capping and fault sealing characteristics and a normal temperature-pressure gradient in the strata.
Accordingly, it is hypothesized that the cumulative CO2 storage capacity within the 128 well area of the Shuang 229 block approximates 2.16 × 10⁶ t. This suggests a substantial potential for geological storage of CO2, thereby indicating that this extralow-permeability reservoir holds significant commercial value for CO2 storage. However, future efforts should focus on rigorous monitoring of post-storage CO2 to ensure safety and reliability. Additionally, there is a need to advance CO2 storage technology to reduce associated costs.

Author Contributions

Conceptualization, E.W. and C.L.; methodology, D.W.; software, T.Z.; validation, D.W. and T.Z.; formal analysis, C.L.; investigation, C.L.; resources, D.W.; data curation, C.L.; writing—original draft preparation, C.L.; writing—review and editing, C.L.; visualization, C.L.; supervision, E.W.; project administration, E.W. All authors have read and agreed to the published version of the manuscript.

Funding

This work was funded by the Research and development of collaborative control technology for carbon dioxide oil displacement and geological storage (Grant No. LHZB20220706G044).

Data Availability Statement

All data are contained in text.

Conflicts of Interest

Author Dawei Wang was employed by the Liaohe Oilfield Company. Author Ting Zhang was employed by the AGEO Engineering Service Pty Ltd. The remaining authors declare that the research was conducted in the absence of any commercial or financial relationships that could be construed as a potential conflict of interest.

References

  1. Capuano, D. Annual Energy Outlook; US Energy Information Administration: Washington, DC, USA, 2019.
  2. Mitchell, J.F.B. The “greenhouse” effect and climate change. Rev Geophys. 1989, 27, 115–139. [Google Scholar] [CrossRef]
  3. Mikhaylov, A.; Moiseev, N.; Aleshin, K.; Burkhardt, T. Global climate change and greenhouse effect. Entrep. Sustain. Issues 2020, 7, 2897. [Google Scholar] [CrossRef] [PubMed]
  4. British Petroleum Company. BP Statistical Review of World Energy; BP Company: London, UK, 2018. [Google Scholar]
  5. Bachu, S. Sequestration of CO2 in geological media: Criteria and approach for site selection in response to climate change. Energy Convers Manag. 2000, 41, 953–970. [Google Scholar] [CrossRef]
  6. Socolow, R.; Hotinski, R.; Greenblatt, J.B.; Pacala, S. Solving the climate problem: Technologies available to curb CO2 emissions. Environ. Sci. Policy Sustain. Dev. 2004, 46, 8–19. [Google Scholar] [CrossRef]
  7. Hoffert, M.I.; Caldeira, K.; Jain, A.K.; Haites, E.F.; Harvey, L.D.; Potter, S.D.; Wuebbles, D.J. Energy implications of future stabilization of atmospheric CO2 content. Nature 1998, 395, 881–884. [Google Scholar] [CrossRef]
  8. Alrassas, A.M.; Vo Thanh, H.; Ren, S.; Sun, R.; Al-Areeq, N.M.; Kolawole, O.; Hakimi, M.H. CO2 Sequestration and enhanced oil recovery via the water alternating gas scheme in a mixed transgressive sandstone-carbonate reservoir: Case study of a large middle east oilfield. Energy Fuels 2022, 36, 10299–10314. [Google Scholar] [CrossRef]
  9. Safaei-Farouji, M.; Thanh, H.V.; Dashtgoli, D.S.; Yasin, Q.; Radwan, A.E.; Ashraf, U.; Lee, K.K. Application of robust intelligent schemes for accurate modelling interfacial tension of CO2 brine systems: Implications for structural CO2 trapping. Fuel 2022, 319, 123821. [Google Scholar] [CrossRef]
  10. Bui, M.; Adjiman, C.S.; Bardow, A.; Anthony, E.J.; Boston, A.; Brown, S.; Mac Dowell, N. Carbon capture and storage (CCS): The way forward. Energy Environ. Sci. 2018, 11, 1062–1176. [Google Scholar] [CrossRef]
  11. Gibbins, J.; Chalmers, H. Carbon capture and storage. Energy Policy 2008, 36, 4317–4322. [Google Scholar] [CrossRef]
  12. Koottungal, L. World EOR survey. Oil Gas J. 2014, 112, 79–91. [Google Scholar]
  13. Hitesh, M.; Marshall, C.; Khosrow, B. The potential for additional carbon dioxide flooding projects in the United States. In Proceedings of the SPE Symposium on Improved Oil Recovery, Tulsa, OK, USA, 19–23 April 2008. Paper Number: SPE-113975-MS. [Google Scholar]
  14. Hill, L.B.; Li, X.C.; Wei, N. CO2-EOR in China: A comparative review. Int. J. Greenhouse Gas Control. 2020, 103, 103173. [Google Scholar] [CrossRef]
  15. Yuan, S.Y.; Ma, D.S.; Li, J.S.; Zhou, T.Y.; Jie, Z.M.; Han, H.S. Progress and prospects of carbon dioxide capture, EOR-utilization and storage industrialization. Pet. Explor. Dev. 2022, 49, 955–962. [Google Scholar] [CrossRef]
  16. Wang, Y.Q.; Fan, Z.Q.; Wang, Q.L.; Xue, Z.Q.; Wang, Y.D. Lattice Boltzmann Multiphase Flow Simulations for CO2-Enhanced Oil Recovery Using Various Modes of Immiscible CO2 Injection. Energy Fuels 2023, 37, 12154–12165. [Google Scholar] [CrossRef]
  17. Koottungal, L. Worldwide EOR survey. Oil Gas J. 2008, 106, 47–59. [Google Scholar]
  18. Song, X.M.; Wang, F.; Ma, D.S.; Gao, M.; Zhang, Y.M. Progress and prospect of carbon dioxide capture, utilization and storage in CNPC oilfields. Pet. Explor. Dev. 2023, 50, 206–218. [Google Scholar] [CrossRef]
  19. Luo, R.; Hu, Y.; Li, B.; Zhu, W. Practice of increasing production rate by injecting CO2 into oil and gas fields in China. Spec. Oil Gas Reserv. 2013, 20, 1–7. [Google Scholar]
  20. Gao, Y.; Zhao, M.; Wang, J.; Zong, C. Performance and gas breakthrough during CO2 immiscible flooding in ultra-low permeability reservoirs. Pet. Explor. Dev. 2014, 41, 79–85. [Google Scholar] [CrossRef]
  21. Yu, K.; Liu, W.; Chen, Z. CO2 Miscible Flooding Technology in Continental Low Permeability Reservoir. Master’s Thesis, Petroleum Industry Press, Beijing, China, 2016. [Google Scholar]
  22. Wang, X. CO2 Flooding Technology in Low Permeability Sandstone Reservoir. Master’s Thesis, Petroleum Industry Press, Beijing, China, 2017. [Google Scholar]
  23. Xu, B.; Li, J.; Li, X.; Wang, C.; Liu, K.; Xu, M.; Jing, J.; Nie, L. Evaluation of hydrocarbon accumulation conditions for shale gas from the Eastern Sag of the Liaohe Oilfield and its gas-bearing properties. Acta Pet. Sin. 2011, 32, 450–458. [Google Scholar]
  24. Geng, D. Diagenesis and the Favorable Reservoir Prediction of Qingshui Sag, Liaohe Depression. Ph.D. Thesis, Northeast Petroleum University, Daqing, China, 2013. [Google Scholar]
  25. Xu, R. Study on Qingshui Sag Faults’ Characteristics and Its Controlling Role in Oil & Gas Accumulation. Master’s Thesis, Northeast Petroleum University, Daqing, China, 2018. [Google Scholar]
Figure 1. Regional location and geological characteristics of S-229 block, Dawa Oilfield (a), the four main well zones in S-229 block (b), and a comprehensive geological histogram of the major oil-bearing formations (c).
Energies 17 02221 g001
Figure 2. Physical characteristics and stratigraphic conditions of the reservoir in the sand section of the Shuang 229 block of the Dawa oilfield. (a) Ternary element diagram of the sandstone composition; (b) formation temperature, pressure and depth curves; (c) characteristics of the capillary pressure curves; (d) accumulation curves of the mercury saturation and permeability contribution.
Energies 17 02221 g002
Figure 3. Main lithologies and reservoir space types of the sand section reservoirs in the Dawa oilfield. (a) Intergranular pores and granular dissolution pores (Shuang 229, 3365.6 m, fine-grained clastic feldspathic sandstone, single bias 50×); (b) intergranular pores, micropores, and tectonic joints (Shuang 246, 3620.95 m, fine-medium-grained clastic feldspathic sandstone, single bias 50×); (c) intergranular pores, intragranular pores, casting pores, and micropores (Puddle 111, 3443.22 m, fine- to medium-grained clastic feldspathic sandstone 5 × 10); (d) intergranular pores and intragranular pores (Puddle 111, 3447.80 m, fine- to medium-grained clastic feldspathic sandstone, 5 × 10).
Energies 17 02221 g003
Figure 4. Numerical simulation model of fault closure in double block 229 (software TrapTester 7.1). (a) Plan view of the fault model; (b) Model of the top surface of group S133; (c) Model of the allowable differential pressure of fault No. 3.
Energies 17 02221 g004
Figure 5. Evaluation of CO2 test injection effect of the E3S1 in S-229 block. (a,b) Gas injection curves of S-229-36-62 and S-229-38-38 well groups (c).
Energies 17 02221 g005
Figure 6. Reservoir numerical simulation of the oil-driving effect. (a) Oil–water phase permeability curve of the Puddle 128 block; (b) oil–gas phase permeability curve of the Puddle 128 block; (c) recovery prediction curve of CO2 mixed-phase drive development and depletion development of the double 229 blocks; (d) simulated recovery prediction curves for the different injection and extraction well network schemes.
Energies 17 02221 g006
Figure 7. (a) Numerical modeling prediction of different gas injection rates versus gas-oil ratio, and (b) saturated vapor pressure curves for common fluid.
Energies 17 02221 g007
Figure 8. Annual oil production, annual carbon dioxide storage (a), cumulative oil production, and cumulative carbon dioxide storage (b) during 2020–2055.
Energies 17 02221 g008
Table 1. Experimental data on the breakthrough pressure in the physical properties of the mud caprock in the first section of the Shuang 229 block. Displacement pressure/MPa; maximum pore throat radius/μM; average pore throat radius/Μm.
WellDepth
/m
Porosity
/%
Permeability
/10−3 μm2
Displacement Pressure
/MPa
Maximum Pore Throat Radius
/μM
Average Pore Throat Radius/μM
Shuang 229-38-323937.667.90.0578.1470.0900.053
3867.407.60.06512.0510.0590.024
3847.944.80.04121.0580.0370.016
Table 2. Evaluation of the sealing capacity of the Sha-1 fault in Shuang 229. Sandstone docking index; mudstone coating coefficient; fault sealing.
Fault NO.Separation
(m)
Extend
(km)
Fault AttitudeSandstone Docking IndexMudstone Coating CoefficientFault Sealing
DirectionPronenessDip
1600–1300>10NENW70–8503Good
220–2005NWNE65–800.033.5Good
320–2003NWNE65–800.023.9Good
430–3001.8NWNE65–800.054.5Good
50–501.4NENW75–800.186.3Medium
620–100>3~EMS65–800.1615.7Medium
750–1001.6~EMS75–800.127.5Medium
850–100>3~EMS75–800.118.3Medium
915–401.8~EMN60–800.1110.3Medium
1010–500.6~EMN70–800.238.9Poor
Table 3. Evaluation of the effectiveness of each trap in the Shuang229 structural belt.
Trap NameSand SetsClosing HeightSGR Minimum (%)Depth of Weak Points (m)Pressure of Weak Point (MPa)Height of Weak Point (m)Maximum Hydrocarbon Height (m)Maximum Pressure (MPa)
Shuang
-246
III60031.4−35141.3542844241.4
IV55015.9−37550.3093.9198.943.1
Wa-128III65040.1−35381.6447.6595.643.1
IV55017.5−34271.05309.9336.940.1
V40020−36970.7623638342.9
Wa-111III57020.3−31640.216738136.3
IV58012.8−31710.154821936.3
V4506.7−33490.227222138.4
Table 4. Comparison of the advantages and disadvantages of the different injection and extraction well network schemes.
Well Pattern TypesScheme 1:
Rectangular Inverse Nine Points
Scheme 2:
Rhombus Inverse Nine Points
Distance between injection wells210–420 m210–235 m
Well network modelEnergies 17 02221 i001Energies 17 02221 i002
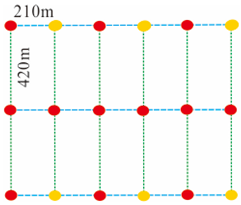
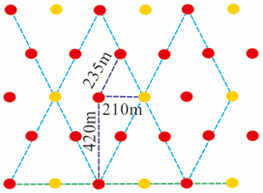
Number of injection wells
(Pit 128 well area)
5 injected 24 extracted11 injected 39 extracted
Connectivity factor51–68%60–78%
Injection capacity8.58 × 104 t/year20.82 × 104 t/year
Recovery ratio1.0 PV cumulative injection, 27% injection rate1.5 PV cumulative injection, 40% injection rate
Disclaimer/Publisher’s Note: The statements, opinions and data contained in all publications are solely those of the individual author(s) and contributor(s) and not of MDPI and/or the editor(s). MDPI and/or the editor(s) disclaim responsibility for any injury to people or property resulting from any ideas, methods, instructions or products referred to in the content.

