Article

Phase Composition of HiVac-VPE Lithium Niobate Optical Waveguides Identified by Spectroscopic Investigations

1
Research Center on Advanced Materials and Technologies, Department of Exact and Natural Sciences, Institute of Interdisciplinary Research, “Alexandru Ioan Cuza” University of Iasi, Blvd. Carol I, No. 11, 700506 Iasi, Romania
2
RPC Optolink, Special’naya Territoriya Malogo Predtprenimatel’stva, Zelenograd, Sosnovaya al. 6A, 124489 Moscow, Russia
3
Physics Department, Kemerovo State University, 650000 Kemerovo, Russia
*
Author to whom correspondence should be addressed.
Materials 2024, 17(10), 2249; https://doi.org/10.3390/ma17102249
Submission received: 14 March 2024 / Revised: 29 April 2024 / Accepted: 8 May 2024 / Published: 10 May 2024
(This article belongs to the Section Optical and Photonic Materials)

Abstract

:
High-index contrast lithium niobate waveguides, fabricated by the High Vacuum Vapor-phase Proton Exchange (HiVac-VPE) technique, are very promising for increasing both the optical nonlinear and electro-optical efficiencies of photonic integrated devices. So as to play this role effectively, it is mandatory to know the crystallographic phase composition of waveguides and the position of protonated layers for appropriate tailoring and optimization based on the intended applications. In addition, the estimation of structural disorder and electro-optical properties of the waveguides are also of high interest. Benefiting from Raman spectroscopy, IR reflection, IR absorption, and UV-VIS absorption, the HxLi1−xNbO3 phase compositions, as well as the structural disorder in waveguides, were determined. Based on experimental data on the shift of the fundamental absorption edge, we have quantitatively estimated the electro-optic coefficient r13 in as-exchanged waveguides. The electro-optical properties of the waveguides have been found to be depending on the phase composition. The obtained results allow for reconsidering the proton exchange fabricating process of photonic nonlinear devices and electro-optic modulators based on high-index contrast channel waveguides on the LiNbO3 platform.

1. Introduction

The fast growth of modern photonics applications, whether for the enhancement of nonlinear optical efficiency at the single photon level for quantum information applications, customization of photonics circuitry, and scalability of integrated photonics platforms, to name only these (a few), demand high-quality optical waveguides. This fact motivated attempts to adjust or identify new techniques in view of the fabrication of optical waveguides exhibiting a high-index contrast, low propagation losses, and preserved electro-optical and nonlinear optical properties.
Thanks to its excellent electro-optical and nonlinear optical properties, doubled by the relative easiness of producing waveguides, the congruent lithium niobate (CLN) crystal is a platform of choice for various integrated optics applications and photonic devices. Our recently reported developments on the fabrication of high-index contrast waveguides on CLN substrates by using High Vacuum Vapor-phase Proton Exchange (HiVac-VPE) are very promising. Indeed, the HiVac-VPE optical waveguides are characterized by very high-index contrast (∆ne > 0.1), preserved intrinsic nonlinearity of the crystal, and relatively low propagation losses [1]. To understand the origin of these very promising features, the HiVac-VPE waveguides deserve particular attention regarding the phase composition and position of protonated layers by comparing them with waveguides fabricated using proton exchange techniques that have been developed and well-known for a long time.
Various methods were used to study the HxLi1−xNbO3 phases in proton-exchanged LiNbO3 optical waveguides: X-ray diffraction, M-lines mode spectroscopy, secondary ion mass spectrometry, thermo-gravimetric analysis, differential scanning calorimetry, forward recoil spectrometry, Rutherford backscattering spectrometry, Raman spectroscopy, IR reflection spectroscopy, IR absorption spectroscopy, and UV-VIS absorption spectroscopy [1,2,3,4,5,6,7,8,9,10,11,12,13,14,15,16,17,18,19,20,21,22,23,24,25,26]. The existence of six to seven phases of HxLi1−xNbO3 (depending on the crystallographic orientation of the main surface of the crystal plate) has been established in waveguides fabricated using various proton exchange techniques, including Proton Exchange, Annealed Proton Exchange, Soft Proton Exchange, Vapor-phase Proton Exchange, and High Index Soft Proton Exchange [9,10,15,19,22,25,27]. The specific Raman and IR reflection/absorption spectra are observed for each phase [9,10,11,12,13,14,15,16,17,19,21,24]. Therefore, for identification of any HxLi1−xNbO3 phase in waveguides fabricated by other techniques, such as the case of our HiVac-VPE [1,2,3] or Reverse Proton Exchange [24], it is sufficient to use optical spectroscopy data. In addition, the micro-Raman technique gives the possibility for fast depth profiling of phase composition in any waveguides [17]. The UV-VIS absorption spectroscopy data allow for evaluation of the band gap and, thus, for estimation of the electro-optic coefficient in any waveguides.
In this article, based on optical spectroscopy methods such as Raman spectroscopy, IR reflection, IR absorption, and UV-VIS absorption, we investigate phase composition, depth profile, and electro-optic properties in waveguides fabricated by the HiVac-VPE technique [1,2,3]. As each HxLi1−xNbO3 phase has a specific spectrum, interesting and very particular information was identified on the waveguides subjected to the study. This approach yields interesting results that have not yet been reported, enabling us to understand the origin of the optical features of the HiVac-VPE waveguides. For any relatively new established technique such as HiVac-VPE, this type of study is absolutely necessary to understand the different properties and peculiarities of the new types of optical waveguides compared to those manufactured through already known and extensively used proton exchange techniques within the scientific community.

2. Samples Fabrication and Index Profiles Reconstruction

This study began by slicing six samples from a Z-cut CLN optical-grade wafer (Gooch & Housego, Crystal Technology, Palo Alto, California, United States). The samples are w = 8 mm in width and l = 15 mm long and were labeled S#0, S#1, S#2, and so on until S#5, respectively. The S#0 sample will be kept virgin and will be used as a reference to compare the results obtained on the protonated samples. The other five samples were protonated to create a planar waveguide on the Z+ top surface by using the HiVac-VPE technique, a process very well described in our previous work [1]. The waveguides were fabricated by exposing the samples to acid vapor for different exchange durations t(h) at an exchange temperature of Texch = 350 °C. Each sample is introduced in a hermetically sealed hourglass-shaped glass tube. Prior to being sealed, the bottom part of the glass tube was filled with 16 g of Benzoic Acid (BA) (Sigma-Aldrich, St. Louis, MO, USA) powder as a vapor source. The purity of the powder is 99%. The sample is placed in the top part of the tube, and then, by using a turbo pumping system HiCube 80 Eco (Pfeiffer, Asslar, Germany), the tube is pumped down to a pressure as low as p = 4 ± 0.1 × 10⁻⁵ mbar. After the glass tube is sealed, it is placed into a homemade metallic tube container, which avoids thermal shocks and ensures uniform heating and easy and safe manipulation. The metallic tube is placed vertically in an oven (Lenton WHT5/60, Thermal Design, Hope Valley, UK) preheated at 350 °C, which is the exchange temperature. The exchange duration t(h) is incremented by 1 h, starting from t = 1 h for sample S#1 up to t = 5 h for sample S#5, respectively. It is important to note the fact that this technique is manifold because, besides both high-index contrast and preserved nonlinearity of the CLN optical waveguides, the HiVac-VPE process assures very high stability and reproducibility of optical waveguide features compared to current techniques [1,2,3]. The index contrast and the shape of index profiles are of particular importance, bringing the first information about the waveguides after their fabrication. In our study, for a given waveguide, the effective indexes Neff of the guided modes have been assessed by M-lines measurements using a two-prism setup at 632.8 nm laser wavelength (Thorlabs HTPS-EC-1 He-Ne Tunable Laser, Newton, NJ, USA). The precision of effective indexes Neff measurements is ± 2.5 × 10⁻⁴. Starting from Neff values, the reconstruction of the index profile of each planar waveguide was performed using the Inverse Wentzel–Kramers–Brillouin (IWKB) numerical method as described in [1]. The value of the index contrast exhibited by each waveguide is expressed as ∆ne and is calculated as the difference between the surface index given by IWKB and the extraordinary index value of the substrate (ne = 2.2028 in our case for Gooch & Housego virgin substrate at room temperature). The reconstruction of the index profile for such HiVac-VPE waveguides is presented in Figure 1, where symbols represent IWKB corrected surface indices on the ordinate and measure Neff of the propagating modes for the others, respectively. The solid line is the fit obtained by the sum of two generalized exponential functions, described by Equation (1):
n d = n e + A 1 exp d w 1 a 1 + A 2 exp d w 2 a 2
where A1, A2, w1, w2, a1, and a2 are adjustable parameters and take different values depending on exchange time, and d is the depth of the waveguide. The method is detailed in our previous works [1,3]. Table 1 summarizes the index contrast values ∆ne @ λ = 632.8 nm of the samples under investigation.
As can be seen, the samples exhibit almost the same index contrast due to the same acidity, but because different exchange durations were used, the depth of the waveguide is the only difference between such fabricated waveguides.
After this characterization, in view of spectroscopic investigations, all six samples, the virgin substrate, and proton-exchanged waveguides, were mirror-grade polished on a lateral face, as sketched in Figure 2.
At this stage of our study, the six samples were investigated, respectively, by Raman spectroscopy, IR reflection, IR absorption, and UV-VIS absorption, thus making it possible to determine the phase composition of protonated layers. Once the characterization of all planar waveguides was completed, we decided to anneal sample S#1 with the goal of obtaining a waveguide exhibiting α-phase only in the protonated layer. The other samples require a much longer annealing time to achieve this goal, and the resulting waveguides will be very deep (useless in view of practical applications). Using the annealing process, the S#1 sample became a new one and was labeled S#1a. The results on Raman spectroscopy, IR reflection, IR absorption, and UV-VIS absorption obtained on the S#1a sample will be presented in the next section, together with the results obtained on the other samples. This will facilitate comparison and discussion of the obtained results.
The changes induced by an annealing process on both the shape of the index profile and the index contrast value of sample S#1 were investigated. The annealing was carried out for 4 h in normal atmospheric conditions by introducing the samples in a preheated oven at Tanneal = 360 °C. In order to avoid thermal shocks and for easier and safer manipulation, the sample was placed in a glass tube open at both ends. After the annealing process, the sample was investigated following the same experimental protocol, i.e., reconstruction of index profiles and assessment of index contrast by using M-lines measurements and the IWKB numerical method, respectively. The first observation is that the number of modes and the shapes of index profiles completely change after annealing, as depicted in Figure 3. At the same time, the depth of the waveguides increases, a fact as natural as possible due to the further diffusion of protons into the crystal.
As anticipated, we notice a decrease in the index contrast from ∆ne = 0.1014 to ∆ne = 0.0332 after 4 h annealing. Therefore, the plots indicate that the shape of the index profile decreases exponentially. It seems that this aspect is another peculiarity of HiVac-VPE waveguides if compared with the literature devoted to Annealing Proton Exchange (APE) waveguides. For the APE waveguides, a generalized Gaussian function was often found to provide the best approximation for the shape of the index profile after annealing [4,5]. Our findings are very important in view of already-existing results reported by literature concerning the effect of the annealing and annealing time on the shape of the index profile of the waveguides fabricated by the APE technique. We assume that it can be explained by the fact that in the case of the APE technique, after proton exchange and before annealing, the waveguides exhibit a step-like index profile. This shape of the index profile is the initial condition found in any modeling and experimental study of annealing in the case of the APE technique, which is not the case in our investigation [4,5,6,7,8]. Our initial conditions are quite different: the index profile is expressed as the sum of two generalized exponential functions, as presented in Figure 1, and in agreement with our previous work [1].
To determine the phase composition of the waveguides, we took into account the data provided by Raman spectroscopy, knowing that each HxLi1−xNbO3 phase has a specific spectrum [9,10,11,12]. Proton exchange influences both vibration modes in Raman spectra, causing intensity reduction of some of the Raman lines, the appearance of new ones, and the appearance of disorder-induced broadening of some Raman bands [9,10,11,12,13,14,15,16,17,18]. The Raman spectra were measured with a LabRAM HR800 spectrometer (Horiba Scientific, Jobin Yvon S.A.S. Villeneuve d’Ascq, France) equipped with a confocal microscope. In this device, a linearly polarized laser beam was focused, using a ×100 microscope objective, on the surface of the investigated sample. Raman spectra were measured with a He-Ne laser (λ = 632.8 nm, P = 10 mW), confocal hole with 50 μm diameter (spatial resolution: lateral ~1.0 μm and vertical (in depth) ~1.5 μm for the photometered area) and a grating with 1800 tr/mm (spectral resolution = 0.8 cm−1). By Raman spectroscopy, the depth profile d (μm) of the proton-exchanged layer was obtained by moving the focused laser beam starting from the surface towards the substrate by steps in the range of 0.1–0.5 μm. The laser beam was directed onto the polished side surface (Y-cut, as shown in Figure 2). Depth profiling with a high spatial resolution (≤0.3 µm) was achieved by analyzing Raman spectra through this polished side surface. It is important to note that the side surface was polished after HiVac-VPE processing. The confocal microscope integrated into the Raman spectrometer, along with the precision and repeatability of the computer-controlled motorized stage, enabled this high spatial resolution. The effectiveness of this approach for depth profiling was demonstrated in reference [17].
Measurement of both IR reflection and IR absorption spectra was performed using a Bruker Vertex 80V spectrophotometer (Bruker Optics GmbH, Ettlingen, Germany) with standard attachments. The transmission spectra in the visible and near UV ranges were obtained using a Shimadzu UV-3101PC spectrophotometer (Shimadzu Corporation, Shimadzu Europe, Duisburg, Germany).

3. Results and Discussion

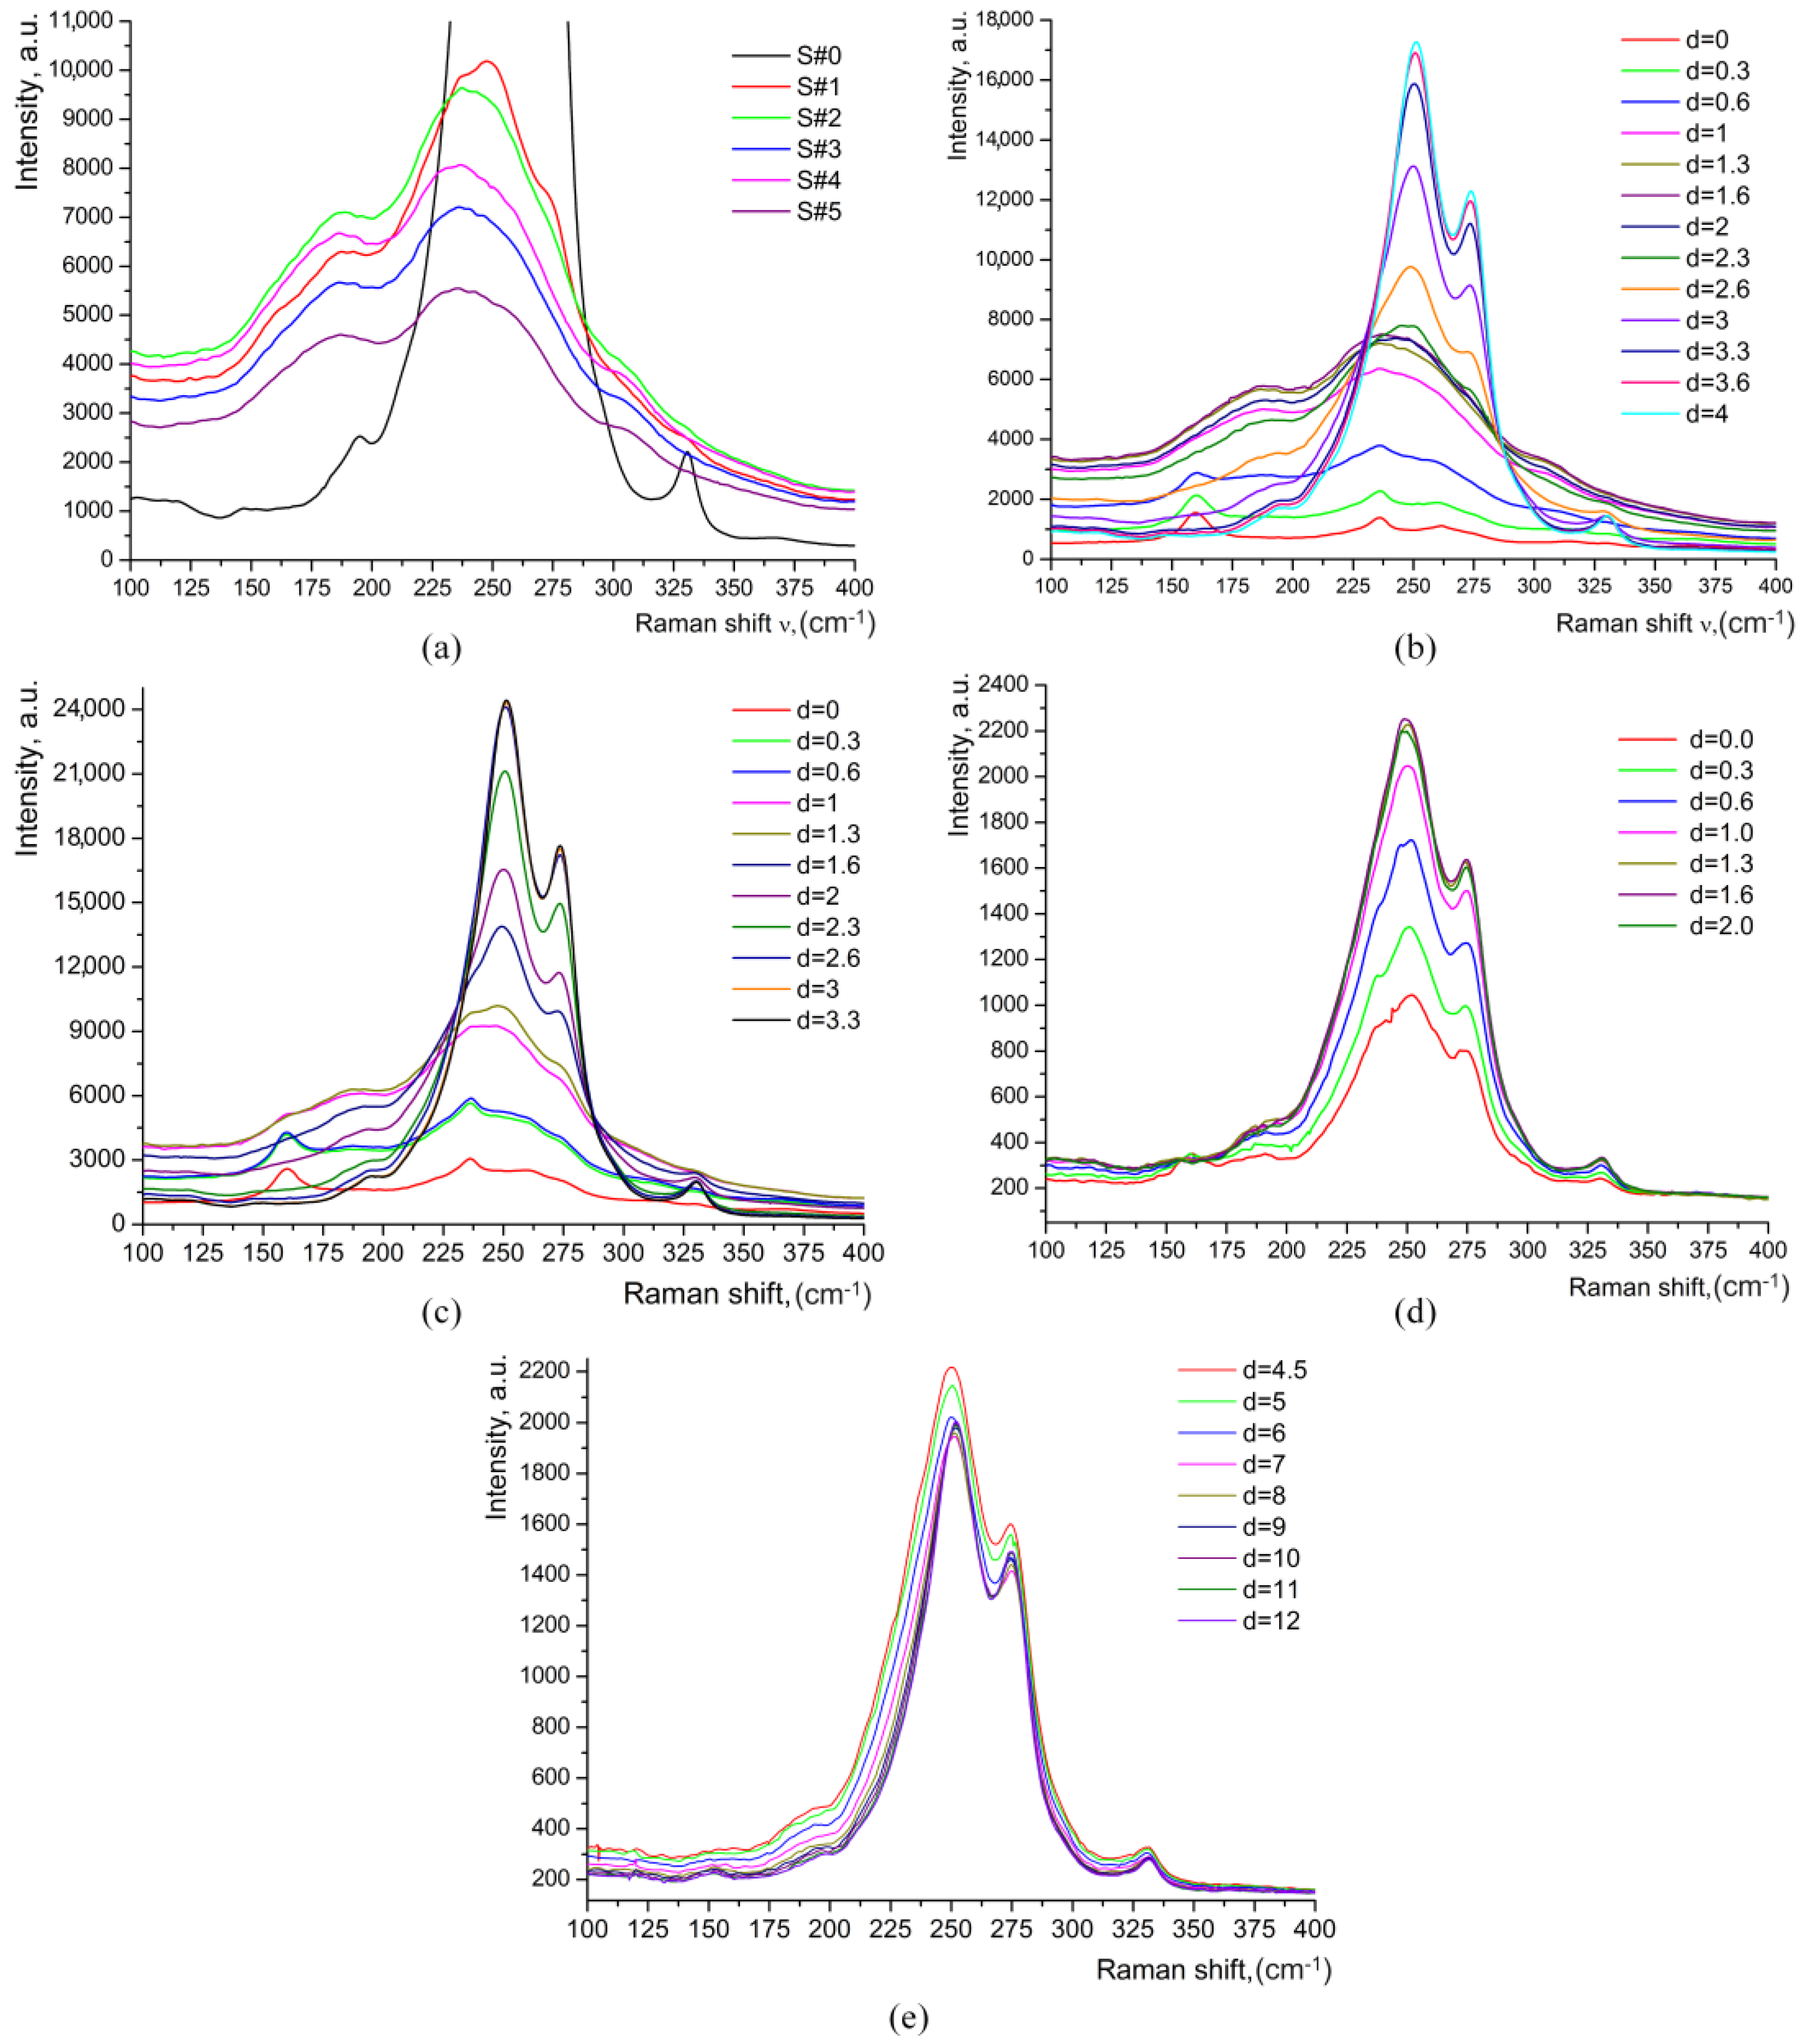
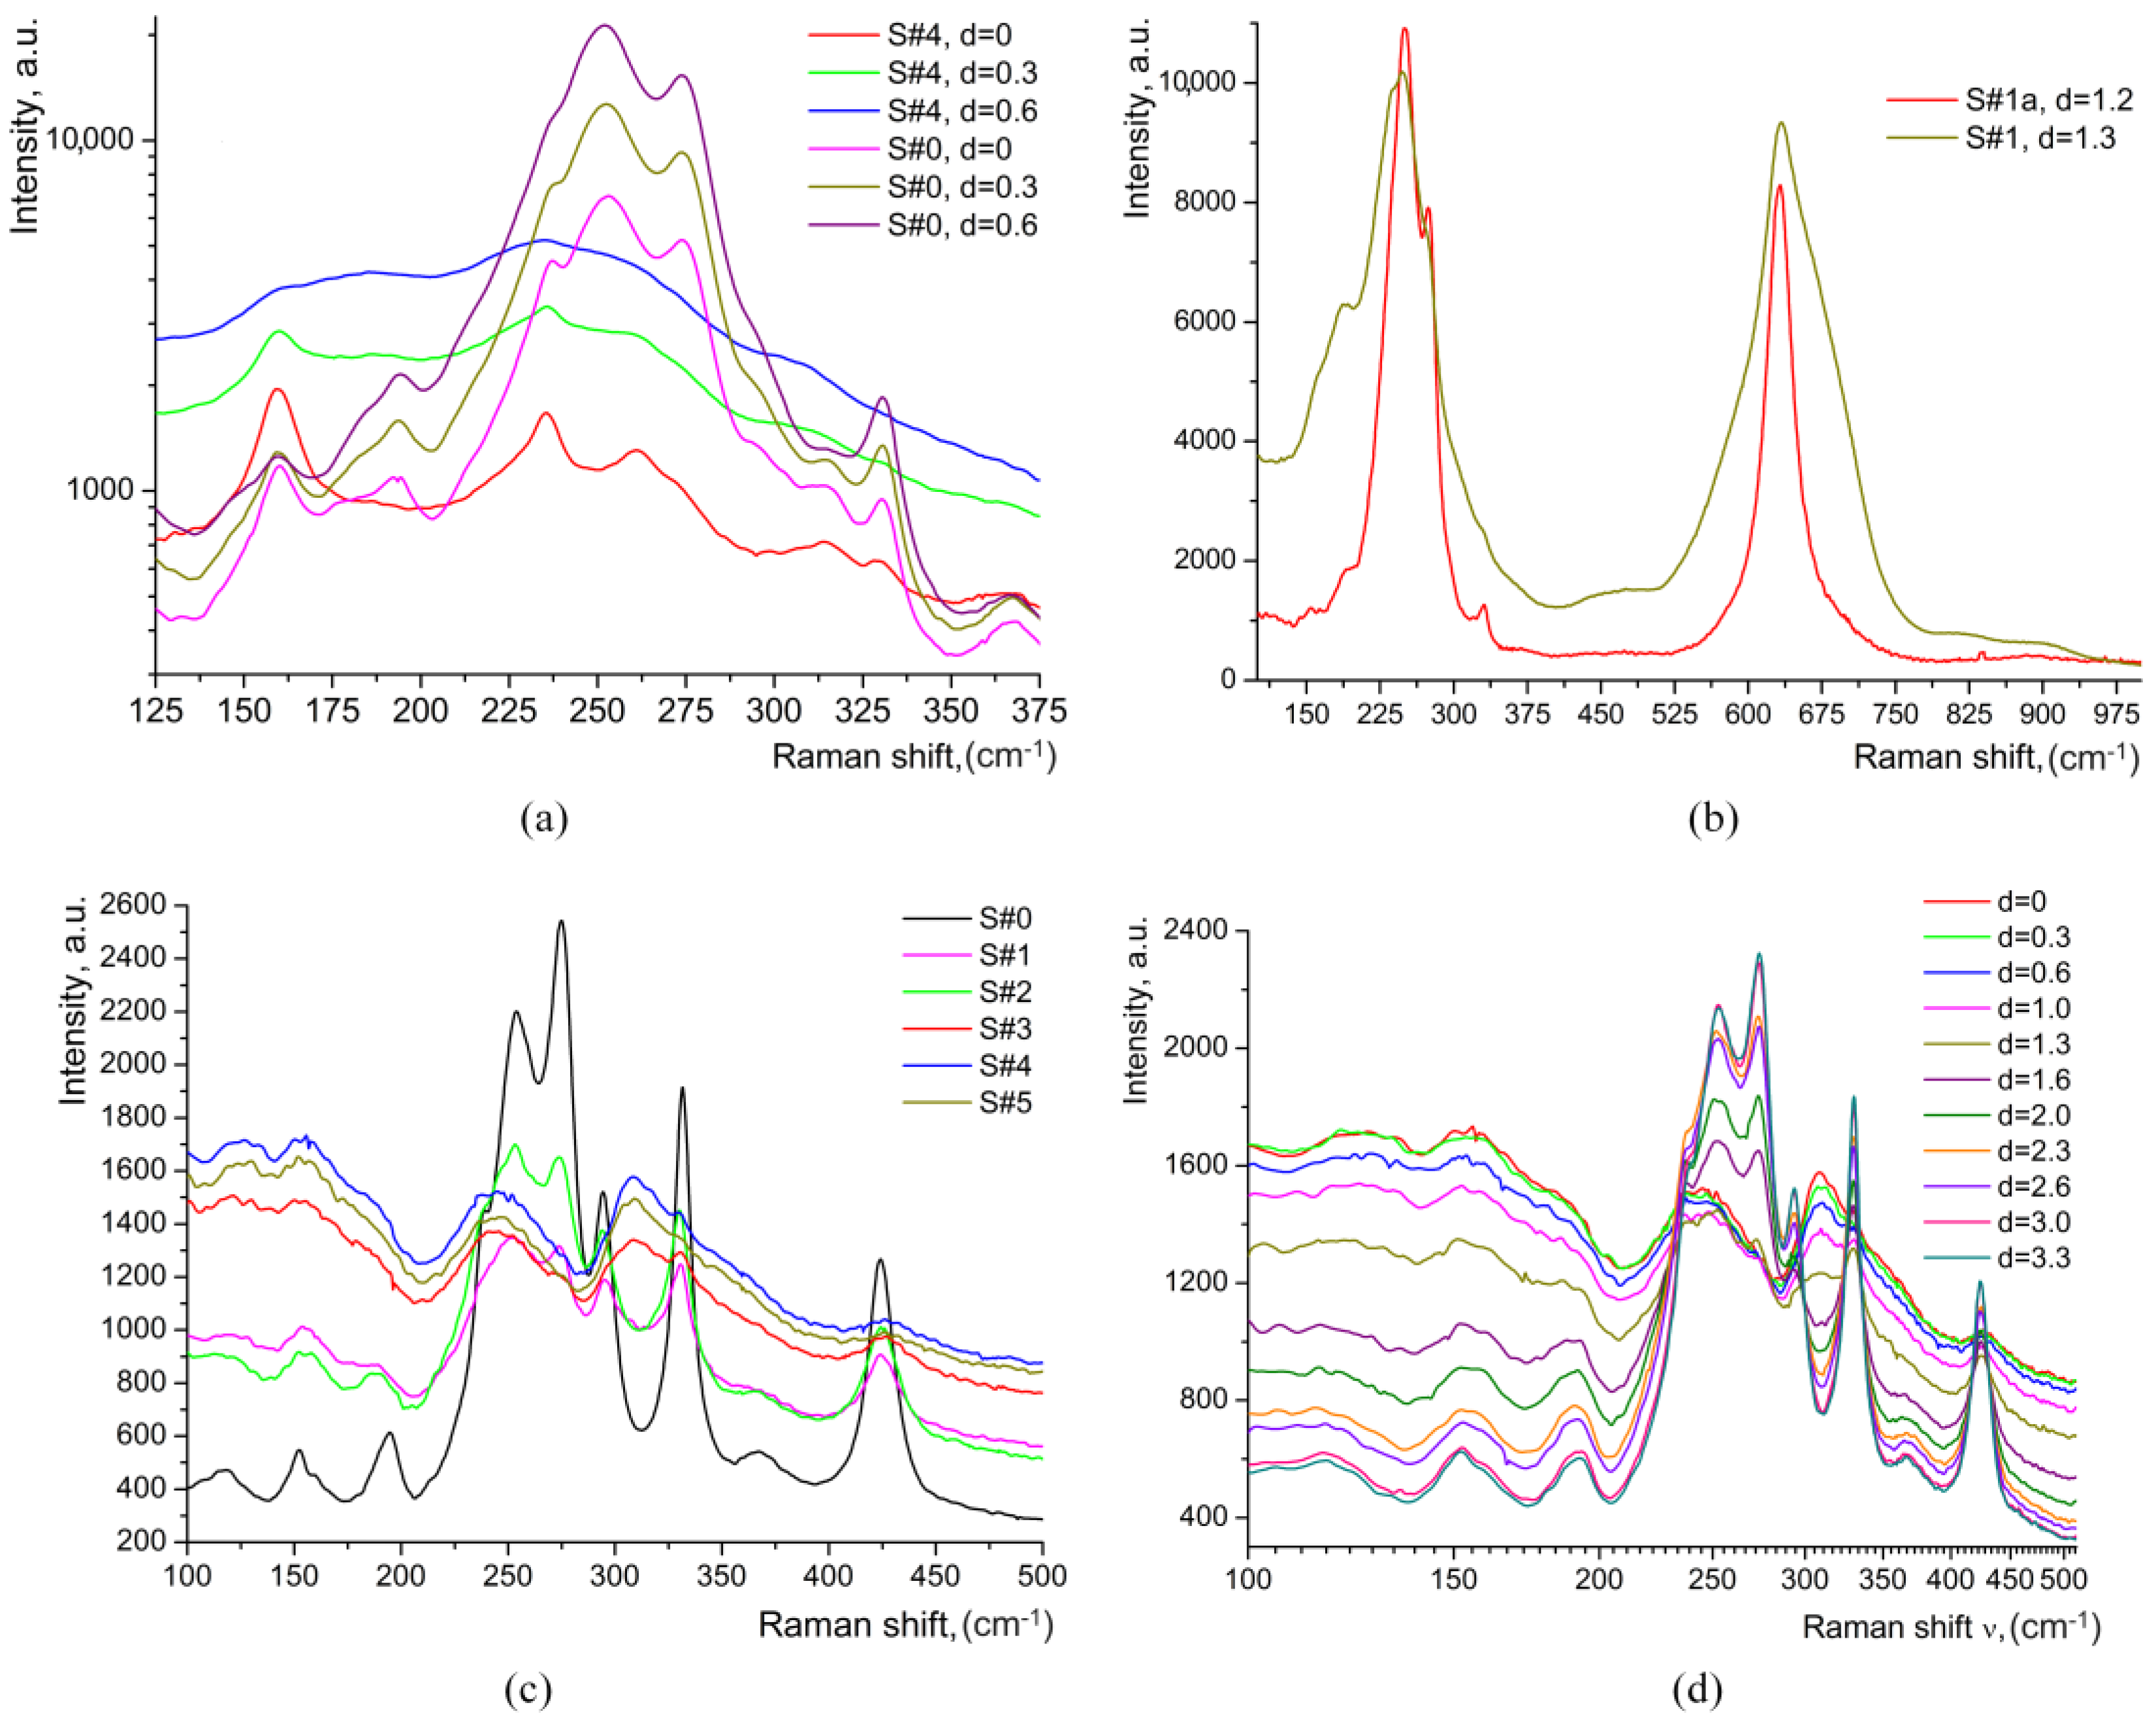
3.1. Raman Spectroscopy

The HiVac-VPE process induces the extra band (with intensity Ix) at 650–670 cm−1 and no band at 690 cm−1 in Raman spectra measured in the Y(ZZ)Y, Y(XX)Y, and Z(XX)Z geometries, as can be seen in Figure 4. These geometries were chosen to facilitate the study of all phonons with various symmetries (A1(TO), A1(LO), E(TO), and E(LO), respectively). Note that some spectra were recorded using a much smaller laser power by using a neutral density filter D = 1 instead of D = 0. This does not affect the shape and quality of the spectra but can reveal whether there is an influence of photorefractive effects on Raman spectra. In our experimental investigation, we did not identify any influence of photorefractive effects on Raman spectra.
For some samples, the decomposition of the Raman band was observed in the range of 500–800 cm−1, as presented in Figure 5.
It is worth noting that the “paraelectric band” at 690 cm−1 is a specific feature of the βi-phases [9,10,12,13,14,15,16]. For example, in Proton Exchange (PE) waveguides with βi-phases, the double peak (630 and 690 cm−1) is observed [9,12,13,14,17]. In APE waveguides after short-time annealing, the broad band centered with a maximum at 652–656 cm−1 and a broad shoulder at ~660–676 cm−1 is observed [9,10,12,13,14,17], similar to spectra of the investigated HiVac-VPE samples. These APE waveguides contain the κ2-phase in accordance with the previous findings [9,10,12,13].
In addition, the other “paraelectric bands” at about 136 and 214 cm−1, which are specifically linked to βi phases [13,14,17], are not observed in the Raman spectra of the HiVac-VPE waveguides, as can be seen in Figure 6.
Raman spectra measured in all studied geometries demonstrate the layered multiphase structure of the HiVac-VPE waveguides: the κ2-phase in a top sublayer (with the anomalous thin near-surface part), the α-phase in a depth-thick sublayer, and some phase in a transient thin sublayer placed between the κ2-phase sublayer and α-phase sublayer, respectively.
We conclude that a HiVac-VPE waveguiding layer contains a sublayer having different values of x (decreasing towards the substrate), i.e., presenting a different phase in addition to the k2 and α phases. It should be the k1-phase that, according to references [13,14], is almost indistinguishable spectroscopically from α-phase since positions of the Raman peaks are just the same, i.e., no qualitative difference between the spectra of α- and k1-phases. However, our study [9,15] has shown that there is a marked quantitative difference between these spectra. This difference is related to the intensity of the band at 645–656 cm−1. Thus, in our opinion, the Raman spectra observed for the HiVac-VPE waveguides are typical, depending on depth, for the κ2, κ1, and α phases only.
In order to compare our data with that reported in the literature [13], we denote the Raman intensity measured at 631–635 cm−1 as I630 and, respectively, as I690, the Raman intensity measured at 690 cm−1, independently of the result of decomposition of Raman spectra at 500–800 cm−1. The relation between Raman data (Figure 4 and Figure 5) and phase composition is given in Table 2.
Although not very precisely, this dependence repeats the form and width of the optical profile, i.e., the Raman depth profiling of the samples (see Table 3) agrees well with the data extracted from Figure 1 and from reference [1] on refractive index profiles obtained with the M-line method.
At this moment of our investigation, an extra study was performed in order to decide which of the two hypotheses suggested in reference [14] is valid: (i) the existence of a thin, very surface layer with a different structure, or (ii) an experimental artifact of Raman spectroscopy caused by the probing of the air–layer interface. Through low-frequency Raman scattering (LFRS) [28,29,30], we obtained evidence of significant structural disorder induced by proton exchange in all HiVac-VPE waveguides. The tail of the broad LFRS for all the waveguides strongly increases with increasing of HiVac-VPE exchange time, as shown in Figure 6a–c and Figure 7 below.
The intensity of LFRS at 100 cm−1 in the HiVac-VPE waveguides depends non-monotonously on depth d, as can be seen in Figure 8.
The strong and broad tail (extended up to 400–500 cm−1) of LFRS in the HiVac-VPE samples is similar to the LFRS in the strongly disordered media (e.g., glass) with order parameter within several tens of nanometers [28,29]. LFRS is also observed in Y(XX)Y geometry, as shown in Figure 7c,d.
After annealing of S#1 for 4 h, the bands associated with HiVac-VPE expand deeper into the S#1a sample (see Figure 4 and Figure 6). The Raman spectra are typical for the α-phase, as the extra bands specific for any κi and βi phases are not observed (Figure 4, Figure 5, and Figure 6, respectively). The depth of a layer with the changed Raman spectra is increased up to dα ≈ 9 μm (see Figure 4 and Figure 5) after annealing in comparison with dα ≈ 3.3 μm (Figure 4 and Figure 5) for the sample before annealing. LFRS is decreased after annealing, as can be seen in Figure 4, Figure 5 and Figure 8.
The existence of the E(TO)-bands (152, 236, 265, 325, and 582 cm−1) in the very surface spectra, as can be observed in Figure 3, Figure 4, Figure 5, and Figure 6, respectively, is related by us to an experimental artifact caused by the probing of the air–sample interface, according to the finding reported in reference [14]. At the same time, the anomalous attenuation of Raman intensities for A1(TO)-bands 253 and 630–637 cm−1 (comparative to S#0 sample) and for the extra HiVac-VPE-induced bands demonstrates the existence of a very surface thin layer (≤0.6 μm) with either a different structure [14], or with a large intrinsic stress [10].

3.2. IR Reflection Spectroscopy

It was established [9,10,11,19,20,21,31,32,33] that the hydrogen in LiNbO3 forms an OH complex with the oxygen of the crystal lattice. The presence of this complex, confirmed by the characteristic IR-active stretching vibration band at about 3500 cm−1, was clearly identified in HiVac-VPE waveguides, as can be seen in Figure 9.
It is worth noting that the frequency and shape of this band depend on the phase composition of the waveguide. Thus, measurement of the OH band in the IR reflection spectra can be used for evaluation of the phase composition [9,19,21]. It is worth noting that the comparison of IR reflection spectra measured at different angles (20°, 60°, and 80°) demonstrates the multilayered structure of waveguides, with the α-phase in the deeper part of the protonated layer. Since the photo-metered depth dIR (penetration depth of IR beam) depends on the angle of incidence θ, at smaller angles (closer to the normal incidence), deeper penetration takes place, and the spectra measurements are affected by the presence of the various phases forming the waveguiding layer. It was established [9,15,19,21] that at θ ≥ 70° the spectrum of the near-surface sublayer is separated from those of deeper situated sublayers in the multiphase waveguides. Thus, the cases when dIR is much smaller than the thickness of the HiVac-VPE protonated layer are shown in Figure 10c,d. Moreover, it is seen that the spectra measured at θ = 20° are close to the shape of the spectrum of the virgin sample (S#0), suggesting that the contribution of the α-phase is more significant than those at larger incidence angles.
For determination of the phase composition of waveguides, we also used the IR reflection spectroscopy data in the region of the lattice vibrations of the crystal (100–1100 cm−1), the results being represented in Figure 10.
A comparative analysis shows that there are significant differences between the basic parameters of these spectra for different HxLi1−xNbO3 phases [9,11,19,21]. Thus, the proton exchange leads to the appearance of new phonons in the lattice vibration spectrum. This indicates both a change in the chemical bond parameters and the appearance of new chemical bonds. Thus, in the IR reflectance spectra of the studied HiVac-VPE waveguides, we observe additional bands in the range of 960–1050 cm−1 [9,15,19,21], which are absent in the spectrum of the virgin niobate crystal as depicted in Figure 9. The frequencies of these additional bands coincide with the characteristic frequencies of the librational vibrations [18] of the OH groups detected by Raman spectroscopy methods in rutile crystals [34]. This fact, together with the presence of a characteristic dependence of their frequencies on the proton concentration, allows us to assign all components of the additional bands to librational vibrations of OH groups at different lattice positions and ordered by means of weak hydrogen bonds of different lengths. These new bands observed at 970 and 965 cm−1 in the IR reflection spectra for all HiVac-VPE waveguides studied are presented in Figure 10. These OH-libration bands were assigned to the κ2-phase and to both the κ1-phase and α-phase because the κ1-phase and α-phase have the same frequency for this band in Raman spectra, respectively [13,14,19,21]. The bands at 975 cm−1 and 980 cm−1 attributed to β1, β2, and β3 phases [21] are not observed in the IR reflection spectra of HiVac-VPE waveguides. The new bands at 800–900 cm−1, which are specific for βi phases, are also not observed. Therefore, no βi phase exists in all investigated HiVac-VPE waveguides, according to the existing literature [9,11,21].
The frequencies of optical phonons can be determined from the position of the inflection points on the spectral dependence of the reflection coefficient R. For accurate determination of the frequencies of the inflection points, it is convenient to use the spectral dependence of the first derivative of the reflection coefficient with respect to the wavenumber dR/dν [9,15]. In this case, the maxima on the dR/dν curve correspond to the frequencies of TO phonons, while the minima correspond to the frequencies of LO phonons, as depicted in Figure 11.
The first derivative spectra for the OH-libration band at 950–970 cm−1 are similar for all the HiVac-VPE samples and show a slight gradual change (Figure 11), in contrast to PE/APE and SPE samples reported by the literature [9,15,21].

3.3. IR Absorption Spectroscopy

The absorbance curves in Figure 12 imply the existence of three OH bands around 3500 cm−1, characteristic of the presence of substitutional protons, and a very wide band with a maximum at about 3300 cm−1, due to the presence of interstitial protons, which are randomly distributed in the lattice.
A very weak broad band centered at 3240–3300 cm−1 is observed in the IR absorption spectra of all the samples. Such a small intensity (peak value of optical density D) of this OH-band at 3280 cm−1 in IR absorption spectra is clear evidence of the absence of βi-phases in the HiVac-VPE waveguides. This band has a significant intensity in IR absorption spectra of PE waveguides with the βi-phase, as reported in the literature [9,11,15].
The decomposition of IR absorption spectra gives the three main components for the stretching of the OH-band at about 3466–3470 cm−1, 3481–3488 cm−1, and 3508–3510 cm−1, as shown in Figure 13. Three bands in the region of OH stretching vibrations are indicated on the LN crystal stoichiometry (CLN in our case), and the α phase of HxLi1−xNbO3 is within the range of 3466–3490 cm−1. The bands within the range of 3496–3520 cm−1 indicate the presence of κ1, κ2, and βi phases of HxLi1−xNbO3 [6,10,11,19,21].
Analysis of 1st and 2nd derivatives confirms the presence of such components of the OH-stretching band and demonstrates the existence of the extra component at 3496–3498 cm−1. The high-frequency component (3508–3510 cm−1) at the decomposition of the OH-band may be related to the highly protonated κ2-phase, as the βi-phases have the specific component at a higher frequency ≥ 3512 cm−1 as reported in the literature [9,12,15,18]. It is important to note that integral intensity I (I =D(ν)dν) and Dmax of the OH-band demonstrate a non-monotonous dependence on √t. After annealing for 4 h, the bands associated with the κ2-phase are not observed in the spectra of the S#1a sample depicted in Figure 12 and Figure 13, respectively. Note that the IR absorption spectra of the annealed S#1a waveguide are typical for α-phase only [9,13,14,15].

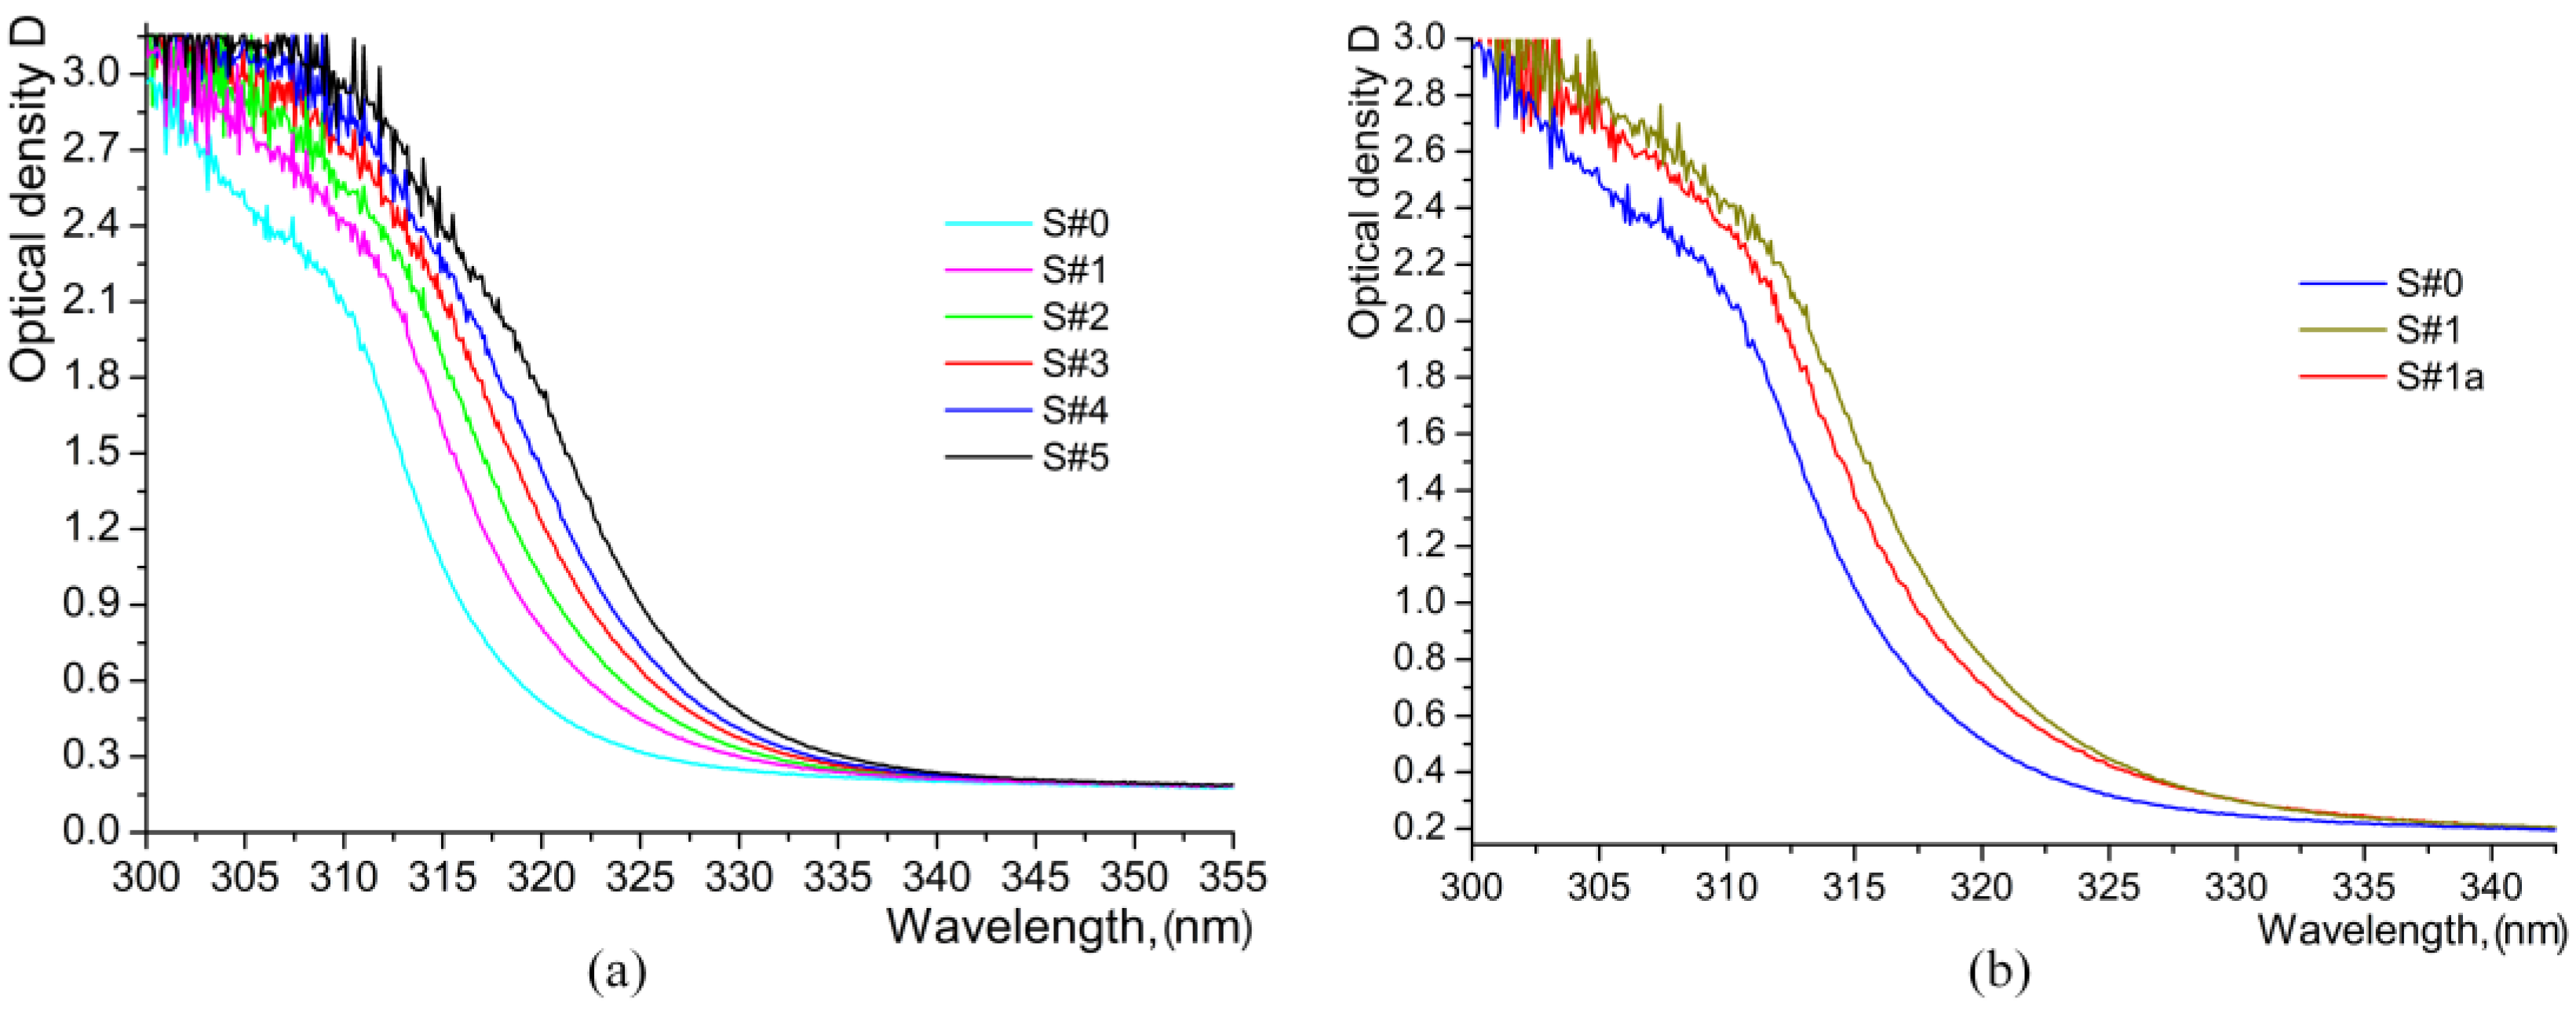
3.4. UV-VIS Absorption

The proton exchange leads to a decrease in spontaneous polarization P0 and the magnitude of such a decrease ΔP0 is specific for different HxLi1−xNbO3 phases [9,15,16,17,18,19,24,33,35]. A correlation has been observed between the change in spontaneous polarization P0 and the shift of the fundamental absorption edge, i.e., the change in the bandgap ΔEg [9,36,37]. The connection between P0 and ΔEg can be obtained by expanding Eg in a power series with respect to P0 [36] as below:
Δ E g = Δ P 0 a P 0 + b 3 P 0 + c 5 P 0 a Δ P 0 P 0
where the coefficient a is proportional to the square of the electron–phonon coupling constant. According to the experimental data, a = 0.35 eV·m4/K2, i.e., even a small change in P0 can cause an appreciable shift in the fundamental absorption band edge in the spectrum of LiNbO3, where P0 = 0.71 K/m2 [35,36]. Thus, we can determine the polarization Pn = P0 − ΔP0 for any n phase, using data on the change of bandgap ΔEg, which is calculated directly from the observed shift of the fundamental absorption edge [33].
We need to consider that the spontaneous polarization decreases additionally as the packing density of the crystal η increases; η is defined as the ratio of the number of ions per unit volume of the studied crystal to their number per unit volume of the perovskite crystal:
η = ρ x ρ p M p M x
where ρ is the density, M is the molecular weight of a formula unit, and the subscripts x and p refer to the studied crystal and the crystal of the “ideal” perovskite, respectively. For example, η0 = 1.2 for LiNbO3, η = 1.0 for BaTiO3, ηn = 1.24 for the β3-phase of HxLi1−xNbO3, where x ≈ 0.7 [16,33,35].
Thus, any change in spontaneous polarization causes a Δ E g = Δ P 0 a P 0 + b 3 P 0 + c 5 P 0 a Δ P 0 P 0 change in the electro-optic coefficient r13, which can be calculated from the polarization-induced change in the bandgap energy ΔEg,n:
r 13 , n = r 13 , n r 13 , 0 = η 0 η n 3 1 + Δ E g , n a P 0 2
where r13,n, ηn, and ΔEg,n are the values of the parameters in the studied n-phase; r13,0 and η0 are the parameters in LiNbO3, r13,n is the normalized value of r13,n in the n-phase.
Comparison of the spectra of samples containing HiVac-VPE waveguides with the spectrum of the pure lithium niobate indicates a marked shift in the wavelength of the fundamental absorption band edge λg, as depicted in Figure 14.
The absorption coefficient α was calculated from the transmittance spectra at room temperature [38] using the relation:
T = 1 R 2 exp α d
where T is transmittance, R is reflectivity (calculated from Sellmeier’s equation), and d is the sample thickness. With the definition of optical density D = lgT−1, the following equations are obtained:
α = D + 2 lg 1 R d log e 1 D = α d lg e 2 lg 1 R
For HiVac-VPE CLN samples, the UV absorption edge shifts toward a higher wavelength in comparison to virgin crystal (S#0 sample), as can be observed from Figure 14. The specific wavelengths related to the so-called “apparent edge” [38] were measured at D = 1.0. The specific wavelengths related to the so-called “absorption edge (AE)” [38] were determined for each sample at 20 cm−1 of absorption coefficient α. According to Equation (6), D = 1.0 corresponds to α = 37.8 cm−1, and α = 20 cm−1 corresponds to D = 0.62.
The direct bandgap energy Egd was evaluated from the plot of α2 versus (α2 versus 1/λ). Near the band edge, the density of state can be approximated by the parabolic band, and the absorption spectra are given by [38]:
α h ν h ν E g d 1 2
The abrupt rise of the absorption (α2) with incident photon energy near the band edge depicts the photon absorption due to direct allowed inter-band transition. The intercept of the straight line at the energy axis (α = 0) yields direct optical band gap (Eg) energy.
UV-VIS absorption spectra, i.e., a band gap energy Eg evaluated from these spectra, demonstrate no marked contribution of any βi-phase. Note that Eg values for the HiVac-VPE samples, Figure 14 and Table 4 below, are lower than Eg values typical for κ2-phase in APE and SPE waveguides [9,15].
However, it significantly overcomes the values typical for the βi-phases in PE, HTPE, and SPE waveguides [9,15]. The value of bandgap energy Eg for the S#1 sample evaluated from UV absorption spectra near AE is significantly smaller than the values for the other samples. It is caused by the overlap of the absorption spectrum of the thin sublayer of κ2-phase with the spectra of the thicker sublayers of κ1 and α phases. The reduced values of electro-optic (EO) coefficients for HiVac-VPE waveguides are expected from UV-VIS spectra (evaluated with Eg values, Table 4). However, much smaller values are expected from the Raman spectra, as the intensity of the band at ~253 cm−1 is strongly attenuated within the main part of these waveguides (Figure 5). The band at ~630 cm−1 is also attenuated and strongly overlapped with the more intensive bands at 645–670 cm−1 in Raman spectra of κ2-phase (Figure 4 and Figure 5). It is established [17] that the main contributors to EO coefficients are the A1(TO) bands observed at ~253 cm−1 and ~630 cm−1. The nonlinear optical properties are also related to these bands. Consequently, an attenuation of their intensity is associated with the decrease of EO and NLO properties upon proton exchange. In addition, the actual effective values of EO coefficients may be significantly smaller than the values presented in Table 4 due to a structural disorder similar to APE and SPE waveguides [15,39].
According to the previous findings reported by literature [9,15,33], the UV-VIS data on the direct bandgap energy show that the annealed S#1a waveguide should contain the κ1-phase (Table 4 and Figure 14). However, IR absorption, IR reflection, and Raman spectra are typical for α-phase. Thus, we assume that the annealed S#1a waveguides contain the highly protonated α-phase, which has the anomalously high value of ΔEg. It may be regarded as an important peculiarity of the HiVac-VPE process. It means that the post-HiVac-VPE annealing can be used to produce high-quality waveguides containing only the α-phase.

4. Conclusions

In this article, we investigate the phase composition, depth profile, and electro-optic properties of waveguides fabricated using the HiVac-VPE technique through optical spectroscopy methods such as Raman spectroscopy, IR reflection, IR absorption, and UV-VIS absorption. Each phase of HxLi1−xNbO3 exhibits a distinct spectrum, enabling the identification of interesting and unique information on the waveguides under study.
Raman spectra measured in all studied geometries demonstrate the layered multiphase structure of the HiVac-VPE waveguides: the κ2-phase in a top sublayer (with the anomalous thin near-surface part), the α-phase in a depth-thick sublayer, and some phase in a transient thin sublayer placed between the κ2-phase sublayer and α-phase sublayer, respectively. Through low-frequency Raman scattering (LFRS), we obtained evidence of significant structural disorder induced by proton exchange in all HiVac-VPE waveguides. The tail of the broad LFRS for all waveguides strongly increases with increasing HiVac-VPE exchange time.
The IR reflection spectra of the studied HiVac-VPE waveguides show additional bands that are absent in the spectrum of the virgin niobate crystal. The frequencies of these additional bands coincide with the characteristic frequencies of the librational vibrations of the OH groups detected by Raman spectroscopy methods in other crystals. This fact, together with the presence of a characteristic dependence of their frequencies on the proton concentration, allows us to assign all components of the additional bands to librational vibrations of OH groups at different lattice positions and ordered by means of weak hydrogen bonds of different lengths. These OH-libration bands were assigned to the κ2-phase and to both the κ1-phase and α-phase because the κ1-phase and α-phase have the same frequency for this band in Raman spectra, respectively. The bands attributed to βi are not observed in the IR reflection spectra of all investigated HiVac-VPE waveguides.
Based on experimental data on the shift of the fundamental absorption edge, we have quantitatively estimated the electro-optic coefficient r13. Electro-optical properties of the HiVac-VPE waveguides have been found to be dependent on the phase composition.
In addition, the post-HiVac-VPE annealing process allowed the fabrication of waveguides containing highly protonated α-phase only.
In our investigation, we have obtained interesting results that have not yet been reported, allowing us to gain insight into the origin of the optical features of the recently reported HiVac-VPE waveguides compared to those manufactured through already known and extensively used proton exchange techniques within the scientific community.
Given the peculiarity of HiVac-VPE waveguides, they hold the potential for fabricating photonic nonlinear devices and electro-optic modulators based on high-index contrast waveguides in the LiNbO3 platform.

Author Contributions

Conceptualization, S.T.; methodology, S.T.; software, O.S. and I.C.; validation, A.P.R., S.K., V.F., O.S. and I.C.; formal analysis, A.P.R., S.K., V.F. and S.T.; investigation, A.P.R., O.S. and I.C.; writing—original draft preparation, S.K. and S.T.; writing—review and editing, A.P.R. and S.T.; funding acquisition, S.T. All authors have read and agreed to the published version of the manuscript.

Funding

This work was supported by a grant from the Romanian Ministry of Education and Research, CNCS—UEFISCDI, Project number PN-III-P4-ID-PCE-2020-0239, Contract number PCE 142/2021, within PNCDI III.

Institutional Review Board Statement

Not applicable.

Informed Consent Statement

Not applicable.

Data Availability Statement

The raw data supporting the conclusions of this article will be made available by the authors on request.

Conflicts of Interest

Author Sergey Kostritskii and Vyacheslav Fedorov was employed by the company RPC Optolink. The remaining authors declare that the research was conducted in the absence of any commercial or financial relationships that could be construed as a potential conflict of interest.

References

  1. Rambu, A.P.; Apetrei, A.M.; Doutre, F.; Tronche, H.; Tiron, V.; De Micheli, M.; Tascu, S. Lithium niobate waveguides with high-index contrast and preserved nonlinearity fabricated by high vacuum vapor-phase proton exchange. Photonics Res. 2020, 8, 8–16. [Google Scholar] [CrossRef]
  2. Rambu, A.P.; Apetrei, A.M.; Tascu, S. Role of the high vacuum in the precise control of index contrasts and index profiles of LiNbO3 waveguides fabricated by high vacuum proton exchange. Opt. Laser Technol. 2019, 118, 109–114. [Google Scholar] [CrossRef]
  3. Rambu, A.P.; Apetrei, A.M.; Doutre, F.; Tronche, H.; De Micheli, M.; Tascu, S. Analysis of High-Index Contrast Lithium Niobate Waveguides Fabricated by High Vacuum Proton Exchange. J. Light. Technol. 2018, 36, 2675–2684. [Google Scholar] [CrossRef]
  4. Lenzini, F.; Kasture, S.; Haylock, B.; Lobino, M. Anisotropic model for the fabrication of annealed and reverse proton exchanged waveguides in congruent lithium niobate. Opt. Express 2015, 23, 1748–1756. [Google Scholar] [CrossRef] [PubMed]
  5. Nikolopoulos, J.; Yip, G.L. Theoretical modeling and characterization of annealed proton-exchanged planar waveguides in z-cut LiNbO3. J. Light. Technol. 1991, 9, 864–870. [Google Scholar] [CrossRef]
  6. Passaro, A.; Franco, M.A.R.; Abe, N.M.; Sircilli, F. The effect of the proton-concentration-to-refractive-index models on the propagation properties of APE waveguides. J. Light. Technol. 2002, 20, 1573–1577. [Google Scholar] [CrossRef]
  7. De Almeida, J.M.M. Design methodology of annealed H+ waveguides in ferroelectric LiNbO3. Opt. Eng. 2007, 46, 064601. [Google Scholar] [CrossRef]
  8. Vohra, S.T.; Mickelson, A.R.; Asher, S.E. Diffusion characteristics and waveguiding properties of proton-exchanged and annealed LiNbO3 channel waveguides. J. Appl. Phys. 1989, 66, 5161–5174. [Google Scholar] [CrossRef]
  9. Kostritskii, S.M.; Korkishko, Y.N.; Fedorov, V.A.; Sevostyanov, O.G.; Chirkova, I.M. Raman Spectra and Electro-Optic Properties of Proton-Exchanged Channel Waveguides in Lithium Niobate Crystals; SibRaman Seminar IAE: Novosibirsk, Russia, 2015. [Google Scholar]
  10. Kuneva, M.; Tonchev, S.; Gorgorov, R. Approaches in Characterization of Li1−xHxNbO3 Optical Waveguide Layers. In Advances in Microelectronics: Reviews; International Frequency Sensor Association Publishing: Barcelona, Spain, 2019; pp. 183–220. [Google Scholar]
  11. Kuneva, M.; Tonchev, S. Spectroscopy of optical waveguiding layers. Bulg. Chem. Commun. 2011, 43, 276–287. [Google Scholar]
  12. Savatinova, I.; Tonchev, S.; Liarokapis, E.; Armenise, M.N.; Armenise, M. Evidence of different β-phases in highly protonated z-cut H:LiNbO3 waveguides by Raman scattering. Appl. Phys. A 1999, 68, 483–487. [Google Scholar] [CrossRef]
  13. Savova, I.; Savatinova, I.; Liarokapis, E. Phase composition of Z-cut protonated LiNbO3: A Raman study. Opt. Mater. 2001, 16, 353–360. [Google Scholar] [CrossRef]
  14. Savova, I.; Savatinova, I.; Kircheva, P.; Liarokapis, E. Raman characterization of H:LiNbO3 waveguides. Appl. Phys. B 2001, 73, 565–568. [Google Scholar] [CrossRef]
  15. Kostritskii, S.M.; Korkishko, Y.N.; Fedorov, V.A.; Mitrokhin, V.P.; Sevostyanov, O.G.; Chirkova, I.M.; De Micheli, M.; Stepanenko, O. Subsurface disorder and electro-optical properties of proton-exchanged LiNbO3 waveguides produced by different techniques. J. Eur. Opt. Soc. 2014, 9, 14055. [Google Scholar] [CrossRef]
  16. Kostritskii, S.M.; Rodnov, S.V.; Korkishko, Y.N.; Fedorov, V.A.; Sevostyanov, O.G. Electro-optical properties of different HxLi1-xNbO3 phases in proton-exchanged LiNbO3 waveguides. Ferroelectrics 2012, 440, 47–56. [Google Scholar] [CrossRef]
  17. Paz-Pujalt, G.R.; Tuschel, D.D.; Braunstein, G.; Blanton, T.; Tong Lee, S.; Salter, L.M. Characterization of proton exchange lithium niobate waveguides. J. Appl. Phys. 1994, 76, 3981–3987. [Google Scholar] [CrossRef]
  18. Fu, Y.-L.; Wu, Y.-C.; Yuan, Y.F.; Chen, B.X. Raman spectra of proton-exchanged LiNbO3 optical waveguides. Chin. Phys. Lett. 2004, 21, 1292–1293. [Google Scholar]
  19. Korkishko, Y.N.; Fedorov, V.A.; Kostritskii, S.M. Optical and X-ray characterization of HxLi1−xNbO3 phases in proton-exchanged LiNbO3 optical waveguides. J. Appl. Phys. 1998, 84, 2411–2419. [Google Scholar] [CrossRef]
  20. Korkishko, Y.N.; Fedorov, V.A. Relationship between refractive indices and hydrogen concentration in proton exchanged LiNbO3 waveguides. J. Appl. Phys. 1997, 82, 1010–1017. [Google Scholar] [CrossRef]
  21. Kuneva, M. Surface phase detection of proton-exchanged layers in LiNbO3 and LiTaO3 by IR reflection spectroscopy. Bulg. Chem. Commun. 2013, 45, 474–478. [Google Scholar]
  22. Rong, S.; Wen, X.; Ding, N.; Liao, J.; Hua, P. X-Cut Lithium Niobate Optical Waveguide with High-Index Contrast and Low Loss Fabricated by Vapor Proton Exchange. Photonics 2023, 10, 1390. [Google Scholar] [CrossRef]
  23. Yasemin Aşık, F.; Gökkavas, M.; Öztekin, E.; Karagöz, E.; Ceylan, A.; Özbay, E. Optimization of the annealed proton exchange method with controlled annealing for multifunctional integrated optical chip production. Appl. Opt. 2022, 61, 8898–8903. [Google Scholar] [CrossRef] [PubMed]
  24. Kuneva, M.; Tonchev, S.; Christova, K. Phase Composition and Stress in Proton Exchanged Waveguide Layers in LiNbO3 and LiTaO3. In Newest Updates in Physical Science Research; BP International: New York, NY, USA, 2021; pp. 140–151. [Google Scholar]
  25. Stepanenko, O.; Quillier, E.; Tronche, H.; Baldi, P.; De Micheli, M. Crystallographic and Optical Properties of Z-Cut High Index Soft Proton Exchange (HISoPE) LiNbO3 Waveguides. J. Light. Technol. 2016, 34, 2206–2212. [Google Scholar] [CrossRef]
  26. Bazzan, M.; Sada, C. Optical waveguides in lithium niobate: Recent developments and applications. Appl. Phys. Rev. 2015, 2, 040603. [Google Scholar] [CrossRef]
  27. Stepanenko, O.; Quillier, E.; Tronche, H.; Baldi, P.; De Micheli, M. Highly confining proton exchanged waveguides on Z-cut LiNbO3 with preserved nonlinear coefficient. IEEE Photon. Technol. Lett. 2014, 26, 1557–1560. [Google Scholar] [CrossRef]
  28. Surovtsev, N.V.; Pugachev, A.M.; Malinovsky, V.K.; Shebanin, A.P.; Kojima, S. Low-frequency Raman spectra in LiNbO3: Within and beyond the standard paradigm of ferroelectric dynamics. Phys. Rev. B 2005, 72, 104303. [Google Scholar] [CrossRef]
  29. Kalampounias, A. Low-frequency Raman scattering in alkali tellurite glasses. Bull. Mater. Sci. 2008, 31, 781–785. [Google Scholar] [CrossRef]
  30. Anikiev, A.A.; Umarov, M.F.; Scott, J.F. Processing and characterization of improved congruent lithium niobate. AIP Adv. 2018, 8, 115016. [Google Scholar] [CrossRef]
  31. Passaro, V.M.N.; Armenise, M.N.; Nesheva, D.; Savatinova, I.T.; Pun, E.Y.B. LiNbO3 Optical Waveguides Formed in a New Proton Source. J. Light. Technol. 2002, 20, 71–77. [Google Scholar] [CrossRef]
  32. Korkishko, Y.N.; Fedorov, V.A.; Baranov, E.A.; Proyaeva, M.V.; Morozova, T.V.; Caccavale, F.; Segato, F.; Sada, C.; Kostritskii, S.M. Characterization of α-phase soft proton-exchanged LiNbO3 optical waveguides. J. Opt. Soc. Am. A 2001, 18, 1186–1191. [Google Scholar] [CrossRef] [PubMed]
  33. Kostritskii, S.M.; Korkishko, Y.N.; Fedorov, V.A.; Proyaeva, M.V.; Baranov, E.A. Spontaneous polarization and nonlinear susceptibility in various protonated HxLi1−xNbO3 phases. Tech. Phys. 2002, 47, 74–79. [Google Scholar] [CrossRef]
  34. Bates, J.B.; Wang, J.C.; Perkins, R.A. Mechanisms for hydrogen diffusion in TiO2. Phys. Rev. B 1979, 19, 4130–4137. [Google Scholar] [CrossRef]
  35. Ahlfeldt, H.; Webjorn, J.; Thomas, P.A.; Teat, S.J. Structural and optical properties of annealed proton-exchanged waveguides in z-cut LiTaO3. J. Appl. Phys. 1995, 77, 4467–4476. [Google Scholar] [CrossRef]
  36. Fridkin, V.M.; Kochev, K.D.; Kusminov, Y.S.; Verkhovskaya, K.A.; Volk, T.R. The shift of the optical absorption edge at “optical damage” in LiNbO3. Phys. Status Solidi A 1976, 33, K137–K139. [Google Scholar] [CrossRef]
  37. Di Domenico, M.; Wemple, S.H. Oxygen-octahedra ferroelectrics. I. Theory of electro-optical and nonlinear optical effects. J. Appl. Phys. 1969, 40, 720–732. [Google Scholar] [CrossRef]
  38. Bhatt, R.; Bhaumik, I.; Ganesamoorthy, S.; Karnal, A.K.; Swami, M.K.; Patel, H.S.; Gupta, P.K. Urbach tail and bandgap analysis in near stoichiometric LiNbO3 crystals. Phys. Status Solidi A 2012, 209, 176–180. [Google Scholar] [CrossRef]
  39. Mendez, A.; de la Paliza, G.; García-Cabañes, A.; Cabrera, J.M. Comparison of the electro-optic coefficient r33 in well-defined phases of proton exchanged LiNbO3 waveguides. Appl. Phys. B 2001, 73, 485–488. [Google Scholar] [CrossRef]
Figure 1. Index profiles of Z-cut HiVacPE waveguides fabricated for different exchange durations. The symbols represent the measured Neff of the propagating modes, except those on the ordinate that represent the IWKB corrected surface indices obtained by using the method detailed in references [1,3].
Materials 17 02249 g001
Figure 2. Geometry of HiVac-VPE waveguides as prepared for spectroscopic investigation. Protonated and bare CLN substrate was mirror-grade polished on a lateral face.
Materials 17 02249 g002
Figure 3. Index profiles of S#1a sample annealed at Tanneal = 360 °C for 4 h. The symbols represent the measured Neff,anneal of the propagating modes, except the ones on the ordinate that represent IWKB-calculated surface indices.
Materials 17 02249 g003
Figure 4. Raman spectra of HiVac-VPE waveguides measured within a range 500–800 cm−1: (a) Spectra of all samples measured at d = 1.3 μm; (b) Spectra of the S#3 sample measured at different values of d; (c) Spectra of the S#1 sample measured at different values of d; (d) Spectra of the annealed S#1a sample measured at different values of d. In this case, the laser power was much smaller in comparison with the measurements shown in (ac). In addition, the integration time is decreased 5 times. The spectra were obtained step by step while the laser beam was crossing the polished edge (Y-cut, see Figure 2) of a sample from the surface towards the substrate. Polarization geometry was Y(ZZ)Y.
Materials 17 02249 g004
Figure 5. Decomposition of the Raman band observed at 500–800 cm−1 in some studied samples: (a) S#0 for d = 0 μm, elementary bands are 589.7 and 631.5 cm−1; (b) S#1 for d = 0 μm, elementary bands are 593.1, 636.9, and 665.3 cm−1; (c) S#3 for d = 1.6 μm, elementary bands are 594.1, 635.9, and 673.8 cm−1.
Materials 17 02249 g005
Figure 6. Raman spectra of the HiVac-VPE waveguides measured within the range of 100–400 cm−1: (a) Spectra of all samples measured at d = 1.3 μm; (b) Spectra of the S#3 measured at different values of d; (c) Spectra of the S#1 sample measured at different values of d; (d) Spectra of the S#1a measured for a near-surface part of the waveguide at different values of d; (e) Spectra of the S#1a measured for a depth part of waveguide at different values of d. Note that for the measurements shown in (d,e), the laser power was much lower than the measurements shown in (ac). The polarization geometry was Y(ZZ)Y.
Materials 17 02249 g006
Figure 7. Low-frequency Raman scattering (LFRS) spectra measured in different samples: (a) for a very surface layer of the virgin S#0 sample and S#4 waveguide; (b) S#1 and S#1a waveguides, spectra measured at d = 1.2–1.3 μm. Spectra of S#1a waveguide were normalized to the spectra S#1 at 1000 cm−1 (polarization geometry was Y(ZZ)Y for the spectra (a,b)); (c) Spectra of all the samples measured with polarization geometry Y(XX)Y; (d) Spectra of S#4 waveguide measured at different values of d with polarization geometry Y(XX)Y.
Materials 17 02249 g007
Figure 8. Low-frequency Raman scattering (LFRS) ratio versus d: (a) For all as-exchanged waveguides; (b) For S#1a (annealed S#1 waveguide). LFRS were measured in Y(ZZ)Y geometry. LFRS ratio is Ix/(IS#0Ibg) at ν = 100 cm−1 for various d. Ibg denotes the background intensity for the Raman spectra of the S#0 sample.
Materials 17 02249 g008
Figure 9. IR reflection spectra measured within the stretching vibration of OH-band at θ = 80° from a main Z-cut surface of a waveguide: (a) IR reflection spectra for all samples; (b) 1st derivative of IR reflection spectra of all samples; (c) IR reflection spectra for S#0, S#1, and S#1a; (d) 1st derivative of IR reflection spectra of S#1 and S#1a.
Materials 17 02249 g009
Figure 10. IR reflection spectra of all HiVac-VPE waveguides measured at different θ within the lattice vibration range: (a) θ = 20°; (b) θ = 60°; (c) θ = 80°; (d) IR reflection spectra of S#1 sample comparative to annealed S#1a and virgin S#0 samples measured at θ = 80°.
Materials 17 02249 g010
Figure 11. The 1st derivative of IR reflection spectra measured at θ = 80°: (a) for all HiVac-VPE samples (corresponding to the spectra shown in Figure 10c); (b) for the S#1 sample comparative to annealed S#1a and virgin S#0 (corresponding to the spectra shown in Figure 10d).
Materials 17 02249 g011
Figure 12. IR absorption spectra of all HiVac-VPE samples: (a) measured in the range of 3100–3600 cm−1; (b) measured in the range of 3420–3580 cm−1; (c) IR absorption spectrum of S#1 sample in comparison with the spectrum of as-annealed S#1a sample.
Materials 17 02249 g012
Figure 13. Gaussian fit and decomposition of OH-band at 3400–3500 cm−1 in IR absorption spectra of (a) S#3 sample; (b) S#1a sample.
Materials 17 02249 g013
Figure 14. UV-VIS absorption spectra: (a) all HiVac-VPE exchanged samples; (b) S#1 sample comparative to as-annealed S#1a and virgin S#0 samples.
Materials 17 02249 g014
Table 1. Index contrast ∆ne at λ = 632.8 nm of planar waveguides fabricated by the HiVac-VPE process.
SampleExchange Duration t(h)Δne
S#11 h0.1014
S#22 h0.1027
S#33 h0.1031
S#44 h0.1033
S#55 h0.1034
Table 2. References on Raman spectra parameters vs. HxLi1−xNbO3 phase. I690 and I630 are intensities measured at 630 and 690 cm−1 in raw Raman spectra without decomposition of the band on elementary components in accordance with reference [13].
PhaseI690/I630 [13]I690/(I630 + I690) [13]I690/(I630 + I690) [9]νx(cm−1) [9]
κ10.43 ÷ 0.580.31 ÷ 0.370.19 ÷ 0.30645 ÷ 654
κ20.72 ÷ 0.790.42 ÷ 0.460.34 ÷ 0.46657 ÷ 669
β10.96 ÷ 1.100.48 ÷ 0.520.48 ÷ 0.52687.5
β21.230.550.55687.5
β3 and β41.640.620.62690
Table 3. Depth for sublayer boundaries for different phases. The duration of the HiVac-VPE process is denoted by t.
Samplet (h)dk2/dk1/dα (μm)
(m-Lines Data [1])
Plateau in Plot I690/(I630 + I690)
vs. t
dk2 (μm)dk1 (μm)dα (μm)
S#110.62/1.1/3.31.31.62.33.3
S#1a1 and 4 h
(annealing)
----≈9.0
S#221.78/2.1/4.41.762.32.64.3
S#332.30/3.5/6.62.392.63.05.0
S#442.80/4.0/6.62.713.64.36.0
S#553.30/4.6/10.93.293.64.3>8.0
Table 4. The data on apparent edge, absorption edge (AE), bandgap energy shift ΔEg,n, and the normalized values of the electro-optic coefficient r13,n′ evaluated from ΔEg,n. Bandgap energy shift ΔEg,n = Eg,nEg,0 is bandgap shift induced by proton exchange in a n-sample; Eg,0 is bandgap energy in a virgin CLN (S#0 sample); Eg,n is bandgap energy in a n-th sample; r13,n are values of the electro-optic coefficient, that were evaluated from ΔEg,n.
SampleApparent Edge (nm)AE (nm)Eg,n (eV)ΔEg,n (eV)r13,n
S#0315.30318.553.93601
S#1a317.20321.053.908 ÷ 3.914−(0.022 ÷ 0.028)0.76 ÷ 0.79
S#1318.33322.103.887 ÷ 3.893−(0.043 ÷ 0.049)0.66 ÷ 0.69
S#2320.04323.803.873 ÷ 3.877−(0.059 ÷ 0.063)0.58 ÷ 0.60
S#3321.60325.253.854 ÷ 3.858−(0.078 ÷ 0.082)0.48 ÷ 0.50
S#4322.67326.373.838 ÷ 3.842−(0.094 ÷ 0.098)0.40 ÷ 0.42
S#5324.30327.853.830 ÷ 3.834−(0.102 ÷ 0.106)0.36 ÷ 0.38
Disclaimer/Publisher’s Note: The statements, opinions and data contained in all publications are solely those of the individual author(s) and contributor(s) and not of MDPI and/or the editor(s). MDPI and/or the editor(s) disclaim responsibility for any injury to people or property resulting from any ideas, methods, instructions or products referred to in the content.

