
Effect of Steel Slag on Hydration Kinetics and Rheological Properties of Alkali-Activated Slag Materials: A Comparative Study with Fly Ash
Abstract
:1. Introduction
2. Materials and Methods
2.1. Raw Materials
2.2. Mix Proportions
2.3. Test Methods
3. Results and Discussion
3.1. Hydration Heat
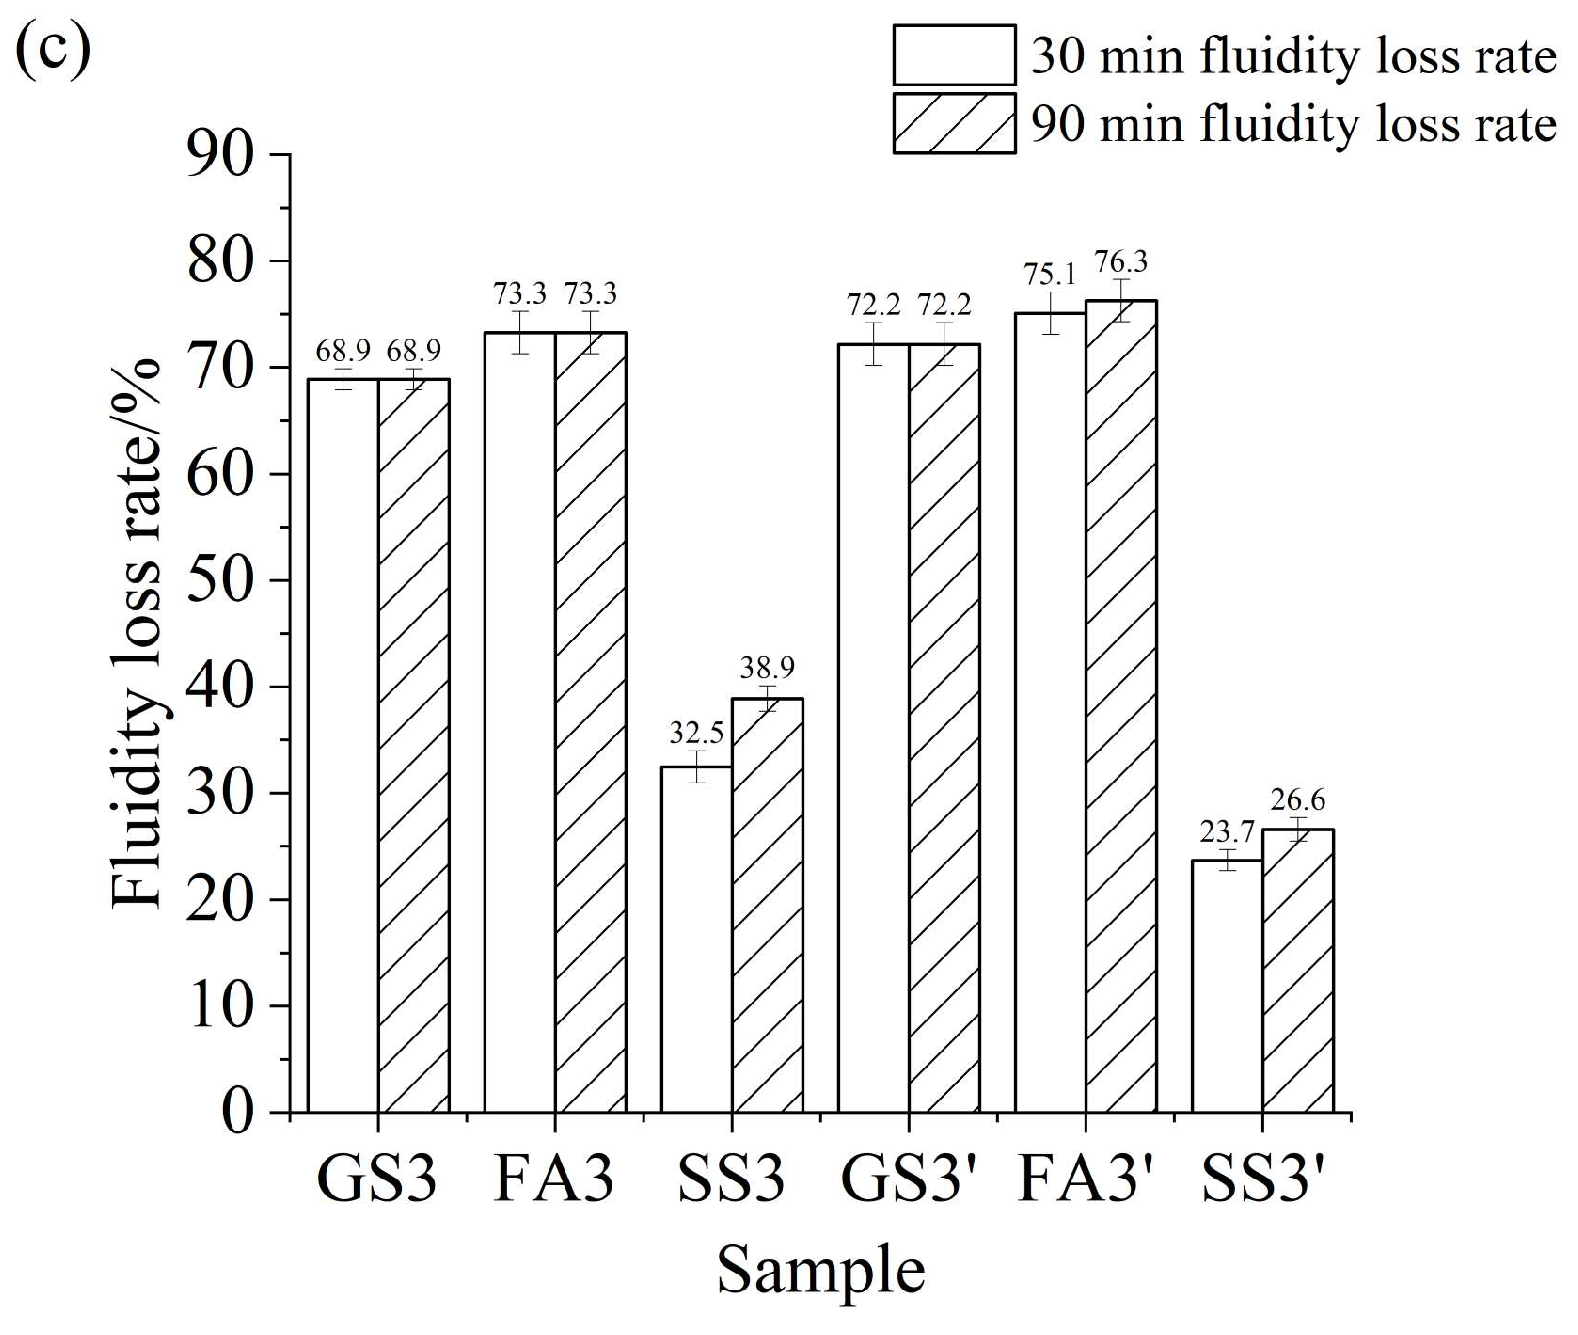
3.2. Fluidity
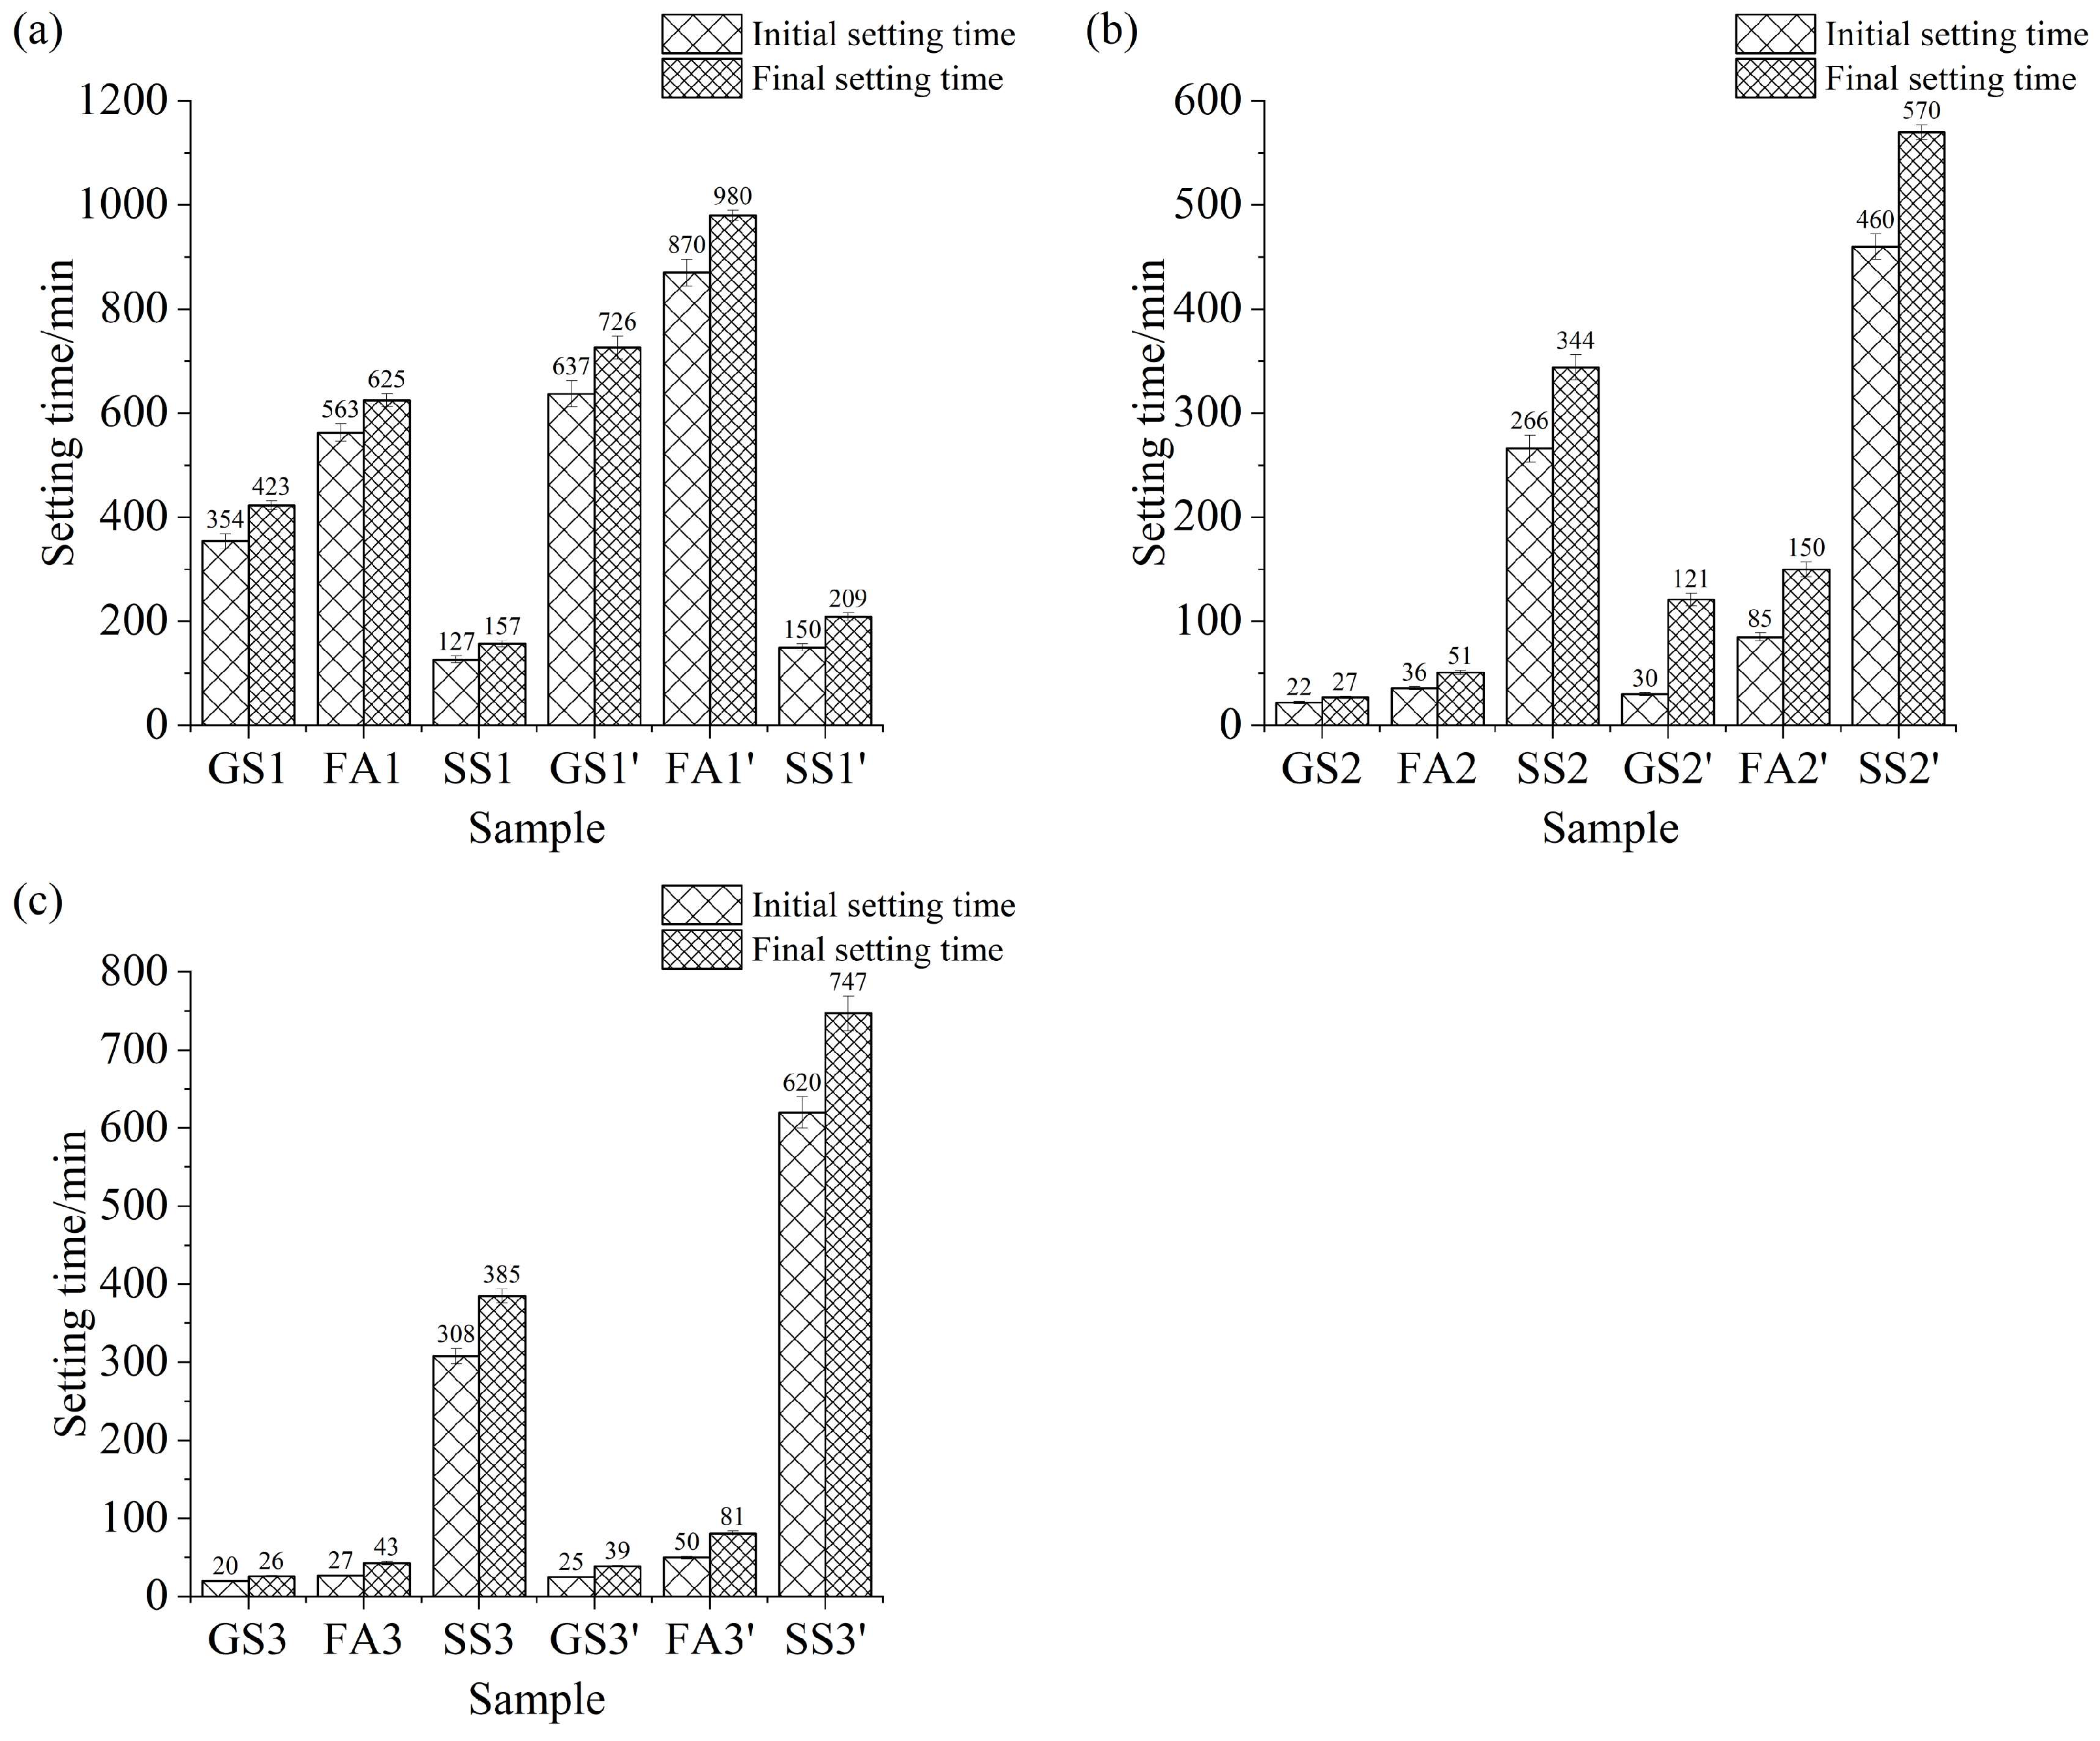
3.3. Setting Time
3.4. Rheological Properties
4. Conclusions
Author Contributions
Funding
Institutional Review Board Statement
Informed Consent Statement
Data Availability Statement
Acknowledgments
Conflicts of Interest
References
- Abdalqader, A.F.; Jin, F.; Al-Tabbaa, A. Development of greener alkali-activated cement: Utilisation of sodium carbonate for activating slag and fly ash mixtures. J. Clean. Prod. 2016, 113, 66–75. [Google Scholar] [CrossRef]
- Abdalqader, A.; Jin, F.; Al-Tabbaa, A. Performance of magnesia-modified sodium carbonate-activated slag/fly ash concrete. Cem. Concr. Compos. 2019, 103, 160–174. [Google Scholar] [CrossRef]
- Zhang, Y.; Schlangen, E.; Çopuroğlu, O. Effect of slags of different origins and the role of sulfur in slag on the hydration characteristics of cement-slag systems. Constr. Build. Mater. 2022, 316, 125266. [Google Scholar] [CrossRef]
- Hany, E.; Fouad, N.; Abdel-Wahab, M.; Sadek, E. Compressive strength of mortars incorporating alkali-activated materials as partial or full replacement of cement. Constr. Build. Mater. 2020, 261, 120518. [Google Scholar] [CrossRef]
- Ababneh, A.; Matalkah, F.; Aqel, R. Synthesis of kaolin-based alkali-activated cement: Carbon footprint, cost and energy assessment. J. Mater. Res. Technol. 2020, 9, 8367–8378. [Google Scholar] [CrossRef]
- Ramagiri, K.K.; Kar, A. Environmental impact assessment of alkali-activated mortar with waste precursors and activators. J. Build. Eng. 2021, 44, 103391. [Google Scholar] [CrossRef]
- Zhu, Y.; Wan, X.; Han, X.; Ren, J.; Luo, J.; Yu, Q. Solidification of chloride ions in alkali-activated slag. Constr. Build. Mater. 2022, 320, 126219. [Google Scholar] [CrossRef]
- Zhang, J.; Shi, C.; Zhang, Z.; Hu, X. Reaction mechanism of sulfate attack on alkali-activated slag/fly ash cements. Constr. Build. Mater. 2022, 318, 126052. [Google Scholar] [CrossRef]
- Sarıdemir, M.; Bulut, M.; Akça, U. Effects of different curing conditions on the long-term properties of alkali activated GBP + GBFS mortars exposed to high temperatures. Constr. Build. Mater. 2022, 321, 125732. [Google Scholar] [CrossRef]
- Salami, B.A.; Ibrahim, M.; Algaifi, H.A.; Alimi, W.; Ewebajo, A.O. A review on the durability performance of alkali-activated binders subjected to chloride-bearing environment. Constr. Build. Mater. 2022, 317, 125947. [Google Scholar] [CrossRef]
- Athira, V.S.; Bahurudeen, A.; Saljas, M.; Jayachandran, K. Influence of different curing methods on mechanical and durability properties of alkali activated binders. Constr. Build. Mater. 2021, 299, 123963. [Google Scholar] [CrossRef]
- Zhang, P.; Muhammad, F.; Yu, L.; Xia, M.; Lin, H.; Huang, X.; Jiao, B.; Shiau, Y.; Li, D. Self-cementation solidification of heavy metals in lead-zinc smelting slag through alkali-activated materials. Constr. Build. Mater. 2020, 249, 118756. [Google Scholar] [CrossRef]
- Sun, Y.; Ghorbani, S.; Dai, X.; Ye, G.; Schutter, G.D. Evaluation of rheology and strength development of alkali-activated slag with different silicates sources. Cem. Concr. Compos. 2022, 128, 104415. [Google Scholar] [CrossRef]
- Xue, C.; Sirivivatnanon, V.; Nezhad, A.; Zhao, Q. Comparisons of alkali-activated binder concrete (ABC) with OPC concrete—A review. Cem. Concr. Compos. 2023, 135, 104851. [Google Scholar] [CrossRef]
- Su, T.; Zhou, Y.; Wang, Q. Recent advances in chemical admixtures for improving the workability of alkali-activated slag-based material systems. Constr. Build. Mater. 2021, 272, 121647. [Google Scholar]
- Jiang, H.; Qi, Z.; Yilmaz, E.; Han, J.; Qiu, J.; Dong, C. Effectiveness of alkali-activated slag as alternative binder on workability and early age compressive strength of cemented paste backfills. Constr. Build. Mater. 2019, 218, 689–700. [Google Scholar] [CrossRef]
- Jiang, D.; Shi, C.; Zhang, Z. Recent progress in understanding setting and hardening of alkali-activated slag (AAS) materials. Cem. Concr. Compos. 2022, 134, 104795. [Google Scholar] [CrossRef]
- Jiang, T.; Jin, Y.; Ye, H. Correlating slag chemistry to setting and mechanical behaviors of alkali-activated slag. Constr. Build. Mater. 2022, 338, 127661. [Google Scholar] [CrossRef]
- Zhu, X.; Zhang, M.; Yang, K.; Yu, L.; Yang, C. Setting behaviours and early-age microstructures of alkali-activated ground granulated blast furnace slag (GGBS) from different regions in China. Cem. Concr. Compos. 2020, 114, 103782. [Google Scholar] [CrossRef]
- Nedunuri, A.S.S.S.; Muhammad, S. Fundamental understanding of the setting behaviour of the alkali activated binders based on ground granulated blast furnace slag and fly ash. Constr. Build. Mater. 2021, 291, 123243. [Google Scholar] [CrossRef]
- Alnahhal, M.F.; Kim, T.; Hajimohammadi, A. Distinctive rheological and temporal viscoelastic behaviour of alkali-activated fly ash/slag pastes: A comparative study with cement paste. Cem. Concr. Res. 2021, 144, 106441. [Google Scholar] [CrossRef]
- Sun, B.; Sun, Y.; Ye, G.; Schutter, G.D. A mix design methodology of slag and fly ash-based alkali-activated paste. Cem. Concr. Compos. 2022, 126, 104368. [Google Scholar] [CrossRef]
- Palacios, M.; Alonso, M.M.; Varga, C.; Puertas, F. Influence of the alkaline solution and temperature on the rheology and reactivity of alkali-activated fly ash pastes. Cem. Concr. Compos. 2019, 95, 277–284. [Google Scholar] [CrossRef]
- Martins, A.C.P.; Carvalho, J.M.F.; Costa, L.C.B.; Andrade, H.D.; Melo, T.V.; Ribeiro, J.C.L.; Pedroti, L.G.; Peixoto, R.A.F. Steel slags in cement-based composites: An ultimate review on characterization, applications and performance. Constr. Build. Mater. 2021, 291, 123265. [Google Scholar] [CrossRef]
- Sun, J.; Zhang, Z.; Zhuang, S.; He, W. Hydration properties and microstructure characteristics of alkali–activated steel slag. Constr. Build. Mater. 2020, 241, 118141. [Google Scholar] [CrossRef]
- Liu, Z.; Zhang, D.; Li, L.; Wang, J.; Shao, N.; Wang, D. Microstructure and phase evolution of alkali-activated steel slag during early age. Constr. Build. Mater. 2019, 204, 158–165. [Google Scholar] [CrossRef]
- You, N.; Li, B.; Cao, R.; Shi, J.; Chen, C.; Zhang, Y. The influence of steel slag and ferronickel slag on the properties of alkali-activated slag mortar. Constr. Build. Mater. 2019, 227, 116614. [Google Scholar] [CrossRef]
- Chen, Y.; Zhou, X.; Wan, S.; Zheng, R.; Tong, J.; Hou, H.; Wang, T. Synthesis and characterization of geopolymer composites based on gasification coal fly ash and steel slag. Constr. Build. Mater. 2019, 211, 646–658. [Google Scholar] [CrossRef]
- Faraj, R.H.; Sherwani, A.F.H.; Jafer, L.H.; Ibrahim, D.F. Rheological behavior and fresh properties of self-compacting high strength concrete containing recycled PP particles with fly ash and silica fume blended. J. Build. Eng. 2021, 34, 101667. [Google Scholar] [CrossRef]
- Jiao, D.; Shi, C.; Yuan, Q.; An, X.; Liu, Y.; Li, H. Effect of constituents on rheological properties of fresh concrete—A review. Cem. Concr. Compos. 2017, 83, 146–159. [Google Scholar] [CrossRef]
- Kolawole, J.T.; Boshoff, W.P.; Babafemi, A.J.; Combrinck, R. Shear and viscoelastic properties of early-age concrete using small-amplitude and low-rate rheometry—From fresh state to initial set. Cem. Concr. Compos. 2021, 124, 104223. [Google Scholar] [CrossRef]
- Zhou, Y.; Pu, S.; Han, F.; Zhang, Z. Effect of ultrafine slag on hydration heat and rheology properties of Portland cement paste. Powder Technol. 2022, 405, 117549. [Google Scholar] [CrossRef]
- Feys, D.; Wallevik, J.E.; Yahia, A.; Khayat, K.H.; Wallevik, O.H. Extension of the Reiner–Riwlin equation to determine modified Bingham parameters measured in coaxial cylinders rheometers. Mater. Struct. 2013, 46, 289–311. [Google Scholar] [CrossRef]
- Lu, C.; Zhang, Z.; Shi, C.; Li, N.; Jiao, D.; Yuan, Q. Rheology of alkali-activated materials: A review. Cem. Concr. Compos. 2021, 121, 104061. [Google Scholar] [CrossRef]
- Liu, Y.; Shi, C.; Yuan, Q.; An, X.; Jiao, D.; Zhu, L.; Khayat, K.H. An amendment of rotation speed-torque transformation equation for the Herschel-Bulkley model in wide-gap coaxial cylinders rheometer. Constr. Build. Mater. 2020, 237, 117530. [Google Scholar] [CrossRef]
- Jiao, D.; Shi, C.; Yuan, Q.; Zhu, D.; Schutter, G.D. Effects of rotational shearing on rheological behavior of fresh mortar with short glass fiber. Constr. Build. Mater. 2019, 203, 314–321. [Google Scholar] [CrossRef]
- Fu, Q.; Bu, M.; Zhang, Z.; Xu, W.; Yuan, Q.; Niu, D. Hydration Characteristics and Microstructure of Alkali-Activated Slag Concrete: A Review. Engineering 2023, 20, 162–179. [Google Scholar] [CrossRef]
- Sun, Y.; Liu, Z.; Ghorbani, S.; Ye, G.; Schutter, G.D. Fresh and hardened properties of alkali-activated slag concrete: The effect of fly ash as a supplementary precursor. J. Clean. Prod. 2022, 370, 133362. [Google Scholar] [CrossRef] [PubMed]
- Sun, J.; Chen, Z. Effect of silicate modulus of water glass on the hydration of alkali-activated converter steel slag. J. Therm. Anal. Calorim. 2019, 138, 47–56. [Google Scholar] [CrossRef]
- Haha, M.B.; Lothenbach, B.; Saout, G.L.; Winnefeld, F. Influence of slag chemistry on the hydration of alkali-activated blast-furnace slag—Part II: Effect of Al2O3. Cem. Concr. Res. 2012, 42, 74–83. [Google Scholar] [CrossRef]
- Cao, R.; Zhang, S.; Banthia, N.; Zhang, Y.; Zhang, Z. Interpreting the early-age reaction process of alkali-activated slag by using combined embedded ultrasonic measurement, thermal analysis, XRD, FTIR and SEM. Compos. B Eng. 2020, 186, 107840. [Google Scholar] [CrossRef]
- Sheng, K.; Li, D.; Yuan, X. Methyl orange assisted dispersion of graphene oxide in the alkaline environment for improving mechanical properties and fluidity of ordinary portland cement composites. J. Build. Eng. 2021, 43, 103166. [Google Scholar] [CrossRef]
- Yang, T.; Zhu, H.; Zhang, Z.; Gao, X.; Zhang, C.; Wu, Q. Effect of fly ash microsphere on the rheology and microstructure of alkali-activated fly ash/slag pastes. Cem. Concr. Res. 2018, 109, 198–207. [Google Scholar] [CrossRef]
- Jing, R.; Liu, Y.; Yan, P. Uncovering the effect of fly ash cenospheres on the macroscopic properties and microstructure of ultra high-performance concrete (UHPC). Constr. Build. Mater. 2021, 286, 122977. [Google Scholar] [CrossRef]
- Zhao, J.; Li, S. Study on processability, compressive strength, drying shrinkage and evolution mechanisms of microstructures of alkali-activated slag-glass powder cementitious material. Constr. Build. Mater. 2022, 344, 128196. [Google Scholar] [CrossRef]
- Tian, Y.; Yang, C.; Yuan, S.; Yuan, H.; Yang, K.; Yu, L.; Zhang, M.; Zhu, X. Understanding the rheological properties of alkali-activated slag pastes from the cohesion and friction interactions. Constr. Build. Mater. 2021, 291, 123311. [Google Scholar] [CrossRef]
- Sun, Y.; Zhang, S.; Rahul, A.V.; Tao, Y.; Bockstaele, F.V.; Dewettinck, K.; Ye, G.; Schutter, G.D. Rheology of alkali-activated slag pastes: New insight from microstructural investigations by cryo-SEM. Cem. Concr. Res. 2022, 157, 106806. [Google Scholar] [CrossRef]
- Bentz, D.P.; Ferraris, C.F.; Galler, M.A.; Hansen, A.S.; Guynn, J.M. Influence of particle size distributions on yield stress and viscosity of cement–fly ash pastes. Cem. Concr. Res. 2012, 42, 404–409. [Google Scholar] [CrossRef]
- Puertas, F.; Varga, C.; Alonso, M.M. Rheology of alkali-activated slag pastes. Effect of the nature and concentration of the activating solution. Cem. Concr. Compos. 2014, 53, 279–288. [Google Scholar] [CrossRef]
- Yuan, Q.; Huang, Y.; Huang, T.; Yao, H.; Wu, Q. Effect of activator on rheological properties of alkali-activated slag-fly ash pastes. J. Cent. South Univ. 2022, 29, 282–295. [Google Scholar] [CrossRef]


| Chemical Compositions | SiO2 | Al2O3 | Fe2O3 | CaO | MgO | SO3 | Na2Oeq | LOI | Others |
|---|---|---|---|---|---|---|---|---|---|
| Slag | 35.55 | 15.36 | 0.45 | 33.94 | 11.16 | 1.95 | 0.63 | 0.70 | 0.96 |
| FA | 57.60 | 21.90 | 7.70 | 3.87 | 1.68 | 0.41 | 4.05 | 0.43 | 2.79 |
| SS | 12.77 | 2.12 | 23.49 | 49.17 | 3.54 | 0.23 | 0.45 | 1.86 | 8.23 |
| Sample | Slag | SS | FA | Ms | w/b Ratio |
|---|---|---|---|---|---|
| GS1(GS1′) | 100 | 0 | 0 | 0.5 | 0.4(0.5) |
| GS2(GS2′) | 100 | 0 | 0 | 1.0 | |
| GS3(GS3′) | 100 | 0 | 0 | 1.5 | |
| SS1(SS1′) | 50 | 50 | 0 | 0.5 | |
| SS2(SS2′) | 50 | 50 | 0 | 1.0 | |
| SS3(SS3′) | 50 | 50 | 0 | 1.5 | |
| FA1(FA1′) | 50 | 0 | 50 | 0.5 | |
| FA2(FA2′) | 50 | 0 | 50 | 1.0 | |
| FA3(FA3′) | 50 | 0 | 50 | 1.5 |
| Sample | Hydration Time/(min) | |||||
|---|---|---|---|---|---|---|
| 5 | 60 | 120 | ||||
| τ0/(Pa) | μ/(Pa·s) | τ0/(Pa) | μ/(Pa·s) | τ0/(Pa) | μ/(Pa·s) | |
| GS1 | 33.34 ± 1.47 | 1.26 ± 0.03 | 34.07 ± 1.2 | 1.56 ± 0.58 | 40.26 ± 1.56 | 1.428 ± 0.05 |
| FA1 | 7.98 ± 0.32 | 0.65 ± 0.02 | 8.43 ± 0.21 | 0.70 ± 0.02 | 10.37 ± 0.21 | 0.73 ± 0.02 |
| SS1 | 19.47 ± 0.86 | 0.67 ± 0.02 | 28.67 ± 1.02 | 0.71 ± 0.02 | 40.26 ± 1.52 | 0.66 ± 0.02 |
| GS2 | 123.11 ± 6.02 | 1.42 ± 0.05 | - | - | - | - |
| FA2 | 10.05 ± 0.42 | 0.75 ± 0.02 | 54.88 ± 1.62 | 1.25 ± 0.03 | 49.97 ± 1.68 | 1.24 ± 0.04 |
| SS2 | 20.20 ± 0.88 | 0.64 ± 0.02 | 37.64 ± 1.23 | 0.95 ± 0.02 | 42.29 ± 1.67 | 1.00 ± 0.03 |
| GS3 | 227.12 ± 8.23 | 1.31 ± 0.04 | - | - | - | - |
| FA3 | 18.24 ± 0.85 | 0.67 ± 0.02 | - | - | - | - |
| SS3 | 111.09 ± 4.86 | 0.67 ± 0.02 | 229.97 ± 8.68 | 1.54 ± 0.04 | 223.76 ± 9.86 | 3.11 ± 0.10 |
| Sample | Hydration Time/(min) | |||||
|---|---|---|---|---|---|---|
| 5 | 60 | 120 | ||||
| τ0/(Pa) | μ/(Pa·s) | τ0/(Pa) | μ/(Pa·s) | τ0/(Pa) | μ/(Pa·s) | |
| GS1’ | 4.31 ± 0.14 | 0.39 ± 0.01 | 7.52 ± 0.23 | 0.45 ± 0.01 | 8.13 ± 0.26 | 0.44 ± 0.01 |
| FA1’ | 1.59 ± 0.05 | 0.15 ± 0.005 | 3.99 ± 0.12 | 0.14 ± 0.006 | 5.06 ± 0.22 | 0.15 ± 0.006 |
| SS1’ | 2.59 ± 0.88 | 0.19 ± 0.006 | 7.21 ± 0.23 | 0.23 ± 0.01 | 11.57 ± 0.36 | 0.27 ± 0.01 |
| GS2’ | 4.70 ± 0.12 | 0.51 ± 0.01 | 30.64 ± 1.22 | 1.66 ± 0.06 | 38.21 ± 1.05 | 1.89 ± 0.06 |
| FA2’ | 1.70 ± 0.06 | 0.16 ± 0.006 | 8.85 ± 0.24 | 0.92 ± 0.03 | 9.04 ± 0.28 | 1.14 ± 0.03 |
| SS2’ | 2.87 ± 0.11 | 0.24 ± 0.01 | 8.80 ± 0.26 | 0.53 ± 0.01 | 12.36 ± 0.42 | 0.59 ± 0.01 |
| GS3’ | 19.14 ± 0.82 | 0.37 ± 0.01 | - | - | - | - |
| FA3’ | 3.32 ± 0.12 | 0.16 ± 0.006 | 75.99 ± 2.68 | 1.02 ± 0.03 | 79.97 ± 2.52 | 1.06 ± 0.03 |
| SS3’ | 3.92 ± 0.12 | 0.28 ± 0.01 | 22.01 ± 0.89 | 1.04 ± 0.03 | 25.25 ± 0.86 | 1.23 ± 0.04 |
Disclaimer/Publisher’s Note: The statements, opinions and data contained in all publications are solely those of the individual author(s) and contributor(s) and not of MDPI and/or the editor(s). MDPI and/or the editor(s) disclaim responsibility for any injury to people or property resulting from any ideas, methods, instructions or products referred to in the content. |
© 2024 by the authors. Licensee MDPI, Basel, Switzerland. This article is an open access article distributed under the terms and conditions of the Creative Commons Attribution (CC BY) license (https://creativecommons.org/licenses/by/4.0/).
Share and Cite
Han, F.; Zhu, Z.; Zhang, H.; Li, Y.; Fu, T. Effect of Steel Slag on Hydration Kinetics and Rheological Properties of Alkali-Activated Slag Materials: A Comparative Study with Fly Ash. Materials 2024, 17, 2260. https://doi.org/10.3390/ma17102260
Han F, Zhu Z, Zhang H, Li Y, Fu T. Effect of Steel Slag on Hydration Kinetics and Rheological Properties of Alkali-Activated Slag Materials: A Comparative Study with Fly Ash. Materials. 2024; 17(10):2260. https://doi.org/10.3390/ma17102260
Chicago/Turabian StyleHan, Fanghui, Ziqin Zhu, Hongbo Zhang, Yuchen Li, and Ting Fu. 2024. "Effect of Steel Slag on Hydration Kinetics and Rheological Properties of Alkali-Activated Slag Materials: A Comparative Study with Fly Ash" Materials 17, no. 10: 2260. https://doi.org/10.3390/ma17102260