Article

Environmental Restoration and Changes of Sediment and Hydrodynamic Parameters in a Section of a Renaturalised Lowland Watercourse

1
Department of Hydraulic and Sanitary Engineering, Poznań University of Life Sciences, Piątkowska 94, 60-649 Poznań, Poland
2
Department of Ecology and Environmental Protection, Poznań University of Life Sciences, Piątkowska 94, 60-649 Poznań, Poland
*
Authors to whom correspondence should be addressed.
Sustainability 2024, 16(10), 3948; https://doi.org/10.3390/su16103948
Submission received: 3 April 2024 / Revised: 29 April 2024 / Accepted: 6 May 2024 / Published: 8 May 2024

Abstract

:
In Europe, the routes of most watercourses were straightened and shortened, leading to the destruction and degradation of many natural environments. Currently, in places where it is possible, as part of the implementation of the Water Framework Directive, efforts are made to improve environmental sustainability, including improving the ecological condition of rivers. This paper presents the impact of three in-stream deflectors on changes in the section of a small lowland river—the Flinta (Poland)—where (from 2018 to 2023) detailed, systematic geodetic, and hydrometric research and an assessment of the ecological conditions were carried out. The presented results show the influence of deflectors on the initiation of fluvial processes in the transverse and longitudinal layouts of the channel. The river channel was narrowed from 6 to 5 m, and the current line shifted by almost 3 m. Changes were observed in the distribution of velocities and shear stresses, varying along the surveyed section of the river. In the first year after their application, an increase in velocity at the deflectors can be observed (from 0.2 m∙s−1 to 0.6 m∙s−1 in the deflector cross-section). In the following years, on the other hand, a clear decrease in velocity was observed in the sections between the deflectors (to 0.3 m∙s−1). The introduction of deflectors resulted in a significant increase in the values of shear stresses (from an average value of 0.0241 N∙m−2 in 2018 to 0.2761 N∙m−2 in 2023) and local roughness coefficients (from 0.045 s∙m−1/3 before the introduction of the deflectors to 0.070 s∙m−1/3 in 2023). Based on analyses of sediment samples, erosion and accumulation of bottom material were initially observed, followed by a subsequent stabilisation of particle size. Differences in grain size were observed, especially in the cross-section of the deflectors (increase in granularity d50% downstream of the deflector from 0.31 mm to 3.9 mm already 2 years after the introduction of deflectors). This study confirmed the positive impact of using deflectors on hydromorphological processes as deflectors facilitate the achievement of a good ecological status, as required by the WFD. The innovation of this paper lies in demonstrating the possibility of using small, simple structures to initiate and intensify fluvial processes, which may contribute to improving the ecological conditions of watercourses.

1. Introduction

Sediment transport significantly influences the bed layout in rivers [1]. A fundamental parameter related to sediment movement description is the stress exerted on the bottom of the watercourse, which depends, for example, on the vegetation present on the riverbed [2]. An increase in stream energy often results in higher shear stress, leading to bank erosion and meandering due to internal flow instability [3]. In the context of sediment transport, it is crucial to determine the dynamics of bar formation in rivers [4,5] and the influence of vegetation on flow conditions [6,7,8,9,10]. The sediment size on the bar surface becomes finer downstream, while coarser gravel appears at the bar head [11]. These conditions are further influenced by channel structures. The use of seminatural structures such as deflectors improves the hydromorphological conditions of altered watercourses [12], which result in increased habitat diversity in the riverbed [13,14], leading to a rise in hydrobiota biodiversity [15] and an improvement in environmental sustainability [16,17].
The hydromorphological processes depend, among other things, on the magnitude and dynamics of the flows, the susceptibility of the bottom material to erosion, the longitudinal gradient, and the amount of sediment delivered to the river channel [18,19]. Variation in bottom shape, flow velocity, sediment particle size, and water depth leads to an increase in the number of mesohabitats and thus improved living conditions for ichthyofauna and macroinvertebrates [20,21]. In order to maintain the biodiversity of freshwater fish, as outlined in the 2030 EU Biodiversity Strategy [22], detailed information on physical habitats is extremely necessary. The introduction of deflectors significantly alters sediment transport processes [12]. On the one hand, in the area of the deflector head and on the concave bank, one can observe intensive erosion processes and flushing of material up to the armouring of the bottom [16]. On the other hand, on the convex bank and beyond the deflectors, one can observe deposition of fluvial alluvium in the form of fine material [17].
Numerical models [17,23,24] and analytical methods [25,26,27,28], as well as laboratory models [29], can be used to predict hydromorphological processes and sediment transport. A numerical model can consist of four components: (1) a morphodynamic model relating the flow field to bank migration; (2) a hydrodynamic model relating the channel geometry to the flow field; (3) an evolution equation relating bank migration to planform geometry; and (4) a model accounting for cutoff events [30].
This research was carried out on a section of a small lowland river, the Flinta, located in central Poland. The analyses concerned hydromorphological processes initiated by the introduction of wicker deflectors. The Flinta River was selected as part of the national programme for the renaturalisation of surface waters in Poland [15], and a team of researchers from the Poznań University of Life Sciences had already conducted renaturalisation-related research projects on this section of the Flinta [31]. This research indicated that the watercourse possesses high ecological potential, prompting the team to explore opportunities to improve its ecological status by restoring meanders of the Flinta. The main objective of the presented study is to determine the dynamics of hydromorphological changes in the watercourse channel during the river renaturalisation process using deflectors. We formulated research hypotheses to demonstrate that the use of seminatural structures intensifies hydromorphological processes in lowland rivers and that seminatural structures such as deflectors improve the hydromorphological conditions of transformed watercourses. The results can be considered universal for typical, transformed, small lowland watercourses that have been straightened and regulated in the past. The novelty of this project is the indication of the impact of deflectors not only on hydromorphological changes in rivers but also on improving the ecological condition of watercourses. Despite previous experience with the use of deflectors, their use in river renaturisation procedures is unfortunately still limited. Demonstrating the possibility of using small, low-cost structures to initiate renaturalisation processes is a fundamental innovation of the presented research, pointing to a potential direction for further development of these types of measures aimed at improving the ecological status of watercourses.

2. Study Area

The study area encompassed the estuarine section of the Flinta River. Between 2017 and 2023, research about restoration with deflectors was conducted on a study section approximately 150 m long, situated near the village of Rożnowice in the municipality of Rogoźno (Wielkopolskie Voivodeship, Poland) (Figure 1). The surveyed river section features a longitudinal gradient of 1.3‰ and a narrow channel width ranging from approximately 1.5 to 2.0 m. The total length of the Flinta River is 27 km, and its catchment area spans 345.47 km2 [32]. The Flinta River flows through the Noteć Forest, NATURA 2000 areas, and other environmentally valuable areas [12,32,33].
According to the Water Framework Directive [34], the Flinta River is classified as a lowland sandy stream, representing the largest group of watercourses in Poland and in the Central European lowland belt. Hydrological observations are collected at a water gauge station located in Ryczywół (km 14 + 355—starting from the mouth). Additionally, there is a weather station within the catchment area. Both stations are part of the Measurement and Observation Network of the Institute of Meteorology and Water Management–National Research Institute (IMGW-PIB). The data presented in Table 1 include the characteristic discharges determined for the observation period from 1951 to 2014 made available by IMGW-PIB.
As part of extensive regulatory works conducted at the turn of the 20th century, the length of the watercourse was significantly reduced, and the channel layout was regulated [12]. The regulatory and exploitation works carried out resulted in ecological degradation and a change in the sinuosity of the river, leading to the straightening of the channel course in many sections. Regular maintenance works, including desilting and deepening of the channel, as well as stabilisation of the banks with measures such as fascine fences, mowing of embankments, and removal of vegetation, prevented the automatic restoration of natural conditions or spontaneous renaturalisation of the river. Consequently, in some sections, the channel’s natural characteristics have completely disappeared, and there is a lack of heterogeneity in river conditions.

3. Materials and Methods

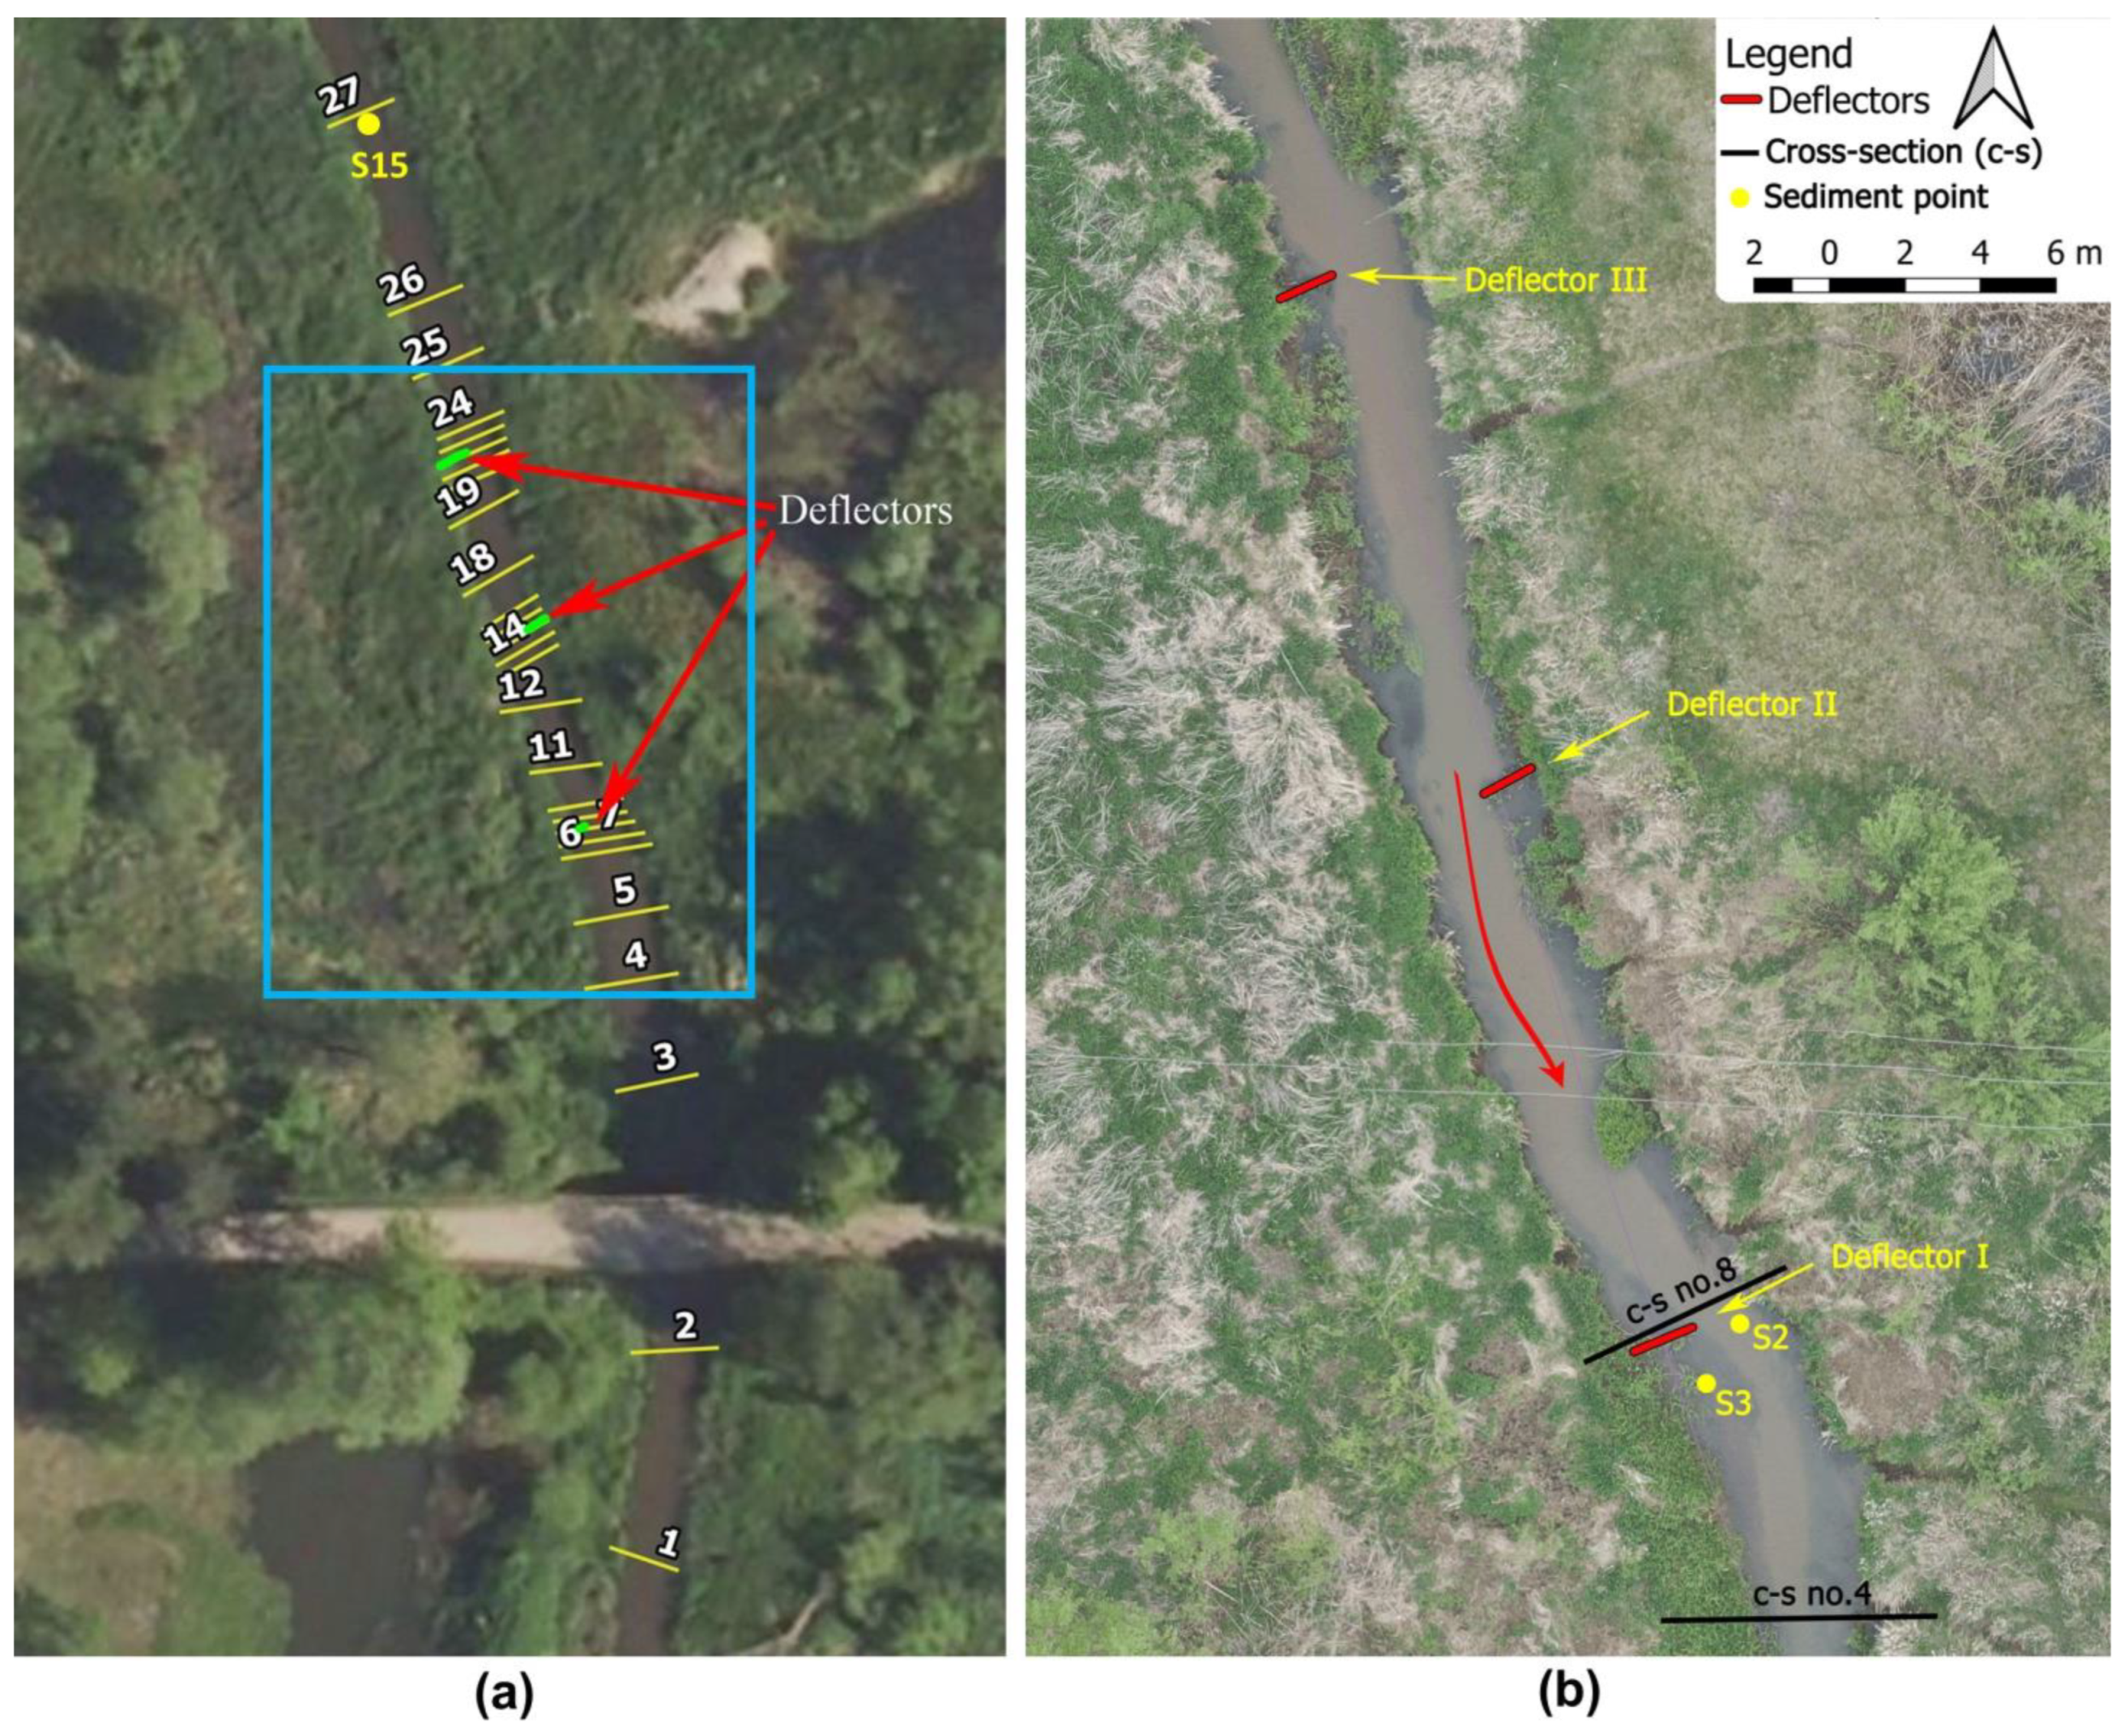
3.1. Construction of Deflectors

Wicker deflectors were introduced in 2017 in the surveyed section of the Flinta River in order to study the changes in the hydromorphology of the channel, which were initiated by the introduction of seminatural structures. This study was conducted on a straight, highly hydromorphologically transformed section of the river. The 3 deflectors installed in the river channel had a simple, lightweight design, which was based on wicker fences (Figure 2a). The width of the structures was 1.20–1.50 m. The angle of deflector position relative to the bank line was α = 70–80° (Figure 2b and Figure 3b). Such an angle was chosen in order to properly direct the current to initiate meandering processes. According to the literature [35], deflectors should be spaced at a distance of approx. 5–7 channel widths. This improves their performance significantly [35].

3.2. Geodetic Surveying

The basis for determining the changes, extent, and rate of hydromorphological transformation was, among other things, based on geodetic surveys of the channel layout and adjacent banks carried out at regular intervals. In order to ensure repeatability of measurements during subsequent measurement campaigns, a system based on levelled pairs of stakes, between which the measurement cross-sections were located, was developed and prepared. This allowed for fast, accurate, and repeatable measurements to be taken. The data obtained made it possible to compare and analyse them more reliably. Prior to the introduction of the structures into the watercourse, a thorough measurement of the original channel and bank layout was carried out. In the first year (2018), measurements were conducted at 15 cross-sections; however, starting from 2019, the number of cross-sections was increased to 28 (Figure 3a). Measurements were carried out using a Nicon AX-2s optical leveller, while a Topcon HiPer VR RTK GPS set was used to locate a fixed reference point and individual pairs of stakes. Measurements always started from the reference point, which allowed a measurement accuracy of ±0.002 m. All measurements were further verified with reference to the stake pair elevation corresponding to the given cross-section. The distance was measured using a tape measure and the accuracy was ±0.02 m.
In addition, photographic documentation was carried out during the survey to document the changes taking place in the field. The photographic documentation facilitates the verification of the results obtained and allows us to visually assess the changes taking place.

3.3. Hydrometric Measurements

By carrying out detailed measurements of the channel geometry and measuring velocity distributions, it was possible to obtain an accurate estimate of the discharge volumes. The measurements were performed at designated cross-sections. The measurements of velocity distributions were made in 15 measurement points and at different depths to show the near-bed velocities and determine the forces acting on the bed channel in 18 periods. The measurement points were selected near to deflectors in a way that allowed hydraulics to be reflected as precisely as possible with regard to the situation of the structures in each of their characteristic points and also in the area of the impact.
Measurements of the instantaneous velocity were made using the hydrometric current meter Valeport 801. This appliance can measure velocities of water in the range from 0.001 m s−1 to up 5 m s−1. Measurements were made directly above the riverbed and in specific measurement verticals. By using this device, a few measurement divisions were determined in the field, which consisted of the following parameters:
-
A set of several instantaneous velocities measured just above the bottom of the stream—V [m s−1];
-
Average velocity—Vav [m·s−1], which was determined depending on the filling of the stream bed [36,37]:
h < 0.20 m:
V a v = V 0.4 h   [ m · s 1 ]
0.20 m ≤ h ≤ 0.60 m:
V a v = V 0.2 h + 2 V 0.4 h + V 0.8 h 4   [ m · s 1 ]
h > 0.60 m:
V a v = V d + 2 V 0.2 h + 3 V 0.4 h + 3 V 0.8 h + V p 10   [ m · s 1 ]
where
  • h—water depth [m];
  • V0.2,0.4,0.8—velocity on 0.2, 0.4, and 0.8 of depth [m·s−1].
Measurements were taken at hydrometric verticals located every 0.50 m in the cross-section. The first vertical was located 0.50 m from the bank and the last one was located 0.50 m from the opposite bank, counting from the place where the water surface meets the bank. From the start of the measurements, velocity distribution was measured at nine cross-sections (numbers: 6, 8, 10, 13, 15, 17, 20, 22, 24), three of which contained deflectors, while the others laid 2 m upstream and downstream from the deflectors. Water velocity measurements were taken at the following depths: 0.01, 0.02, 0.03, 0.05, 0.10, 0.15 m and further every 0.10 m. From 2019 onwards, following the addition of extra cross-sections, the number of hydrometric cross-sections was increased to twenty (numbers: 1, 2, 3, 4, 6, 8, 10, 11, 12, 13, 15, 17, 18, 19, 20, 22, 24, 26, 27, 28).
Control profiles were located outside the impact range of the deflectors. This made it possible to verify changes caused by the deflectors and the changes that occurred naturally.

3.4. Shear Stresses

The values of dynamic velocity and shear stress were calculated based on the knowledge of the velocity profile distribution in the river, which satisfies the equation of von Karman–Prandtl [38]:
V = ( V * κ ) ln ( z z 0 )   [ m · s 1 ]
The dynamic velocity is obtained by plotting the regression line between the values of instantaneous velocities and the logarithmic values of the distance between the measurement from the bed. If the line becomes straight, then we can calculate the dynamic velocity from the coefficient of its inclination to the abscissa axis [39] as follows:
V * = a 5.75   [ m · s 1 ]
where
  • a represents the coefficient of inclination of a straight line v = f ( h ) adopting the form of equation y = a x + b (where x represents the height above the bottom on which the velocity was measured; b represents the intercept of the equation).
The calculated value of the dynamic velocity was used to determine the forces acting on the stream bed, i.e., shear stress, according to the following formula [39]:
τ = ρ · ( V * ) 2   [ N · m 2 ]

3.5. Changes in Sediment Size

Bottom sediment samples were systematically collected during survey trips. The sediment was sampled in order to determine the composition and changes that occur for the designed particle size under the influence of the structures installed. The survey included 15 fixed measurement points. The sediment sampling points were located in places characteristic for the surveyed section (in the current line above, below, and at the height of the deflector, and in the shadow of the deflector—in the place of the emerging bar and between deflectors) and at the control point, they were located about 15 m beyond the influence of the last deflector. These locations of the points ensured that all changes occurring in the surveyed section could be captured, including the renaturalisation processes caused by deflectors. The second part of this study included an assessment of the particle size distribution in accordance with the standard PN-EN ISO 17892-4:2017-01 [40]. The collected sediment was prepared for testing (shaking, separation, and drying), and then it was sifted on a set of standardised sieves at the Water Laboratory, Poznań University of Life Sciences. The results obtained were collated and tabulated for further analysis.
In addition, the transport of bed load was measured. For this purpose, the transported sediment was caught using a special device, which was installed for a period of 6 h in the channel. The sample collected was subjected to tests, as described above. The van Rijn equations, adapted to Polish conditions by Przedwojski [41], were used in the analyses of the bed load discharge:
s b = U · h · C r b · ( U U c ( g · D 50 · ρ s ρ w ρ w ) 0.42 ) 2.4 · ( D 50 h ) 1.4
U c = 0.19 · D 50 0.1 · log ( 12 · R h 3 · D 90 )
where
  • Sb—volumetric bed load discharge per unit time and channel width [m3·m−1·s−1];
  • U—mean velocity in the hydrometric vertical [m·s−1];
  • Uc—mean critical velocity in the hydrometric vertical from the Shields criterion [m·s−1];
  • h—watercourse depth [m];
  • Crb—bed load discharge coefficient [–];
  • g—gravitational acceleration [m·s−2];
  • ρs—density of sediments [kg·m−3];
  • ρw—density of water [kg·m−3];
  • Rh—hydraulic radius [m];
  • D50—sediment size [m];
  • D90—sediment size [m].
The amount of sediment transport was verified using a particle size distribution curve based on averaged data from samples taken prior to the construction of the deflectors. It included values averaged from different measurement points of the study section.

3.6. Hydraulic Simulations in HEC-RAS

The simulation model was prepared based on the DTM linking the standard terrain data with interpolated bathymetries. HEC-RAS 6.3.x was applied for modelling the flows and sediment transport (www.hec.usace.army.mil/ (accessed on 2 April 2024)) [42,43,44]. During the recent few years, HEC-RAS has been developing from the model 1D [42,43,44] in the field of 2D modelling and GIS. The 2D hydrodynamic model is based on several versions of shallow water equations [45]. There are three options available, and two of them are based on the more or less a more strict implementation of full momentum equations. The third option, which is also the default choice, is diffusion wave approximation. The default choice seems to be reasonable in topographically complex cases, like the one studied here. The main feature of diffusion wave equations is a simplification of momentum by neglecting inertia. The computed water surface elevations and velocity components do not differ much from those simulated with the full momentum model. However, the computations are more stable and resist all disturbances caused by abrupt changes in the topography.
In HEC-RAS, all 2D computations are made in the unsteady mode. However, the steady flow may be calculated as a specific stage of the unsteady computations. The starting point of the simulation was a dry bed. There were two boundary conditions imposed: inlet and outlet. In the inlet, the constant values of simulated flow were set as hydrographs. In the outlet, normal depth conditions derived from Manning’s equation were implemented. The computations were stopped when the steady flow conditions were achieved, and this final stage was considered as a result. The required time horizon was not longer than 5 days.

4. Results

4.1. Geodetic Surveying

The results of the 2018–2023 geodetic survey made it possible to assess changes in the longitudinal and transverse layout of the channel (Figure 4). Cross-section 4 (Figure 4a), lying downstream of the deflectors’ influence, had functioning bank reinforcements in good condition. This is one of the reasons why it was characterised by a certain stability in terms of bottom erosion (although there was a tendency to form channel pools). In this case, intense bank erosion was also not observed. When analysing the data in cross-section 4, some narrowing of the channel width was also observed (Figure 4a). The reduction in water surface width by 0.5 m may indicate a reduced capacity for bank erosion at a greater distance from the deflectors due to bank reinforcements. The slow erosion of the bottom also caused the channel to narrow at the bottom.
Analysis of the changes occurring in the channel at the deflector cross-section (profile 8) (Figure 4b), revealing a continuous increase in the width of the channel both at the bottom and at the water table. The largest shift value was more than 1.00 m (Figure 4b), which is a spectacular result in view of the low discharges and previously reinforced banks of the Flinta River. Changes involving the horizontal layout of the bottom of the channel locally reached up to 0.40 m. A deviation from this rule can be observed for 2020, when a temporary narrowing of the channel width (especially the bottom) occurred due to detachment of a washed-out bank. Changes in the bottom elevation in the vicinity of all deflectors varied between 0.20 and 0.30 m.
In contrast, the greatest changes were observed in cross-sections 7 and 27. At the same time, the changes that occurred in cross-section 27 (Figure 4c) were natural. The influence of the bar upstream of deflector III (Figure 2) contributed to the development of vegetation on the left bank and the deformation of the current line. The gradual narrowing of the effective cross-section resulted in the formation of a local trough and undercutting of the right bank, which ultimately contributed to bottom erosion reaching approx. 0.50 m. Over the course of five years, the horizontal layout has also seen some very significant changes. The channel was narrowed from 6 to 5 m and narrowed at the bottom from 4 to 3 m, with the current line being shifted by almost 3 m.
Systematic photographic documentation was kept during the field trips. Figure 5 shows the progression of changes to the channel layout during the survey. The state of the channel 2 years after the maintenance work on the watercourse is visible in Figure 5a. Moreover, one year after the installation of the deflectors (August 2018), the first transformations are already visible—Figure 5b. The following pictures show the changes every two years. They show the growing meander downstream of deflector I (Figure 5c,d) and the emergent and overgrown bars downstream of deflectors I, II, and III (Figure 5d).
Modelling and analysis of the geodetic data allowed models of the channel’s geometry to be generated. The elevations shown in Figure 6 are unified for all models and have a range of 55.0–56.5 m a.s.l. The width and number of profiles surveyed were increased in 2019 due to the dynamic nature of the changes taking place, as can be seen in comparison with Figure 6a. Since the measurements on 30 May 2019 (Figure 6b), large and progressive changes can be observed downstream of deflector I, in the lower reaches of the watercourse. Initially, an apparent uplift of the concave bank is visible (Figure 6c), which would seem to be the opposite effect to that expected and related to the processes initiated in the channel. However, this is due to the earlier washout and subsequent collapse of the bank into the channel, which caused unexpected changes in the channel’s geometry. During the subsequent measurements (Figure 6d,e), bank scouring and pool formation were observed and measured in the area previously occupied by the collapsed bank. The visualisation of the changes in the channel’s morphology in Figure 6 illustrates the slow formation of meanders, starting from Figure 6 b, through increasingly pronounced meanders in Figure 6d, to the easily discernible small meanders in Figure 6e. The aforementioned bank erosion can be seen on the bank opposite deflector II. In particular, changes are visible just above it and in the cross-section of the deflector itself. In Figure 6c, one can also notice the collapse of a section of the bank into the channel.

4.2. Velocity Distributions

Analysis of the hydrometric measurements made it possible to generate distributions of velocities in the channel for different measurement campaigns. Measurements where the water table level and discharges were similar were selected for a comparison with the data. A discharge value of approx. 0.200 m3·s−1 ± 10% was chosen for all five measurements (Table 2). The adopted discharge value is at the NSQ level (Table 1) and corresponds to the value of average low discharges occurring in the summer. Importantly, at this discharge value, the crowns of the deflectors are not submerged, allowing them to operate normally. The dates of the measurements, together with the exact discharge values, are summarised in Table 2.
Figure 7 shows the horizontal velocity distributions. As time passed, a change in the current line layout to a more meandering one was evident. The installed deflectors initially strongly reduced the effective cross-section of the channel, resulting in a significant increase in velocity near the cross-sections with deflectors (Figure 7a). One year after the installation of the deflectors and the changes in the cross-sectional layout of the channel, the velocity values decreased significantly as a result of the increase in the effective cross-sectional area (Figure 7b). The accumulation of material on the convex banks and the lateral erosion of the concave bank on the forming meanders seen in Figure 6c is reflected in the horizontal layout of the current line seen in Figure 7c–e. The progressive process of channel meandering seen in Figure 7 is reflected in the velocity distributions.

4.3. Shear Stress

Measurement data were used to calculate shear stresses in the channel (Table 3). Assigning spatial data to the shear stress values in each vertical allowed us to generate figures with stress distributions (Figure 8). Analysis of the data showed a successive increase in shear stress values over time. The highest stress values occurred in the current line near the deflectors on concave banks. Downstream of the deflectors in their hydrodynamic shadow, the shear stresses that occurred were noticeably lower than in the current line.
Table 3 summarises the shear stress results for cross-section 8. This is the cross-section in which deflector I is located (Figure 2). The stress values are summarised for all the measurement verticals in this profile (the verticals’ numbers are as shown in Figure 4b). The table shows an increasing trend for the shear stress values in the cross-section. By analysing Figure 8, it can also be seen that this trend is global for the entire section. There are also zones with lower shear stress values, characterised by lower flow velocities, but the introduction of deflectors has generally resulted in an increase in shear stress at the bottom of the watercourse.

4.4. Changes in Sediment Size

4.4.1. Changes Induced by Deflectors

Observations and studies of the particle size of the bottom sediment showed significant changes over the 2018–2022 period. As a result of the deflectors’ influence, changes have occurred in the river channel’s morphology. These changes were accompanied by a change in the particle size of the bottom sediment. The narrowing of the effective cross-section by the deflector has deformed the current line, altered the velocity distribution, and affected the local lateral and downcutting erosion of the channel, as described in Section 4.1. This is associated with changes in particle size in the profile of the deflector itself, as well as in the sections upstream and downstream of the deflector, which it affects.
Based on the surveys carried out, changes and a subsequent stabilisation of the particle size of the channel bottom were observed (Figure 9). Red colourI) is used to indicate the reference profile, which is located upstream of the deflector influence range. It shows the least changes over the years. As of October 2019, further changes in the particle size composition are practically imperceptible. The situation is different for the profile downstream of the deflector—in the current line (purple colour—a). The process of particle size changes is the slowest due to the increasing difficulty of transporting sediment with ever-larger particle diameters. In the case of the Flinta River, based on the observations and analyses of sediment composition and relatively low flows, it can be assumed that sediment with a particle diameter of >10 mm is unlikely to be transported further. Further washing out of the finer fractions is possible, but there is a clear slowdown in this process. The last set of data marked in green in Figure 9b was characterised by high dynamics and a successive increase in the proportion of fine particles in the profile downstream of the deflector and in the shadow of its influence (baffled section of the channel). The increase in the proportion of fine sediment particles is very important due to the formation of habitats for new groups of organisms. A reduction in the sandy fraction in favour of finer fractions (often with a high proportion of organic matter) is beneficial for the existence of macrozoobenthos and the development of vascular macrophytes.

4.4.2. Measurements with the Hydrological Catcher

In addition, based on the measurements on 6 July 2021, the sediment size and composition during measurements were determined by using a hydrological catcher over a 6 h period. The sample size after drying was 1.806 kg, and the percentage composition is presented in Figure 10. There was a very high proportion of fractions in the 0.15–0.50 mm range—at 67%—and the total proportion of the sandy fraction was over 80%. Trace amounts of fractions coarser than sand were observed. The measurement was performed in control profile no. 28, outside the deflector’s influence range.
For the data obtained from the measurements and sample granulometry (Figure 10), a calculation of the size of bed load was made using the modified van Rijn formula (Equation (7)). The sediment density was 2600 kg∙m−3, the hydraulic diameter d50 was 0.000265 m, and the diameter d90 was 0.0034 m. The results for the different flows are presented in Table 4. The value of bed load was 2.607∙10−4 kg∙m−1∙s−1, which—when converted to the width of the sediment catcher and the time over which the measurements were performed (6 h)—resulted in 1.868 kg, and the mass of the caught sediment was 1.805 kg. The movement rate of the sediment caught in the catcher was 2.883∙10−4 kg∙m−1∙s−1. The amount of bed load was relatively small and characteristic of a lowland river. The results referred to calculations using the van Rijn method are within the margin of error and demonstrate that this method can also be used for lowland rivers. During the year at mean flow, the amount of transported sediment exceeds 44 tonnes, which corresponds to almost 17 m3 of bed load; however, for mean low flow, it is about 2.5 tonnes per year, which corresponds to approx. 1 m3.

4.5. Results of Hydraulic Simulations in HEC-RAS

The model was first calibrated based on the field measurements described above in the Materials section (Section 3.2, Section 3.3, and Section 3.5). The research used measured cross-sections that were implemented into the model. Deflectors were also included as cross-sections. The computations of flow were performed over two different DTMs: (1) without deflectors and (2) with deflectors. The six characteristic flows were selected for the analysis. These were 0.17 m3∙s−1, 0.18 m3∙s−1, 0.20 m3∙s−1, SNQ, SSQ, and SWQ. It was assumed that the unique roughness coefficient was determined for the entire reach. The trial-and-error method with manual assignment of parameters was implemented. Although the final value of this coefficient was relatively high, namely 0.07 s∙m−1/3, it seemed to be correct. This is a well-known issue in the 2D modelling field—that the roughness coefficients in plain simulations are greater than their equivalents in 1D models. The roughness coefficient value was influenced by the small flow value, resulting in small depths, which, in relation to the bottom forms, affect the roughness values obtained. In addition, the impact of channel overgrowth under flow conditions during the growing season was determined.
By comparing the simulation results to the calculation in the 1D modelling and measurement results described in [46] by Zaborowski et al., the roughness coefficients had small values. Depending on how the deflectors were represented in the numerical model, the values of the tared coefficients ranged from 0.060 s∙m−1/3 to 0.075 s∙m−1/3 in the vicinity of the deflectors themselves and 0.055 s∙m−1/3 to 0.065 s∙m−1/3 in areas beyond their influence. These values were also calculated for a flow of 0.200 m3∙s−1. The increase in roughness coefficient values relating to the measurement results of 2023.06.13 may be due to an increase in the sinuosity coefficient of the channel, the occurrence of bottom formations, and the proportion of vegetation. The roughness coefficient values for the state before the introduction of the deflectors were characterised by a very wide range, varying from 0.045 s∙m−1/3 to even 0.080 s∙m−1/3. Differences in elevations obtained from the hydrodynamic model compared to the measurements taken beyond the extreme profiles were also within the range of 0.01–0.04 m.
Figure 11 shows an exemplary comparison of water elevations measured on 13 June 2023 as well as the results from the HEC-RAS 2-D model for a measured flow of 0.200 m3∙s−1. The final errors between the measured and calculated water surfaces varied between 0.02 and 0.04 m, and the mean square error was 0.008, which indicates good model fit.

5. Discussion

5.1. Influence of Deflectors on the Hydromorphological Changes

In Poland, the use of deflectors has so far been associated with the renaturalisation and restoration of the biological continuity of rivers, taking into account the needs of ichthyofauna [47,48,49,50]. Determining the influence of deflectors on the hydromorphological transformation of the channel is an important issue in assessing the stability and vulnerability of river channels to transformations resulting from bank erosion, downcutting erosion, and sediment accumulation [51]. This study investigated the effects of a set of three deflectors on hydromorphological processes and sediment transport in the Flinta River. The literature indicates that deflectors cause local erosion and scour, thus accelerating hydromorphological processes [52,53,54]. This was analysed based on field measurements, simulations, and laboratory experiments [35,55,56], among other methods. However, in the case studied, local, long-term hydromorphological processes (including erosion) were observed to affect the Flinta River; moreover, they were also accompanied by the deposition of material within the so-called hydrodynamic shadow, which was caused by the deflectors. Locally, bottom armouring was also observed. This confirmed the results of the work of researchers, such as Kujanová and Matoušková [57] and Biron et al. [51], who observed similar phenomena in small rivers where renaturalisation processes were initiated by means of small channel structures. Similar local phenomena have already been observed on the Flinta, where plant baskets were introduced into the channel current as part of a pilot project [31,58]. In these papers, various advantages of plant basket hydraulic structures operating as sediment traps in river channels were presented. They were river restoration measures stimulating changes in riverbed morphology, diversifying water flow, and causing its divergence around the obstacles created by the PBHS. In this way, PBHS had a positive impact on the hydromorphology of the river’s reach and may have enhanced its settlement by enabling a greater variety of animals to live in the river. The adverse consequences of the introduction of PBHS for engineering constructions and river maintenance are very limited, and due to the low impact of the structures on high-flow levels, they do not increase the risk of inundation [46].

5.2. The Influence of Deflectors on Stream Parameters

The obtained results regarding the introduction of deflectors into the channel of a lowland watercourse underscore the need for a comprehensive analysis of the transformations caused by their introduction. Deflectors affect velocity distributions, bottom shear stress (and thus flow resistance), and processes related to sediment transport, which in turn translates into improved ecological conditions of the watercourse. The necessity for such comprehensive research was also highlighted by Biron et al. [59] and Rana et al. [53]. They confirmed that renaturalisation projects based on the initiation of natural channel-forming processes require specific study and pre-project works. For instance, the washing out or deposition of sediment particles in the channel can cause a deformation of the initially flat rectilinear channel bottom, leading to further flow alterations. Channel bottom deformations force a sinusoidal horizontal layout of the current line [41], resulting in bank erosion and downstream movement of bank material in the form of bed load, thus initiating channel meandering [60]. The highest values of shear stress occur near deflectors in the current line and gradually increase over time, leading to bottom erosion and the washing out of small-diameter particles. Similar relationships were observed in studies by [59] Biron et al. and [61] Yarahmadi et al. The bottom armouring process downstream of the deflector in the current axis, found in our study, is well known and has been analysed by many authors [6,62]. As the renaturalisation process intensifies, the stress values increase along the entire length of the section. Zones with significantly lower shear stress values can also be observed. These are areas with lower velocities, where the accumulation of fine sediment takes place, and areas shielded by deflectors. Similar observations were made by Wang et al. [63].

5.3. The Impact of Deflectors on the Ecological Conditions of Renaturalised Watercourses

The results obtained for the lower section of the Flinta River confirmed the theses presented in the work of [57] Kujanová and Matoušková, proving that the use of structures in small watercourses has a significant impact on improving hydromorphological conditions. The changes observed by the authors demonstrated an improvement in the conditions of watercourses, with renaturalised river sections obtaining a good ecological status. A similar improvement was observed in the surveyed section of the Flinta River with deflectors [12]. Between 2012 and 2022, the hydromorphological status improved from poor to very good (Figure 7 in [12]), and the ecological status assessed on the basis of macrophytes improved from moderate to good (Figure 9 in [12]). There was a significant increase in the number of macrophyte species and percentage of coverage, including species with a distinct phytosociological association Ranunculion fluitantis, e.g., submerged forms of Berula erecta and Veronica anagallis-aquatica. Rapant [64], in his work on deflector design, emphasized the positive hydromorphological and biological effects caused by the introduction of deflectors. Likewise, Radspinner et al. [55], appreciating their potential and applicability on a wider scale, pointed to the pro-ecological effects of deflectors and encouraged the development of standard recommendations and methodologies for their use in renaturalisation projects. The role of seminatural deflectors can also be played by large woody debris [65] and tree stumps with root systems [66]. They have a very high habitat-forming value due to their large and varied surface and excellent imitation of naturally occurring forms [67].
The variation of particle size in the watercourse is very important from the perspective of the macrobenthos and ichthyofauna. The observed change in bottom particle size distribution in the surveyed section of the Flinta River indicates that hydromorphological processes, as a result of the introduction of deflectors, had an extremely positive effect. At the same time, it should be noted that the complex structure of the bottom substrate enables habitats suitable for a broader spectrum of macroinvertebrate species to be formed and thus favours an increase in biodiversity [13,68,69]. For fish, specific bottom particle sizes are associated with specific mesohabitats and rheophilic species (e.g., salmonids), which prefer coarse bottom material [70]. In turn, a greater diversity of mesohabitats promotes, as in the case of macroinvertebrates, a greater biodiversity of the ichthyofauna [20]. In rheophilic fish, bottom particle size is also crucial for their reproduction. For example, the content of sand or a finer fraction of >30% of the volume in the spawning nest of Salmo trutta results in a drastic decrease in egg survival to <5% [71]. Water flow and the directly related particle size of the bottom substrate also affect macrophytes [72]. In gravel-bed rivers, species characteristic of the phytosociological association Ranunculion fluitantis are more common [73], such as Batrachium aquatilis, B. fluitans, and B. trichophyllus [74,75]. In contrast, rivers with a significant proportion of stones in the bottom material (φ > 64 mm) have an increasing proportion of aquatic bryophytes, such as Brachythecium rivulare, Fontinalis antipyretica, and Platyhypnidium riparioides [14,76,77,78,79].
Based on the results obtained, as well as on the research published in earlier articles [12,46], this study succeeded in confirming the hypothesis put forward in this paper that the use of semi-natural structures, such as deflectors, improves the hydromorphological conditions of anthropogenically transformed watercourses. These structures show great potential to initiate and accelerate renaturalisation processes in small lowland watercourses. In the context of the implementation of the Water Framework Directive (WFD) 2000 [34] and the vast number of watercourses in need of improvement in their ecological status, they seem ideal for use due to their semi-natural character, low manufacturing costs, and the sourcing of fully biodegradable and environmentally friendly raw materials.

6. Summary

The described changes induced by deflectors lead to a local increase in shear stress, initiation of channel meandering, variation in bottom shape, velocity distributions and bottom sediment particle size, and an increase in channel morphology heterogeneity. The resulting riffles, pools, bars, bank erosion, and varying heights of the banks increased the biodiversity of species present both within the channel itself and in its immediate vicinity.
The introduction of deflectIors into the Flinta River channel caused changes in both the horizontal and vertical layouts of the river. The changes observed in cross-section no. 8 indicated an increase in the cross-section width at the water table by 1.0 m and at the bottom by 0.5 m. A systematic shift of the river channel towards the bank opposite to the installed deflector and an accumulation of material in the cross-sections downstream of the deflector were observed. The total width of cross-section no. 4 decreased as a result of the deflector, indicating greater accumulation of sediment on the convex bank than erosion of the concave bank. Observations indicated that between cross-sections no. 4 and no. 8, a trough was formed with reduced bottom elevations compared to the original state. Material from the channel was being washed out and transported further, and the trough itself slowly shifted towards the mouth, providing a constant effective area of the cross-section. By analysing the width changes in cross-section no. 27, which was outside the influence of the deflectors, a slight difference was found between the original state and the one observed in 2023. The analysis of the vertical layout of the Flinta River channel indicates an increase in bottom elevations in places typical for sediment accumulation resulting from the start of the meandering process. The deflectors have also resulted in erosion of the channel bottom and the creation of a trough, which has formed over the years.
The deflectors also had a signifiIcant impact on velocity distributions. AlIready in the first year after their application, an increase in velocity at the deflectors can be observed. In the following years, on the other hand, a clear decrease in velocity was observed in the sections between the deflectors. Analysis of the 2022 results shows a clear influence of the river channel meandering on velocity distributions through the formation of a trough related to material deposition on convex banks and erosion on concave banks.
Another parameter important in assessing hydromorphological processes is shear stress. It is evident that at the beginning of this study, the stresses were low for the artificially formed channel. They increased significantly during the transformation of the channel layout (increase in sinuosity, transformation of the bottom layout, and thus velocity distributions). Therefore, the renaturalisation process caused a significant increase in stress values.
The construction of deflectors significantly influenced the changes in sediment transport. The bottom material of the channel had different particle sizes. Based on the analyses of sediment samples taken from the channel’s bottom, significant changes were initially observed due to erosion and accumulation of bottom material, followed by a subsequent stabilisation of particle size. Since October 2019, changes in granulometric composition were virtually imperceptible. Downstream of the deflector, the phenomenon of bottom armouring was observed, which is characteristic of areas with increased velocity where there is a process of washing out the finest fractions and leaving the unscoured fraction on the bottom. In the case of the Flinta River, based on observations and analyses of sediment compositions and relatively low flows, it was shown that sediment with a particle size larger than 10 mm is unlikely to be transported further.
Calculations of bed load transport were made using a modified van Rijn formula. During the year with mean flow, the amount of transported sediment exceeds 44 tonnes, which corresponds to almost 17 m3 of bed load. The results of the sediment transport calculations were compared with the results of the hydrological catcher measurements. Very high convergence was obtained, which confirms that the modified van Rijn formula can be used to analyse bed load transport in small lowland watercourses.
The results can be considered universal for typical, transformed, small lowland watercourses. This study confirmed the positive impact of using semi-natural constructions in the form of wicker deflectors on hydromorphological processes. The innovation of this paper lies in demonstrating the possibility of using small, simple structures to initiate and intensify fluvial processes. It also indicates the potential direction for further development of this type of measures to improve the ecological status of watercourses, where studies and pre-project works are particularly important due to the use of non-standard solutions.

Supplementary Materials

The following supporting information can be downloaded at: https://www.mdpi.com/article/10.3390/su16103948/s1.

Author Contributions

Conceptualisation, S.Z., T.K., M.H., S.J. and T.D.; methodology, S.Z., T.K., M.H., S.J. and T.D.; software, S.Z., T.K., M.H., S.J. and T.D.; validation, S.Z., T.K., M.H., S.J. and T.D.; formal analysis, S.Z., T.K., M.H., S.J. and T.D.; investigation, S.Z., T.K., M.H., S.J. and T.D.; writing—original draft preparation, S.Z., T.K., M.H., S.J. and T.D.; writing—review and editing, S.Z., T.K., M.H., S.J. and T.D.; visualisation, S.Z., T.K., M.H. and S.J.; All authors have read and agreed to the published version of the manuscript.

Funding

This publication was co-financed within the framework of the Ministry of Science and Higher Education program “Regional Initiative Excellence” in the years 2019–2022, project no. 005/RID/2018/19.

Institutional Review Board Statement

Not applicable.

Informed Consent Statement

Not applicable.

Data Availability Statement

Data are contained within the article and Supplementary Materials.

Conflicts of Interest

The authors declare no conflict of interest.

References

  1. Hammerling, M.; Walczak, N.; Nowak, A.; Mazur, R.; Chmist, J. Modelling Velocity Distributions and River Bed Changes Using Computer Code SSIIM Below Sills Stabilizing the Riverbed. Pol. J. Environ. Stud. 2019, 28, 1165–1179. [Google Scholar] [CrossRef] [PubMed]
  2. Wolski, K.; Tymiński, T.; Chrobak, G. Numerical Modeling of the Hydraulic Impact of Riparian Vegetation. E3S Web Conf. 2018, 44, 00194. [Google Scholar] [CrossRef]
  3. Gilvear, D.J.; Casas-Mulet, R.; Spray, C.J. Trends and Issues in Delivery of Integrated Catchment Scale River Restoration: Lessons Learned from a National River Restoration Survey within Scotland. River Res. Appl. 2012, 28, 234–246. [Google Scholar] [CrossRef]
  4. Bywater-Reyes, S.; Diehl, R.M.; Wilcox, A.C. The Influence of a Vegetated Bar on Channel-Bend Flow Dynamics. Earth Surf. Dynam. 2018, 6, 487–503. [Google Scholar] [CrossRef]
  5. Weckwerth, P. Fluvial Responses to the Weichselian Ice Sheet Advances and Retreats: Implications for Understanding River Paleohydrology and Pattern Changes in Central Poland. Int. J. Earth Sci. (Geol. Rundsch.) 2018, 107, 1407–1429. [Google Scholar] [CrossRef]
  6. Wang, H.; Xu, Z.; Yu, H.; Wang, X. Flow Variability along a Vegetated Natural Stream under Various Sediment Transport Rates. J. Mt. Sci. 2018, 15, 2347–2364. [Google Scholar] [CrossRef]
  7. Shan, Y.; Liu, X.; Yang, K.; Liu, C. Analytical Model for Stage-Discharge Estimation in Meandering Compound Channels with Submerged Flexible Vegetation. Adv. Water Resour. 2017, 108, 170–183. [Google Scholar] [CrossRef]
  8. Wolski, K.; Tymiński, T. Studies on the Threshold Density of Phragmites Australis Plant Concentration as a Factor of Hydraulic Interactions in the Riverbed. Ecol. Eng. 2020, 151, 105822. [Google Scholar] [CrossRef]
  9. Tymiński, T.; Wolski, K. Hydraulic Effect of Vegetation Zones in Open Channels: An Experimental Study of the Distribution of Turbulence. Sustainability 2024, 16, 337. [Google Scholar] [CrossRef]
  10. Kubrak, E.; Kubrak, J.; Kiczko, A. Experimental Investigation of Kinetic Energy and Momentum Coefficients in Regular Channels with Stiff and Flexible Elements Simulating Submerged Vegetation. Acta Geophys. 2015, 63, 1405–1422. [Google Scholar] [CrossRef]
  11. Li, Z.; Wang, Z.; Pan, B.; Zhu, H.; Li, W. The Development Mechanism of Gravel Bars in Rivers. Quat. Int. 2014, 336, 73–79. [Google Scholar] [CrossRef]
  12. Zaborowski, S.; Kałuża, T.; Jusik, S. The Impact of Spontaneous and Induced Restoration on the Hydromorphological Conditions and Macrophytes, Example of Flinta River. Sustainability 2023, 15, 4302. [Google Scholar] [CrossRef]
  13. Kemp, J.L.; Harper, D.M.; Crosa, G.A. Use of ‘Functional Habitats’ to Link Ecology with Morphology and Hydrology in River Rehabilitation. Aquat. Conserv. Mar. Freshw. Ecosyst. 1999, 9, 159–178. [Google Scholar] [CrossRef]
  14. Jusik, S.; Szoszkiewicz, K.; Kupiec, J.M.; Lewin, I.; Samecka-Cymerman, A. Development of Comprehensive River Typology Based on Macrophytes in the Mountain-Lowland Gradient of Different Central European Ecoregions. Hydrobiologia 2015, 745, 241–262. [Google Scholar] [CrossRef]
  15. Available online: https://www.wody.gov.pl/nasze-dzialania/krajowy-program-renaturyzacji-wod-powierzchniowych (accessed on 27 February 2023).
  16. Woś, A.; Książek, L. Hydrodynamics of the Instream Flow Environment of a Gravel-Bed River. Sustainability 2022, 14, 15330. [Google Scholar] [CrossRef]
  17. Baar, A.W.; Boechat Albernaz, M.; van Dijk, W.M.; Kleinhans, M.G. Critical Dependence of Morphodynamic Models of Fluvial and Tidal Systems on Empirical Downslope Sediment Transport. Nat. Commun. 2019, 10, 4903. [Google Scholar] [CrossRef]
  18. Dade, W.B. Grain Size, Sediment Transport and Alluvial Channel Pattern. Geomorphology 2000, 35, 119–126. [Google Scholar] [CrossRef]
  19. Billi, P.; Demissie, B.; Nyssen, J.; Moges, G.; Fazzini, M. Meander Hydromorphology of Ephemeral Streams: Similarities and Differences with Perennial Rivers. Geomorphology 2018, 319, 35–46. [Google Scholar] [CrossRef]
  20. Suska, K.; Parasiewicz, P. Application of the Mesohabitat Simulation System (MesoHABSIM) for Assessing Impact of River Maintenance and Restoration Measures. Water 2020, 12, 3356. [Google Scholar] [CrossRef]
  21. Patil, A.J.; Wang, Z.; He, X.; Li, P.; Yan, T.; Li, H. Understanding the Effect of Environment on Macrobenthic Invertebrate in Naturally Occurring Repeated Mesohabitats from the Warm-Temperate Zone River. Ecohydrol. Hydrobiol. 2023, 23, 66–78. [Google Scholar] [CrossRef]
  22. European Commission Questions and Answers: EU Biodiversity Strategy for 2030—Bringing Nature Back into Our Lives 2020. Available online: https://environment.ec.europa.eu/strategy/biodiversity-strategy-2030_en (accessed on 2 April 2024).
  23. Baghalian, S.; Bonakdari, H.; Nazari, F.; Fazli, M. Closed-Form Solution for Flow Field in Curved Channels in Comparison with Experimental and Numerical Analyses and Artificial Neural Network. Eng. Appl. Comput. Fluid Mech. 2012, 6, 514–526. [Google Scholar] [CrossRef]
  24. Zarrati, A.R.; Tamai, N.; Jin, Y.C. Mathematical Modeling of Meandering Channels with a Generalized Depth Averaged Model. J. Hydraul. Eng. 2005, 131, 467–475. [Google Scholar] [CrossRef]
  25. Pradhan, A.; Kumar Khatua, K. An Analytical Solution for Flow Estimation of a Meandering Compound Channel. E3S Web Conf. 2018, 40, 06043. [Google Scholar] [CrossRef]
  26. Kleinhans, M.G.; van den Berg, J.H. River Channel and Bar Patterns Explained and Predicted by an Empirical and a Physics-Based Method. Earth Surf. Process. Landforms 2011, 36, 721–738. [Google Scholar] [CrossRef]
  27. Eaton, B.C.; Millar, R.G.; Davidson, S. Channel Patterns: Braided, Anabranching, and Single-Thread. Geomorphology 2010, 120, 353–364. [Google Scholar] [CrossRef]
  28. Liu, X.; Zhou, Q.; Huang, S.; Guo, Y.; Liu, C. Estimation of Flow Direction in Meandering Compound Channels. J. Hydrol. 2018, 556, 143–153. [Google Scholar] [CrossRef]
  29. Egozi, R.; Ashmore, P. Defining and Measuring Braiding Intensity. Earth Surf. Process. Landforms 2008, 33, 2121–2138. [Google Scholar] [CrossRef]
  30. Schwenk, J.; Lanzoni, S.; Foufoula-Georgiou, E. The Life of a Meander Bend: Connecting Shape and Dynamics via Analysis of a Numerical Model. J. Geophys. Res. Earth Surf. 2015, 120, 690–710. [Google Scholar] [CrossRef]
  31. Li, J.; Hoerbinger, S.; Weissteiner, C.; Peng, L.; Rauch, H.P. River Restoration Challenges with a Specific View on Hydromorphology. Front. Struct. Civ. Eng. 2020, 14, 1033–1038. [Google Scholar] [CrossRef]
  32. Szałkiewicz, E.; Dysarz, T.; Kałuża, T.; Malinger, A.; Radecki-Pawlik, A. Analysis of in-Stream Restoration Structures Impact on Hydraulic Condition and Sedimentation in the Flinta River, Poland. Carpath. J. Earth Environ. Sci. 2019, 14, 275–286. [Google Scholar] [CrossRef]
  33. Paluch, J. Impact of the Activity of Water Companies Existing in the 19th and Early 20th Centuries in the Area of the River Wełna Basin on the State of Its Hydrography and Water Relations. [In Polish: Wpływ działalności spółek wodnych istniejących w XIX i na początku wieku XX na terenie zlewni rzeki Wełny na stan jej hydrografii i stosunków wodnych. Materiały konferencyjne, Problemy ekologiczne dorzecza rzeki Wełny—stan i kierunki działań]. In Proceedings of the Ecological Problems of the Wełna River Basin-State and Directions of Activities Conference, Wągrowiec, Poland, 2–26 October 2009. [Google Scholar]
  34. Water Framework Directive (WFD 2000). Directive 2000/60/EC of the European Parliament and of the Council of 23 October 2000 Establishing a Framework for Community Action in the Field of Water Policy. Available online: https://eur-lex.europa.eu/legal-content/en/ALL/?uri=CELEX%3A32000L0060 (accessed on 27 February 2023).
  35. Pagliara, S.; Kurdistani, S.M. Flume Experiments on Scour Downstream of Wood Stream Restoration Structures. Geomorphology 2017, 279, 141–149. [Google Scholar] [CrossRef]
  36. Czetwertyński, E.; Szuster, A. Hydrologia i Hydraulika; Wydawnictwa Szkolne i Pedagogiczne: Warszawa, Poland, 1971. [Google Scholar]
  37. Pasławski, Z. Metody Hydrometrii Rzecznej; Wydawnictwo Komunikacji i Łączności: Warszawa, Poland, 1973. [Google Scholar]
  38. Bergeron, N.E.; Abrahams, A.D. Estimating Shear Velocity and Roughness Length from Velocity Profiles. Water Resour. Res. 1992, 28, 2155–2158. [Google Scholar] [CrossRef]
  39. Gordon, N.D. (Ed.) Stream Hydrology: An Introduction for Ecologists, 2nd ed.; Wiley: Chichester, UK; Hoboken, NJ, USA, 2004; ISBN 978-0-470-84357-4. [Google Scholar]
  40. PN-EN ISO 17892-4:2017-01; Geotechnical Investigation and Testing—Laboratory Testing of Soils—Part 4: Testing of Soil Granulation. Polish Committee for Standarization: Warsaw, Poland, 2017.
  41. Przedwojski, B. Morfologia Rzek i Prognozowanie Procesów Rzecznych; Wydawnictwo Akademii Rolniczej im. Augusta Cieszkowskiego: Poznań, Poland, 1998; ISBN 83-7160-101-8. [Google Scholar]
  42. Brandimarte, L.; Di Baldassarre, G. Uncertainty in Design Flood Profiles Derived by Hydraulic Modelling. Hydrol. Res. 2012, 43, 753–761. [Google Scholar] [CrossRef]
  43. Gibson, S.; Comport, B.; Corum, Z. Calibrating a Sediment Transport Model through a Gravel-Sand Transition: Avoiding Equifinality Errors in HEC-RAS Models of the Puyallup and White Rivers. In Proceedings of the World Environmental and Water Resources Congress 2017, Sacramento, CA, USA, 21–25 May 2017; pp. 179–191. [Google Scholar]
  44. USACE. HEC-RAS River Analysis System User’s Manual Version 6.0; Report No. CPD-68; US Army Corps of Engineers Hydrologic Engineering Center: Davis, CA, USA, 2020.
  45. Peker, İ.B.; Gülbaz, S.; Demir, V.; Orhan, O.; Beden, N. Integration of HEC-RAS and HEC-HMS with GIS in Flood Modeling and Flood Hazard Mapping. Sustainability 2024, 16, 1226. [Google Scholar] [CrossRef]
  46. Zaborowski, S.; Kałuża, T.; Rybacki, M.; Radecki-Pawlik, A. Influence of River Channel Deflector Hydraulic Structures on Lowland River Roughness Coefficient Values: The Flinta River, Wielkopolska Province, Poland. Ecohydrol. Hydrobiol. 2023, 23, 79–97. [Google Scholar] [CrossRef]
  47. Radtke, G. Restoration of the Trzebiocha River as One of the Elements of Protection of Lake Trout from Lake Wdzydze. Komunikaty Rybackie IRŚ 1944, 1, 22–23. [Google Scholar]
  48. Świergocka, M.; Połoński, P. “Demelioration” in the Catchment Area of the Rivers Wda and Trzebiocha (Wdzydze Landscape Park). Przegląd Przyr. 1996, 7, 3–4. [Google Scholar]
  49. Obolewski, K.; Osadowski, Z.; Miller, M. Sposoby Renaturyzacji Małych Cieków Na Przykładzie Rzeki Kwaczy (Dolina Słupi). Nauka Przyroda Technologie 2009, 3, #95. [Google Scholar]
  50. Obolewski, K. Krótkoterminowe Ekologiczne Efekty Renaturyzacji Niewielkich Rzek Nizinnych Na Przykładzie Rzeki Kwaczy; Park Krajobrazowy “Dolina Słupi”, Akademia Pomorska w Słupsku: Słupsk, Poland, 2009. [Google Scholar]
  51. Biron, P.M.; Robson, C.; Lapointe, M.F.; Gaskin, S.J. Three-dimensional Flow Dynamics around Deflectors. River Res. Appl. 2005, 21, 961–975. [Google Scholar] [CrossRef]
  52. Elkins, E.M.; Pasternack, G.B.; Merz, J.E. Use of Slope Creation for Rehabilitating Incised, Regulated, Gravel Bed Rivers. Water Resour. Res. 2007, 43, 2006WR005159. [Google Scholar] [CrossRef]
  53. Rana, S.M.M.; Scott, D.T.; Hester, E.T. Effects of In-Stream Structures and Channel Flow Rate Variation on Transient Storage. J. Hydrol. 2017, 548, 157–169. [Google Scholar] [CrossRef]
  54. Yi, Y.; Cheng, X.; Wieprecht, S.; Tang, C. Comparison of Habitat Suitability Models Using Different Habitat Suitability Evaluation Methods. Ecol. Eng. 2014, 71, 335–345. [Google Scholar] [CrossRef]
  55. Radspinner, R.R.; Diplas, P.; Lightbody, A.F.; Sotiropoulos, F. River Training and Ecological Enhancement Potential Using In-Stream Structures. J. Hydraul. Eng. 2010, 136, 967–980. [Google Scholar] [CrossRef]
  56. Zhou, T.; Endreny, T. Meander Hydrodynamics Initiated by River Restoration Deflectors. Hydrol. Process. 2012, 26, 3378–3392. [Google Scholar] [CrossRef]
  57. Kujanova, K.; Matouskova, V. Improvement in Physical River Habitat Quality in Response to River Restoration Measures. Geografie 2016, 121, 54–78. [Google Scholar] [CrossRef]
  58. Kałuża, T.; Radecki-Pawlik, A.; Szoszkiewicz, K.; Plesiński, K.; Radecki-Pawlik, B.; Laks, I. Plant Basket Hydraulic Structures (PBHS) as a New River Restoration Measure. Sci. Total Environ. 2018, 627, 245–255. [Google Scholar] [CrossRef]
  59. Biron, P.M.; Carver, R.B.; Carré, D.M. Sediment Transport and Flow Dynamics Around a Restored Pool in a Fish Habitat Rehabilitation Project: Field and 3d Numerical Modelling Experiments. River Res. Appl. 2012, 28, 926–939. [Google Scholar] [CrossRef]
  60. Brotherton, D.I. On the Origin and Characteristics of River Channel Patterns. J. Hydrol. 1979, 44, 211–230. [Google Scholar] [CrossRef]
  61. Bahrami Yarahmadi, M.; Shafai Bejestan, M.; Pagliara, S. An Experimental Study on the Secondary Flows and Bed Shear Stress at a 90-Degree Mild Bend with and without Triangular Vanes. J. Hydro-Environ. Res. 2020, 33, 1–9. [Google Scholar] [CrossRef]
  62. Kasperek, R.; Rosik-Dulewska, C.; Wiatkowski, M. Studies of bottom sediments in the border meanders of upper Odra river. Environ. Protec. Yearb. 2007, 9, 293–302. Available online: https://yadda.icm.edu.pl/baztech/element/bwmeta1.element.baztech-article-BPW8-0009-0072 (accessed on 26 October 2022). (In Polish).
  63. Wang, Y.; Wai, O.W.H.; Chen, Q. Laboratory Study on Fish Behavioral Response to Meandering Flow and Riffle-Pool Sequence Driven by Deflectors in Straight Concrete Flood Channels. J. Hydrol. 2021, 598, 125736. [Google Scholar] [CrossRef]
  64. Rapant, D. Physical Modeling of Deflector Arms in a River Table; SUNY College of Environmental Science and Forestry: Syracuse, NY, USA, 2012. [Google Scholar]
  65. Kail, J.; Hering, D.; Muhar, S.; Gerhard, M.; Preis, S. The Use of Large Wood in Stream Restoration: Experiences from 50 Projects in Germany and Austria. J. Appl. Ecol. 2007, 44, 1145–1155. [Google Scholar] [CrossRef]
  66. Bednarczyk, S.; Duszyński, R. Hydrauliczne i Hydrotechniczne Podstawy Regulacji i Rewitalizacji Rzek; Wydawnictwo Politechniki: Gdańskiej, Poland, 2008; ISBN 83-7348-212-1. [Google Scholar]
  67. Prus, P.; Popek, Z.; Pawlaczyk, P. (Eds.) Good River Maintenance Practices; Wydanie II, poprawione i uzupełnione; WWF Polska: Warszawa, Poland, 2018; ISBN 978-83-62069-49-1. [Google Scholar]
  68. Hill, G.; Maddock, I.; Bickerton, M. Testing the Relationship Between Surface Flow Types and Benthic Macroinvertebrates. In Ecohydraulics; Maddock, I., Harby, A., Kemp, P., Wood, P., Eds.; Wiley: Hoboken, NJ, USA, 2013; pp. 213–228. ISBN 978-0-470-97600-5. [Google Scholar]
  69. Szałkiewicz, E.; Kałuża, T.; Grygoruk, M. Environmental Flows Assessment for Macroinvertebrates at the River Reach Scale in Different Degrees of Hydromorphological Alteration. Front. Environ. Sci. 2022, 10, 866526. [Google Scholar] [CrossRef]
  70. Heggenes, J.; Wollebæk, J. Habitat Use and Selection by Brown Trout in Streams. In Ecohydraulics; Maddock, I., Harby, A., Kemp, P., Wood, P., Eds.; Wiley: Hoboken, NJ, USA, 2013; pp. 157–176. ISBN 978-0-470-97600-5. [Google Scholar]
  71. Crisp, D.T. (Ed.) Trout and Salmon: Ecology, Conservation and Rehabilitation, 1st ed.; Wiley: Hoboken, NJ, USA, 2000; ISBN 978-0-85238-256-1. [Google Scholar]
  72. Janauer, G.A.; Schmidt-Mumm, U.; Reckendorfer, W. Ecohydraulics and Aquatic Macrophytes: Assessing the Relationship in River Floodplains. In Ecohydraulics; Maddock, I., Harby, A., Kemp, P., Wood, P., Eds.; Wiley: Hoboken, NJ, USA, 2013; pp. 245–259. ISBN 978-0-470-97600-5. [Google Scholar]
  73. Neuhäusl, R. Die Pflanzengesellschaften Des Südöstlichen Teiles Des Wittingauer Beckens. Preslia 1959, 31, 115–147. [Google Scholar]
  74. Gebler, D.; Zalewska-Gałosz, J.; Jopek, M.; Szoszkiewicz, K. Molecular Identification and Habitat Requirements of the Hybrid Ranunculus circinatus × R. Fluitans and Its Parental Taxa R. circinatus and R. fluitans in Running Waters. Hydrobiologia 2022, 849, 2999–3014. [Google Scholar] [CrossRef]
  75. Marciniak, M.; Gebler, D.; Grygoruk, M.; Zalewska-Gałosz, J.; Szoszkiewicz, K. Hyporheic Flow in Aquatic Ranunculus Habitats in Temperate Lowland Rivers in Central Europe. Ecol. Indic. 2023, 153, 110422. [Google Scholar] [CrossRef]
  76. Liu, C.; Shan, Y.; Liu, X.; Yang, K. Method for Assessing Discharge in Meandering Compound Channels. Proc. Inst. Civ. Eng. Water Manag. 2016, 169, 17–29. [Google Scholar] [CrossRef]
  77. Tambroni, N.; Luchi, R.; Seminara, G. Can Tide Dominance Be Inferred from the Point Bar Pattern of Tidal Meandering Channels? J. Geophys. Res. Earth Surf. 2017, 122, 492–512. [Google Scholar] [CrossRef]
  78. Duan, J.G.; Julien, P.Y. Numerical Simulation of Meandering Evolution. J. Hydrol. 2010, 391, 34–46. [Google Scholar] [CrossRef]
  79. Czuba, J.A.; David, S.R.; Edmonds, D.A.; Ward, A.S. Dynamics of Surface-Water Connectivity in a Low-Gradient Meandering River Floodplain. Water Resour. Res. 2019, 55, 1849–1870. [Google Scholar] [CrossRef]
Figure 1. Location of the Flinta River and the study section. The red points indicate the locations of the deflectors.
Sustainability 16 03948 g001
Figure 2. The deflector layout scheme and placement along the studied section of the Flinta River: (a) completed deflector in the river; (b) scheme of the layout of deflectors in the river, b—width of the river, which varied slightly and ranged from 3 to 4 m in the study section. RB—right bank; LB—left bank; α—70–90°, I, II, III—numbers of deflectors [12].
Sustainability 16 03948 g002
Figure 3. Orthophoto of the Flinta research study section with deflectors in 2021: (a) location of cross-sections; (b) enlargement location of deflectors and cross-sections used; S2, S3, S15—samples of the river sediment [12].
Sustainability 16 03948 g003
Figure 4. Changes in cross-sections between 2018 and 2023 for cross-sections (a) no. 4, (b) no. 8, and (c) no. 27. Red numbers I–VIII—hydrometric verticals [12] (with modifications).
Sustainability 16 03948 g004
Figure 5. Changes to the Flinta River channel in the surveyed section between 2013 and 2023 for (a) March 2013, (b) October 2019, (c) June 2021, and (d) November 2023, red arrow—direction of water flow.
Sustainability 16 03948 g005
Figure 6. Changes in terrain and channel bottom elevations based on survey measurements from 2018 to 2023 (m a.s.l.), red line—deflectors, red arrow—direction of water flow.
Sustainability 16 03948 g006
Figure 7. Velocity distributions in the channel based on hydrometric measurements from 2018 to 2023 (values in m·s−1), red arrow—direction of water flow.
Sustainability 16 03948 g007
Figure 8. Changes in shear stress in the channel for flows of 0.200 m3∙s−1 ±10% in 2018–2023 (values in N∙m−2), red arrow—direction of water flow.
Sustainability 16 03948 g008
Figure 9. Changes in sediment size: (a) downstream of the deflector cross-section in shadow of deflector; (b) cross-section downstream of deflector in current line; (c) reference point.
Sustainability 16 03948 g009
Figure 10. The granulometric composition of bed load on 6 July 2023.
Sustainability 16 03948 g010
Figure 11. Comparison of water elevations measured on 13 June 2023, and the results from the HEC-RAS 2-D model for a measured flow of 0.200 m3∙s−1.
Sustainability 16 03948 g011
Table 1. Flows characteristic of the Ryczywół water gauge in the years 1951–2014. Characteristic discharges: NNQ—lowest of the annual low; SNQ—average of the annual low; WNQ—highest of the annual low; NSQ—lowest of the mean annual; SSQ—average of the mean annual; WSQ—highest of the mean annual; NWQ—lowest of the annual high; SWQ—average of the annual high; WWQ—highest annual high [12].
Characteristic Flows [m3·s−1]
NNQSNQWNQNSQSSQWSQNWQSWQWWQ
0.010.100.410.240.661.720.773.267.28
Table 2. Dates of measurements with values of discharge.
Date11 October 201830 May 20192 June 20201 June 202213 June 2023
Discharge [m3∙s−1]0.1980.2070.1800.2230.203
Table 3. Shear stresses for cross-section 8 (cross-section of deflector I) at a flow rate of 0.200 m3·s−1 ± 10%. Numbers I–VIII are the hydrometric verticals from Figure 4 (all results are included in the Supplementary Materials).
DateTangential Stresses [N∙m−2]
IIIIIIIVVVIVIIVIII
2018.10.110.00980.00110.03710.03850.03850.03020.0039-
2019.05.300.20941.03960.02270.00130.05340.06480.0350-
2020.06.020.43190.02200.14610.04100.03920.00000.08270.0337
2022.06.010,01370.19210.31280.00020.07530.19160.0167-
2023.06.130.06290.72010.03080.50250.24280.31041.7772-
Table 4. Calculation results for bed load. Meanings of symbols: Q—discharge of water, v—average velocity, h—watercourse depth, Rh—hydraulic radius, Crb—bed load discharge coefficient, Uc—mean critical velocity in the hydrometric vertical from the Shields criterion, Sb—volumetric bed load discharge per unit time and channel width, qr—discharge of debris, M—annual volume of debris.
No.QvhRhCrbUcSbqrM
[-][m3∙s−1][m∙s−1][m][m][-][m∙s−1][m3∙m−1∙s−1] [kg∙m−1∙s−1][Mg∙Year−1]
10.1090.1370.2450.2310.00501.226 × 10−53.020 × 10−88.003 × 10−52.524
20.1640.2000.3280.2870.00501.273 × 10−59.839 × 10−82.607 × 10−48.222
30.2030.1700.4510.3540.00501.319 × 10−55.068 × 10−81.343 × 10−44.235
40.3090.2220.4100.3420.00501.312 × 10−51.294 × 10−73.430 × 10−410.817
50.6250.3410.4710.4190.00501.356 × 10−55.300 × 10−71.404 × 10−344.291
Disclaimer/Publisher’s Note: The statements, opinions and data contained in all publications are solely those of the individual author(s) and contributor(s) and not of MDPI and/or the editor(s). MDPI and/or the editor(s) disclaim responsibility for any injury to people or property resulting from any ideas, methods, instructions or products referred to in the content.

