
Characterization of Betalain Content and Antioxidant Activity Variation Dynamics in Table Beets (Beta vulgaris L.) with Differently Colored Roots

 , , , and
Abstract
:1. Introduction
2. Materials and Methods
2.1. Weather Characteristics
2.2. Sample Preparation
2.3. Quantification of Dry Matter Content
2.4. Quantification of Ascorbic Acid Content
2.5. Quantification of Sugar Content
2.6. Quantification of Organic Acid Content
2.7. Quantification of Chlorophyll and Carotenoid Content
2.8. Quantification of Protein Content
2.9. Quantification of Total Phenolics
2.10. Quantification of Total Antioxidant and Antiradical Activity
2.11. Quantification of Betalains
2.12. HPLC-Assisted Quantification of Individual Betalains
2.13. Statistical Analysis
3. Results and Discussion
4. Conclusions
Supplementary Materials
Author Contributions
Funding
Data Availability Statement
Conflicts of Interest
References
- Boccia, F.; Punzo, G. Nutraceuticals: Some remarks by a choice experiment on food, health and new technologies. Food Res. Int. 2019, 130, 108888. [Google Scholar] [CrossRef] [PubMed]
- Torres-Maravilla, E.; Méndez-Trujillo, V.; Hernández-Delgado, N.C.; Bermúdez-Humarán, L.G.; Reyes-Pavón, D. Looking inside Mexican Traditional Food as Sources of Synbiotics for Developing Novel Functional Products. Fermentation 2022, 8, 123. [Google Scholar] [CrossRef]
- Oroian, M.; Escriche, I. Antioxidants: Characterization, natural sources, extraction and analysis. Food Res. Int. 2015, 74, 10–36. [Google Scholar] [CrossRef] [PubMed]
- Teleanu, D.M.; Niculescu, A.-G.; Lungu, I.I.; Radu, C.I.; Vladâcenco, O.; Roza, E.; Costăchescu, B.; Grumezescu, A.M.; Teleanu, R.I. An Overview of Oxidative Stress, Neuroinflammation, and neurodegenerative diseases. Int. J. Mol. Sci. 2022, 23, 5938. [Google Scholar] [CrossRef] [PubMed]
- Ames, B.N.; Gold, L.S. Endogenous mutagens and the causes of aging and cancer. Mutat. Res./Fundam. Mol. Mech. Mutagen. 1991, 250, 3–16. [Google Scholar] [CrossRef]
- Cannataro, V.L.; Mandell, J.D.; Townsend, J.P. Attribution of Cancer Origins to Endogenous, Exogenous, and Preventable Mutational Processes. Mol. Biol. Evol. 2022, 39, msac084. [Google Scholar] [CrossRef] [PubMed]
- Jain, G.; Schwinn, K.E.; Gould, K.S. Betalain induction by L-DOPA application confers photoprotection to saline-exposed leaves of Disphyma australe. New Phytol. 2015, 207, 1075–1083. [Google Scholar] [CrossRef] [PubMed]
- Polturak, G.; Grossman, N.; Vela-Corcia, D.; Dong, Y.; Nudel, A.; Pliner, M.; Levy, M.; Rogachev, I.; Aharoni, A. Engineered gray mold resistance, antioxidant capacity and pigmentation in betalain-producing crops and ornamentals. Proc. Natl. Acad. Sci. USA 2017, 114, 9062–9067. [Google Scholar] [CrossRef] [PubMed]
- Tesoriere, L.; Allegra, M.; Butera, D.; Livrea, M.A. Absorption, excretion, and distribution of dietary antioxidant betalains in LDLs: Potential health effects of betalains in humans. Am. J. Clin. Nutr. 2004, 80, 941–945. [Google Scholar] [CrossRef]
- Ninfali, P.; Antonini, E.; Frati, A.; Scarpa, E.S. C-Glycosyl Flavonoids from Beta vulgaris Cicla and Betalains from Beta vulgaris rubra: Antioxidant, Anticancer and Anti-inflammatory Activities—A Review. Phytother. Res. 2017, 31, 871–884. [Google Scholar] [CrossRef]
- Gopalan, M.; Jadhav, A.S. Protective effect beetroot Beta vulgaris extract against H2O2 Induced Oxidative stress in U87MG glioma cells. S. Asian J. Exp. Biol. 2021, 11, 266–274. [Google Scholar] [CrossRef]
- Bastos, E.L.; Schliemann, W. Betalains as Antioxidants. In Plant Antioxidants and Health. Reference Series in Phytochemistry; Ekiert, H.M., Ramawat, K.G., Arora, J., Eds.; Springer: Berlin/Heidelberg, Germany, 2022; pp. 51–93. [Google Scholar] [CrossRef]
- Parkin, K.L.; Wettasinghe, M. Cancer Chemopreventive Agents. U.S. Patent US20030036565 A1, 20 February 2003. Available online: https://patentimages.storage.googleapis.com/6d/ca/5d/c4191d70dee093/US20030036565A1.pdf (accessed on 4 March 2024).
- Gernot Treusch. Composicion Farmaceutica que Contiene Compuestos de Glutation y Betalainas para la Prevencion y para la Lucha Contra el Cancer. Spain Patent ES 2320380, 21 May 2009. Available online: https://patentscope.wipo.int/search/en/detail.jsf?docId=ES5736871&_cid=P11-LNWZ4M-37489-1 (accessed on 4 March 2024).
- Gliszczyńska-Świgło, A.; Szymusiak, H.; Malinowska, P. Betanin, the main pigment of red beet: Molecular origin of its exceptionally high free radical-scavenging activity. Food Addit. Contam. 2006, 23, 1079–1087. [Google Scholar] [CrossRef]
- Azeredo, H.M.C. Betalains: Properties, sources, applications, and stability—A review. Int. J. Food Sci. Technol. 2008, 44, 2365–2376. [Google Scholar] [CrossRef]
- Madadi, E.; Mazloum-Ravasan, S.; Yu, J.S.; Ha, J.W.; Hamishehkar, H.; Kim, K.H. Therapeutic Application of Betalains: A Review. Plants 2020, 9, 1219. [Google Scholar] [CrossRef] [PubMed]
- Skalicky, M.; Kubes, J.; Shokoofeh, H.; Tahjib-Ul-Arif, M.; Vachova, P.; Hejnak, V. Betacyanins and Betaxanthins in Cultivated Varieties of Beta vulgaris L. Compared to Weed Beets. Molecules 2020, 25, 5395. [Google Scholar] [CrossRef]
- Sawicki, T.; Bączek, N.; Wiczkowski, W. Betalain profile, content and antioxidant capacity of red beetroot dependent on the genotype and root part. J. Funct. Foods 2016, 27, 249–261. [Google Scholar] [CrossRef]
- Ermakov, A.I.; Arasimovich, V.V. Methods of Biochemical Research of Plants; Agropromizdat: Leningrad, Russia, 1987; p. 430. (In Russian) [Google Scholar]
- Nielsen, S.S. Food Analysis, 4th ed.; Food Science Text Series; Springer: Greer, SC, USA, 2010; p. 602. [Google Scholar] [CrossRef]
- AOAC. Official Methods of Analysis of AOAC International, 19th ed.; AOAC International: Gaithersburg, MD, USA, 2012; Volume 54. [Google Scholar]
- Singleton, V.L.; Rossi, J.A. Colorimetry of Total Phenolics with Phosphomolybdic-Phosphotungstic Acid Reagent. Am. J. Enol. Vitic. 1965, 16, 144–158. [Google Scholar] [CrossRef]
- Brand-Williams, W.; Cuvelier, M.E.; Berset, C. Use of a free radical method to evaluate antioxidant activity. LWT-Food Sci. Technol. 1995, 28, 25–30. [Google Scholar] [CrossRef]
- Chethana, S.; Nayak, C.A.; Raghavarao, K.S.M.S. Aqueous two-phase extraction for purification and concentration of betalains. J. Food Eng. 2007, 81, 679–687. [Google Scholar] [CrossRef]
- Sokolova, D.V. Dynamic changes in betanin content during the growing season of table beet: Their interplay with abiotic factors. Vavilov J. Genet. Breed. 2022, 26, 30–39. [Google Scholar]
- Georgiev, V.G.; Weber, J.; Kneschke, E.-M.; Denev, P.N.; Bley, T.; Pavlov, A.I. Antioxidant Activity and Phenolic Content of Betalain Extracts from Intact Plants and Hairy Root Cultures of the Red Beetroot Beta vulgaris cv. Detroit Dark Red. Plant Foods Hum. Nutr. 2010, 65, 105–111. [Google Scholar] [CrossRef] [PubMed]
- Chavez-Santoscoy, R.A.; Gutierrez-Uribe, J.A.; Serna-Saldívar, S.O. Phenolic Composition, Antioxidant Capacity and In Vitro Cancer Cell Cytotoxicity of Nine Prickly Pear (Opuntia spp.) Juices. Plant Foods Hum. Nutr. 2009, 64, 146–152. [Google Scholar] [CrossRef] [PubMed]
- Stintzing, F.C.; Schieber, A.; Carle, R. Identification of Betalains from Yellow Beet (Beta vulgaris L.) and Cactus Pear [Opuntia ficus-indica (L.) Mill.] by High-Performance Liquid Chromatography−Electrospray Ionization Mass Spectrometry. J. Agric. Food Chem. 2002, 50, 2302–2307. [Google Scholar] [CrossRef]
- Hempel, J.; Böhm, H. Betaxanthin pattern of hairy roots from Beta vulgaris var. lutea and its alteration by feeding of amino acids. Phytochemistry 1997, 44, 847–852. [Google Scholar] [CrossRef]
- Kugler, F.; Graneis, S.; Stintzing, F.C.; Carle, R. Studies on Betaxanthin Profiles of Vegetables and Fruits from the Chenopodiaceae and Cactaceae. Z. Naturforschung 2007, 62, 311–318. [Google Scholar] [CrossRef]
- Schliemann, W.; Kobayashi, N.; Strack, D. The Decisive Step in Betaxanthin Biosynthesis Is a Spontaneous Reaction. Plant Physiol. 1999, 119, 1217–1232. [Google Scholar] [CrossRef] [PubMed]
- Escribano, J.; Pedreño, M.A.; García-Carmona, F.; Muñoz, R. Characterization of the antiradical activity of betalains from Beta vulgaris L. roots. Phytochem. Anal. 1998, 9, 124–127. [Google Scholar] [CrossRef]
- Pavlov, A.; Kovatcheva, P.; Georgiev, V.; Koleva, I.; Ilieva, M. Biosynthesis and Radical Scavenging Activity of Betalains during the Cultivation of Red Beet (Beta vulgaris) Hairy Root Cultures. Z. Naturforschung 2002, 57, 640–644. [Google Scholar] [CrossRef] [PubMed]
- Czapski, J.; MikoLajczyk, K.; Kaczmarek, M. Relationship between Antioxidant Capacity of Red Beet Juice and Contents of Its Betalain Pigments. Pol. J. Food Nutr. Sci. 2009, 59, 119–122. [Google Scholar]
- Tesoriere, L.; Allegra, M.; Gentile, C.; Livrea, M.A. Betacyanins as phenol antioxidants. Chemistry and mechanistic aspects of the lipoperoxyl radical-scavenging activity in solution and liposomes. Free Radic. Res. 2009, 43, 706–717. [Google Scholar] [CrossRef] [PubMed]
- Wybraniec, S.; Michalowski, T. New Pathways of Betanidin and Betanin Enzymatic Oxidation. J. Agric. Food Chem. 2011, 59, 9612–9622. [Google Scholar] [CrossRef]
- Tesoriere, L.; Fazzari, M.; Angileri, F.; Gentile, C.; Livrea, M.A. In Vitro Digestion of Betalainic Foods. Stability and Bioaccessibility of Betaxanthins and Betacyanins and Antioxidative Potential of Food Digesta. J. Agric. Food Chem. 2008, 56, 10487–10492. [Google Scholar] [CrossRef] [PubMed]
- Schliemann, W.; Cai, Y.; Degenkolb, T.; Schmidt, J.; Corke, H. Betalains of Celosia argentea. Phytochemistry 2001, 58, 159–165. [Google Scholar] [CrossRef]
- Oney-Montalvo, J.E.; Avilés-Betanzos, K.A.; Ramírez-Rivera, E.d.J.; Ramírez-Sucre, M.O.; Rodríguez-Buenfil, I.M. Polyphenols Content in Capsicum Chinese Fruits at Different Harvest Times and their Correlation with the Antioxidant Activity. Plants 2020, 9, 1394. [Google Scholar] [CrossRef] [PubMed]
- Yan, M.; Wang, Y.; Watharkar, R.B.; Pu, Y.; Wu, C.; Lin, M.; Lu, D.; Liu, M.; Bao, J.; Xia, Y. Physicochemical and antioxidant activity of fruit harvested from eight jujube (Ziziphus jujuba Mill.) cultivars at different development stages. Sci. Rep. 2022, 12, 2272. [Google Scholar] [CrossRef] [PubMed]
- Bartwal, A.; Mall, R.; Lohani, P.; Guru, S.K.; Arora, S. Role of Secondary Metabolites and Brassinosteroids in Plant Defense Against Environmental Stresses. J. Plant Growth Regul. 2012, 32, 216–232. [Google Scholar] [CrossRef]
- Kreslavsky, V.D.; Los, D.A.; Allahverdiev, S.I.; Kuznetsov, V.V. Signal role of reactive oxygen species under stress in plants. Plant Physiol. 2012, 59, 141–154. (In Russian) [Google Scholar]
- Herbach, K.M.; Stintzing, F.C.; Carle, R. Impact of Thermal Treatment on Color and Pigment Pattern of Red Beet (Beta vulgaris L.) Preparations. J. Food Sci. 2006, 69, C491–C498. [Google Scholar] [CrossRef]
- Wybraniec, S. Formation of Decarboxylated Betacyanins in Heated Purified Betacyanin Fractions from Red Beet Root (Beta vulgaris L.) Monitored by LC−MS/MS. J. Agric. Food Chem. 2005, 53, 3483–3487. [Google Scholar] [CrossRef]
- Nizioł-Łukaszewska, Z.; Gawęda, M. Changes in quality of selected red beet (Beta vulgaris L.) cultivars during the growing season. Folia Hortic. 2014, 26, 139–146. [Google Scholar] [CrossRef]
- Nizioł-Łukaszewska, Z.; Gawęda, M. Selected Indicators of The Root Quality of Fifteen Cultivars of Red Beet (Beta Vulgaris L.). J. Hortic. Res. 2015, 23, 65–74. [Google Scholar] [CrossRef]
- Sokolova, D.V.; Shvachko, N.A.; Mikhailova, A.S.; Popov, V.S. Betalain content and morphological characteristics of table beet accessions: Their interplay with abiotic factors. Agronomy 2022, 12, 1033. [Google Scholar] [CrossRef]


| VIR Catalogue No. | Cultivar Name | Origin | Beetroot Color |
|---|---|---|---|
| k-3151 | Bordo Odnosemyannaya | Russia | Maroon |
| k-3677 | Detroit Rubinovy–5 | Russia | Maroon |
| k-3698 | Russkaya Odnosemyannaya | Russia | Maroon |
| k-3880 | Boldor | Netherlands | Yellow |
| k-4017 | Serdolik | Russia | Yellow |
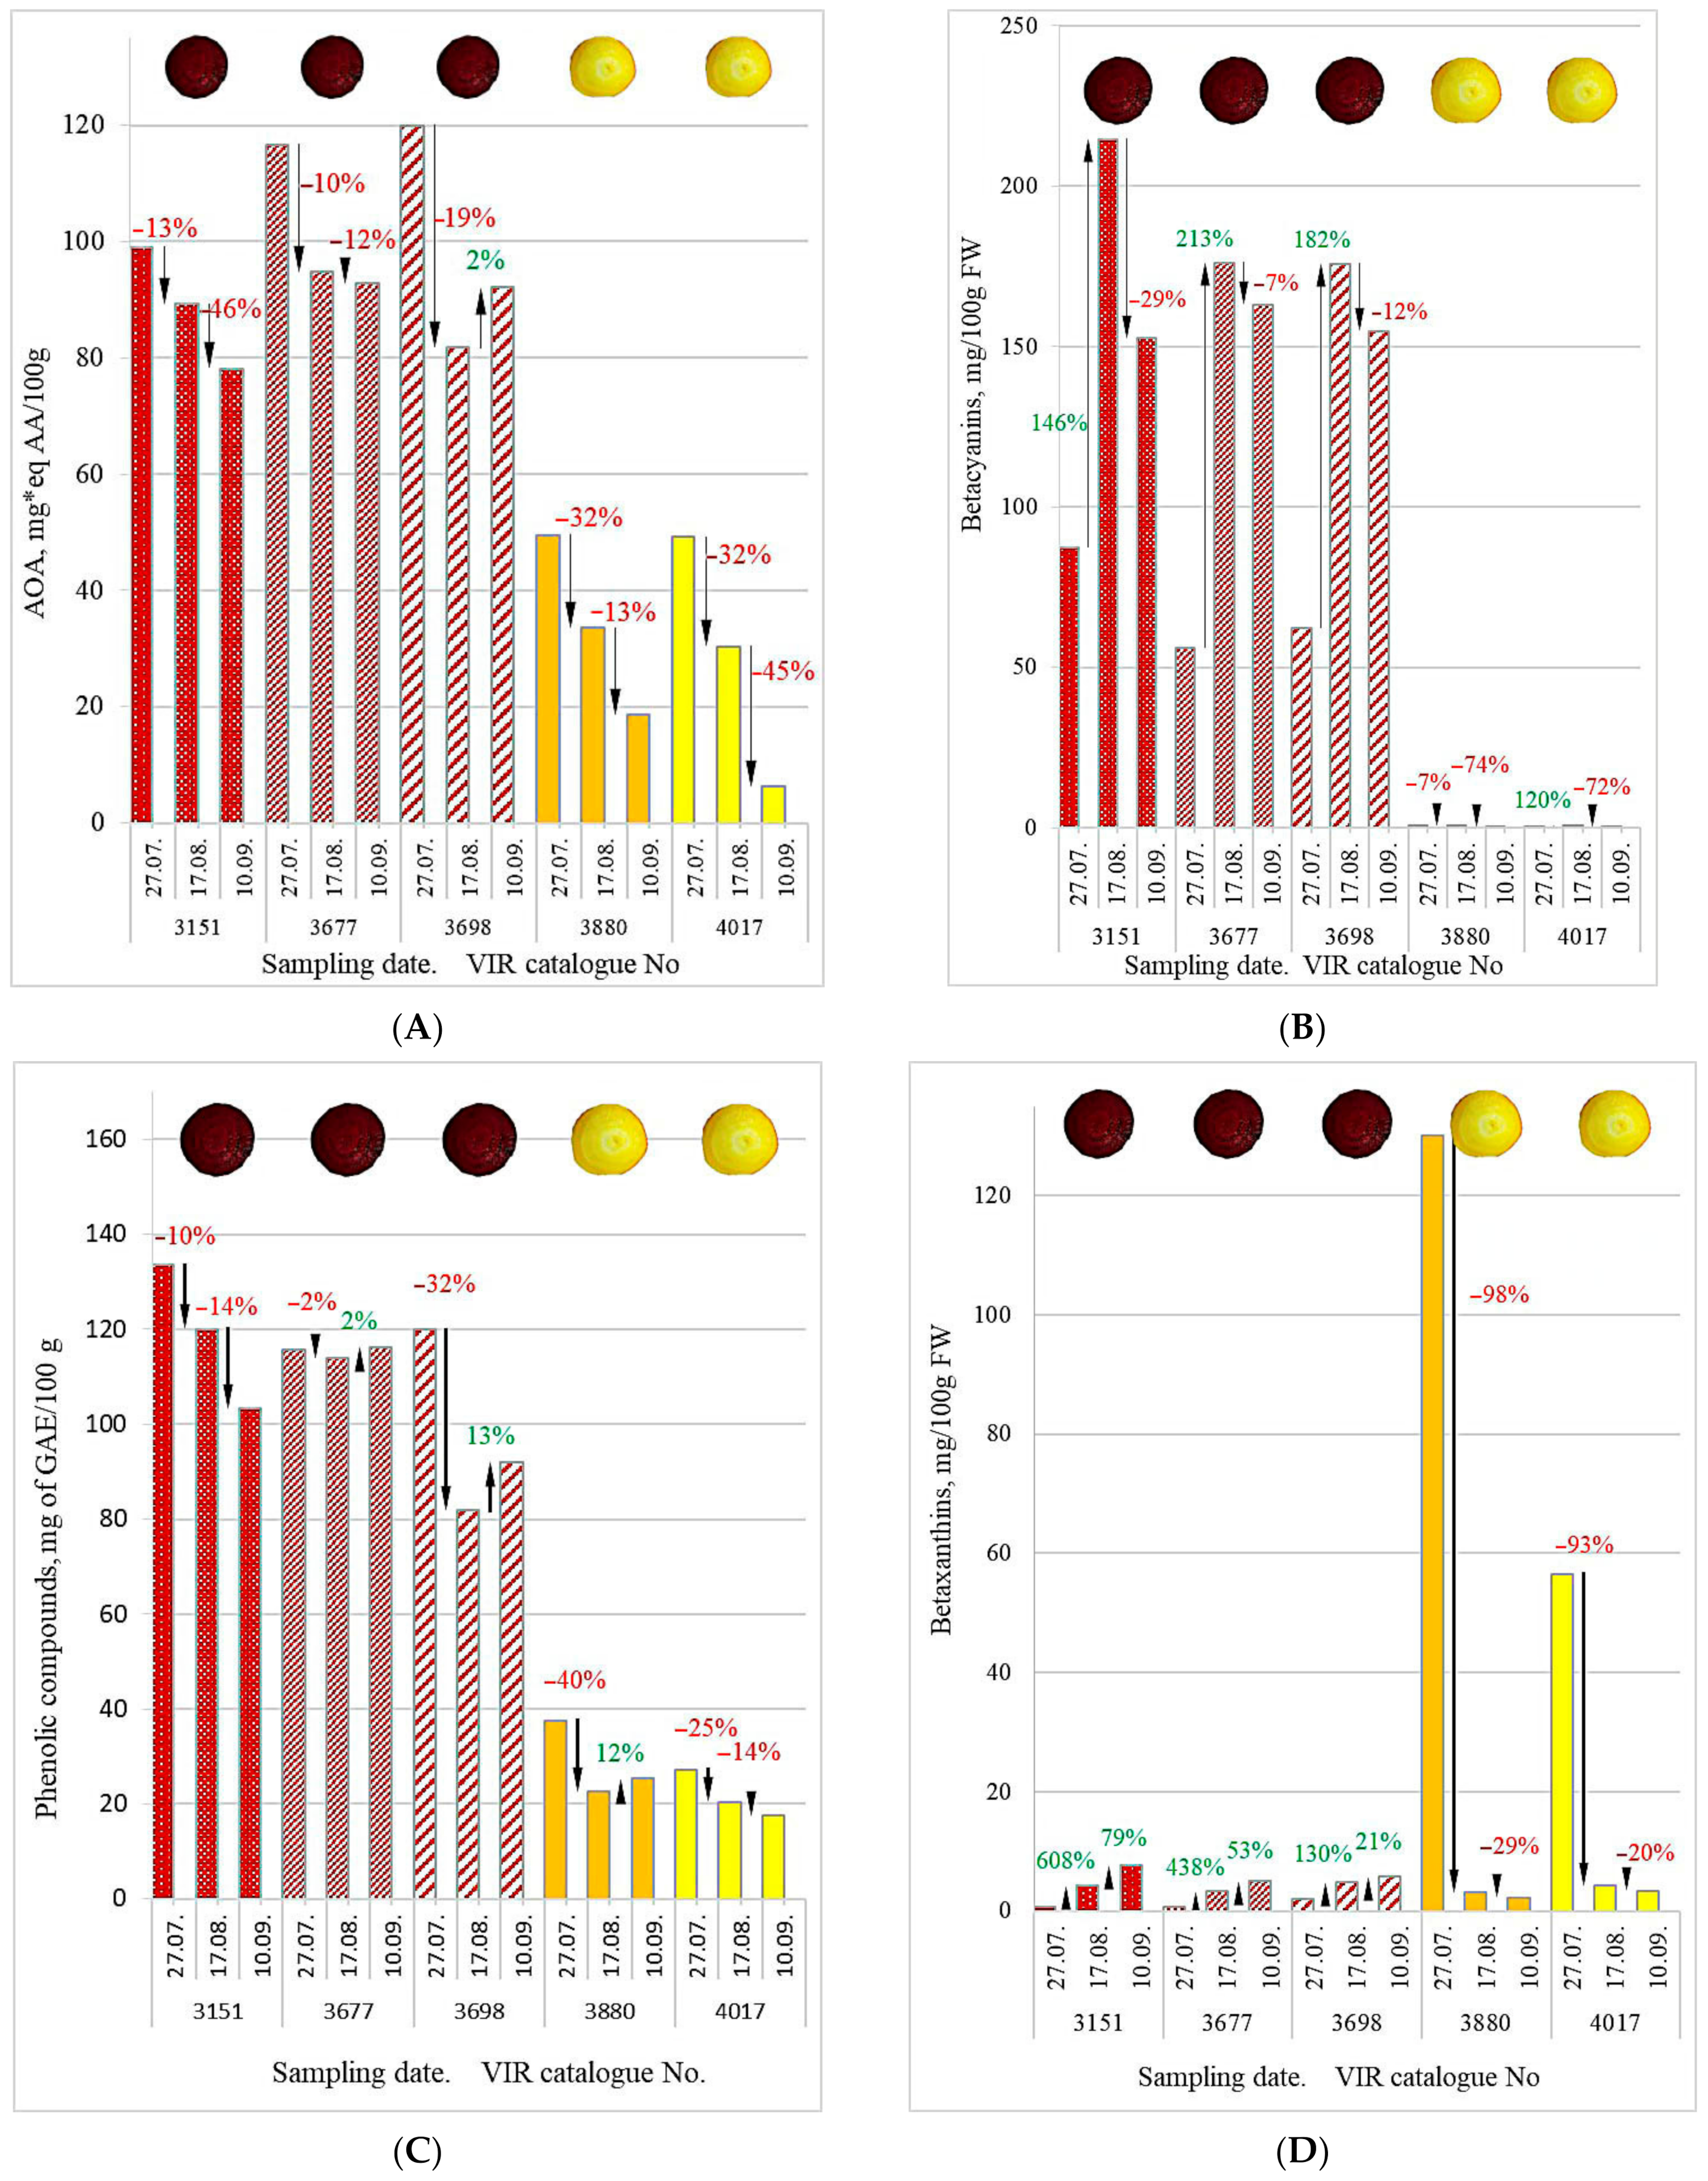
| VIR Catalogue No. | Beetroot Color | AOA, mg*eq AA/100 g | Betalains, mg/100 g FW | ||||
|---|---|---|---|---|---|---|---|
| Dates of Analysis | |||||||
| 27 July | 17 August | 10 September | 27 July | 17 August | 10 September | ||
| k-3151 |  | 99.11 | 89.21 | 78.12 | 87.96 | 218.80 | 160.14 |
| k-3677 | 116.66 | 94.75 | 92.77 | 56.80 | 179.37 | 168.05 | |
| k-3698 | 119.96 | 81.81 | 92.11 | 64.47 | 180.50 | 160.61 | |
| Mean | 111.91 | 88.59 | 87.67 | 69.74 | 192.89 | 162.93 | |
| SD | 11.21 | 6.49 | 8.27 | 16.23 | 22.46 | 4.44 | |
| k-3880 |  | 49.47 | 33.50 | 18.59 | 130.94 | 3.86 | 2.40 |
| k-4017 | 49.21 | 30.33 | 6.18 | 56.50 | 4.99 | 3.55 | |
| Mean | 49.34 | 31.91 | 12.38 | 93.72 | 4.42 | 2.97 | |
| SD | 0.18 | 2.24 | 8.77 | 52.64 | 0.80 | 0.81 | |
| Parameters | M ± SE * (Cv ***, %), Median (Min ÷ Max) ** | ||||
|---|---|---|---|---|---|
| k-3151 | k-3677 | k-3698 | k-3880 | k-4017 | |
| Dry matter, % | 16.63 ± 1.10 (11.5) a | 15.83 ± 1.33 (14.6) a | 15.79 ± 1.34 (14.7) a | 13.28 ± 0.93 (12.2) a | 15.52 ± 1.24 (13.8) a |
| Protein, % | 6.40 ± 0.44 (11.8) a | 5.90 ± 0.55 (16.2) a | 5.87 ± 0.33 (9.7) a | 6.83 ± 0.34 (8.6) a | 7.10 ± 0.29 (7.0) a |
| Ascorbic acid, mg/100 g | 42.63 ± 13.92 (56.6) a | 39.50 ± 10.19 (44.7) a | 37.93 ± 2.74 (12.5) a | 35.58 ± 2.38 (11.6) a | 34.80 ± 3.85 (19.2) a |
| Monosaccharides, % | 1.25 ± 0.54 (75.4) a | 0.99 ± 0.17 (28.9) a | 1.02 ± 0.11 (18.6) a | 0.68 ± 0.18 (45.6) a | 0.92 ± 0.28 (51.8) a |
| Disaccharides, % | 8.71 ± 1.69 (33.5) a | 8.67 ± 1.55 (30.9) a | 8.67 ± 1.25 (25.0) a | 6.94 ± 1.40 (34.9) a | 7.62 ± 1.25 (28.5) a |
| Total sugars, % | 9.96 ± 1.41 (24.5) a | 9.66 ± 1.54 (27.6) a | 9.68 ± 1.28 (22.9) a | 7.62 ± 1.38 (31.4) a | 8.54 ± 1.01 (20.4) a |
| Organic acids, % | 0.51 ± 0.11 (38.0) a | 0.37 ± 0.09 (40.3) a | 0.44 ± 0.12 (47.6) a | 0.59 ± 0.08 (23.0) a | 0.53 ± 0.08 (26.6) a |
| Total phenolics, mg of GAE/100 g | 118.97 (103.3 ÷ 133.6) b | 115.32 (113.9 ÷ 116.3) b | 96.43 (74.4 ÷ 112.3) b | 28.47 (22.5 ÷ 37.5) a | 21.71 (17.5 ÷ 27.1) a |
| Chlorophyll a, mg/100 g | 0.15 (0.1 ÷ 0.3) a | 0.15 (0.1 ÷ 0.2) a | 0.11 (0.08 ÷ 0.1) b | 0.41 (0.2 ÷ 0.5) a | 0.28 (0.1 ÷ 0.4) a |
| Chlorophyll b, mg/100 g | 0.25 (0.1 ÷ 0.3) a | 0.25 (0.2 ÷ 0.4) a | 0.13 (0.04 ÷ 0.2) b | 0.47 (0.1 ÷ 0.8) a | 0.25 (0.1 ÷ 0.4) a |
| Chlorophylls, mg/100 g | 0.40 (0.1 ÷ 0.6) a | 0.40 (0.3 ÷ 0.6) a | 0.24 (0.1 ÷ 0.3) b | 0.88 (0.6 ÷ 1.3) a | 0.52 (0.4 ÷ 0.7) a |
| Carotenoids, mg/100 g | 0.42 (0.25 ÷ 0.7) a | 0.37 (0.1 ÷ 0.7) a | 0.34 (0.2 ÷ 0.4) a | 0.23 (0.1 ÷ 0.6) a | 0.18 (0.1 ÷ 0.35) b |
| Betacyanins, mg/100 g FW | 151.49 (87.3 ÷ 214.6) b | 131.82 (56.2 ÷ 176.1) b | 131.01 (62.4 ÷ 175.7) b | 0.58 (0.2 ÷ 0.8) a | 0.35 (0.0 ÷ 0.8) a |
| Betaxanthins, mg/100 g FW | 4.14 (0.6 ÷ 7.6) b | 2.92 (0.6 ÷ 4.9) b | 4.18 (2.1 ÷ 5.7) b | 45.15 (2.2 ÷ 130.1) a | 21.3 (3.3 ÷ 56.5) a |
| AOA, mg*eq AA/100 g | 88.81 (78.1 ÷ 99.1) b | 101.39 (92.8 ÷ 116.7) b | 97.96 (81.8 ÷ 119.9) b | 33.85 (18.6 ÷ 49.5) a | 28.57 (6.2 ÷ 49.2) a |
| DPPH, % | 42.34 (39.3 ÷ 47.5) b | 49.83 (43.7 ÷ 58.2) b | 47.69 (35.6 ÷ 60.2) b | 9.43 (5.5 ÷ 17.2) a | 6.92 (0.15 ÷ 17.1) a |
| Betalains | Trivial Name/Abbreviation | a λ max [nm] |  |  |
|---|---|---|---|---|
| Betacyanins | ||||
| 6′-O-Sulfate-betanin | Prebetanin | 538 | + | + |
| Betanidin 5-O-β-glucoside | Betanin | 537 | + | + |
| Isoprebetanin | 538 | + | + | |
| Betanidin | Betanidin | 539 | + | - |
| Isobetanin | IBt | 537 | + | + |
| 17-Decarboxy-neobetanin | 17-dNBt | 485 | + | - |
| 17-Decarboxy-betanidin | 17-dBt | 433 | + | - |
| 15-Decarboxy-betanidin | 15-dBt | 433 | + | - |
| 17-Decarboxy-betanin | 507 | + | - | |
| 17-Decarboxy-isobetanidin | 17-IdBt | 510 | + | - |
| 2,17-Bidecarboxy-betanin | 2,17-dBt | 507 | + | - |
| 2,17-Bidecarboxy-neobetanin | 2,17-dNBt | 485 | + | - |
| 6′-O-Feruloyl-betanin | 532 | + | - | |
| 6′-O-Feruloyl-isobetanin | 532 | + | - | |
| 2-Decarboxy-isobetanin | 2-IdBt | 535 | + | - |
| 2-Decarboxy-betanin | 2-dBt | 535 | + | - |
| Betaxanthin | ||||
| Glutamine-betaxanthin | Vulgaxanthin I | 475 | + | + |
| Valine-betaxanthin | 470 | + | + | |
| Leucine-betaxanthin | Vulgaxanthin IV | 471 | + | + |
| Tryptophan-betaxanthin | 470 | - | + | |
| Tyramine-betaxanthin | Miraxanthin III | 452 | - | + |
| Phenylalanine-betaxanthin | 472 | - | + | |
| 3-Methoxytyramine-betaxanthin | 456 | - | + | |
| Threonine-betaxanthin | 471 | - | + | |
| Aspartic acid-betaxanthin | Miraxanthin II | 470 | - | + |
| γ-Aminobutyric-acid-betaxanthin | GABA-betaxanthin | 455 | + | + |
Disclaimer/Publisher’s Note: The statements, opinions and data contained in all publications are solely those of the individual author(s) and contributor(s) and not of MDPI and/or the editor(s). MDPI and/or the editor(s) disclaim responsibility for any injury to people or property resulting from any ideas, methods, instructions or products referred to in the content. |
© 2024 by the authors. Licensee MDPI, Basel, Switzerland. This article is an open access article distributed under the terms and conditions of the Creative Commons Attribution (CC BY) license (https://creativecommons.org/licenses/by/4.0/).
Share and Cite
Sokolova, D.V.; Shvachko, N.A.; Mikhailova, A.S.; Popov, V.S.; Solovyeva, A.E.; Khlestkina, E.K. Characterization of Betalain Content and Antioxidant Activity Variation Dynamics in Table Beets (Beta vulgaris L.) with Differently Colored Roots. Agronomy 2024, 14, 999. https://doi.org/10.3390/agronomy14050999
Sokolova DV, Shvachko NA, Mikhailova AS, Popov VS, Solovyeva AE, Khlestkina EK. Characterization of Betalain Content and Antioxidant Activity Variation Dynamics in Table Beets (Beta vulgaris L.) with Differently Colored Roots. Agronomy. 2024; 14(5):999. https://doi.org/10.3390/agronomy14050999
Chicago/Turabian StyleSokolova, Diana V., Natalia A. Shvachko, Aleksandra S. Mikhailova, Vitaliy S. Popov, Alla E. Solovyeva, and Elena K. Khlestkina. 2024. "Characterization of Betalain Content and Antioxidant Activity Variation Dynamics in Table Beets (Beta vulgaris L.) with Differently Colored Roots" Agronomy 14, no. 5: 999. https://doi.org/10.3390/agronomy14050999