
Influence of Ti Vacancy Defects on the Dissolution of O-Adsorbed Ti(0001) Surface: A First-Principles Study

1
Key Laboratory of Advanced Technologies of Materials, Ministry of Education of China, School of Physical Science and Technology, Southwest Jiaotong University, Chengdu 610031, China
2
Sichuan Province International Science and Technology Cooperation Base of Functional Materials, College of Medicine, Southwest Jiaotong University, Chengdu 610031, China
3
College of Physics and Engineering, Chengdu Normal University, Chengdu 611130, China
*
Authors to whom correspondence should be addressed.
Metals 2024, 14(5), 573; https://doi.org/10.3390/met14050573
Submission received: 10 April 2024
/
Revised: 4 May 2024
/
Accepted: 10 May 2024
/
Published: 13 May 2024
(This article belongs to the Special Issue Application of First Principle Calculation in Metallic Materials)
Abstract
:To investigate the dissolution mechanism of Ti metal, ab initio calculations were conducted to observe the impact of Ti vacancy defects on the O-adsorbed Ti(0001) surface, focusing on the formation energies of Ti vacancy, geometric structures, and electronic structures. The surface structures subsequent to Ti dissolution were simulated by introducing a Ti cavity on both clean and O-adsorbed Ti(0001) surfaces. Our findings indicated that Ti vacancy formation energies and electrochemical dissolution potential on the O-adsorbed Ti(0001) surface surpassed those on the clean surface, and they increased with increasing O coverage. This suggested that O adsorption inhibited Ti dissolution and enhanced O atom interaction with the Ti surface as O coverage increased. Furthermore, at higher O coverage, Ti vacancies contributed to the strengthening of Ti-O bonds on the O-adsorbed Ti(0001) surface, indicating that Ti dissolution aided in stabilizing the Ti surface. The formation of Ti vacancies brought the atomic ratio of Ti to O on the Ti surface closer to that of TiO2, potentially explaining the increased stability of the structure with Ti vacancies.
1. Introduction
Under atmospheric conditions, titanium (Ti) manifests in two allotropes: an α-phase featuring a hexagonal close-packed (HCP) structure below 882 °C and a β-phase characterized by a body-centered cubic (BCC) arrangement above this temperature threshold [1]. Commercially pure titanium, denoted as α-Ti, finds extensive application in biomedicine (including orthopedic implants and dental instruments), as well as in aerospace engineering [2]. This popularity stems from its remarkable properties, including excellent fatigue strength, low density, high tensile strength, lightweight nature, exceptional biocompatibility, and outstanding resistance to corrosion [3].
When titanium (Ti) implants are introduced into the high-oxygen, saline, and electrolytic milieu of the human body, the Ti surface undergoes gradual degradation due to electrochemical processes, a phenomenon termed as corrosion of Ti implants [2]. Consequently, the corrosion of surgical Ti implants, a significant determinant of their service life, cannot ensure their long-term stability [4]. This corrosion process compromises the chemical and physical stability of the surface, potentially leading to various side effects [3]. For instance, Olmedo et al. have demonstrated an association between per-implantitis (a site-specific infectious disease) and ion corrosion of the Ti surface [5]. One approach to modify the corrosion resistance of Ti implants involves alloying them with elements such as aluminum, vanadium, niobium, zirconium, rhenium, chromium, nickel, or manganese [6]. However, the dissolution of these alloy components may also pose adverse effects on the human body [7]. Despite numerous experimental investigations into Ti implant dissolution, the underlying dissolution mechanism remains incompletely elucidated, and research into Ti dissolution at the electronic level remains limited.
A strong affinity between titanium (Ti) and oxygen (O) atoms facilitates the formation of an oxide film, thereby enhancing corrosion resistance and mitigating Ti dissolution. Oxygen adsorption facilitates instant repair of any damaged oxide film; conversely, the degradation of the oxide film can lead to Ti corrosion under anaerobic conditions [8]. In environments with acidic conditions, such as the oral cavity where titanium is often used as a dental implant, the presence of fluoride in toothpaste can lead to the generation of hydrofluoric acid (HF), which, at certain concentrations, can corrode the oxide film protecting the implant, resulting in corrosion [9]. Thus, oxygen plays a crucial role in stabilizing Ti and regenerating oxide films that have been compromised for various reasons. Moreover, the equilibrium phase diagram, as determined by Sahoo et al. [10] using ab initio thermodynamic methods, indicates that clean Ti surfaces are nearly non-existent under room temperature and atmospheric pressure. Hence, it is imperative to investigate how O adsorption influences Ti dissolution.
Greeley and Nørskov proposed an ab initio thermodynamics method to assess the dissolution tendencies of alloys in acidic environments, enabling the calculation of the dissolution potential of solute metal atoms on alloy surfaces [11]. Ma et al. [12] utilized a similar approach to investigate the influence of alloying elements on Pt dissolution. Wang et al. employed this thermodynamic framework to explore the selective corrosion of the B2 and B19′ phases of NiTi alloys, comparing the dissolution tendencies of Ni and Ti atoms [13]. In our recent work [14], we employed density functional theory (DFT) calculations to elucidate how oxygen (O) adsorption affected the corrosion behavior of α-Ti. Additionally, we investigated the impact of oxidation on the dissolution potential of Ti using the thermodynamic method proposed by Greeley and Nørskov. Our results demonstrated that oxidation impeded Ti dissolution by elevating the potential of the Ti atoms at the dissolved surface. However, the influence of Ti dissolution on the geometric and electronic structures, as well as the bonding of Ti metals—essential factors for understanding Ti dissolution—was not further explored in our recent work.
In this investigation, we selected the most stable crystallographic surface, namely, the Ti(0001) surface [15], to delve deeper into the dissolution mechanism of α-Ti. Building upon our recent research [14], to ensure thorough consideration of the changes in various properties with varying oxygen coverage and to prevent overlooking crucial information, we meticulously examined the oxygen coverage of the Ti surface. We evaluated the influence of O adsorption on the electrochemical dissolution potential of α-Ti metal by introducing Ti vacancy defects on both clean and O-adsorbed Ti(0001) surfaces. The mechanism of Ti vacancy defects acting on O-adsorbed Ti(0001) surfaces under various O coverage was investigated by first-principles calculations. Our findings confirmed that from a thermodynamic perspective, O adsorption mitigated Ti dissolution, and Ti vacancies rendered the Ti metal more resistant to corrosion.
2. Computational Details
The Cambridge Sequential Total Energy Package (CASTEP) code [16] was employed for all density functional theory (DFT) computations. The exchange–correlation interaction was characterized by applying the generalized gradient approximation (GGA) and Perdew–Burke–Ernzerhof (PBE) functional. The ultra-soft pseudopotential was chosen to describe the electron–ionic core interactions. An energy cutoff of 450 eV and a k-point grid of 5 × 5 × 1 were set. The Ti(0001) surface was represented by a five-atomic-layer slab with 20 Å vacuum layers between in a 3 × 3 supercell (see Figure 1a). Only the bottom two layers of Ti atoms were constrained, while the other layers were fully relaxed. Convergence criteria were set at 10−5 eV/atom for energy, 0.03 eV/Å for maximum force, and 0.001 Å for maximum displacement. The valence electronic configurations involved in the calculations were as follows: Ti 3d24s2 and O 2s22p4. Electron occupancies were determined with a smearing width of 0.02 eV. To account for van der Waals interactions correction and the induced dipole moment produced by adsorbed O atoms, the DFT-D3 method [17] and the dipole correction [18] were applied, respectively. Comparing the calculated lattice parameters of bulk Ti and the work function of the clean Ti(0001) surface with other calculations and experimental results (Table 1), it was evident that they were in agreement with previous experimental and DFT studies, indicating the reasonableness of the parameters employed in this study.
3. Results and Discussion
3.1. Adsorption Behavior of O Atom on the Ti(0001) Surface
Four adsorption sites of O atoms are considered in Figure 1b. The average adsorption energy per O atom on the Ti(0001) surface, denoted as , is calculated as follows [26]:
where represents the number of adsorbed O atoms; and denote the energies of the clean and O-adsorbed Ti(0001) slabs, respectively; and represents the energy of the spin-polarized O2 molecule. A positive value for indicates an exothermic (thermodynamically favorable) adsorption.
The Eads at different O-adsorbed sites are presented in Figure 2. Initially, the position of the O atom was found to be unstable at the bridge and top sites, while it was stable at the Hcp and Fcc sites. The Eads of the O atom at the Fcc site (approximately 6.06 eV) exceeded that at the Hcp site (approximately 5.72 eV), indicating that the O atom was most stable at the Fcc site. This observation was consistent with previous studies [14,27]. Consequently, the Fcc site was selected for O atom adsorption in the subsequent calculations.
The adsorption behavior of O atoms at varying coverage was investigated by adsorbing one to nine O atoms on the Ti(0001) surface. The O coverage (θ) was defined as , where and represent the total number of adsorbed O atoms and the total number of Ti atoms in the first Ti layer, respectively. To elucidate the interaction between O atoms on the surface at high θ, the concept of indirect interaction energy () was introduce. at a specific θ was calculated as follows [28]:
where represents the at the corresponding , and represents the at . was negative for attractive interactions and positive for repulsive ones.
Figure 3 illustrates the variations in and of the O-adsorbed Ti(0001) surface with different θ. Positive values, as depicted in Figure 3a, signified that O adsorption was exothermic and hence thermodynamically favorable. The Ti(0001) surface readily adsorbed the highly electronegative O atoms, resulting in longitudinal Ti-O interactions. In Figure 3b, the positive values increased significantly with increasing θ, thereby amplifying the electrostatic repulsion and electrostatic energies between the O atoms. Consequently, the horizontal repulsion between O atoms increased with , while decreased. Similar observations were made for O adsorbed on other metallic surfaces [29]. Notably, at high θ (), the values exhibited a sharp increase (refer to the orange transparent area in Figure 3b), indicating a significant rise in repulsion between O atoms. This may also have led to a sharp decline in (refer to the orange transparent area in Figure 3a).
3.2. Ti Vacancy Formation Energy
The dissolution activation energy of Ti metal serves as an electrochemical kinetic parameter, challenging to accurately estimate either through modeling or experiment means. In Figure 4, following our recent methodology [14], we simulate the surface structure post-Ti dissolution by constructing a Ti cavity at the center of the clean and O-adsorbed Ti(0001) surfaces. The dissolution activation energy was assessed using the Ti vacancy formation energy (), which was required to create a Ti vacancy defect. The Ti vacancy formation energy () represented the energy required to remove a Ti atom from the Ti surface, and it could be calculated as follows [30]:
where denotes the energy of the slab without a vacancy defect, represents the energy of the slab with a vacancy defect, and is the energy of the removed atom. Given that depended on the location from which the Ti atom was removed and to avoid removing Ti atoms at the surface edge, the Ti atom was consistently removed from the central position of the surface Ti layer in all models. Generally, increased with the surface stability [31]. The higher the , the greater the difficulty in dissolving Ti atoms.
Figure 5 illustrates the calculated . The on the O-adsorbed Ti(0001) surface was greater than that on the clean surface. At low θ (), values closely resembled those of the clean surface, at 0.433 eV, with minimal variation. However, at high θ (), exhibited a significant increase, as depicted in the orange transparent area. When the adsorbed O atom approached the monolayer ( ), the value changed gradually. This suggested that O adsorption near the monolayer could notably raise the energy required for Ti dissolution from a thermodynamic perspective. Furthermore, was positive, indicating that Ti atoms departed from the Ti surface endothermically. Considering the electrochemical corrosion mechanism [32], our recent research has shed light on the origin of this heat [14].
3.3. Electrochemical Potential Shift
Building upon our previous derivation [14], the influence of O adsorption on the electrochemical dissolution potential of the Ti surface could be evaluated through the electrochemical potential shift (ΔU) and chemical potential difference (Δµ), which were determined by the following equations:
where and represent the chemical potentials of Ti atoms released from the clean and O-adsorbed Ti(0001) surfaces, respectively. Thus, indicates the difference in chemical potentials required to release Ti atoms from the clean and O-adsorbed Ti(0001) surfaces, while U signifies the shift in the electrochemical dissolution potential of the O-adsorbed Ti(0001) surface compared with the clean surface. As elucidated in our previous study [14], the slab models with Ti vacancy defects were employed to investigate ΔU and of both clean and O-adsorbed Ti(0001) surfaces under different θ. The value was negative, indicating that the O-adsorbed Ti(0001) surface was more stable than the clean surface. A more negative value suggested stronger interaction between the adsorbed O atoms and the surface Ti atoms. Conversely, the U value was positive, suggesting that a higher electrochemical dissolution potential was required to release Ti atoms from the O-adsorbed Ti(0001) surface. In other words, the dissolution of the O-adsorbed Ti(0001) surface was more challenging than that of the clean surface. A higher positive U value indicated stronger interaction between the adsorbed O atoms and the surface Ti atoms.
Figure 6 illustrates the calculated µ and U. All calculated µ values were negative, indicating an enhancement in the stability of the Ti(0001) surface due to O adsorption. Moreover, all calculated U values were positive, implying an increase in the electrochemical dissolution potential of the Ti(0001) surface upon O adsorption. Consequently, the dissolution of the O-adsorbed Ti(0001) surface became more challenging.
At low θ (), the change in Δµ or ΔU values was minimal. However, at high θ (), the Δµ values became more negative, and the ΔU values became more positive, as indicated in the orange transparent area. This observation underscored a significant strengthening in the interactions between the adsorbed O atoms and the surface Ti atoms. Once again, this highlighted the significant enhancement in the interaction with surface Ti atoms when O was adsorbed near the monolayer.
3.4. Geometric Structures
To explore the influence of Ti vacancy on the geometric structure of the Ti(0001) slab, the geometric structural parameters of the Ti-O slab are presented in Figure 7. In Figure 7b, denotes the vertical distance between O and surface Ti atoms, while represents the bond length of the Ti-O bond. Both and are averages. It is evident from the data that both and values decreased with increasing θ. Specifically, the values of the Ti(0001)/O-vac slab were smaller than those of the Ti(0001)/O slab. Similarly, the values of the Ti(0001)/O-vac slab were less than those of the Ti(0001)/O slab at high θ (), as indicated in the orange transparent area. This suggested a strengthening of the Ti-O bonds with increasing O adsorption, with the enhancing effect of a Ti vacancy on the Ti-O bonds becoming more pronounced when the adsorbed O atom was close to the monolayer.
Figure 7c illustrates the variation in spacing between adjacent atomic layers of the Ti-O slab. The percentage change in spacing () is defined as , where is the spacing between adjacent atomic layers i and j after O adsorption or creating a Ti vacancy, and is the spacing between adjacent atomic layers i and j of the clean surface. For the Ti(0001)/O slab, represents the variation in spacing between the first and second layers of the Ti surface after O adsorption, while represents the variation in spacing between the second and third layers of the Ti surface after O adsorption. Similarly, for the Ti(0001)/O-vac slab, and represent the variation in spacing between adjacent atomic layers of the Ti surface after creating a Ti vacancy.
As depicted in Figure 7c, the values of the Ti(0001)/O slab were positive and increased with increasing θ, indicating that O adsorption expanded , with the degree of expansion increasing with the amount of O adsorption. Similarly, the values of the Ti(0001)/O-vac slab were positive, suggesting that a Ti vacancy also expanded , with the degree of expansion increasing with increasing θ. At high θ (), as indicated in the orange transparent area, the expansion degree of the Ti(0001)/O-vac slab was greater than that of the Ti(0001)/O slab. This indicated that the Ti vacancy assisted in enlarging , facilitating closer binding of surface Ti atoms with O atoms. Furthermore, the values of the Ti(0001)/O slab were negative and decreased with increasing θ, indicating that O adsorption reduced , with the degree of contraction increasing with the amount of O adsorption. Similarly, the values of the Ti(0001)/O-vac slab were negative, indicating that a Ti vacancy also reduced , with the degree of contraction increasing with increasing θ. At high θ () as indicated in the orange transparent area, the contraction degree of the Ti(0001)/O-vac slab was close to that of the Ti(0001)/O slab. This suggested that the effect of the Ti vacancy on was reduced, resulting in surface Ti atoms being closer to O atoms. These findings demonstrated that Ti dissolution facilitated the combination of surface Ti with O, providing an insight into the combination of Ti and O atoms from a geometric structure perspective.
3.5. Electronic Structures
In Figure 8 and Figure 9, the electron density difference and electron density analyses were conducted to delve deeper into the bonding nature between O and Ti atoms. Within the charge density difference diagram (refer to Figure 8), a conspicuous augmentation in electron density around the O atoms was observed, juxtaposed with a diminution in electron density around the Ti atoms neighboring O, thus implying an electron transfer from Ti to O. This phenomenon instigated electron redistribution across the surface. Moreover, the electron gain and loss distribution on the Ti(0001)/O-vac surface (see Figure 8a–d) manifested variances from that observed on the Ti(0001)/O surface (see Figure 8e–h), elucidating that Ti vacancies precipitated electron redistribution on the Ti(0001)/O-vac surface. Figure 9, the electron density diagram, delineates electron density overlap between O and Ti atoms on both the Ti(0001)/O and Ti(0001)/O-vac surfaces, thereby suggesting the covalent nature of Ti-O bonds [33] and the chemisorption of atomic O onto the Ti surface. Additionally, an electron density overlap amid O atoms was observed, indicative of an interaction between neighboring O atoms.
Figure 10 illustrates the outcomes of the overlap population analysis [34], which furnished quantitative insights into the atomic bonding between Ti and O, as well as the dissolved nature of Ti. A positive overlap population denoted a bond between two atoms; conversely, a negative overlap population indicated anti-bonding. Notably, the magnitude of the positive overlap population positively correlated with the strength of bonding [34]. For the Ti(0001)/O slab, the parameter experienced a gradual decrease, while the positive population of the Ti-O bond showed a slight increase with rising θ, signifying a gradual enhancement in the strength of the Ti-O bond with increasing O adsorption. These values (the values in Table S1) closely approximated the Ti-O bond (1.92 Å) observed in bulk TiO2 [33]. In contrast, for the Ti(0001)/O-vac slab, decreased, and the positive population of the Ti-O bond increased as θ increased. Particularly noteworthy was the behavior observed at low θ (), where the changes in and the population of Ti-O bonds were minimal. However, at higher θ values (), denoted by the orange transparent area, there was a sudden increase in the changes in and the population of Ti-O bonds. These observations suggested that Ti vacancies significantly diminished the and increased the population of Ti-O bonds at higher θ values (), underscoring the role of Ti vacancies in enhancing Ti-O interactions when O adsorption approached monolayer coverage. Furthermore, at higher θ values (), as indicated in the orange transparent area, the negative overlap population suggested anti-bonding O-O interactions occurring on both Ti(0001)/O and Ti(0001)/O-vac surfaces, resulting in the formation of O-O bonds of approximately 2.8 Å. This observation was consistent with the sharp increase in values at higher θ values () (see Figure 3b), indicating a significant rise in repulsive forces between O atoms.
Figure 11 presents the partial densities of states (PDOSs) for both the Ti(0001)/O and Ti(0001)/O-vac surfaces at coverages of 1/9, 1/3, 2/3, and 1 monolayer (ML). Compared with the clean surface, as highlighted in the orange transparent area in Figure 11a,b, the overlapping of peaks in the O 2p and Ti 3d orbitals on both the Ti(0001)/O and Ti(0001)/O-vac surfaces indicated the formation of Ti-O bonds. This suggested that electron transfer between O and Ti atoms resulted in hybridization of O 2p and Ti 3d orbitals. As the θ increased from 1/9 to 1 ML, the number of peaks in the O 2p and Ti 3d orbitals increased, and the overlapping regions became broader, indicating an enhancement in hybridization and the formation of stronger Ti-O bonds. At higher θ (θ = 2/3 and 1 ML), in comparison with the Ti(0001)/O surface (see Figure 11a), there was an increase in the number of O 2p and Ti 3d orbital peaks on the Ti(0001)/O-vac surface, accompanied by a widening of the overlapping area (see Figure 11b). This suggested that the presence of Ti vacancies intensified hybridization, thereby reinforcing the Ti-O bond. These observations were in line with the results obtained from the overlap population analysis.
The work function (Φ) of both the Ti(0001)/O and Ti(0001)/O-vac surfaces is presented in Figure 12. It is noteworthy that the calculated Φ of the clean surface was 4.431 eV, a value consistent with previously reported theoretical and experimental findings in Table 1. A higher Φ indicated greater stability of surface electrons [35]. At low θ (), the variation in Φ on both the Ti(0001)/O and Ti(0001)/O-vac surfaces was minimal. However, as depicted in the orange transparent area, Φ experienced a sudden increase at higher θ () on both surfaces, with the Φ of the Ti(0001)/O-vac surface surpassing that of the Ti(0001)/O surface. These results suggested that the inhibitory effect of O adsorption on the escape of surface electrons positively correlated with the quantity of adsorbed O atoms, and the presence of the Ti vacancy significantly impeded the escape of surface electrons from the Ti(0001)/O surface.
Furthermore, Φ was associated with the equilibrium potential (). The positive correlation between and Φ can be expressed as follows [36]:
where represents the variation in Φ due to changes in the solution environment. Notably, only when θ = 8/9 and 1 ML does the Ti(0001)/O surface exhibit an increase in Φ compared with the clean surface, indicating that O adsorption can enhance the corrosion resistance of the Ti surface only when the adsorption approaches a monolayer of O atoms. Moreover, at higher θ (θ = 5/9–1 ML), Ti vacancy can render Ti metal more corrosion-resistant by enhancing the stability of surface electrons.
4. Discussion
As illustrated in Figure 13, as the adsorption of O on the Ti surface increased, the O atom layer gradually amalgamated with the surface Ti atoms. Consequently, the surface Ti atoms began to detach from the bulk material (Figure 13c), eventually culminating in the formation of a stable oxide film that exhibited an anticorrosive effect on the surface. The constituents of the oxide film on the Ti surface primarily comprised TiO2, Ti2O3, and TiO [37], among which amorphous TiO2 predominantly conferred protective properties to the surface [21]. According to the theory of amorphous structure, the potential configurations of the surface atomic structure of amorphous TiO2 are myriad. Herein, the most stable phase, rutile (TiO2), was considered representative of the composition of the Ti oxide film. Subsequently, we delved deeper into how Ti vacancies contributed to stabilizing the Ti(0001)/O surface.
It was postulated that only the Ti atoms in the surface layer of the Ti(0001) slab combined with O to form an oxide film. The surface layer of the Ti(0001) slab comprised nine Ti atoms. The atomic ratio of Ti to O is denoted as , where represents the number of Ti atoms in the surface layer of the Ti(0001) slab, thus, ; represents the number of adsorbed O atoms. The atomic ratio of Ti to O in rutile () was assumed to be 1:2.
As increased from 1 to 9, gradually decreased from 9:1 to 1:1, approaching the value of . This indicated that the surface oxide composition of the Ti(0001)/O slab was progressively converging toward that of TiO2, thereby enhancing the stability of the Ti(0001)/O surface. Comparing the Ti(0001)/O and Ti(0001)/O-vac surface, it became evident that the Ti vacancy rendered the Ti(0001)/O-vac surface more stable. This could be interpreted as follows: for the same number of adsorbed O atoms on the Ti(0001) surface, Ti vacancies reduced the value of of the Ti(0001)/O-vac slab, bringing it closer to and thus enhancing stability. For instance, at θ = 1 ML, and ; was closer to , rendering the Ti(0001)/O-vac surface more stable.
5. Conclusions
First-principles calculations provided insights into the dissolution mechanism of Ti metal by examining the impact of Ti vacancies on the O-adsorbed Ti(0001) surface. By inducing Ti vacancies on both clean and O-adsorbed Ti(0001) surfaces, the Ti vacancy formation energies, geometric structures, electronic structures, and electrochemical potential of the Ti surface were investigated.
Analysis of the adsorption energy and indirect interaction energy revealed that the increase in repulsion between O atoms was the primary factor contributing to the sharp decline in adsorption energy. Analysis of the geometric structures revealed that Ti vacancies facilitated the bonding of surface Ti atoms with O atoms. This observation helped explain the high stability of the oxide film from the perspective of the effect of Ti dissolution on the geometric structure. Furthermore, electrochemical potential shift analysis demonstrated that O adsorption inhibited Ti dissolution, while increased O adsorption contributed to the stabilization of the Ti surface. Finally, electronic structure analysis revealed that Ti dissolution contributed to the stabilization of the Ti(0001)/O surface. Work function analysis suggested that Ti vacancies could enhance the corrosion resistance of Ti metal. The formation of Ti vacancies brought the atomic ratio of Ti to O on the Ti surface closer to that of TiO2, which may explain the enhanced stability of structures containing Ti vacancies. Our findings contribute to a better understanding of how Ti metal corrodes from a thermodynamic perspective.
Supplementary Materials
The following are available online at https://www.mdpi.com/article/10.3390/met14050573/s1: Table S1: Overlap population of Ti–O systems under different θ.
Author Contributions
X.W., writing—original draft, methodology, software, and data curation. D.X., conceptualization, validation, resources, writing—review and editing, and funding acquisition. F.J., formal analysis and funding acquisition. D.M., visualization, investigation, and writing—review and editing. Y.L., supervision, project administration, validation, and resources. All authors have read and agreed to the published version of the manuscript.
Funding
This work was supported by the Natural Science Foundation of Sichuan Province, China (2022NSFSC0292), and the Sichuan Science and Technology Program (2022YFH0041).
Data Availability Statement
The original contributions presented in the study are included in the article; further inquiries can be directed to the corresponding authors.
Conflicts of Interest
The authors declare no conflicts of interest.
References
- Uwanyuze, R.S.; Alpay, S.P.; Schaffoner, S.; Sahoo, S. A first principles analysis of oxidation in titanium alloys with aluminum and vanadium. Surf. Sci. 2022, 719, 122026. [Google Scholar] [CrossRef]
- Cometa, S.; Bonifacio, M.A.; Mattioli-Belmonte, M.; Sabbatini, L.; De Giglio, E. Electrochemical Strategies for Titanium Implant Polymeric Coatings: The Why and How. Coatings 2019, 9, 268. [Google Scholar] [CrossRef]
- Huang, C.H.; Chiang, S.Y.V.; Gawkrodger, D.J. The contribution of metal allergy to the failure of metal alloy implants, with special reference to titanium: Current knowledge and controversies. Contact Dermat. 2024, 90, 201–210. [Google Scholar] [CrossRef]
- Alqahtani, A.R.; Gufran, K.; Silva, F.; Rocha, M.G.; Chang, J. A Clinical Case Report of a Potential Acute Allergic Reaction with Titanium Dental Implant. Case Rep. Dent. 2021, 2021, 5592934. [Google Scholar] [CrossRef]
- Chen, L.; Tong, Z.; Luo, H.K.; Qu, Y.; Gu, X.H.; Si, M.S. Titanium particles in peri-implantitis: Distribution, pathogenesis and prospects. Int. J. Oral Sci. 2023, 15, 49. [Google Scholar] [CrossRef]
- Watanabe, M.; Liu, L.P.; Ichikawa, T. Are Allergy-Induced Implant Failures Actually Hypersensitivity Reactions to Titanium? A Literature Review. Dent. J. 2023, 11, 263. [Google Scholar] [CrossRef]
- Kligman, S.; Ren, Z.; Chung, C.H.; Perillo, M.A.; Chang, Y.C.; Koo, H.; Zheng, Z.; Li, C.S. The Impact of Dental Implant Surface Modifications on Osseointegration and Biofilm Formation. J. Clin. Med. 2021, 10, 1641. [Google Scholar] [CrossRef]
- Xie, T.; Yang, Y.; Wang, J.Y.; Ying, T.; Xu, Z.T.; Zeng, X.Q. First-Principles Study of F and H Adsorption on Corrosion Resistance of Titanium Bipolar Plates. Metall. Mater. Trans. A 2023, 54, 3412–3416. [Google Scholar] [CrossRef]
- Tshwane, D.M.; Modiba, R.; Govender, G.; Ngoepe, P.E.; Chauke, H.R. The adsorption of halogen molecules on Ti (110) surface. J. Mater. Res. 2021, 36, 592–601. [Google Scholar] [CrossRef]
- Sahoo, S.; Alpay, S.P.; Hebert, R.J. Surface phase diagrams of titanium in Oxygen, Nitrogen and Hydrogen environments: A first principles analysis. Surf. Sci. 2018, 677, 18–25. [Google Scholar] [CrossRef]
- Greeley, J.; Norskov, J.K. Electrochemical dissolution of surface alloys in acids: Thermodynamic trends from first-principles calculations. Electrochim. Acta 2007, 52, 5829–5836. [Google Scholar] [CrossRef]
- Ma, Y.G.; Balbuena, P.B. Surface properties and dissolution trends of Pt3M alloys in the presence of adsorbates. J. Phys. Chem. C. 2008, 112, 14520–14528. [Google Scholar] [CrossRef]
- Wang, X.T.; Xie, D.; Wei, L.J.; You, D.; Hou, M.X.; Leng, Y.X. DFT investigation of the dissolution trends of NiTi alloys with the B2 and B19′ phases during the initial oxidation stage. Phys. Chem. Chem. Phys. 2023, 25, 19804–19814. [Google Scholar] [CrossRef] [PubMed]
- Wang, X.T.; Xie, D.; Liu, H.Y.; Li, Y.T.; Jing, F.J.; Leng, Y.X. Effects of oxygen adsorption on the corrosion behavior of the Ti(0001) surface: A DFT investigation. Phys. Chem. Chem. Phys. 2024, 26, 7794–7807. [Google Scholar] [CrossRef]
- Liu, J.; Fan, X.F.; Sun, C.Q.; Zhu, W.G. Oxidation of the Ti(0001) surface: Diffusion processes of oxygen from DFT. RSC Adv. 2016, 6, 71311–71318. [Google Scholar] [CrossRef]
- Fan, Y.M.; Zhuo, Y.Q.; Lou, Y.; Zhu, Z.W.; Li, L.L. SeO2 adsorption on CaO surface: DFT study on the adsorption of a single SeO2 molecule. Appl. Surf. Sci. 2017, 413, 366–371. [Google Scholar] [CrossRef]
- Soon, A.; Todorova, M.; Delley, B.; Stampfl, C. Oxygen adsorption and stability of surface oxides on Cu(111): A first-principles investigation. Phys. Rev. B 2006, 73, 165424. [Google Scholar] [CrossRef]
- Neugebauer, J.; Scheffler, M. Adsorbate-Substrate And Adsorbate-Adsorbate Interactions Of Na And K Adlayers on Al(111). Phys. Rev. B. 1992, 46, 16067–16080. [Google Scholar] [CrossRef]
- Fisher, E.S.; Renken, C.J. Single-Crystal Elastic Moduli and the hcp → bcc Transformation in Ti, Zr, and Hf. Phys. Rev. 1964, 135, A482–A494. [Google Scholar] [CrossRef]
- Huda, M.N.; Kleinman, L. Density functional calculations of the influence of hydrogen adsorption on the surface relaxation of Ti(0001). Phys. Rev. B 2005, 71, 241406. [Google Scholar] [CrossRef]
- Meng, X.Z.; Li, X.R.; Li, F.; Yan, H.J.; Zhang, Q.H.; Wu, L.K.; Di Tommaso, D.; Cao, F.H. Molecular Insights into the Stability of Titanium in Electrolytes Containing Chlorine and Fluorine Ions. Langmuir 2023, 39, 17853–17861. [Google Scholar] [CrossRef] [PubMed]
- Feibelman, P.J. Relaxation of hcp(0001) surfaces: A chemical view. Phys. Rev. B 1996, 53, 13740–13746. [Google Scholar] [CrossRef] [PubMed]
- Cho, J.H.; Terakura, K. Plane-wave-basis pseudopotential calculations of the surface relaxations of Ti(0001) and Zr(0001). Phys. Rev. B 1997, 56, 9282–9285. [Google Scholar] [CrossRef]
- Hanson, D.M.; Stockbauer, R.; Madey, T.E. Photon-stimulated desorption and other spectroscopic studies of the interaction of oxygen with a titanium (001) surface. Phys. Rev. B 1981, 24, 5513–5521. [Google Scholar] [CrossRef]
- Kang, Q.X.; Wang, G.F.; Liu, Q.; Sui, X.C.; Liu, Y.K.; Chen, Y.Q.; Luo, S.Y.; Li, Z.L. Theoretical research for oxidation mechanism of α-Ti: A combination of DFT and ab initio molecular dynamics study. Vacuum 2021, 193, 110522. [Google Scholar] [CrossRef]
- Wu, Y.Y.; Wang, X.Y.; Duan, Y.H.; Peng, M.J. Revealing boron adsorption on the α-Ti(0001) surface by first-principles calculations. Philos. Mag. 2022, 102, 1873–1890. [Google Scholar] [CrossRef]
- Wen, P.C.; Yuan, L.J.; Tao, R.; Li, J.; Li, D. First-principles investigation of interaction between surface oxygen and other alloy atoms in Ti(0001) for designing high-temperature titanium alloy. Appl. Surf. Sci. 2022, 604, 154535. [Google Scholar] [CrossRef]
- Duan, Y.H.; Sun, Y.; Zhou, S.G. Different coverages of fluorine adsorption on Mg(0001) surface. Comput. Mater. Sci. 2013, 72, 81–85. [Google Scholar] [CrossRef]
- Zhao, J.P.; Xu, Y.L.; Liu, S.H.; Ding, X.D. The effect of oxygen-containing species on corrosion behavior of Ta(110) surface: A DFT study with an experimental verification. Appl. Surf. Sci. 2022, 586, 152810. [Google Scholar] [CrossRef]
- Zhu, Y.; Zheng, W.G.; Pan, Y.; Pan, Y.F.; Liu, T.; Zhou, X.G.; Shi, D.N.; Shi, Y.G.; Wei, X.Y. Formation and binding energies of vacancies in the Al(111) surface: Density functional theory calculations confirm simple bond model. Surf. Sci. 2015, 637, 85–89. [Google Scholar] [CrossRef]
- Gupta, S.S.; van Huis, M.A.; Dijkstra, M.; Sluiter, M.H.F. Depth dependence of vacancy formation energy at (100), (110), and (111) Al surfaces: A first-principles study. Phys. Rev. B 2016, 93, 085432. [Google Scholar] [CrossRef]
- Cao, C.N. Principles of Electrochemistry of Corrosion, 3rd ed.; Chemical Industrial Press: Beijing, China, 2008. [Google Scholar]
- Yan, C.; Zeng, Q.F.; He, W.J.; Zhu, J.N. First-principles investigation on the adsorption and dissociation of O and H O molecules on the Ni-rich TiNi alloy surface. Appl. Surf. Sci. 2020, 534, 147570. [Google Scholar] [CrossRef]
- Mulliken, R.S. Electronic Population Analysis on LCAO–MO Molecular Wave Functions. I. J. Chem. Phys. 1955, 23, 1833–1840. [Google Scholar] [CrossRef]
- Da Silva, J.L.F. All-electron first-principles calculations of clean surface properties of low-Miller-index Al surfaces. Phys. Rev. B 2005, 71, 195416. [Google Scholar] [CrossRef]
- Trasatti, S. Structure of the metal/electrolyte solution Interface: New data for theory. Electrochim. Acta 1991, 36, 1657–1658. [Google Scholar] [CrossRef]
- Singh, R.; Dahotre, N.B. Corrosion degradation and prevention by surface modification of biometallic materials. J. Mater. Sci: Mater. Med. 2007, 18, 725–751. [Google Scholar] [CrossRef]
Figure 1.
(a) Side view of the Ti(0001) slab. (b) Top view of the Ti(0001) slab, illustrating four adsorption sites on the surface: hexagonal close-packed (Hcp), face-centered cubic (Fcc), bridge, and top.
Figure 1.
(a) Side view of the Ti(0001) slab. (b) Top view of the Ti(0001) slab, illustrating four adsorption sites on the surface: hexagonal close-packed (Hcp), face-centered cubic (Fcc), bridge, and top.
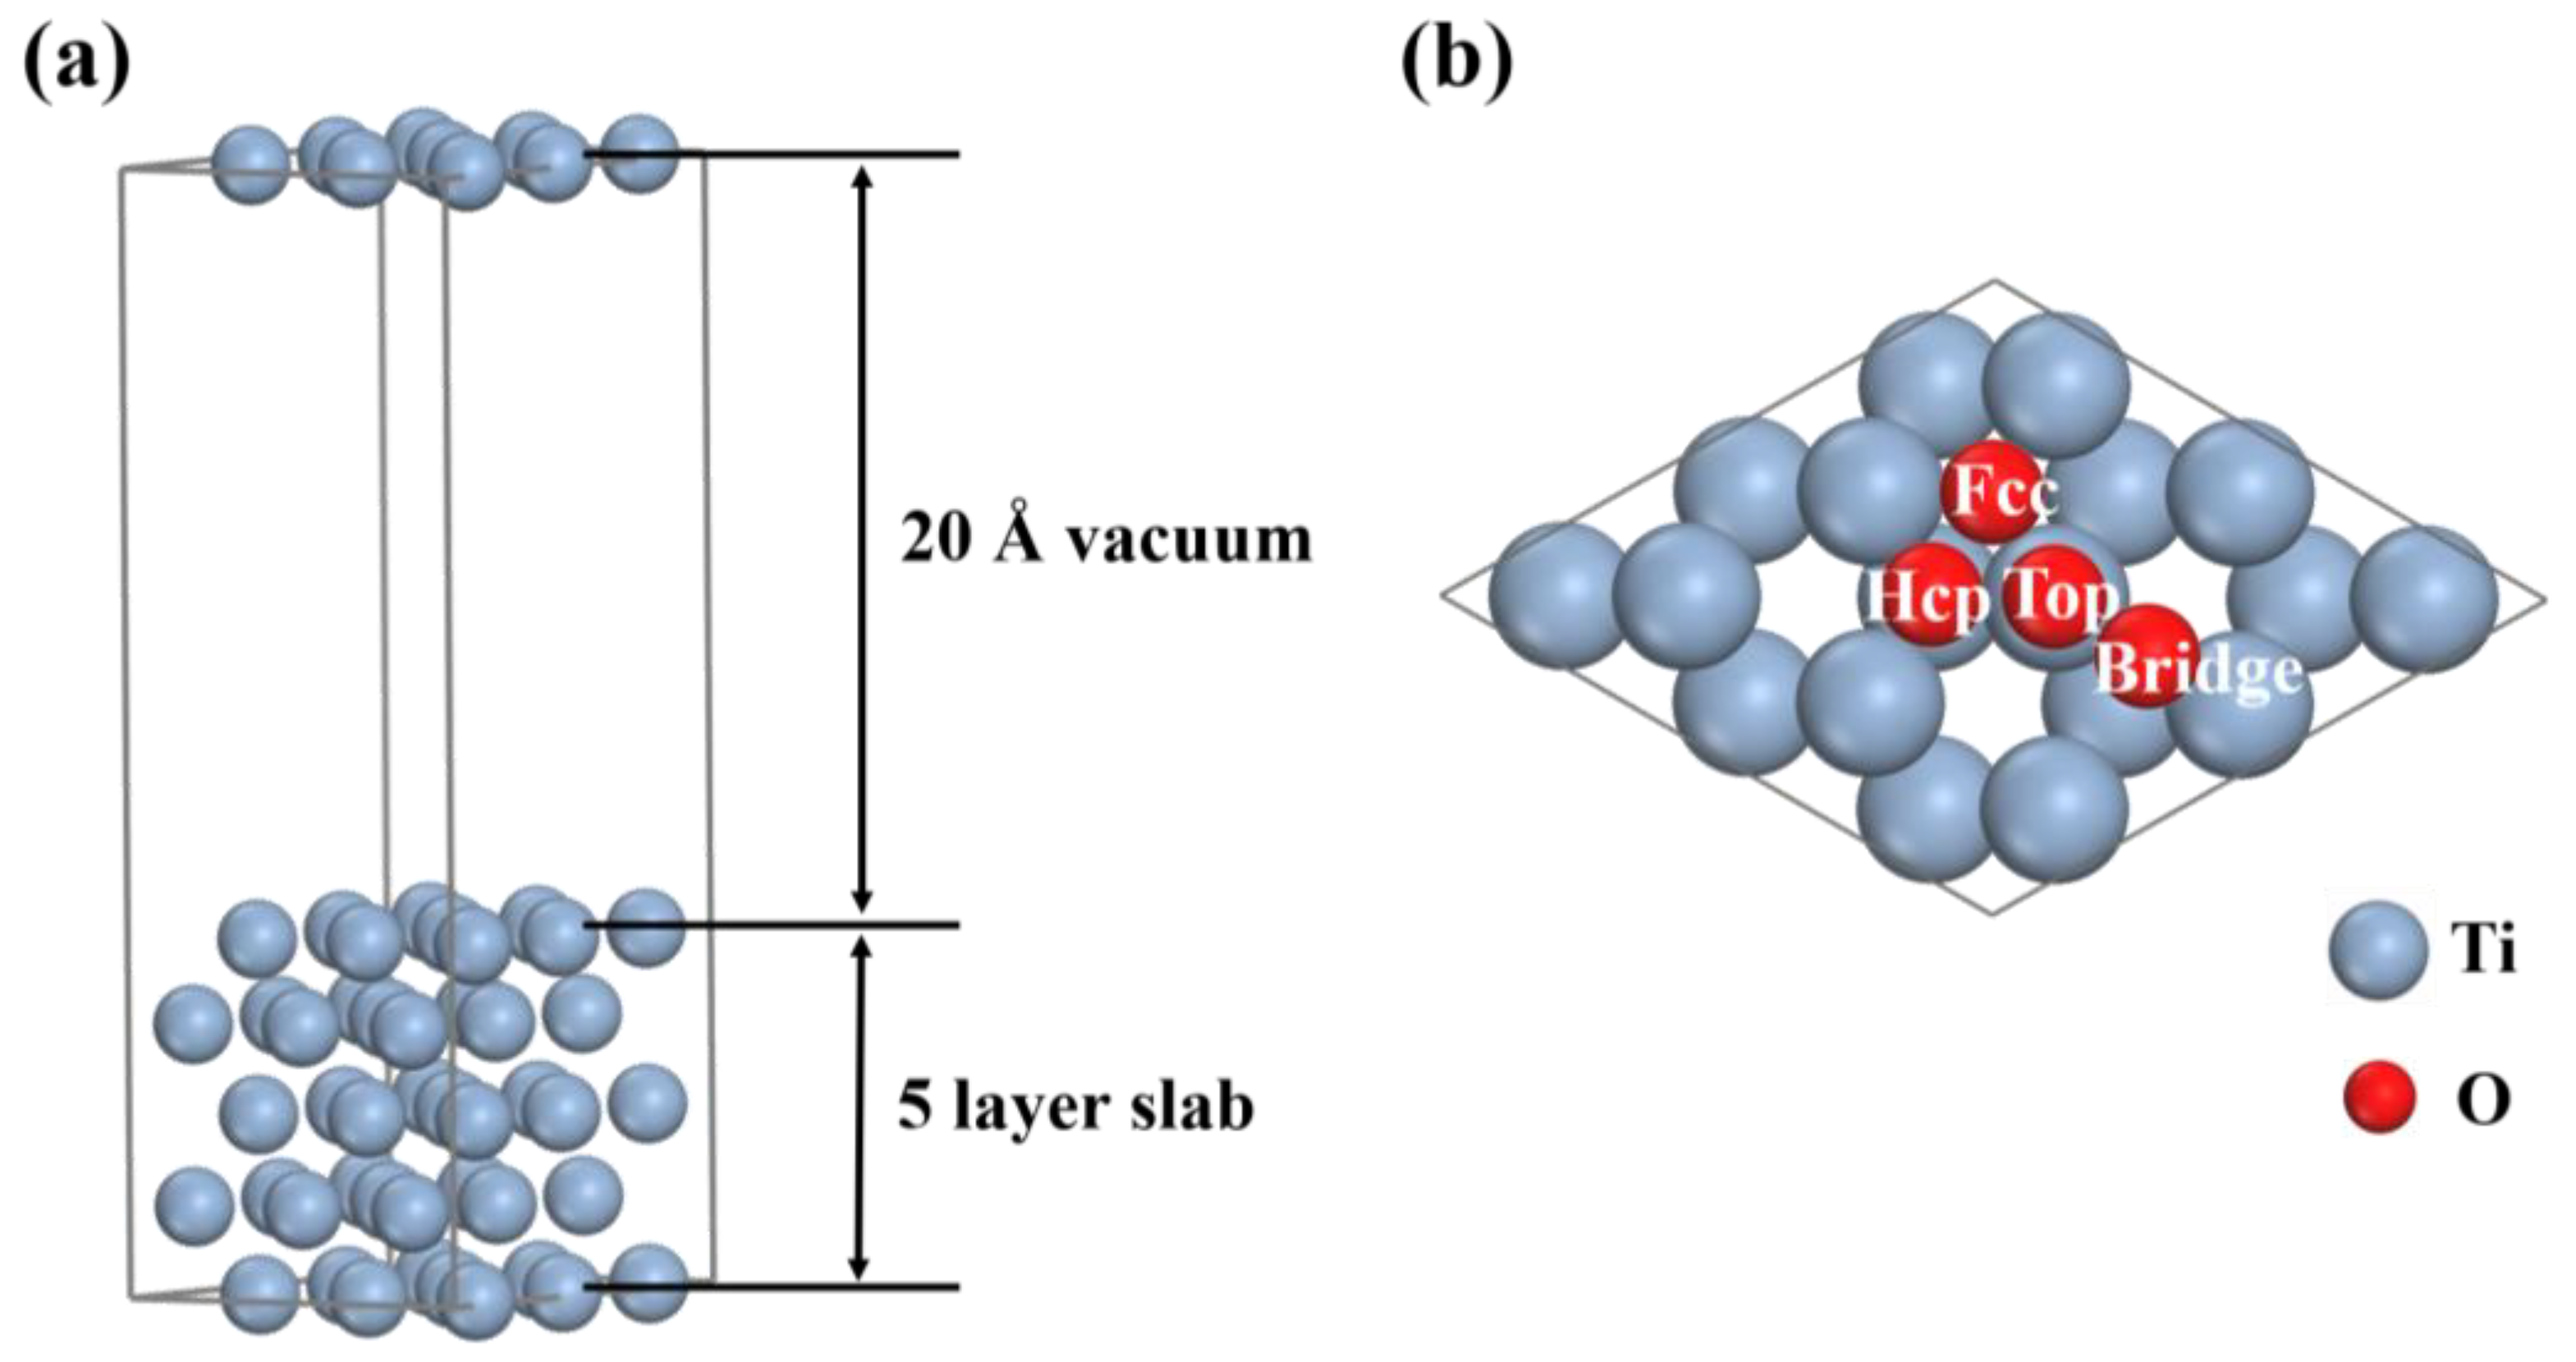
Figure 2.
Eads of an O atom at various sites on the Ti(0001) surface. The corresponding structural diagrams for each site are provided. The initial position of the O atom is indicated by the orange dotted circle.
Figure 2.
Eads of an O atom at various sites on the Ti(0001) surface. The corresponding structural diagrams for each site are provided. The initial position of the O atom is indicated by the orange dotted circle.

Figure 3.
(a) and (b) of the Ti-O adsorption systems at different θ. The orange transparent areas denote the region of higher oxygen coverage (θ = 5/9–1 ML).
Figure 3.
(a) and (b) of the Ti-O adsorption systems at different θ. The orange transparent areas denote the region of higher oxygen coverage (θ = 5/9–1 ML).

Figure 4.
Diagram illustrating the Ti vacancy structure of (a) the clean and (b) the O-adsorbed Ti(0001) slab. The orange dotted circles denote the removal of Ti atoms from the center of the surface Ti layer.
Figure 4.
Diagram illustrating the Ti vacancy structure of (a) the clean and (b) the O-adsorbed Ti(0001) slab. The orange dotted circles denote the removal of Ti atoms from the center of the surface Ti layer.
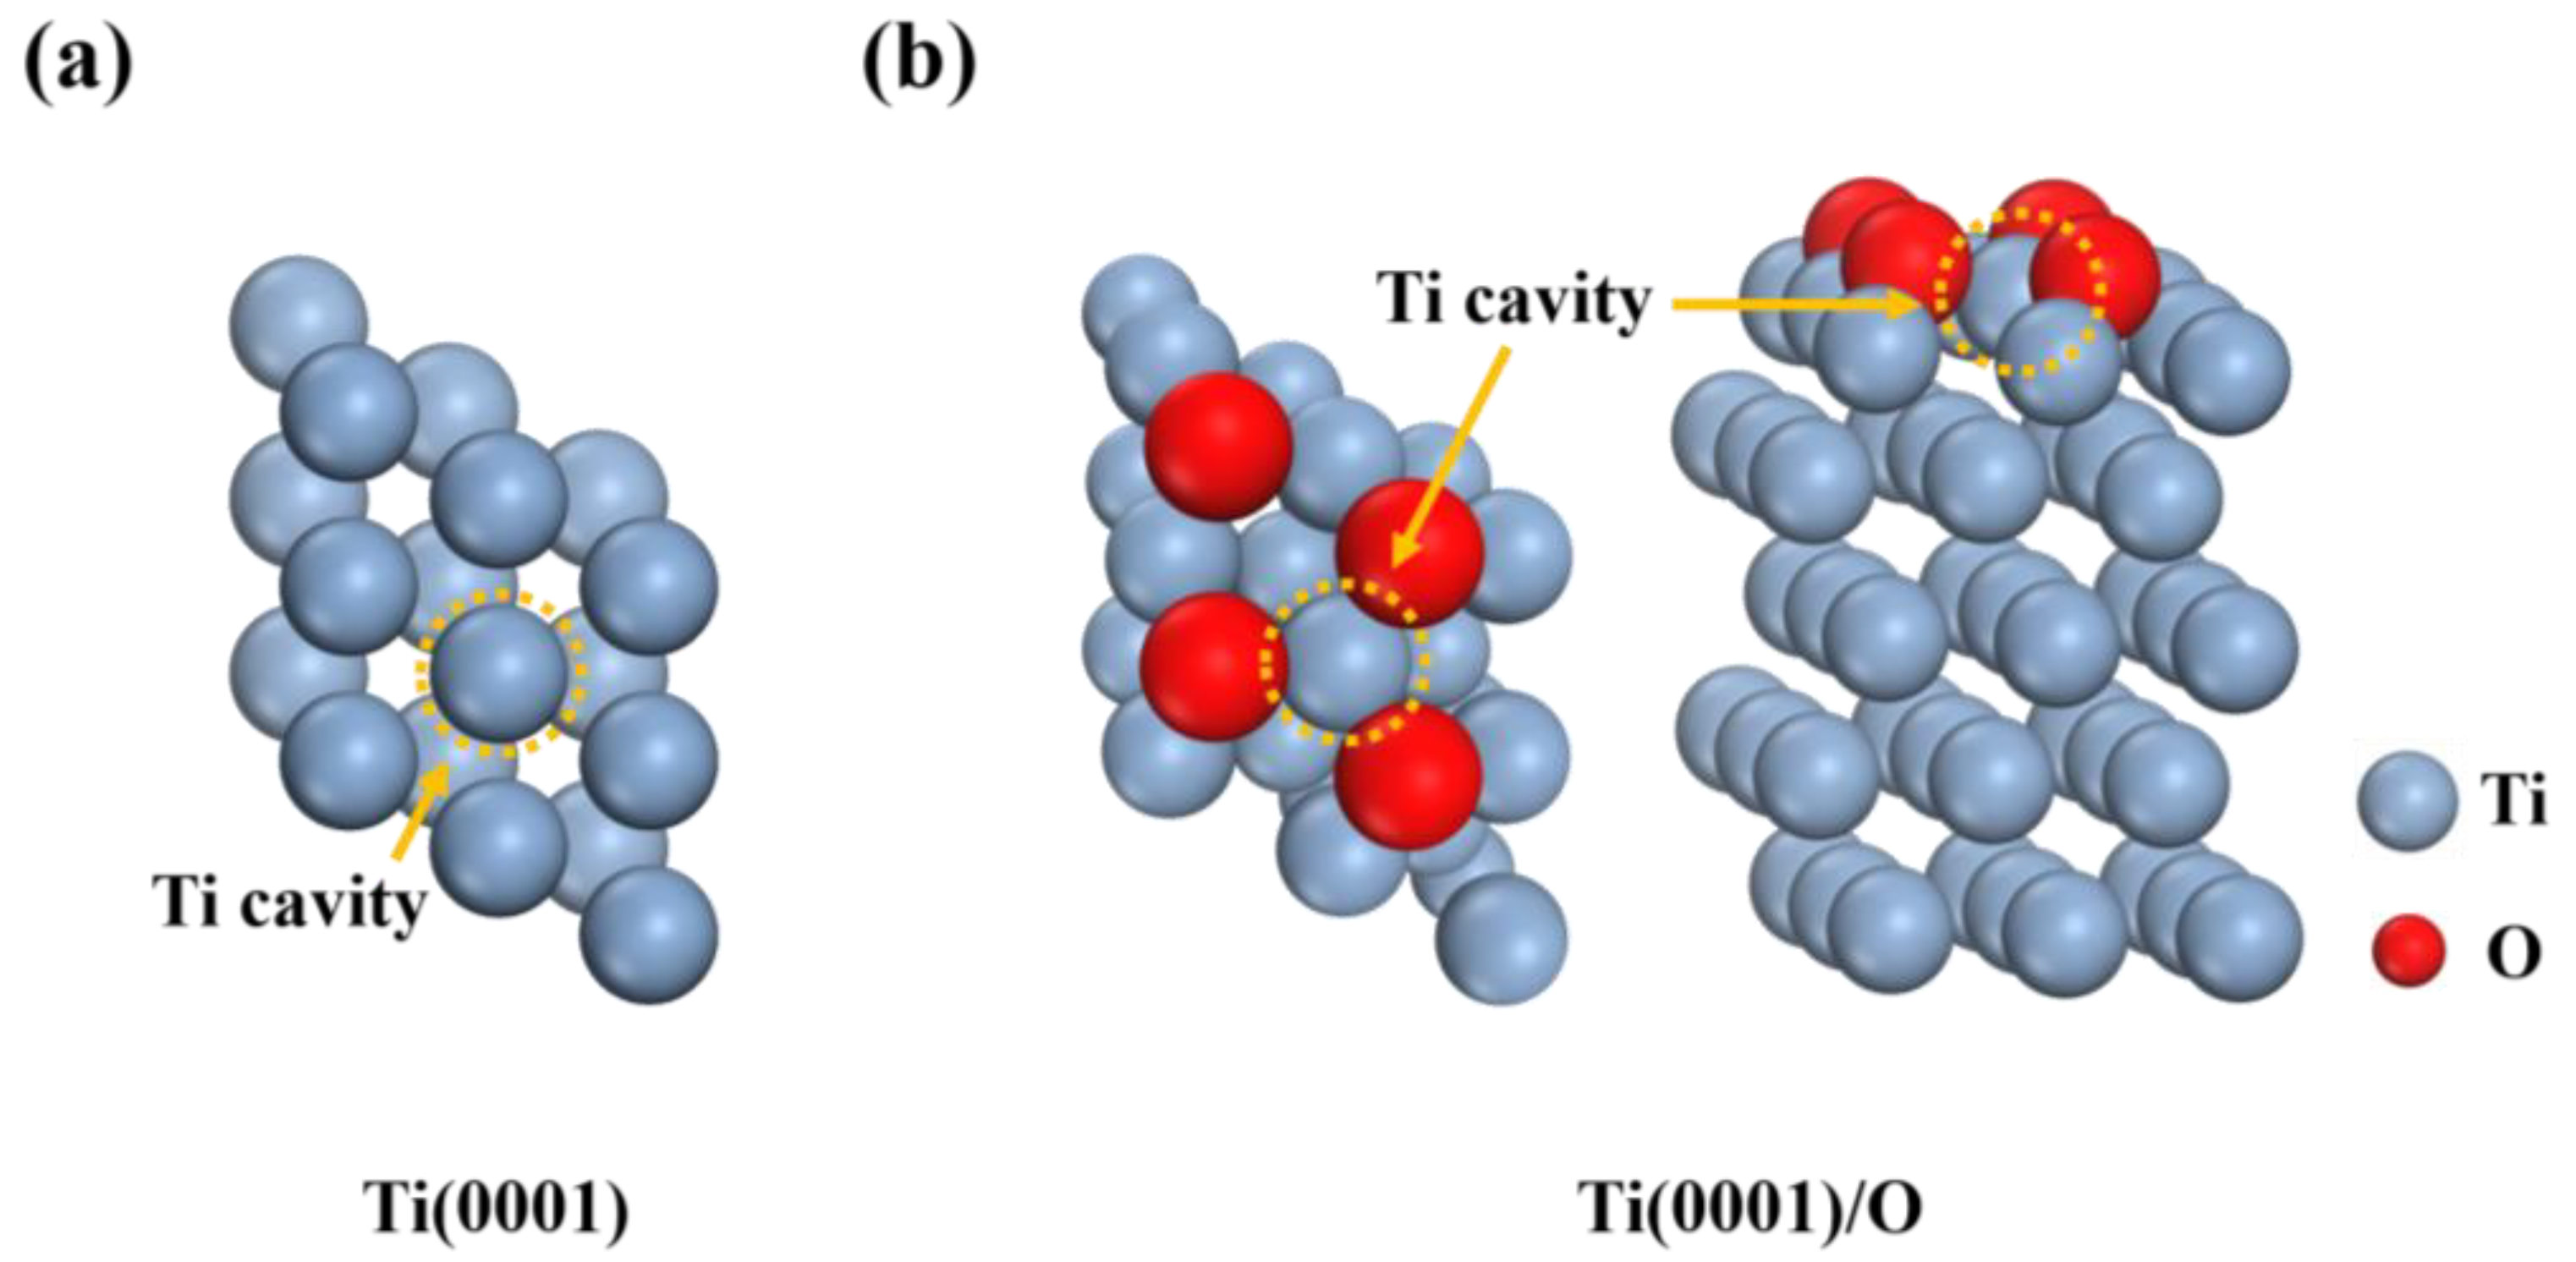
Figure 5.
The calculated of a Ti vacancy under different θ. The orange transparent areas denote the region of higher oxygen coverage (θ = 5/9–1 ML).
Figure 5.
The calculated of a Ti vacancy under different θ. The orange transparent areas denote the region of higher oxygen coverage (θ = 5/9–1 ML).

Figure 6.
Δµ and ΔU of the O-adsorbed Ti(0001) surface compared with the clean surface under different θ. The orange transparent areas denote the region of higher oxygen coverage (θ = 5/9–1 ML).
Figure 6.
Δµ and ΔU of the O-adsorbed Ti(0001) surface compared with the clean surface under different θ. The orange transparent areas denote the region of higher oxygen coverage (θ = 5/9–1 ML).

Figure 7.
Geometric structural parameters of the Ti-O slab. (a) Illustration of structural parameters in the side view of the O-adsorbed Ti(0001) slab. (b) and of the Ti(0001)/O and Ti(0001)/O-vac slabs. (c) and of the Ti(0001)/O and Ti(0001)/O-vac slabs. The orange transparent areas denote the region of higher oxygen coverage (θ = 5/9–1 ML).

Figure 8.
Analysis of charge density differences in the Ti(0001)/O (a–d) and Ti(0001)/O-vac slabs (e–h) from the top views, using θ = 1/9, 1/3, 2/3, and 1 ML as examples. Areas of increased electron density are depicted in magenta, while areas of decreased electron density are shown in gray. The translucent orange circular region indicates the position of the titanium vacancy.

Figure 9.
Electron density distribution in the Ti(0001)/O (a–d) and Ti(0001)/O-vac slabs (e–h) observed from side and top views, with θ = 1/9, 1/3, 2/3, and 1 ML as examples.
Figure 9.
Electron density distribution in the Ti(0001)/O (a–d) and Ti(0001)/O-vac slabs (e–h) observed from side and top views, with θ = 1/9, 1/3, 2/3, and 1 ML as examples.

Figure 10.
Overlap population analysis of the Ti-O slab under different θ. is the same as in Figure 7b, and is the average bond length of the O-O bond. The corresponding data are shown in Table S1. The orange transparent areas denote the region of higher oxygen coverage (θ = 5/9–1 ML).

Figure 11.
Analysis of PDOS between O and surface Ti atoms on the Ti(0001)/O (a) and Ti(0001)/O-vac (b) surfaces, with θ = 1/9, 1/3, 2/3, and 1 ML as examples. The orange transparent areas symbolize the overlap of hybrid peaks from different orbitals.
Figure 11.
Analysis of PDOS between O and surface Ti atoms on the Ti(0001)/O (a) and Ti(0001)/O-vac (b) surfaces, with θ = 1/9, 1/3, 2/3, and 1 ML as examples. The orange transparent areas symbolize the overlap of hybrid peaks from different orbitals.

Figure 12.
Variation of the work functions (Φ) of the Ti-O slab as a function of θ. The orange transparent areas denote the region of higher oxygen coverage (θ = 5/9–1 ML).
Figure 12.
Variation of the work functions (Φ) of the Ti-O slab as a function of θ. The orange transparent areas denote the region of higher oxygen coverage (θ = 5/9–1 ML).
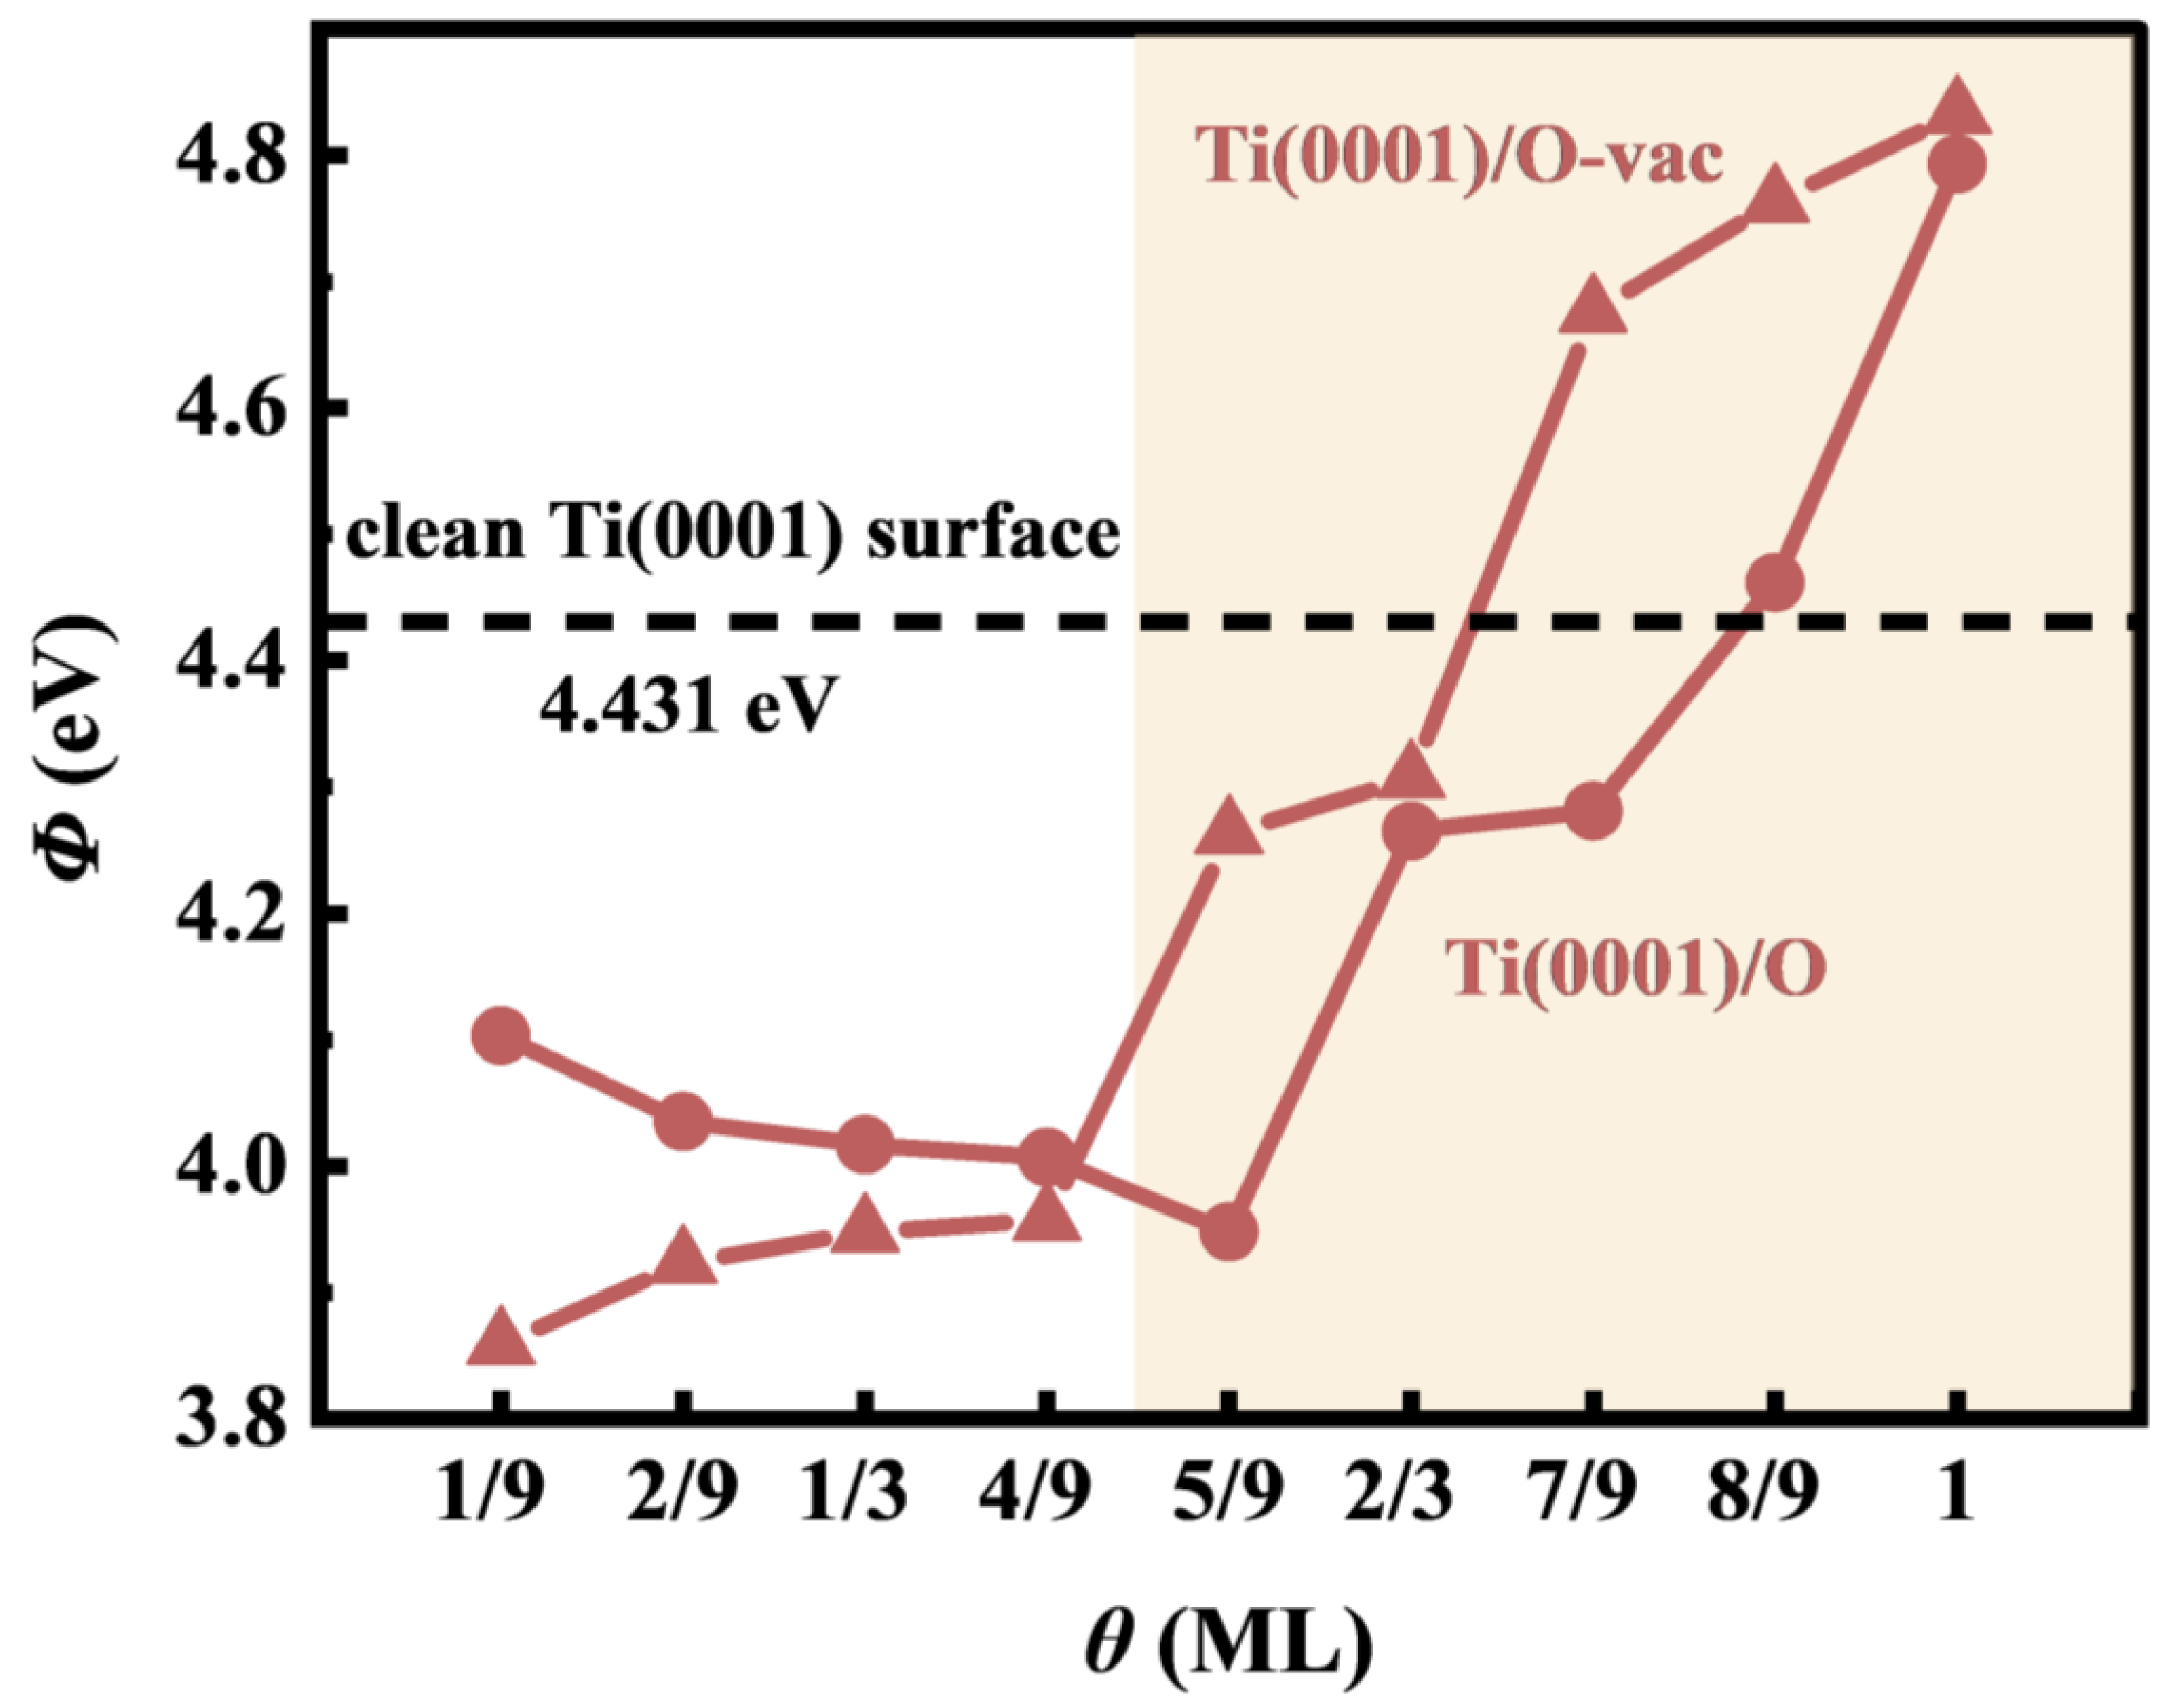
Figure 13.
Illustration depicting the formation of the oxide layer on the Ti(0001) surface. (a–c) illustrate the alteration in Ti(0001) surface structure corresponding to the augmentation in oxygen coverage.
Figure 13.
Illustration depicting the formation of the oxide layer on the Ti(0001) surface. (a–c) illustrate the alteration in Ti(0001) surface structure corresponding to the augmentation in oxygen coverage.


Table 1.
A comparison of calculated lattice constants of bulk Ti and the work function of the clean Ti(0001) surface with other computational and experimental results.
Table 1.
A comparison of calculated lattice constants of bulk Ti and the work function of the clean Ti(0001) surface with other computational and experimental results.
| This Work | Experiments | Other Calculations | |
|---|---|---|---|
| Lattice (Å) | a = b = 2.94 c = 4.66 c/a = 1.585 | a = 2.95, c/a = 1.587 [19] | GGA-PBE: a = b = 2.92, c = 4.63 [1] c/a = 1.580 [20] a = b = 2.94, c = 4.63 [21] |
| c/a = 1.586 [20] | LDA: c/a = 1.580 [22] c/a = 1.594 [23] | ||
| c/a = 1.588 [22] | |||
| Work function (eV) | 4.431 | 4.6 ± 0.2 [24] | GGA-PBE: 4.48 [25], 4.42 [20] |
| 4.45 [23] | LDA: 4.64 [22], 4.75 [23] |
Disclaimer/Publisher’s Note: The statements, opinions and data contained in all publications are solely those of the individual author(s) and contributor(s) and not of MDPI and/or the editor(s). MDPI and/or the editor(s) disclaim responsibility for any injury to people or property resulting from any ideas, methods, instructions or products referred to in the content. |
© 2024 by the authors. Licensee MDPI, Basel, Switzerland. This article is an open access article distributed under the terms and conditions of the Creative Commons Attribution (CC BY) license (https://creativecommons.org/licenses/by/4.0/).
Share and Cite
MDPI and ACS Style
Wang, X.; Xie, D.; Jing, F.; Ma, D.; Leng, Y. Influence of Ti Vacancy Defects on the Dissolution of O-Adsorbed Ti(0001) Surface: A First-Principles Study. Metals 2024, 14, 573. https://doi.org/10.3390/met14050573
AMA Style
Wang X, Xie D, Jing F, Ma D, Leng Y. Influence of Ti Vacancy Defects on the Dissolution of O-Adsorbed Ti(0001) Surface: A First-Principles Study. Metals. 2024; 14(5):573. https://doi.org/10.3390/met14050573
Chicago/Turabian StyleWang, Xiaoting, Dong Xie, Fengjuan Jing, Donglin Ma, and Yongxiang Leng. 2024. "Influence of Ti Vacancy Defects on the Dissolution of O-Adsorbed Ti(0001) Surface: A First-Principles Study" Metals 14, no. 5: 573. https://doi.org/10.3390/met14050573
Note that from the first issue of 2016, this journal uses article numbers instead of page numbers. See further details here.