Article

Waveform Complexity and Positioning Analysis of Acoustic Emission Events during the Compression Failure Process of a Rock Burst Prone Sample

1
Shaanxi Key Laboratory of Safety and Durability of Concrete Structures, Xi’an 710123, China
2
School of Civil Engineering and Architecture, Qingdao Huanghai University, Qingdao 266427, China
3
Zhejiang Qinhe Environmental Construction Co., Ltd., Jiaxing 314300, China
4
School of Resource Engineering, Xi’an University of Architecture and Technology, Xi’an 710055, China
*
Author to whom correspondence should be addressed.
Buildings 2024, 14(5), 1331; https://doi.org/10.3390/buildings14051331
Submission received: 26 March 2024 / Revised: 1 May 2024 / Accepted: 2 May 2024 / Published: 8 May 2024
(This article belongs to the Special Issue Buildings and Infrastructures under Natural Hazards)

Abstract

:
The localization results of acoustic emission (AE) events can reflect the location and pattern of burst-prone rock failures. However, event localization heavily depends on the quality of the original waveform of the sensor. Therefore, this study analyzed the AE waveform of a rock sample under compression to evaluate its failure localization and quality. From the research results, it could be seen that the initial failure was relatively calm, with clear take-off points, which can be better used for accurate AE event positioning. However, the later failure was severe, causing the take-off points of most sensors to be very unclear, and positioning methods that rely on take-off points cannot be used for positioning, let alone simply using the positioning results of the built-in software. This research result reminds researchers who use AE signals for event localization to first examine the quality and status of the original waveform, providing a basis for obtaining accurate localization results, in order to further accurately study the subsequent failure patterns. The above facts indicate that the initial failure is small and scattered, while the later failure is large and concentrated, with certain fractal characteristics.

1. Introduction

The study of the failure of burst-prone rocks is of great significance for the prevention and control of dynamic disasters in geotechnical engineering. It is of great significance for many geotechnical engineers to be able to accurately identify and locate the fracture location and range in rock [1]. Early warning of failure through some precursory indicators is conducive to monitoring, early warning, and prevention of engineering disasters like rock bursts [2,3], roof falls [4,5], slope slips [6,7], structure reveals [8,9], and even earthquakes [10,11]. In the process of rock fracture, various energy releases will be generated [12], including thermal energy, kinetic energy, friction energy, stress wave energy, etc. [13]. Among these energies, the energy of the stress wave is converted into vibration energy and propagates outward. The localization results of acoustic emission (AE) events can reflect the location and pattern of failure. The AE monitoring system can capture these vibration signals [14] and then conduct event positioning and energy analysis through the collected waveforms. However, it should be pointed out that the feedback of destruction requires precise event localization results, and event localization heavily depends on the quality of the original waveform of the sensor. The key factors in the accurate location of AE events [15] mainly include the accurate identification of events [16] and the selection of location methods [17]. First of all, the signals caused by rock fracture should be selected from many vibration signals, and then the corresponding index should be extracted for positioning (sound waveforms are the foundation for accurate positioning, and with this foundation, index information such as take-off points can be extracted for positioning).
At present, the STA/LTA algorithm [18,19] is the most commonly used method for AE event recognition, and the recognition results are also more accurate under normal circumstances (the algorithm is usually based on the waveform of one sensor, and sometimes the recognition and extraction results of multiple sensors can improve the effectiveness [20]). After the event is accurately identified, it is more important to accurately locate the event. At present, the most commonly used method is mainly the time-difference localization method. In addition, it also includes some other methods, such as machine learning [21], cluster analysis [22,23], cross-correlation [24], neural networks [25], deep learning [26,27], etc. The time difference localization method relies on accurate algorithms for picking, such as STA/LTA [28], ultrasonic transmission [29], Akaike information criterion [30], C-Means clustering [31], delay time [32], wavelet transform [33], etc. Of course, if the event is interfered with by background noise or other factors, filtering measures should be taken to reduce noise or remove interference [34]. However, it should be emphasized that no matter what identification [35], noise reduction [36], or positioning method [37] are used, the accuracy of the original waveform (here, original waveform refers to the most primitive and unprocessed signals collected by the system after only considering hardware reasons) should be guaranteed first [38]. If the quality of the original waveform is poor, no matter how good the noise reduction and positioning algorithm is, it cannot achieve the accurate positioning of AE events [39].
In previous studies, some experiments often overlooked the viewing of the original waveform and the optimization selection of algorithms and directly used the built-in software of the AE monitoring instrument for positioning, which lacked process analysis and affected the credibility of the positioning results [40]. The exploration and accurate processing of the original waveform is an important foundation for subsequent recognition and localization [41,42]. The quality of the original waveform directly determines the accuracy of event recognition and the method of picking up take-off points for event localization [43]. Some algorithms are helpful in improving the quality of the original waveform [19,44], but the processing algorithm is bound to cause some changes in the original waveform, and the processing process is also a certain source of error. A better way is to obtain relatively clear take-off points and other information indicators without waveform processing and then use them for positioning [45]. If the quality of the original waveform is high, there is no need for noise reduction, and the take-off points can be picked up manually for positioning [46]. Although this increases the manual workload, positioning accuracy is the most guaranteed.
The quality of the original waveform depends to some extent on the quality of the sensor and the parameters of the acquisition instrument, but it is more dependent on the experimental sample that generates vibration. The collection instrument may have a certain impact, which is relatively small compared to the vibration itself and has a relatively small impact on waveform quality. Rock burst-prone rocks are a special type of specimen that generally exhibit brittle and sudden dynamic failure phenomena. It is necessary to study the original waveform state of some specific samples during specific periods of failure (especially in the late stage [47]), which is of great help for studying dynamic disasters. Therefore, this study selected a rock sample with rock burst tendency, collected their AE waveforms during compression failure, and examined the quality of their original waveforms, providing a basis for subsequent event recognition and localization algorithms (innovation lies more in fully considering the shape of the original waveform and the accuracy of positioning from the source). This study also discussed the dominant frequency characteristics of different original waveform states, which has certain reference significance for the study of rock failure characteristics.

2. Methods

In order to better meet the requirements of sample loading, this study used a universal pressure tester (the model is YAW-5000) with a maximum pressure value of 5000 kN to complete the loading work of the sample, as shown in Figure 1. The experimental equipment also includes a pressure tester control system, rock sample, AE acquisition instrument, waveform acquisition, and display computer. The universal pressure tester and its supporting control system complete the loading work of rock samples, and the AE acquisition equipment completes synchronous vibration signal acquisition. The testing force measurement range of the universal pressure tester is 2%~100%, the piston stroke is 0~1500 mm, the size of the upper and lower pressure plates is 600 × 900 mm, and the constant stress control range is 1~10 N/m. This equipment can complete the stress–strain full process testing and mechanical performance testing of rock samples, which can meet the requirements of this study.
The model of the AE acquisition equipment used was DS5-16, and the number of sensors used was 8. The signal transmission rate of the AE acquisition instrument was 113 MB/s, and the response frequencies of the sensors were all 50–400 kHz; the center receiving frequencies were all 150 kHz (the sensors used were of the piezoelectric type, which could measure vibration signals in a single direction and convert them into voltage to characterize vibration intensity). In order to collect vibration information more accurately, a higher sampling frequency of 6 MHz was adopted. The input signal range of the system was ±10 V, and the dynamic range was ≥82 decibels. Due to the relatively small amplitude of the vibration signal, the signals were amplified at a fixed ratio (the preamplifier was 2.5 kHz–2.4 MHz) and converted into a voltage signal. In order to better reflect the rock burst tendency, the rock sample size was designed as a 200 mm cube, and a 20 mm hole was set in the middle of the sample. The material of the sample was a sandstone that had been manufactured by the manufacturer, with a uniaxial compressive strength of about 70 MPa. After testing, the propagation speed of longitudinal waves was 1989 m/s. Although the sample had heterogeneity and could not be calculated using the same value, this problem is now difficult to solve. At least this value should be determined first to better ensure positioning accuracy. The sensors were pasted onto a cubic sample through a special liquid medium, and the specific coordinates were shown in Table 1 (using the coordinates in Figure 1c as the coordinate origin). The reasons for setting up sensors in this way were twofold: firstly, the monitored events were best included in the sensor network; secondly, considering the spatial expansion, the stronger the spatial misalignment of the sensors, the more accurate their positioning was. Also, the study drew on the experience of previous sensor designs, considering that the current solution was reasonable.
With the help of the equipment and sample described above, the loading parameters (stress–strain relationship, etc.) and AE signals of rock burst-prone samples during compression can be obtained. After obtaining the AE signals, the original waveform can be exported for viewing. Determine which are AE event waveforms based on the original waveforms and determine the specific situation and localization degree of their take-off points, providing a reference for the study of rock failure processes and mechanisms.
Through the above relatively large sample and high sampling frequency AE signal acquisition system, the high-precision acquisition of AE events can be ensured, and the basis for the accurate positioning of AE events can be provided. The accurate location of AE events can reflect the failure time and location of the rock sample, which can provide real basic data for accurately reflecting the shape of the plastic zone under a specific stress state in this study. The research results may provide a new idea for rock failure precursors, geotechnical engineering disaster occurrence mechanisms, and disaster monitoring and early warning methods.

3. Results and Discussion

After checking the status of the experimental equipment and the condition of the sample, strict sample compression and synchronous AE monitoring were carried out. A total of three rock samples were loaded into the experiment, and one of the most representative samples was selected for analysis and research. After a period of compression, the sample suddenly failed at 69.7 MPa. Showing a strong dynamic phenomenon and emitting explosive sounds, the final sample presented a fragmented state. Loading was relatively slow, and after experiencing the compressive force, the sample slowly cracked, and the cracks slowly closed. The stress–strain curve in the early stage shows that the elastic stage of the specimen was longer, the elastic slope was larger, and when the force reached an unbearable limit, instant failure occurred. The experimental phenomena obtained were in line with the situation of the studied object; therefore, detailed raw waveform data have been derived for analysis.
From the overall waveform, it conformed to the failure characteristics of rock mass with rock burst tendency. Firstly, non-event waveforms should be proposed through conventional algorithms (threshold setting and the short-term to long-term average method) to select acoustic emission events. For the number of AE events, it could be seen that before the occurrence of cracks, the number was relatively small. As the force gradually increased, the number of cracks gradually increased, and during the compaction stage, they became relatively small. However, the number became abnormally large in the final failure stage. A case AE waveform capture (selected during the loading phase) was presented in Figure 2 (the point in the figure represented 6 M points collected every second, without units). It could be seen that the failure of the sample exhibited multiple typical AE event waveform states, and the occurrence of events showed a concentrated occurrence after a period of time. The waveform shape at the time scale in Figure 2 fully conformed to the appearance of a rock burst-prone sample, which laid a solid foundation for subsequent detailed analysis.
In order to better display the specific waveform morphology of each AE event, it was necessary to reduce the horizontal scale of each event for a detailed display, and a case waveform I of an AE event that occurred relatively early was denoted in Figure 3. The results showed excellent event waveform states and clear take-off points for each sensor (the take-off point represented the starting point of the vibration waveform when it suddenly increased from a smaller level to a larger level). After the rock fracture occurred, the first sensor to arrive was sensor 1#, with a take-off point of 622. The location of the rupture phenomenon was closest to sensor 1#, resulting in an earlier take-off time and a larger amplitude. The subsequent arrivals were sensors 2#, 3#, 5#, 6#, 7#, 8#, and 4#, with take-off points of 807, 843, 916, 919, 1049, 1088, and 1156, respectively. After arranging in order from morning to evening, the difference in arrival time between adjacent sensors was 185, 36, 73, 3, 130, 39, and 68, respectively. The distance differences between adjacent sensors (the distance difference between different sensors and the point where the fracture event occurred) were 0.061 m, 0.012 m, 0.024 m, 0.001 m, 0.043 m, 0.013 m, and 0.023 m, calculated based on the propagation velocity of the rock elastic wave of 1989 m/s. From the perspective of amplitude attenuation sequence, it was exactly opposite to the arrival time, which fully conformed to the law of event occurrence. At a signal propagation speed of 1989 m/s, the corresponding distance difference for one point is 0.33 mm. The location of the rupture was basically the same as the distance between sensors 5# and 6#, with a difference of only about 1 mm. Overall, the case waveform I fully conformed to the characteristics of rock failure, the amplitude attenuation followed a normal pattern, and the take-off points were all clear. In the case of clear take-off points, by combining the time difference and distance difference mentioned above with the specific coordinates of the sensor, the location of the rupture event could be accurately determined through suitable algorithms.
The same thing displayed above happened to case waveforms II and III, as shown in Figure 4 (case waveform II) and Figure 5 (case waveform III). Using the same method to analyze the two waveforms, the results showed that the earliest arrival time point was 2732 of sensor 3# for case waveform II, and the subsequent arrivals were sensor 2#, 7#, 1#, 5#, 6#, 4#, and 8#, with take-off points of 2967, 2991, 3018, 3072, 3114, 3134, and 3195, respectively. After arranging in order from morning to evening, the differences in arrival time between adjacent sensors were 235, 24, 27, 54, 42, 20, and 59, respectively. The distance differences between adjacent sensors (the distance difference between different sensors and the point where the fracture event occurred) were 0.078 m, 0.008 m, 0.009 m, 0.018 m, 0.014 m, 0.007 m, and 0.020 m, calculated based on the propagation velocity of the rock elastic wave of 1989 m/s. Similarly, the location of the rupture event (case waveform II) could be accurately determined through suitable algorithms when the take-off points were clear.
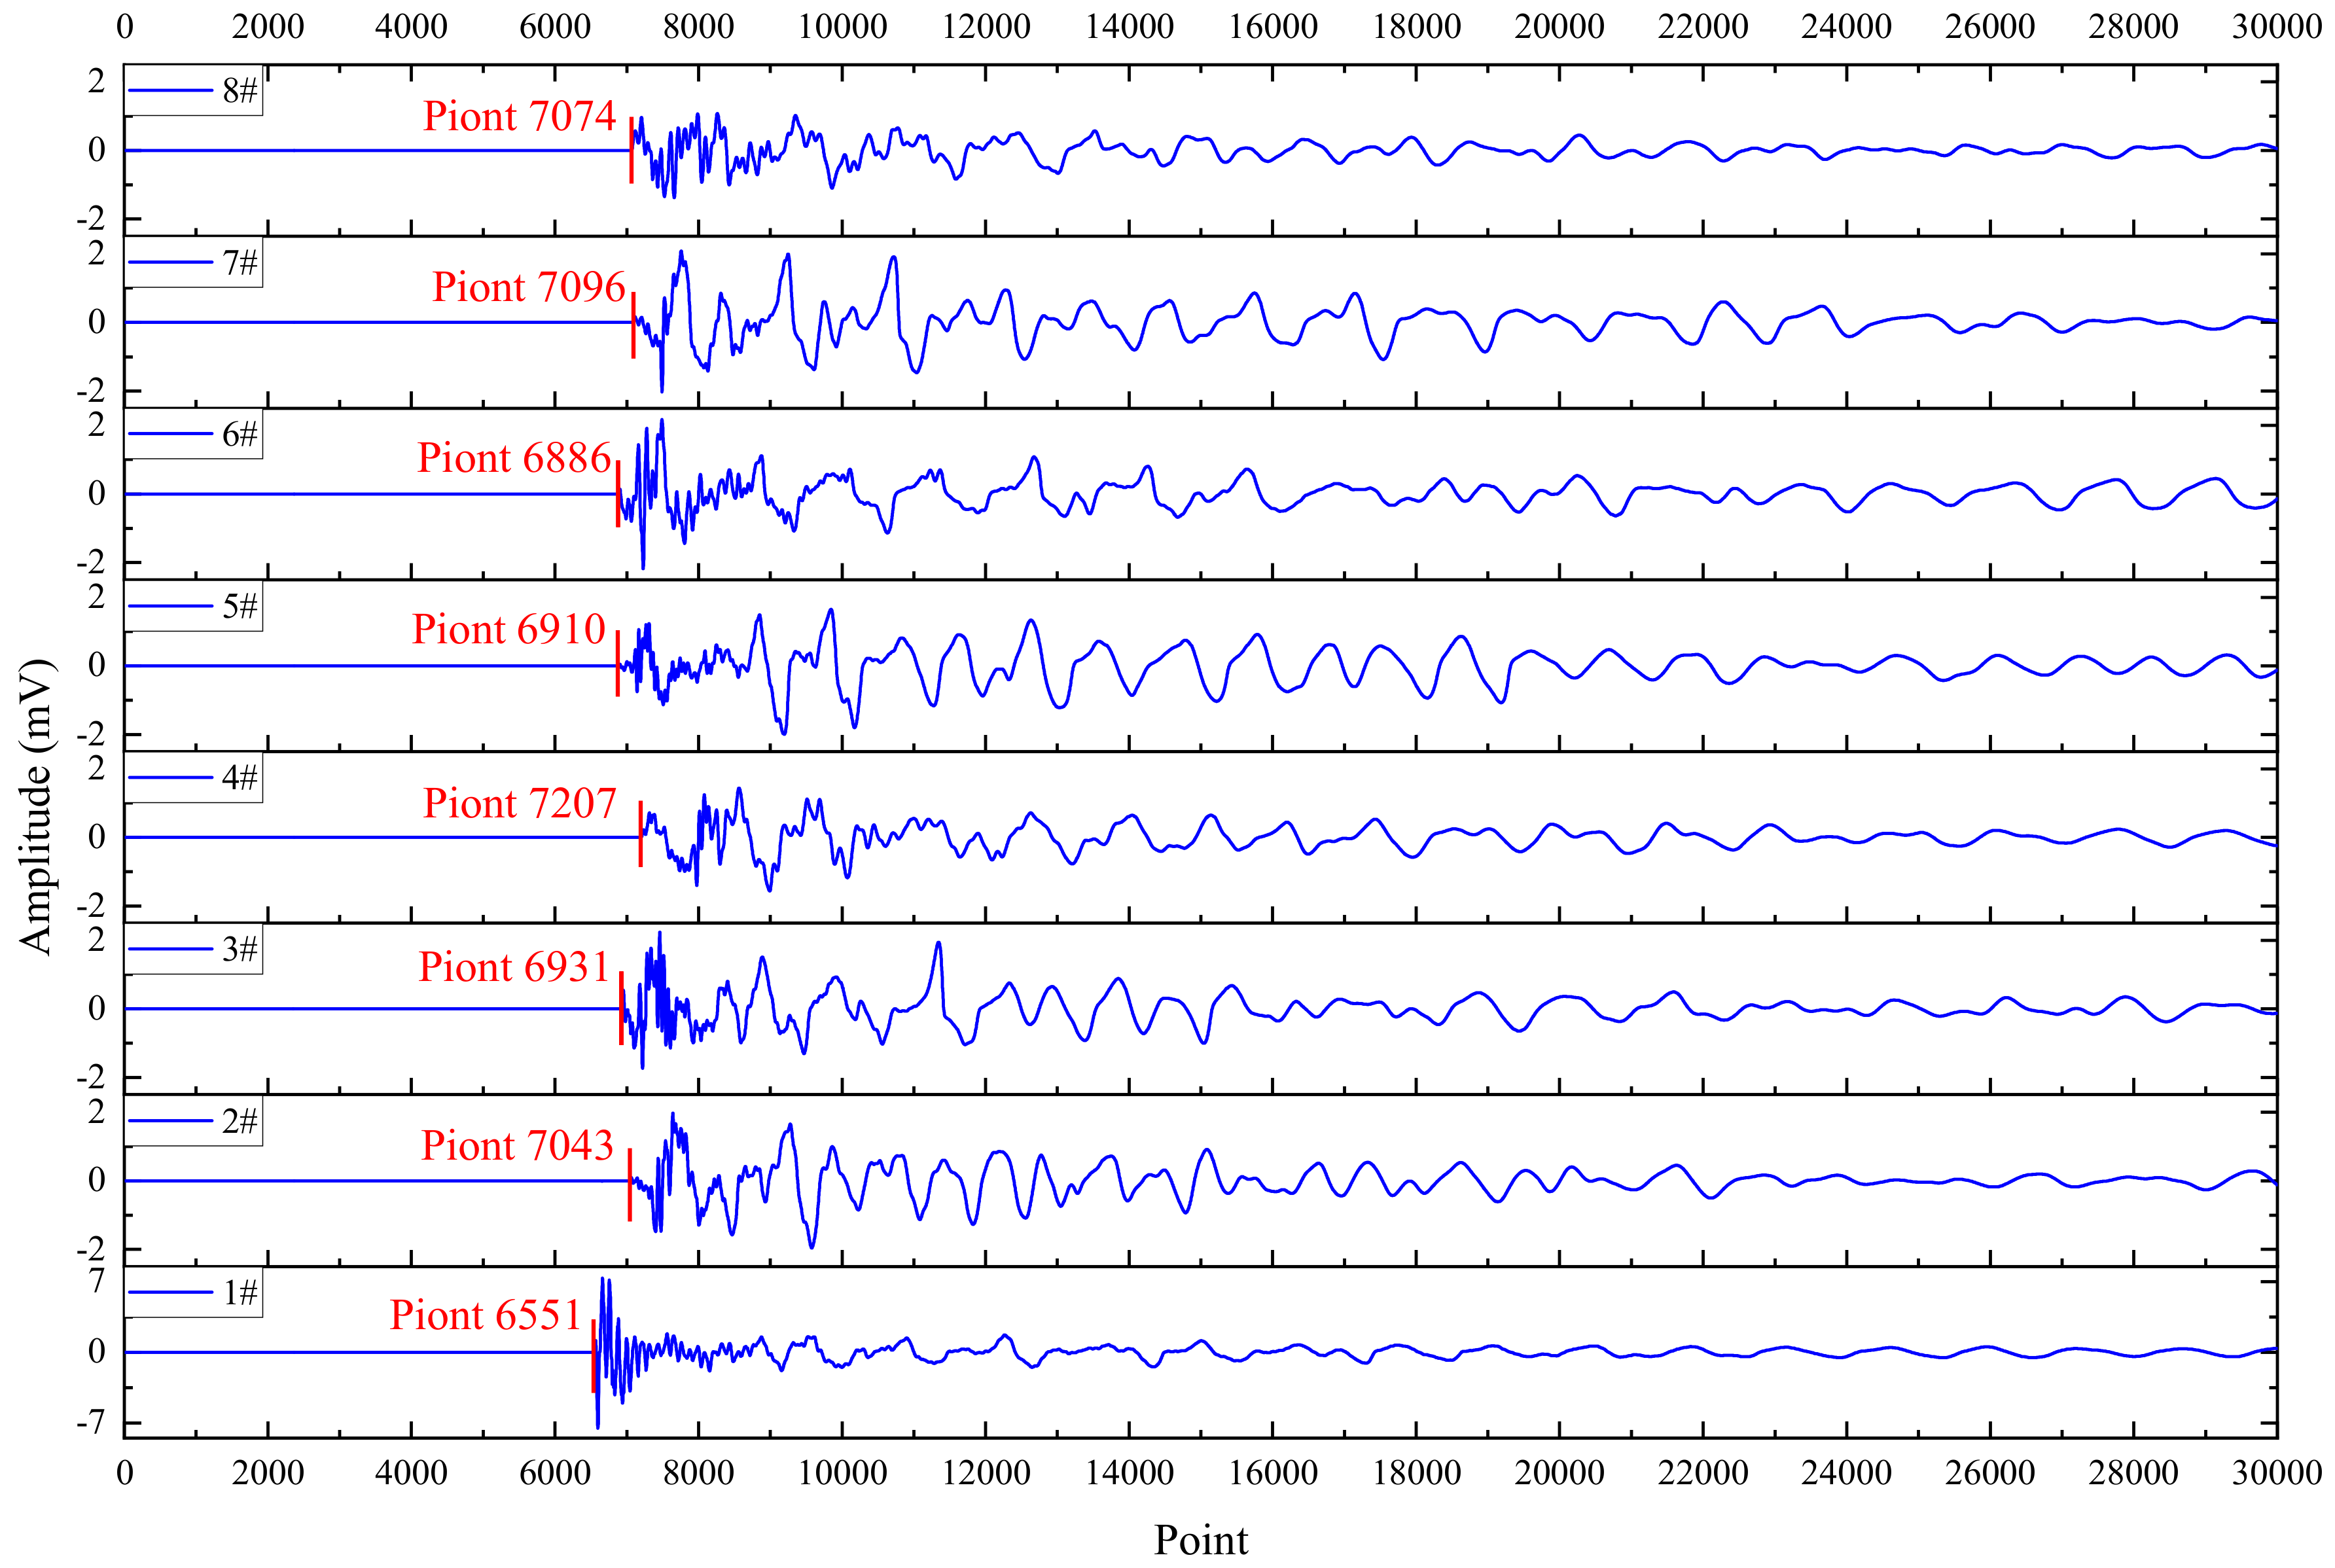
For case waveform III, the earliest arrival time point was 6551 for sensor 1#. The subsequent arrivals were sensors 6#, 5#, 3#, 2#, 8#, 7#, and 4#, with take-off points of 6886, 6910, 6931, 7043, 7074, 7096, and 7207, respectively. After arranging in order from morning to evening, the differences in arrival time between adjacent sensors were 335, 24, 21, 112, 31, 22, and 111, respectively. The distance differences between adjacent sensors (the distance difference between different sensors and the point where the fracture event occurred) were 0.111 m, 0.008 m, 0.007 m, 0.037 m, 0.010 m, 0.007 m, and 0.037 m, calculated based on the propagation velocity of the rock elastic wave of 1989 m/s. Also, the location of the rupture event (case waveform III) could be accurately determined through suitable algorithms when the take-off points were clear.
The above three case waveforms both showed clear take-off points, which fully conformed to the waveform performance of the rupture phenomenon. In the case of more accurate take-off point-picking algorithms, precise positioning could be achieved directly using algorithms without the need for manual intervention. From the sparsity of the waveform, case waveforms II and III were denser than case waveform I, which may indicate that the failure process of the sample was more active in the relatively later process compared to the early stage.
The three cases above demonstrated good waveform and event morphology, but the extracted subsequent events were somewhat different. Case waveform IV (which occurred during the transitional phase) in Figure 6 showed that only sensors 3# and 7# have slightly noticeable take-off points, and the take-off points of other sensors cannot be obtained at all. On the horizontal scale of the abbreviation, the event appeared to have no problem and could display obvious waveform characteristics, but when the event was magnified, it became noticeably different. The amplitude of the event on different sensors increased significantly, the bottom noise of the waveform increased significantly, and the waveform became somewhat distorted after the unclear take-off points. From the sequence of unclear take-off points in the waveforms, it conformed to the basic rules of the event and could be determined as an event waveform. However, it was significantly different from the previous three case waveforms, with a stronger rupture, resulting in unclear take-off points for most sensors. The shape of the waveform also shows that as the degree of damage increases, the waveform becomes distorted.
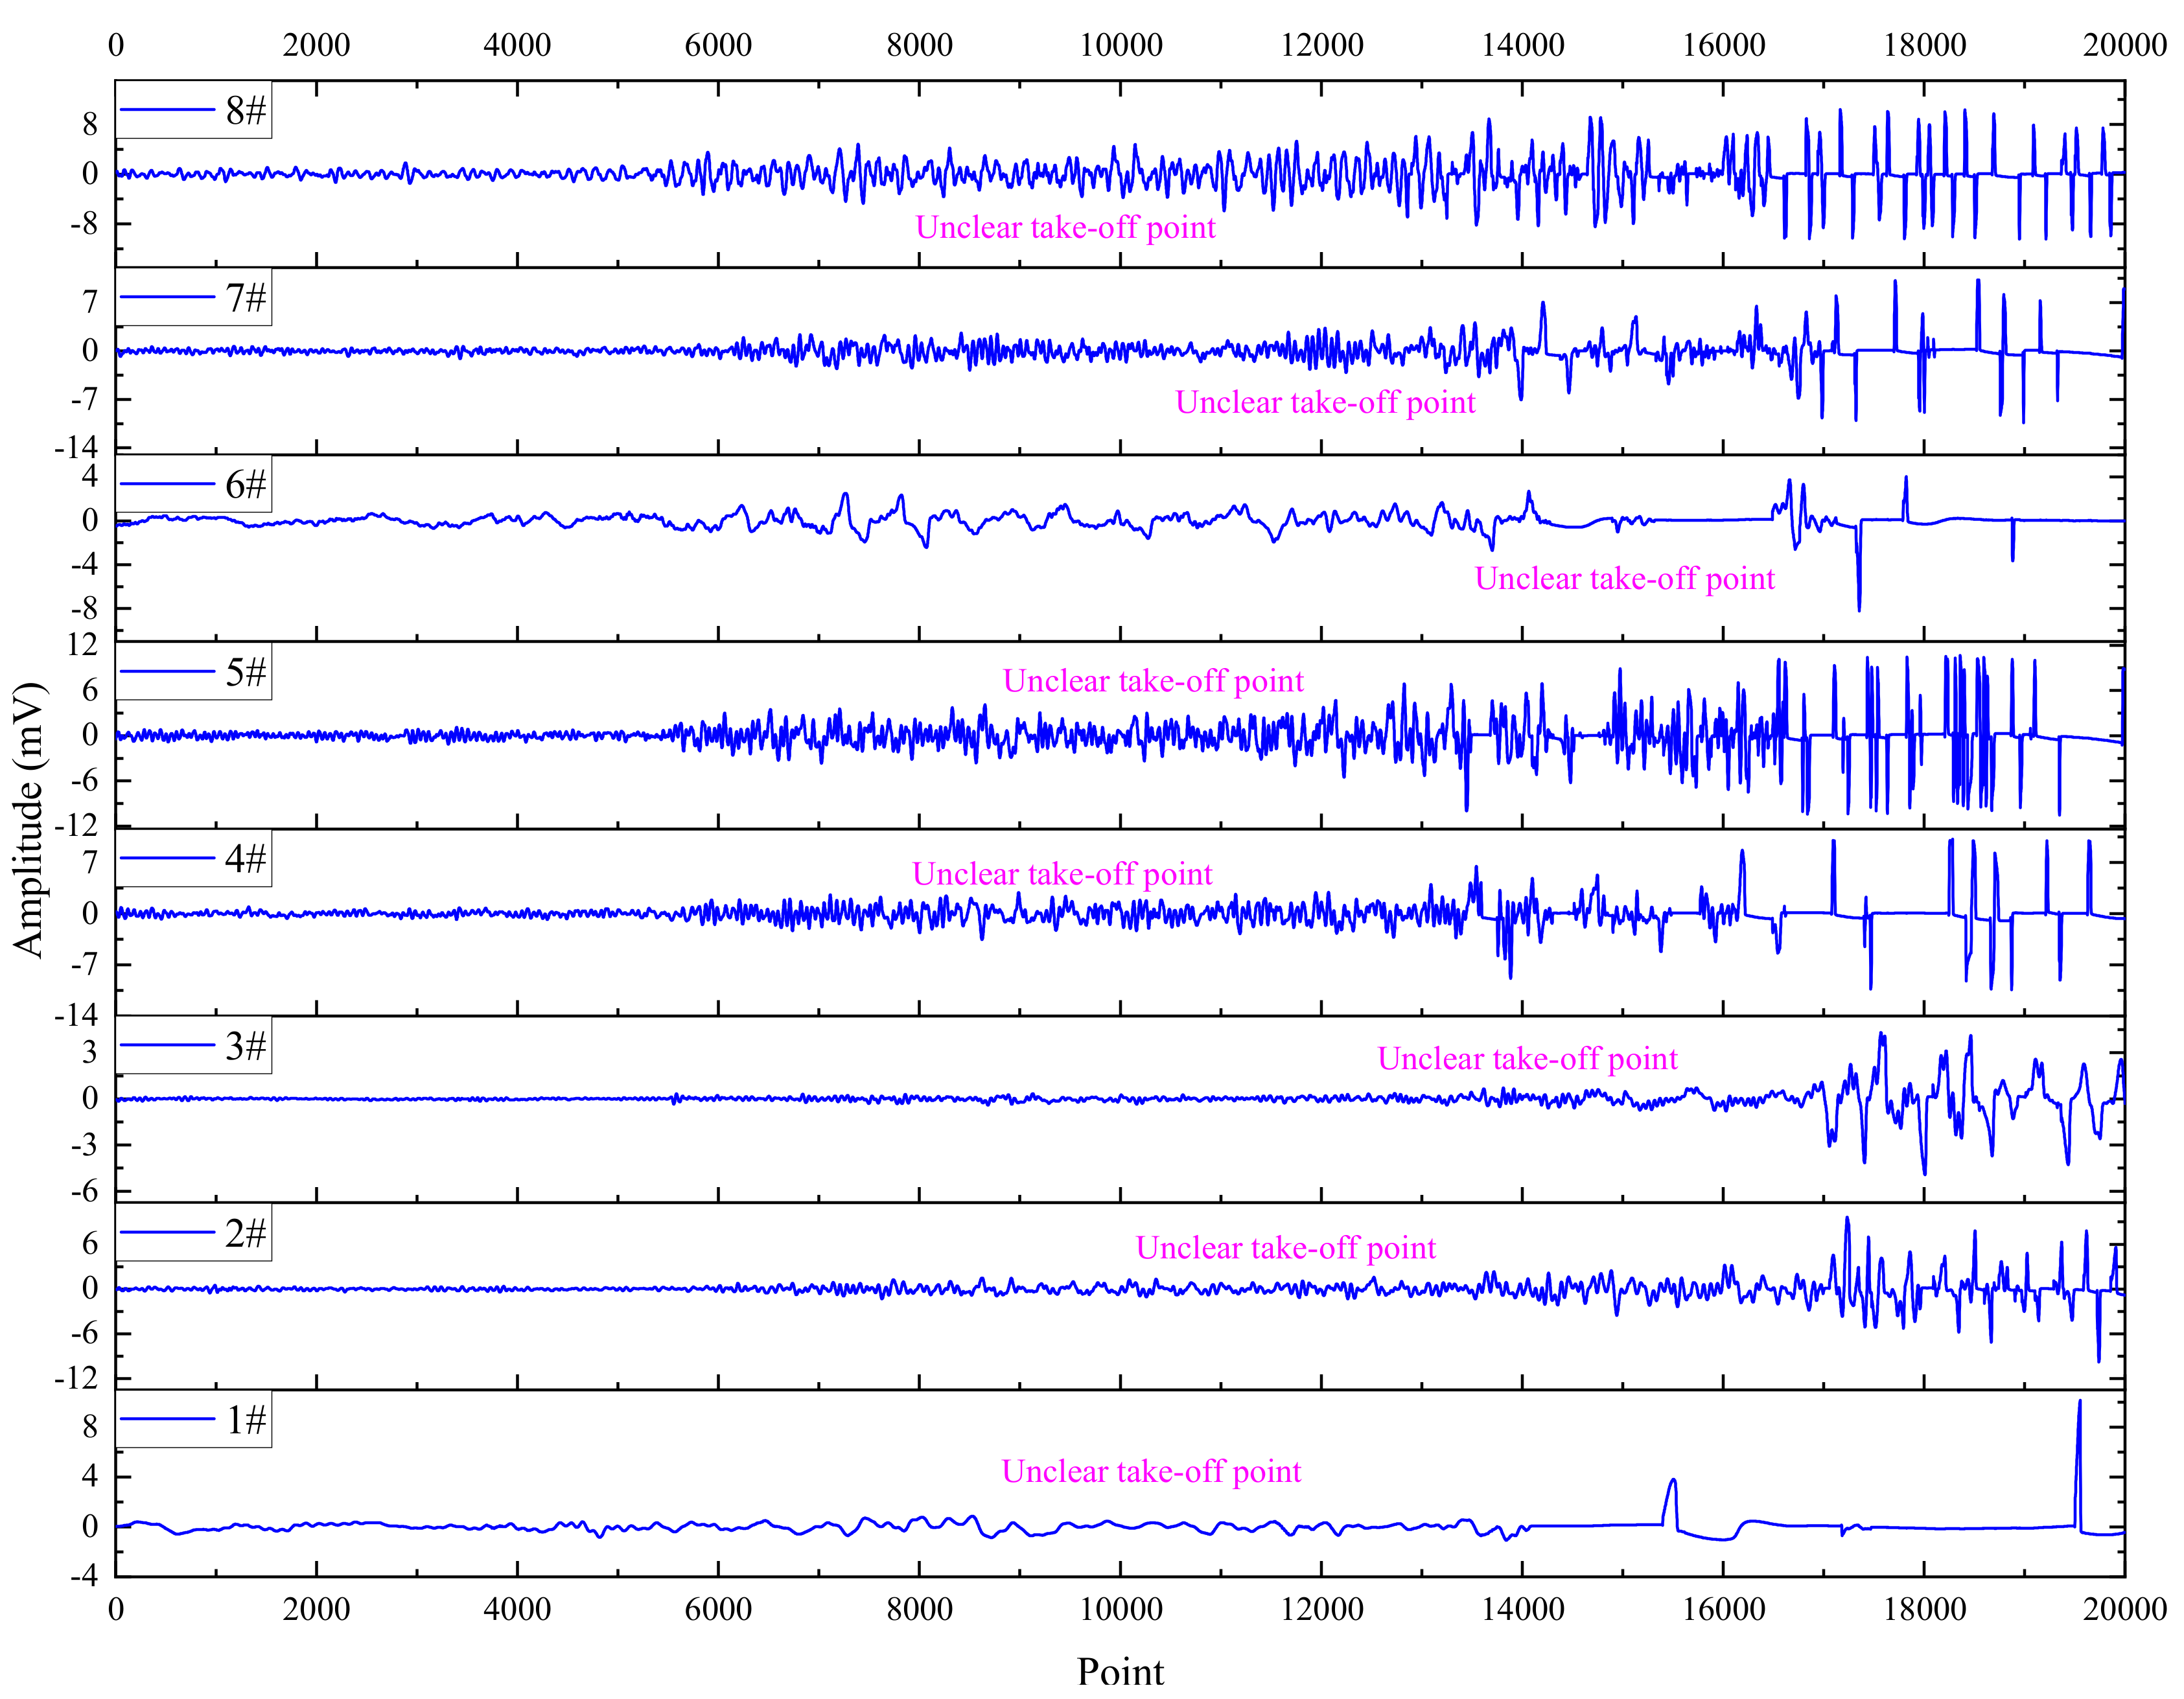
Case waveform IV still has two sensors with slightly clear take-off points; however, the phenomena observed in subsequent time periods of case waveforms V and VI were even more interesting. The waveform results in Figure 7 and Figure 8 (which occurred relatively later than the sample failure) showed that no one sensor had a clear take-off point, which means that it was impossible to determine the true location of the rupture based on the take-off point. Similarly, these two case waveforms also exhibited good event morphology when the horizontal axis scale was reduced, but after amplification (which means displaying the maximum value change in the coordinate axis), the situation was completely different. The increase in amplitude caused by the rupture phenomenon has resulted in a greater impact on the sensor, leading to the unclear take-off points now. Although the waveforms had a certain degree of distortion, and subsequent processing may reduce the distortion to a certain extent, it must be pointed out that the most original waveform was the most real and accurate. It was more reasonable to participate in the process of event localization without waveform processing, and the latter three case waveforms obviously do not have this feature. If the method of picking up take-off points and participating in event localization was adopted, the first three case waveforms were feasible, but the latter three case waveforms that occur in relatively late stages were obviously not feasible. This was the result of manual verification; the workload was enormous [48], and the location of the event should consider the clarity of the take-off points. If not, it was obviously unreasonable to directly use the AE software positioning results as the basis for research without verifying the take-off points of the original waveform. Otherwise, it would lead to a series of incorrect positioning results, greatly affecting the subsequent analysis and judgment work using the wrong positioning results.
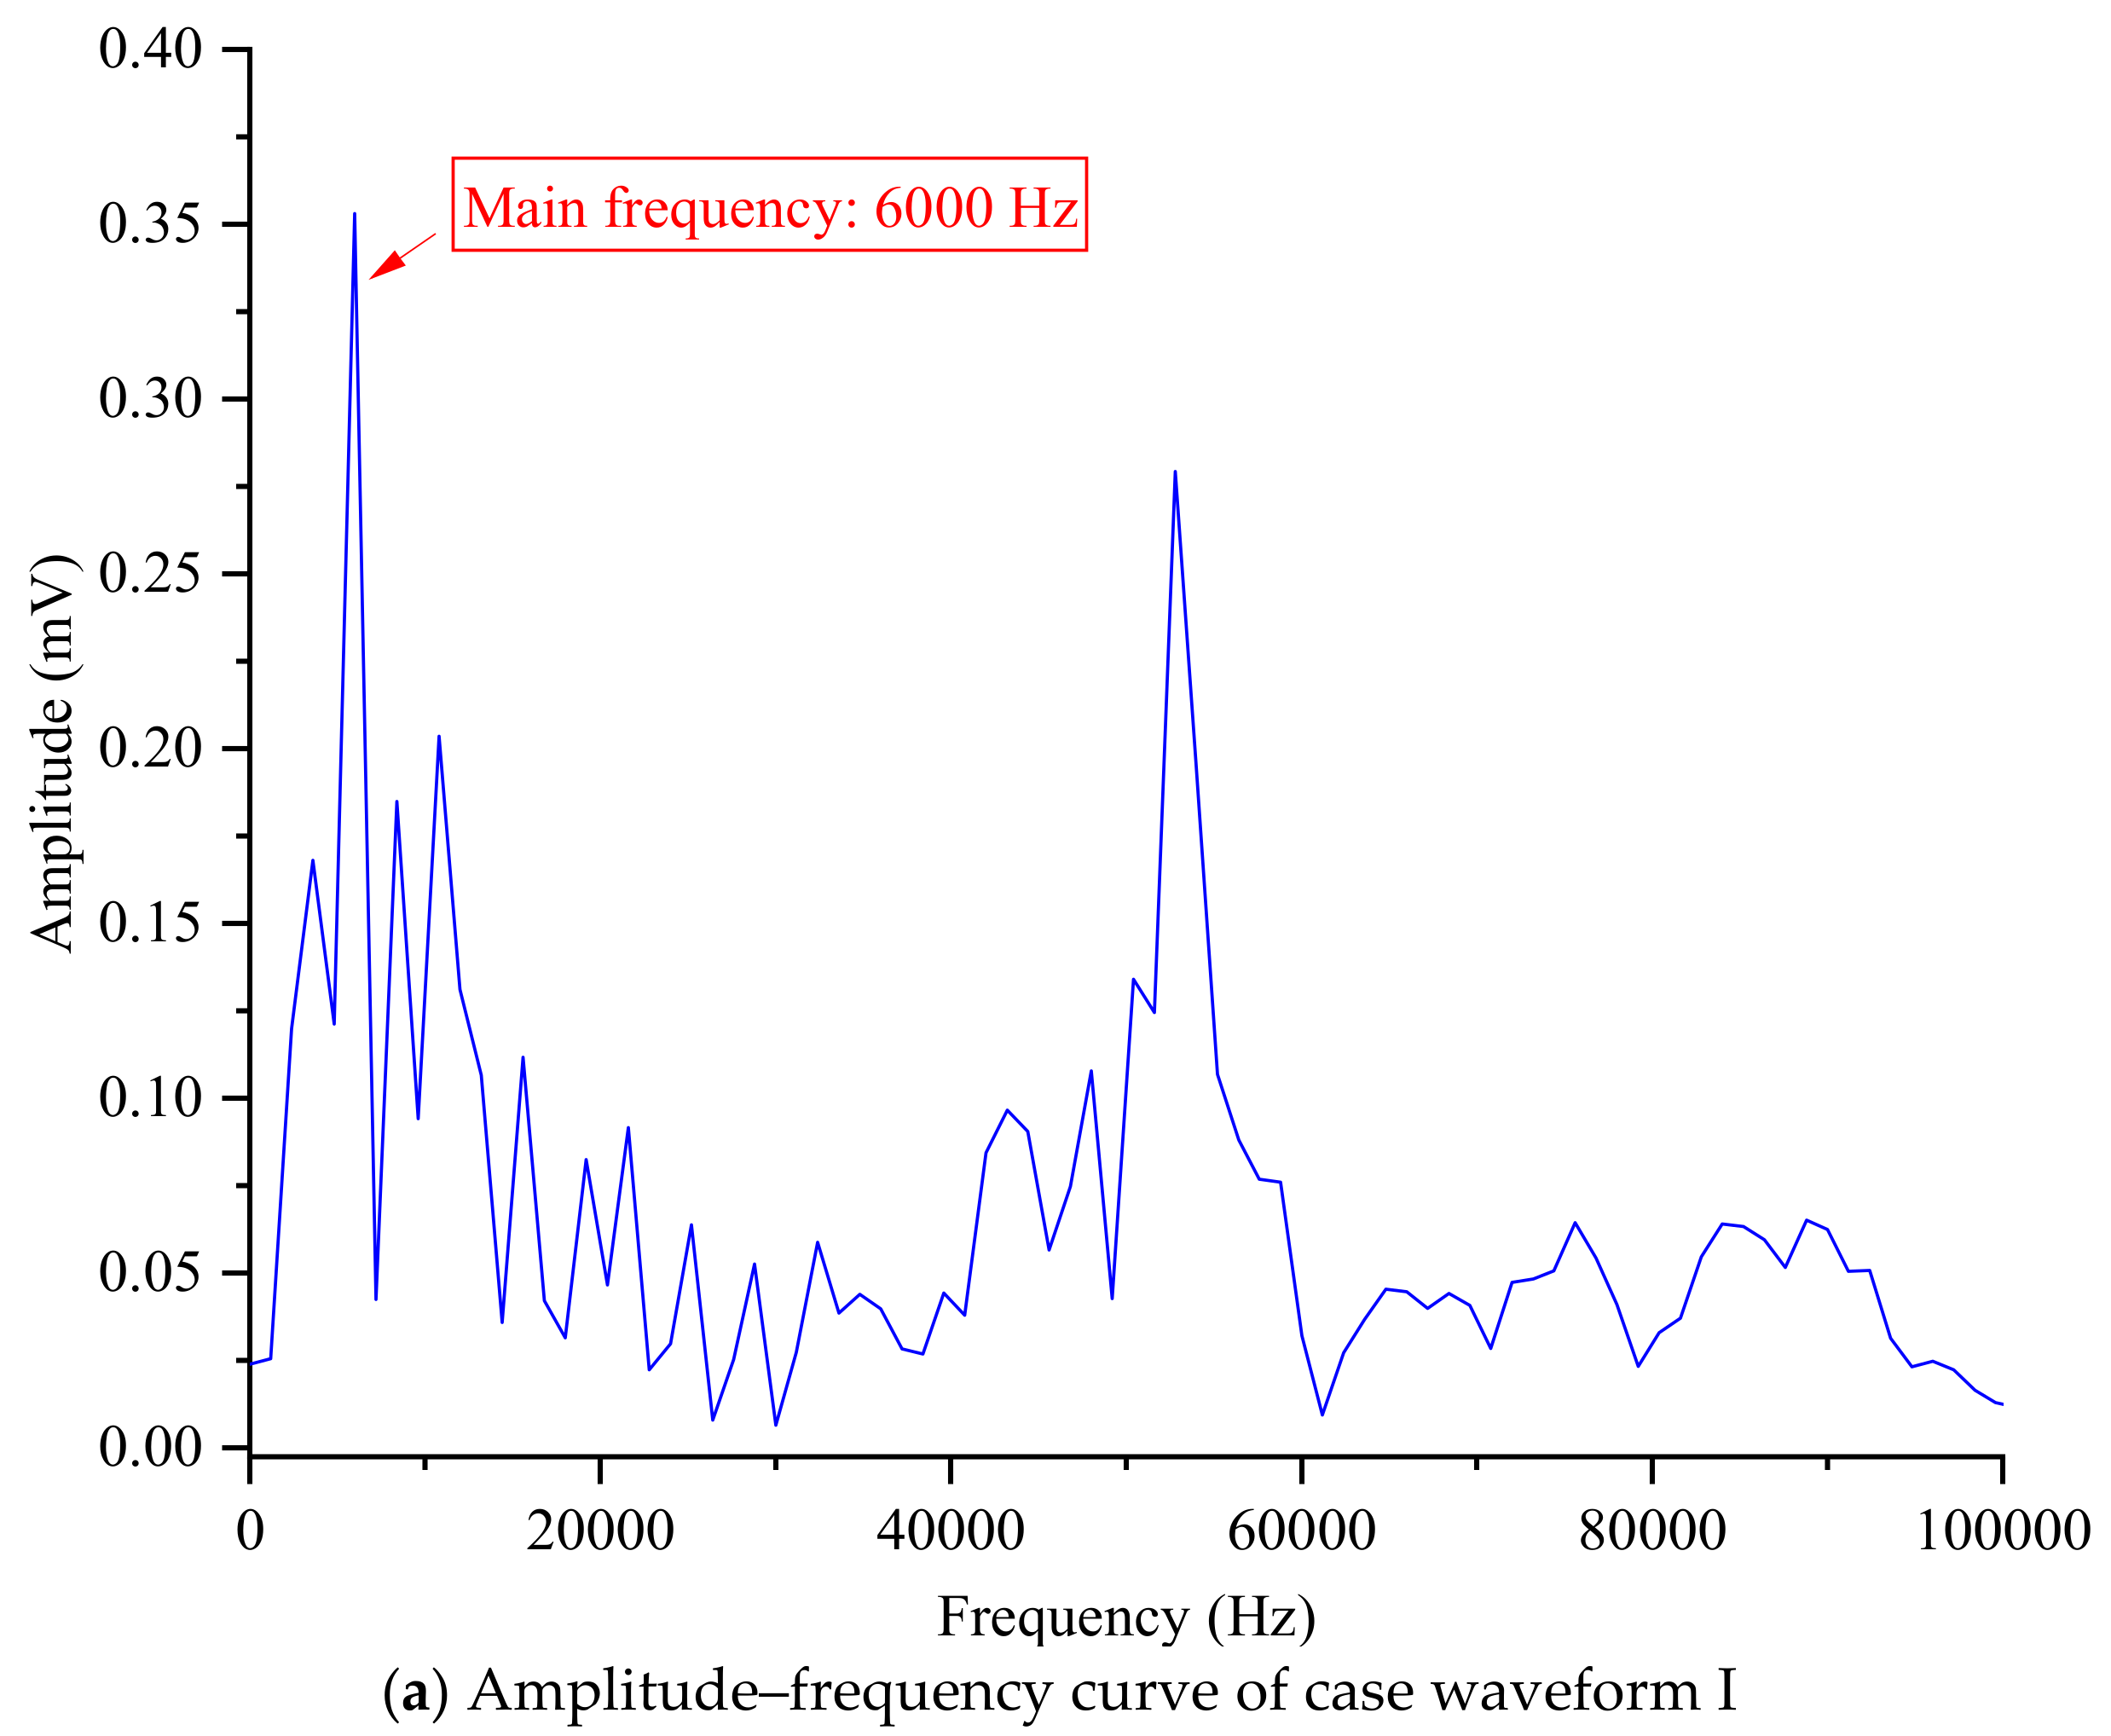
From the above results, it can be seen that the initial three case waveforms were more conventional, but the later three case waveforms exceeded cognition. The results indicated that the initial failure was relatively calm, while the later failure appeared more severe. In order to gain a deeper and clearer understanding of the phenomenon, the dominant frequencies of six case event waveforms were presented, and the results of the initial three waveforms (case waveform I, case waveform II, and case waveform III) were shown in Figure 9 (obtained through Fourier transform). The results show that the dominant frequencies of the initial three events were 6000 Hz, 5400 Hz, and 4321 Hz, respectively, and the spectral distributions were relatively clear and simple. From the position where the maximum amplitude appears, all three main frequencies were relatively small, indicating that the early failure was indeed relatively peaceful. The simplicity and clarity of the spectral curve may further confirm the regularity of the event waveform, which may lead to a smoother analysis and subsequent use of the location.
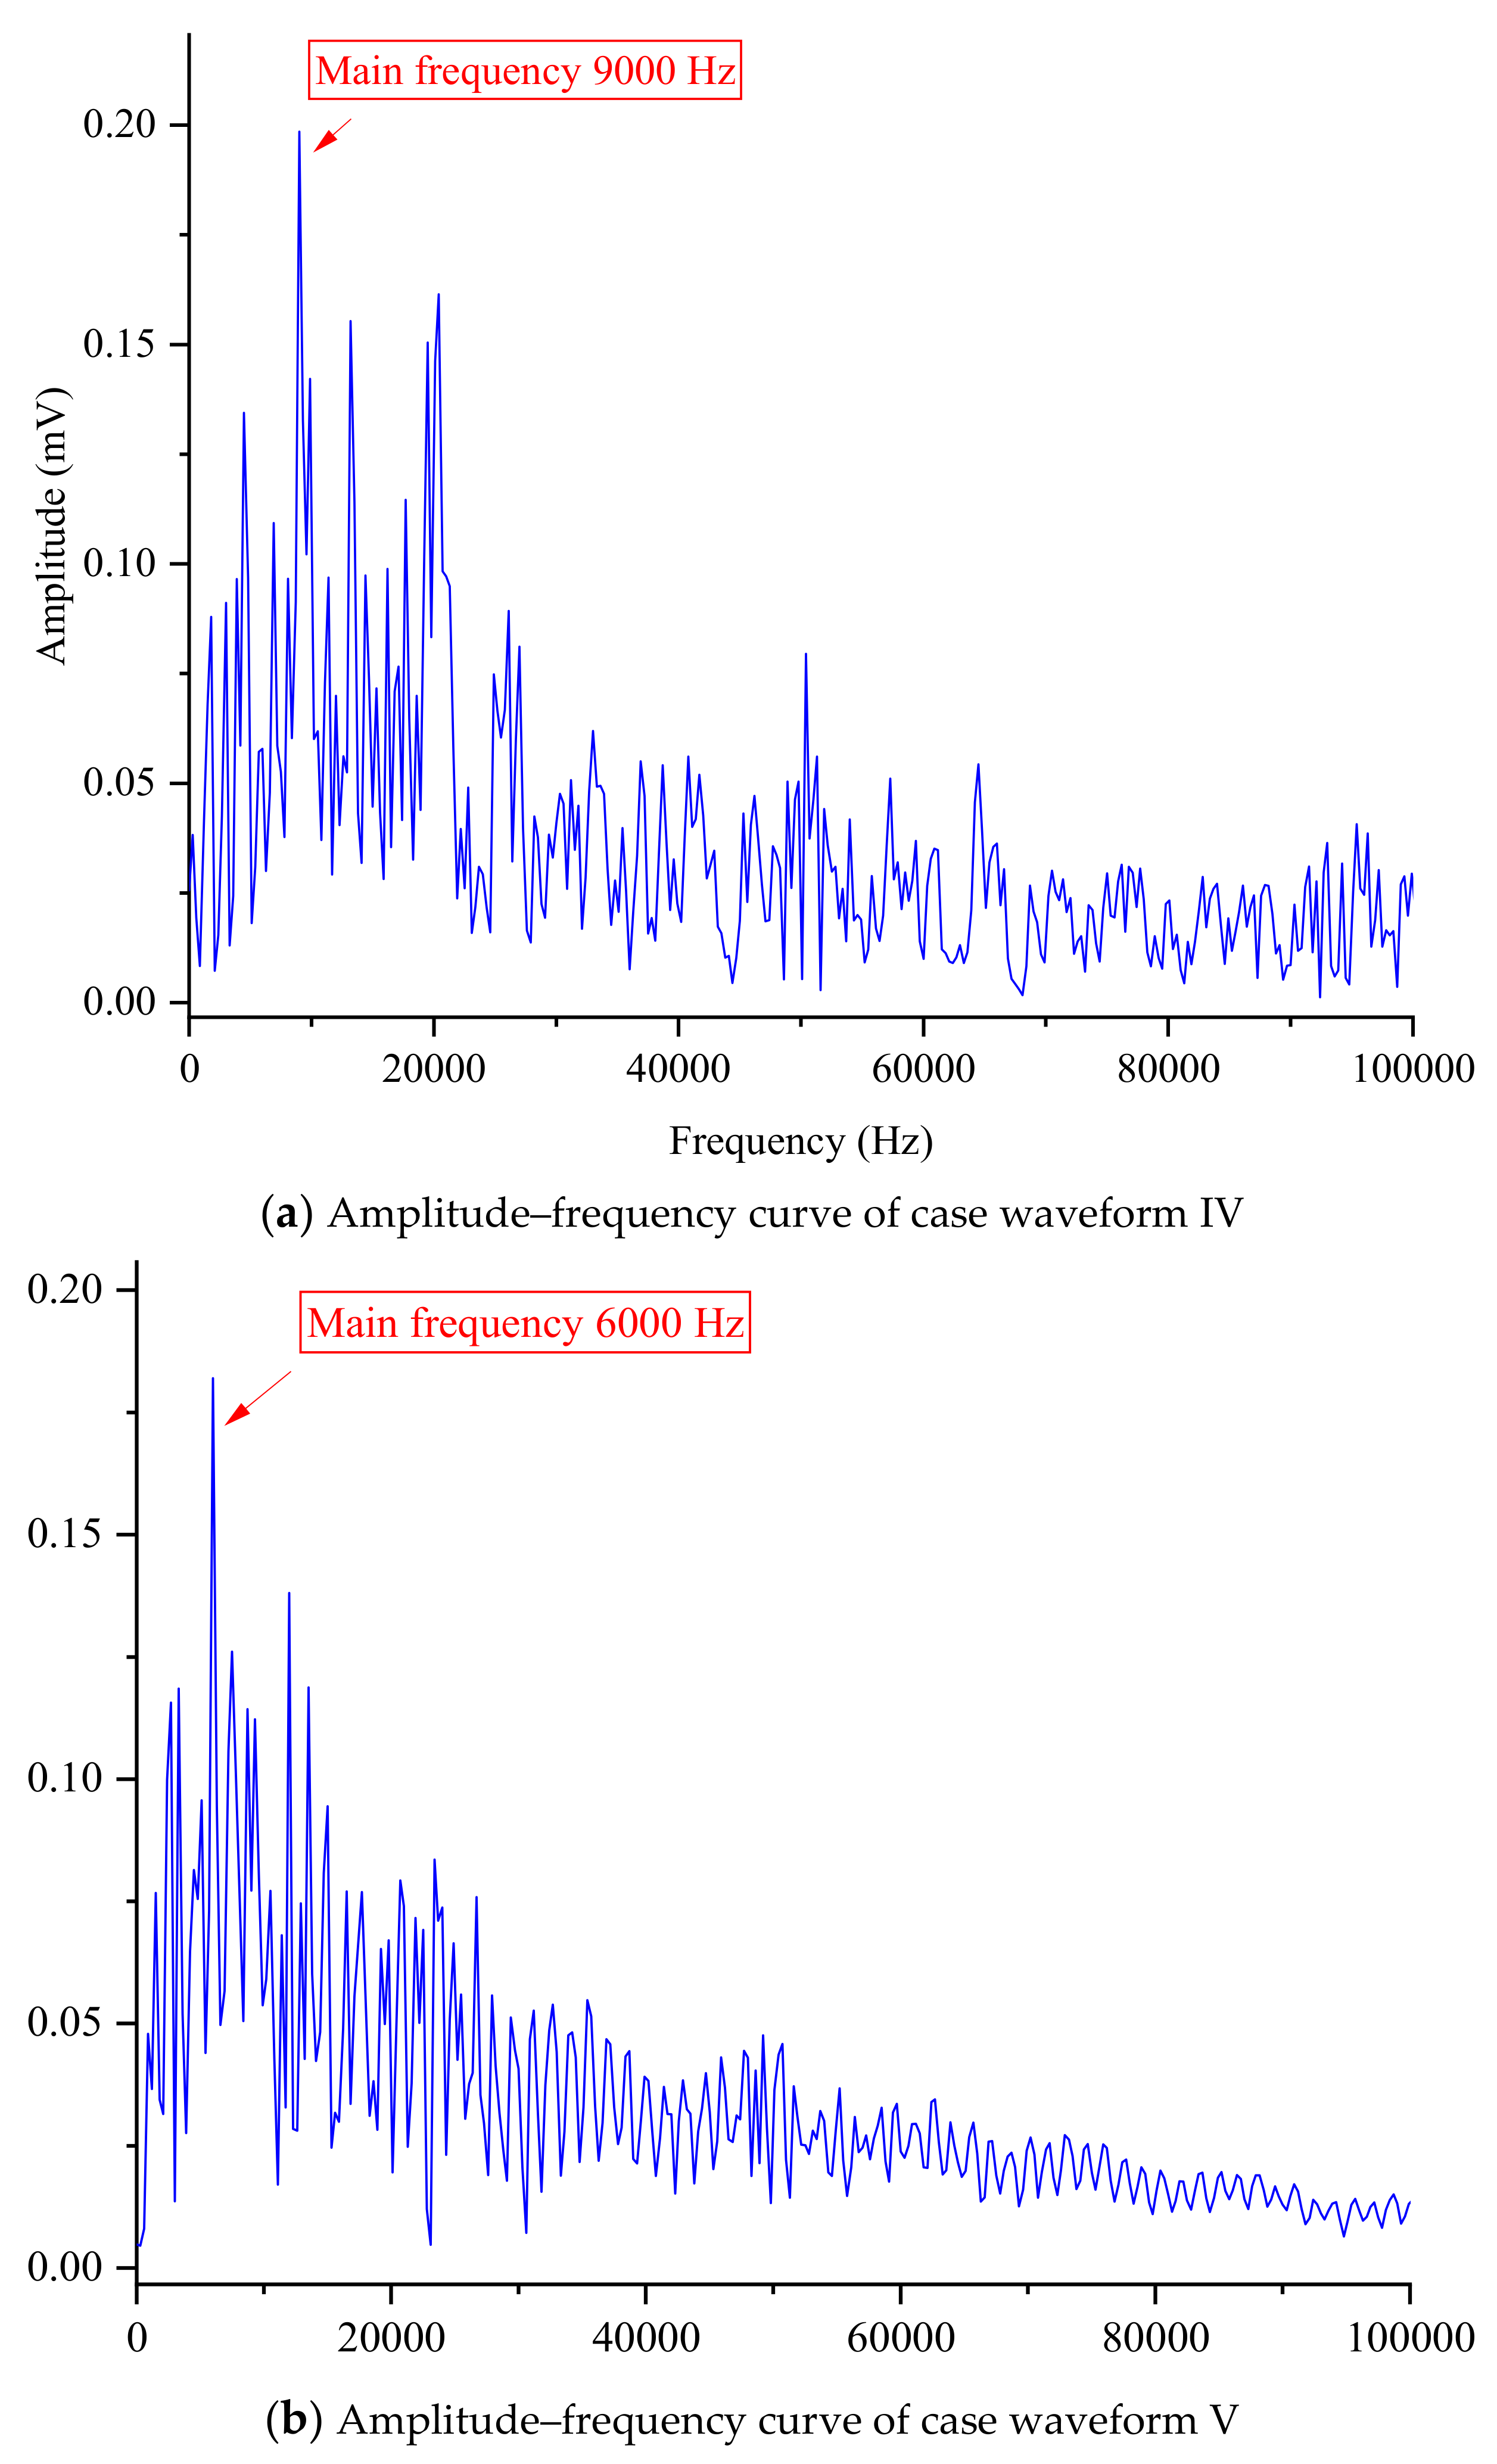
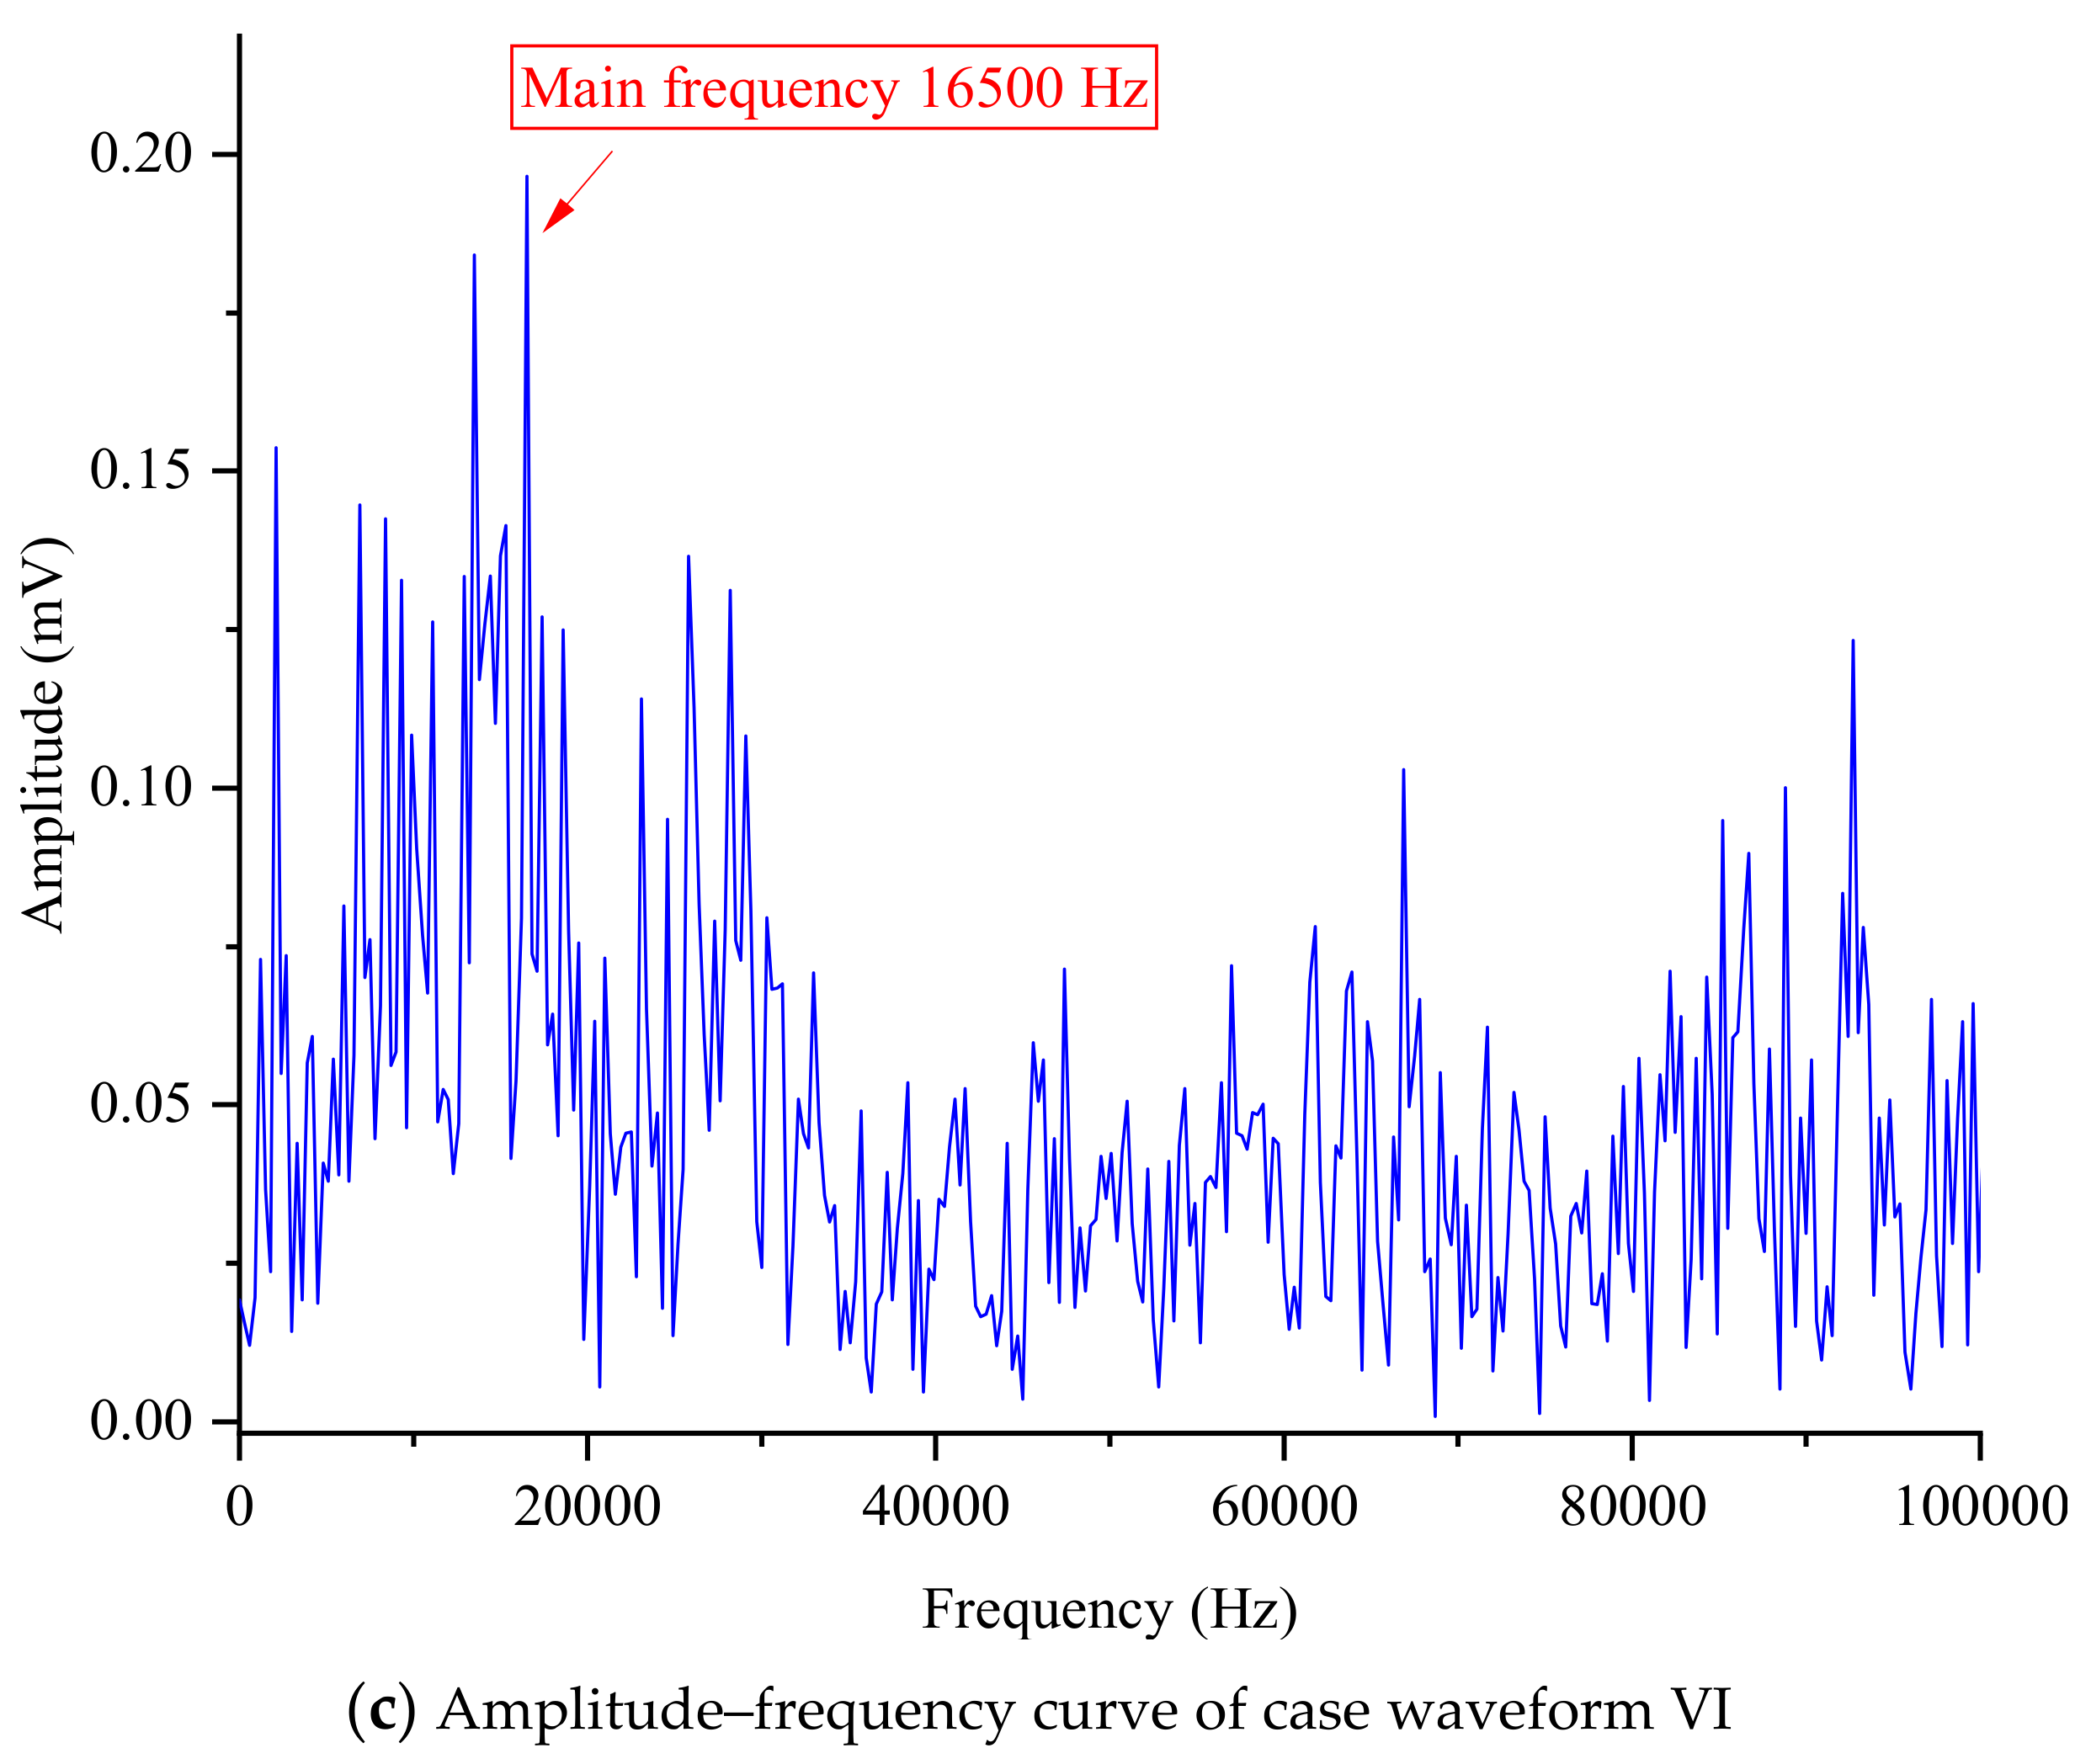
The spectral characteristics (obtained through the Fourier transform) of the three case waveforms IV, V, and VI that occurred during the later stage are also denoted in Figure 10. The results showed that the dominant frequencies of the three event waveforms were 9000 Hz, 6000 Hz, and 16,500 Hz, respectively, and compared to the previous three waveforms, the dominant frequencies of the latter three waveforms were more complex. Although one of the dominant frequencies was the same as one of the previous three waveforms, both at 6000 Hz, the main frequencies of the other two waveforms were clearly higher. The three waveforms in the later stages need to be amplified to determine the specific values of the dominant frequency, which are different from the previous three waveforms. This may indicate that the failure in the later stage was indeed more severe and difficult to analyze and utilize. When encountering such waveform performance and corresponding dominant frequency characteristics in the later stage, researchers should pay special attention and not ignore the positioning process but blindly believe in the location results provided by the built-in software. Such errors were likely to lead to incorrect positioning results and misjudgment of the location of failure, thereby affecting subsequent research results.
The results presented above and the discussions conducted indicate that the failure of burst-prone rocks may be relatively complex. The initial failure was relatively orderly and simple, with a small amplitude and energy value of the feedback AE event. The take-off points were clear and could be located using a method that relies on the take-off points. However, the unexpected fact was that the later failure became increasingly complex. Some events caused some sensor waveforms to have slightly clearer take-off points, but most events had unclear take-off points. The above facts indicated that the initial failure was small and scattered, while the later failure was large and concentrated, with certain fractal characteristics. It was not possible to simply rely on software positioning results without viewing the waveform. It was unreasonable to only focus on and utilize the results without grasping the accuracy of the process. Of course, it should be pointed out that only the results of one sample were used for analysis and discussion, and further validation should be conducted in the future. The similarities, differences, and any significant trends between samples will improve the reliability and comprehensiveness of the research results. Also, the waveforms were used for research without undergoing filtering or other subsequent operations, but it should be pointed out that the most primitive waveform was often the most accurate and should be used for event localization.

4. Conclusions

In order to improve the accuracy of AE event localization and study the failure law of burst-prone rocks, this study provided a detailed analysis and discussion of the AE event signals during the compression process of a rock sample. The results showed that the waveform of AE events in the early stage of destruction had clear take-off points, which can be located using conventional algorithms or even built-in software for subsequent failure research. However, as the loading continued, some take-off points of the sensors became unclear, and in the end, all take-off points of the sensors became unclear and could not be simply used for event positioning. The waveform results indicated that the rock failure with a burst tendency was characterized by distinct stages, with a relatively calm initial failure that gradually became severe and finally became very severe, resulting in different periodic responses in the AE waveform state. The dominant frequency characteristics at different stages also confirm the severity of the failure. From the perspective of fractal characteristics, failure may change from consistency to inconsistency, ultimately leading to instantaneous failure of the sample. The research results remind researchers of AE event localization that the original waveforms should be analyzed first, and then a more suitable algorithm should be chosen for precise localization. They cannot simply use the localization results of the built-in software for damage analysis.

Author Contributions

Conceptualization, W.Z.; methodology, J.Y.; software, X.X.; validation, W.Z.; formal analysis, W.Z.; investigation, J.R.; resources, H.S.; data curation, J.R.; writing—original draft preparation, W.Z.; writing—review and editing, K.L. All authors have read and agreed to the published version of the manuscript.

Funding

The authors gratefully acknowledge the financial support of the Open Fund of Shaanxi Key Laboratory of Safety and Durability of Concrete Structures (SZ02303) and Shandong Province Higher Education “Youth Innovation and Technology Support Program” (2021KJ110).

Data Availability Statement

The data presented in this study are available on request from the corresponding author.

Conflicts of Interest

Jiajia Yu was employed by the Zhejiang Qinhe Environmental Construction Co., Ltd. The remaining authors declare that the research was conducted in the absence of any commercial or financial relationships that could be construed as a potential conflict of interest.

References

  1. Leake, M.R.; Conrad, W.J.; Westman, E.C.; Ghaychi Afrouz, S.; Molka, R.J. Microseismic monitoring and analysis of induced seismicity source mechanisms in a retreating room and pillar coal mine in the Eastern United States. Undergr. Space 2017, 2, 115–124. [Google Scholar] [CrossRef]
  2. Mark, C. Coal bursts that occur during development: A rock mechanics enigma. Int. J. Min. Sci. Technol. 2018, 28, 35–42. [Google Scholar] [CrossRef]
  3. Guo, W.-Y.; Zhao, T.-B.; Tan, Y.-L.; Yu, F.-H.; Hu, S.-C.; Yang, F.-Q. Progressive mitigation method of rock bursts under complicated geological conditions. Int. J. Rock Mech. Min. Sci. 2017, 96, 11–22. [Google Scholar] [CrossRef]
  4. Małkowski, P.; Juszyński, D. Roof fall hazard assessment with the use of artificial neural network. Int. J. Rock Mech. Min. Sci. 2021, 143, 104701. [Google Scholar] [CrossRef]
  5. Fulawka, K.; Stolecki, L.; Szumny, M.; Pytel, W.; Jaskiewicz-Proc, I.; Jakic, M.; Noeger, M.; Hartlieb, P. Roof Fall Hazard Monitoring and Evaluation-State-of-the-Art Review. Energies 2022, 15, 8312. [Google Scholar] [CrossRef]
  6. Wu, D.; Gao, Y.; Chen, X.; Wang, Y. Effects of Soil Strength Nonlinearity on Slip Surfaces of Homogeneous Slopes. Int. J. Geomech. 2021, 21, 06020035. [Google Scholar] [CrossRef]
  7. Zhang, J.; Huang, H.W. Risk assessment of slope failure considering multiple slip surfaces. Comput. Geotech. 2016, 74, 188–195. [Google Scholar] [CrossRef]
  8. Kovachev, S.A.; Ganzha, O.Y. Structure of the Earth’s Crust of the Persian Gulf According to Deep Seismic Sounding Results. Oceanology 2023, 63, 719–732. [Google Scholar] [CrossRef]
  9. Kovachev, S.A.; Krylov, A.A. Results of Seismological Monitoring in the Baltic Sea and Western Part of the Kaliningrad Oblast Using Bottom Seismographs. Izv.-Phys. Solid Earth 2023, 59, 190–208. [Google Scholar] [CrossRef]
  10. Kovachev, S.A.; Krylov, A.A. Microseismicity in the Persian Gulf and in the Zagros Mountain Massif according to OBS Observations. J. Volcanol. Seismol. 2023, 17, 474–490. [Google Scholar] [CrossRef]
  11. Krylov, A.A.; Novikov, M.A.; Kovachev, S.A.; Roginskiy, K.A.; Ilinsky, D.A.; Ganzha, O.Y.; Ivanov, V.N.; Timashkevich, G.K.; Samylina, O.S.; Lobkovsky, L.I.; et al. Features of Seismological Observations in the Arctic Seas. J. Mar. Sci. Eng. 2023, 11, 2221. [Google Scholar] [CrossRef]
  12. Feng, J.; Wang, E.; Ding, H.; Huang, Q.; Chen, X. Deterministic seismic hazard assessment of coal fractures in underground coal mine: A case study. Soil Dyn. Earthq. Eng. 2020, 129, 105921. [Google Scholar] [CrossRef]
  13. Zhang, W.L.; Ma, N.J.; Ma, J.; Li, C.; Ren, J.J. Mechanism of Rock Burst Revealed by Numerical Simulation and Energy Calculation. Shock. Vib. 2020, 2020, 15. [Google Scholar] [CrossRef]
  14. Aker, E.; Kühn, D.; Vavryčuk, V.; Soldal, M.; Oye, V. Experimental investigation of acoustic emissions and their moment tensors in rock during failure. Int. J. Rock Mech. Min. Sci. 2014, 70, 286–295. [Google Scholar] [CrossRef]
  15. Zhang, W.; Li, C.; Jin, J.; Qu, X.; Fan, S.; Xin, C. A new monitoring-while-drilling method of large diameter drilling in underground coal mine and their application. Measurement 2021, 173, 108840. [Google Scholar] [CrossRef]
  16. Zhang, W.; Huo, T.; Li, C.; Wang, C.; Qu, X.; Xin, C.; Berardengo, M. Characteristics of Valuable Microseismic Events in Heading Face of an Underground Coal Mine Using Microseismic System. Shock. Vib. 2021, 2021, 6683238. [Google Scholar] [CrossRef]
  17. Shang, X.Y.; Wang, Y.; Miao, R.X. Acoustic emission source location from P-wave arrival time corrected data and virtual field optimization method. Mech. Syst. Signal Process. 2022, 163, 108129. [Google Scholar] [CrossRef]
  18. Li, S.-c.; Cheng, S.; Li, L.-p.; Shi, S.-s.; Zhang, M.-g. Identification and Location Method of Microseismic Event Based on Improved STA/LTA Algorithm and Four-Cell-Square-Array in Plane Algorithm. Int. J. Geomech. 2019, 19, 04019067. [Google Scholar] [CrossRef]
  19. Pomponi, E.; Vinogradov, A.; Danyuk, A. Wavelet based approach to signal activity detection and phase picking: Application to acoustic emission. Signal Process. 2015, 115, 110–119. [Google Scholar] [CrossRef]
  20. Krylov, A.; Lobkovsky, L.I.; Ivashchenko, A.I. Automated detection of microearthquakes in continuous noisy records produced by local ocean bottom seismographs or coastal networks. Russ. J. Earth Sci. 2019, 19, ES2001. [Google Scholar] [CrossRef]
  21. Zhu, M.; Cheng, J.; Zhang, Z. Quality control of microseismic P-phase arrival picks in coal mine based on machine learning. Comput. Geosci. 2021, 156, 104862. [Google Scholar] [CrossRef]
  22. Ma, H.; Wang, T.; Li, Y.; Meng, Y. A Time Picking Method for Microseismic Data Based on LLE and Improved PSO Clustering Algorithm. IEEE Geosci. Remote Sens. Lett. 2018, 15, 1677–1681. [Google Scholar] [CrossRef]
  23. Meng, Y.; Li, Y.; Zhang, C.; Zhao, H. A Time Picking Method Based on Spectral Multimanifold Clustering in Microseismic Data. IEEE Geosci. Remote Sens. Lett. 2017, 14, 1273–1277. [Google Scholar] [CrossRef]
  24. Kim, D.; Byun, J.; Lee, M.; Choi, J.; Kim, M. Fast first arrival picking algorithm for noisy microseismic data. Explor. Geophys. 2017, 48, 131–136. [Google Scholar] [CrossRef]
  25. Liu, N.; Chen, J.; Wu, H.; Li, F.; Gao, J. Microseismic First-Arrival Picking Using Fine-Tuning Feature Pyramid Networks. IEEE Geosci. Remote Sens. Lett. 2022, 19, 7505105. [Google Scholar] [CrossRef]
  26. Guo, C.; Zhu, T.; Gao, Y.; Sun, J. AEnet: Automatic Picking of P-Wave First Arrivals Using Deep Learning. IEEE Trans. Geosci. Remote Sens. 2021, 59, 5293–5303. [Google Scholar] [CrossRef]
  27. Wang, J.; Xiao, Z.; Liu, C. PickNet code: Deep learning for picking seismic arrival times. J. Geophys. Res. Solid Earth 2019, 124, 6612–6624. [Google Scholar] [CrossRef]
  28. Diehl, T.; Deichmann, N.; Kissling, E.; Husen, S. Automatic S-Wave Picker for Local Earthquake Tomography. Bull. Seismol. Soc. Am. 2009, 99, 1906–1920. [Google Scholar] [CrossRef]
  29. Kim, G.; Seo, M.K.; Choi, N.; Baek, K.S.; Kim, K.B. Application of KLM Model for an Ultrasonic through-Transmission Method. Int. J. Precis. Eng. Manuf. 2019, 20, 383–393. [Google Scholar] [CrossRef]
  30. Chen, H.; Yang, Z. Arrival Picking of Acoustic Emission Signals Using a Hybrid Algorithm Based on AIC and Histogram Distance. IEEE Trans. Instrum. Meas. 2021, 70, 3505808. [Google Scholar] [CrossRef]
  31. Zhu, D.; Li, Y.; Zhang, C. Automatic Time Picking for Microseismic Data Based on a Fuzzy C-Means Clustering Algorithm. IEEE Geosci. Remote Sens. Lett. 2016, 13, 1900–1904. [Google Scholar] [CrossRef]
  32. Qin, Z.; Pan, S.; Chen, J.; Cui, Q.; He, J. Method of Automatically Detecting the Abnormal First Arrivals Using Delay Time (December 2020). IEEE Trans. Geosci. Remote Sens. 2022, 60, 4504908. [Google Scholar] [CrossRef]
  33. Hafez, A.G.; Rabie, M.; Kohda, T. Seismic noise study for accurate P-wave arrival detection via MODWT. Comput. Geosci. 2013, 54, 148–159. [Google Scholar] [CrossRef]
  34. Kaveh, M.S.; Mansouri, R.; Keshavarz, A. Automatic P-wave picking using undecimated wavelet transform. J. Seismol. 2019, 23, 1031–1046. [Google Scholar] [CrossRef]
  35. Zhang, W.L.; Lian, X.Y.; Wu, Z. A multi-channel verification index to improve distinguish accuracy of target signals in rock burst monitoring of heading face. Measurement 2022, 189, 10. [Google Scholar] [CrossRef]
  36. Benavente, D.; Galiana-Merino, J.J.; Pla, C.; Martinez-Martinez, J.; Crespo-Jimenez, D. Automatic detection and characterisation of the first P- and S-wave pulse in rocks using ultrasonic transmission method. Eng. Geol. 2020, 266, 105474. [Google Scholar] [CrossRef]
  37. Kong, B.; Li, Z.H.; Wang, E.Y. Fine characterization rock thermal damage by acoustic emission technique. J. Geophys. Eng. 2018, 15, 1–12. [Google Scholar] [CrossRef]
  38. Liu, C.; Shang, X.; Miao, R. Acoustic emission source location on a cylindrical shell structure through grouped sensors based analytical solution and data field theory. Appl. Acoust. 2022, 192, 108747. [Google Scholar] [CrossRef]
  39. Charles, M.; Maochen, G. Enhancing manual P-phase arrival detection and automatic onset time picking in a noisy microseismic data in underground mines. Int. J. Min. Sci. Technol. 2018, 28, 691–699. [Google Scholar]
  40. Hassan, F.; Mahmood, A.K.B.; Yahya, N.; Khan, Z.; Rimsan, M. State-of-the-Art Review on the Acoustic Emission Source Localization Techniques. IEEE Access 2021, 9, 101246–101266. [Google Scholar] [CrossRef]
  41. Kepak, S.; Stolarik, M.; Nedoma, J.; Martinek, R.; Kolarik, J.; Pinka, M. Alternative Approaches to Vibration Measurement Due to the Blasting Operation: A Pilot Study. Sensors 2019, 19, 4084. [Google Scholar] [CrossRef] [PubMed]
  42. Xie, X.; Li, S.; Guo, J. Study on Multiple Fractal Analysis and Response Characteristics of Acoustic Emission Signals from Goaf Rock Bodies. Sensors 2022, 22, 2746. [Google Scholar] [CrossRef]
  43. Chen, Y.; Zhang, M.; Wu, H.; Zhang, K.; Qian, D. Improving the Positioning Accuracy of Acoustic Emission Events by Optimizing the Sensor Deployment and First Arrival Signal Picking. IEEE Access 2020, 8, 71160–71172. [Google Scholar] [CrossRef]
  44. Jiang, Y.J.; Peng, P.G.; Wang, L.G.; He, Z.X. Automated Locating Mining-Induced Microseismicity without Arrival Picking by Weighted STA/LTA Traces Stacking. Sustainability 2020, 12, 3665. [Google Scholar] [CrossRef]
  45. Zhang, W.; Feng, X.T.; Bi, X.; Yao, Z.B.; Xiao, Y.X.; Hu, L.; Niu, W.J.; Feng, G.L. An arrival time picker for microseismic rock fracturing waveforms and its quality control for automatic localization in tunnels—ScienceDirect. Comput. Geotech. 2021, 135, 104175. [Google Scholar] [CrossRef]
  46. Madarshahian, R.; Ziehl, P.; Caicedo, J.M. Acoustic emission Bayesian source location: Onset time challenge. Mech. Syst. Signal Process. 2019, 123, 483–495. [Google Scholar] [CrossRef]
  47. Zhang, W.L.; Feng, J.C.; Ma, J.; Shi, J.J. The Revealed Mechanism of Rock Burst Based on an Innovative Calculation Method of Rock Mass Released Energy. Int. J. Environ. Res. Public Health 2022, 19, 16636. [Google Scholar] [CrossRef]
  48. Wu, H.; Zhang, B.; Li, F.; Liu, N. Semi-automatic first arrival picking of micro-seismic events by using pixel-wise convolutional image segmentation method. Geophysics 2019, 84, 1–70. [Google Scholar] [CrossRef]
Figure 1. Loading equipment and synchronous AE monitoring.
Buildings 14 01331 g001
Figure 2. Case AE waveform capture (selected during the loading phase).
Buildings 14 01331 g002
Figure 3. Case waveform I of an AE event that occurs relatively early (clear take-off point).
Buildings 14 01331 g003
Figure 4. Case waveform II of an AE event that occurs relatively early (clear take-off point).
Buildings 14 01331 g004
Figure 5. Case waveform III of an AE event that occurs relatively early (clear take-off point).
Buildings 14 01331 g005
Figure 6. Case waveform IV of an AE event that occurs during the transitional phase (the most unclear take-off point).
Buildings 14 01331 g006
Figure 7. Case waveform V of an AE event that occurs relatively later (unclear take-off points of all the monitoring sensors).
Buildings 14 01331 g007
Figure 8. Case waveform VI of an AE event that occurs relatively later (unclear take-off points of all the monitoring sensors).
Buildings 14 01331 g008
Figure 9. Amplitude–frequency curve of case waveforms I, II, and III.
Buildings 14 01331 g009aBuildings 14 01331 g009b
Figure 10. Amplitude–frequency curve of case waveforms IV, V, and VI.
Buildings 14 01331 g010aBuildings 14 01331 g010b
Table 1. Sensor coordinates used (unit mm).
SensorsCoordinateSensorsCoordinate
Sensor 1#(180, 0, 20)Sensor 5#(180, 180, 20)
Sensor 2#(20, 0, 180)Sensor 6#(180, 20, 180)
Sensor 3#(0, 20, 20)Sensor 7#(20, 180, 20)
Sensor 4#(0, 180, 180)Sensor 8#(180, 180, 180)
Disclaimer/Publisher’s Note: The statements, opinions and data contained in all publications are solely those of the individual author(s) and contributor(s) and not of MDPI and/or the editor(s). MDPI and/or the editor(s) disclaim responsibility for any injury to people or property resulting from any ideas, methods, instructions or products referred to in the content.