Article

Shaking Table Tests and Numerical Analysis Conducted on an Aluminum Alloy Single-Layer Spherical Reticulated Shell with Fully Welded Connections

1
School of Civil Engineering, Xi’an University of Architecture & Technology, Xi’an 710055, China
2
School of Civil Engineering and Architecture, Henan University of Science and Technology, Luoyang 471023, China
3
School of Architectural Engineering, Xi’an Technological University, Xi’an 710021, China
4
China Northwest Architecture Design and Research Institute Co., Ltd., Xi’an 710018, China
*
Author to whom correspondence should be addressed.
Buildings 2024, 14(5), 1354; https://doi.org/10.3390/buildings14051354
Submission received: 9 April 2024 / Revised: 4 May 2024 / Accepted: 5 May 2024 / Published: 9 May 2024
(This article belongs to the Section Building Materials, and Repair & Renovation)

Abstract

:
Aluminum alloy offers the advantages of being lightweight, high in strength, corrosion-resistant, and easy to process. It has a promising application prospect in large-span space structures, with its primary application form being single-layer reticulated shells. In this study, shaking table tests were conducted on a 1/25 scale aluminum alloy single-layer spherical reticulated shell structure. A finite element (FE) model of the reticulated shell structure was established in Ansys. Compared with the experimental results, the deviation in natural frequency, acceleration amplitude, and displacement amplitude was less than 20%, confirming the validity of the model. An extensive analysis of the various rise–span ratios and connection constraints of a single-layer spherical reticulated shell structure was carried out using the proposed FE model. The experimental and simulation results showed that as the rise–span ratio of the aluminum alloy reticulated shell increases, the natural frequency of the reticulated shell structure also increases while the dynamic performance decreases. The connection of the circumferential members changes from a rigid connection to a hinged connection. The natural frequency of the reticulated shell structure is reduced by about 40% while the acceleration and displacement response values are decreased by approximately 15%.

1. Introduction

The reticulated shell is a common spatial structure that combines the mechanical characteristics of a thin shell structure and a bar system. Reasonable design can help distribute the bearing capacity of the bar evenly and enable it to withstand a large span. The entire structure offers the benefits of high rigidity, minimal deformation, excellent stability, and material conservation [1,2,3].
Aluminum alloy material offers advantages such as high strength, good corrosion resistance, low maintenance cost, strong plasticity, and a high recycling rate [4,5]. Therefore, the aluminum alloy spatial reticulated shell structure is not only used in large public buildings such as stadiums, international convention and exhibition centers, and museums but also holds promising application prospects in corrosive environments like storage tanks for petrochemical products, mountain plateaus, and coastal swimming pools [6,7,8].
Since the 1940s, researchers have conducted comprehensive studies on the structure of aluminum alloys. In the past 80 years, scientific research in this field has made significant progress, covering material properties, member calculations, joint connections, fire protection design, and overall calculation results [9,10,11]. Ramberg proposed a new constitutive relationship for an aluminum alloy, i.e., the Ramberg–Osgood model [12], while the European ECCS (European Convention for Constructional Steelwork) determined the overall stability coefficient of aluminum alloy beams through experiments and theories [13]. Iranian, Japanese, and other researchers have discussed the damping characteristics of reticulated shell structures, finite element theoretical calculations, and actual analysis methods in the mode decomposition response spectrum method [14,15,16]. Based on previous research, several design standards for aluminum alloy structures have been developed. The two most commonly used standards are the Eurocode EN 1999-1-1 (EC9) [17] and the American specification ADM 2020 [18].
The bearing capacity of the reticulated shell structure is typically determined by stability, with the stability of the aluminum alloy components and connections being crucial factors that affect the overall stability of the structure [19,20,21]. Guo et al. conducted numerous axial compression tests on aluminum alloy members. Based on their findings, they proposed a recommended stability coefficient value for aluminum alloy axial compression members [22,23,24]. Guy et al. conducted axial load tests on 30 specimens of 6082-T6 aluminum alloy and proposed a cylindrical curve suitable for the axial compression buckling failure of 6082-T6 aluminum alloy extrusion members [25]. Lin et al. conducted axial compression tests on H-shaped aluminum alloy members made of 7075-T6 and proposed a new extramural buckling curve to estimate the flexural buckling-bearing capacity of high-strength extruded members [26]. Mashrah et al. introduced a novel dovetail joint for a single-layer reticulated shell structure, demonstrating outstanding performance under various axial loads and bending moments [27]. Wang et al. investigated the bending performance test of aluminum alloy composite plate joints. The results indicated that the joints showed excellent bending stiffness and bending capacity [28].
Due to the low elastic modulus of aluminum alloy, it is susceptible to large deformation. Therefore, the issue of stability in aluminum alloy reticulated shells must be addressed seriously [29,30,31,32]. Zhe et al. [33,34] conducted an experimental study on the buckling characteristics of reticulated shells with aluminum alloy plate joints. In order to enhance the buckling strength of aluminum alloy spherical shells with plate joints, Zhu et al. proposed a shape optimization method using a genetic algorithm to maximize the nonlinear buckling load [35]. Li et al. established a finite element analysis model of the full-scale reticulated shell plus the roof system and analyzed the impact of the roof system on the static stability of the full-scale reticulated shell [36]. Willem et al. determined the superior type of reticulated shell in terms of material efficiency by comparing the minimum weights of various dome types [37]. In the past two decades, researchers have conducted extensive studies on spatial steel structures. Currently, the seismic behavior of the spatial steel structures is relatively well understood. These research and design results can provide useful references for studying aluminum alloy space structures [38,39].
Due to the heat-affected zone of the aluminum alloy, welding will significantly reduce the strength and plasticity of the aluminum alloy. In most cases, the plate mechanical connection node will be used. With advancements in the welding process, utilizing aluminum alloy welded connections can significantly enhance manufacturing quality and decrease production costs. Therefore, in this study, shaking table tests were conducted on a 1/25 scale aluminum alloy single-layer spherical reticulated shell with fully welded connections. A finite element (FE) model of the reticulated shell structure was established in Ansys, and its validity was verified against experimental results. An extensive analysis of the various rise–span ratios and connection constraints of a single-layer spherical reticulated shell structure was carried out using the proposed FE model.

2. The Shaking Table Test Program

2.1. The Design of the Shaking Table Test Structure Model

A left-sided single-inclined-rod Schwedler-type single-layer spherical reticulated shell was selected as the prototype structure. The span, height, and rise–span ratio of the prototype structure were 35.2 m, 14.2 m, and 0.4, respectively. 6061-T6 aluminum alloy was used in the prototype structure. Considering the conditions of the shaking table test, the similarity ratio of length was determined as 1:25, the similarity ratio of elastic modulus was determined as 1:1, the similarity ratio of acceleration was determined as 4:1, and the similarity ratio of mass was determined as 1:625. The simplified single-layer reticulated shell structure contained 73 joints and 204 components. According to the principle of stiffness equivalence of components, the cross-sectional dimensions of the radial, circumferential, and oblique aluminum alloy members of the scaled aluminum alloy reticulated shell model were □8 × 8 × 1 mm. In order to ensure the connection quality between components, the MIG (Melt inert-gas welding) butt welding process was used for aluminum alloy components. The dimensions of the scaled model and the fabricated model are shown in Figure 1.

2.2. Material Properties

According to the Chinese standards (GB/T 228.1-2010 and GB 50429-2007) [40,41], if the material test sample is a square tube with a small outer diameter, the tubular sample can be directly used for a mechanical tensile test. The tensile testing of 6061-T6 aluminum alloy tubular profiles with a thickness of 1 mm was conducted to determine the properties of the aluminum alloy in this study. The tensile test was conducted using the DNS300 electro-hydraulic servo universal testing machine. The force sensor measured the tension while the extensometer measured the longitudinal strain of the coupons. The loading rate for the test was 2 mm/min, and the testing device and the fracture surfaces of 6 broken specimens are depicted in Figure 2. It can be found from Figure 2b that the necking phenomenon appeared at the fracture of the coupons, indicating that the aluminum alloy tubular profile exhibited a certain level of plasticity. The stress–strain curves of the 6 tensile coupons are displayed in Figure 3. The average values of yield strength, ultimate strength, and elongation of the 6 tensile coupons were 224.16 MPa, 237.43 MPa, and 6.33%, respectively. The test results show that the strength of the 6061-T6 aluminum alloy meets the test requirements, and the results can be used in FE model.

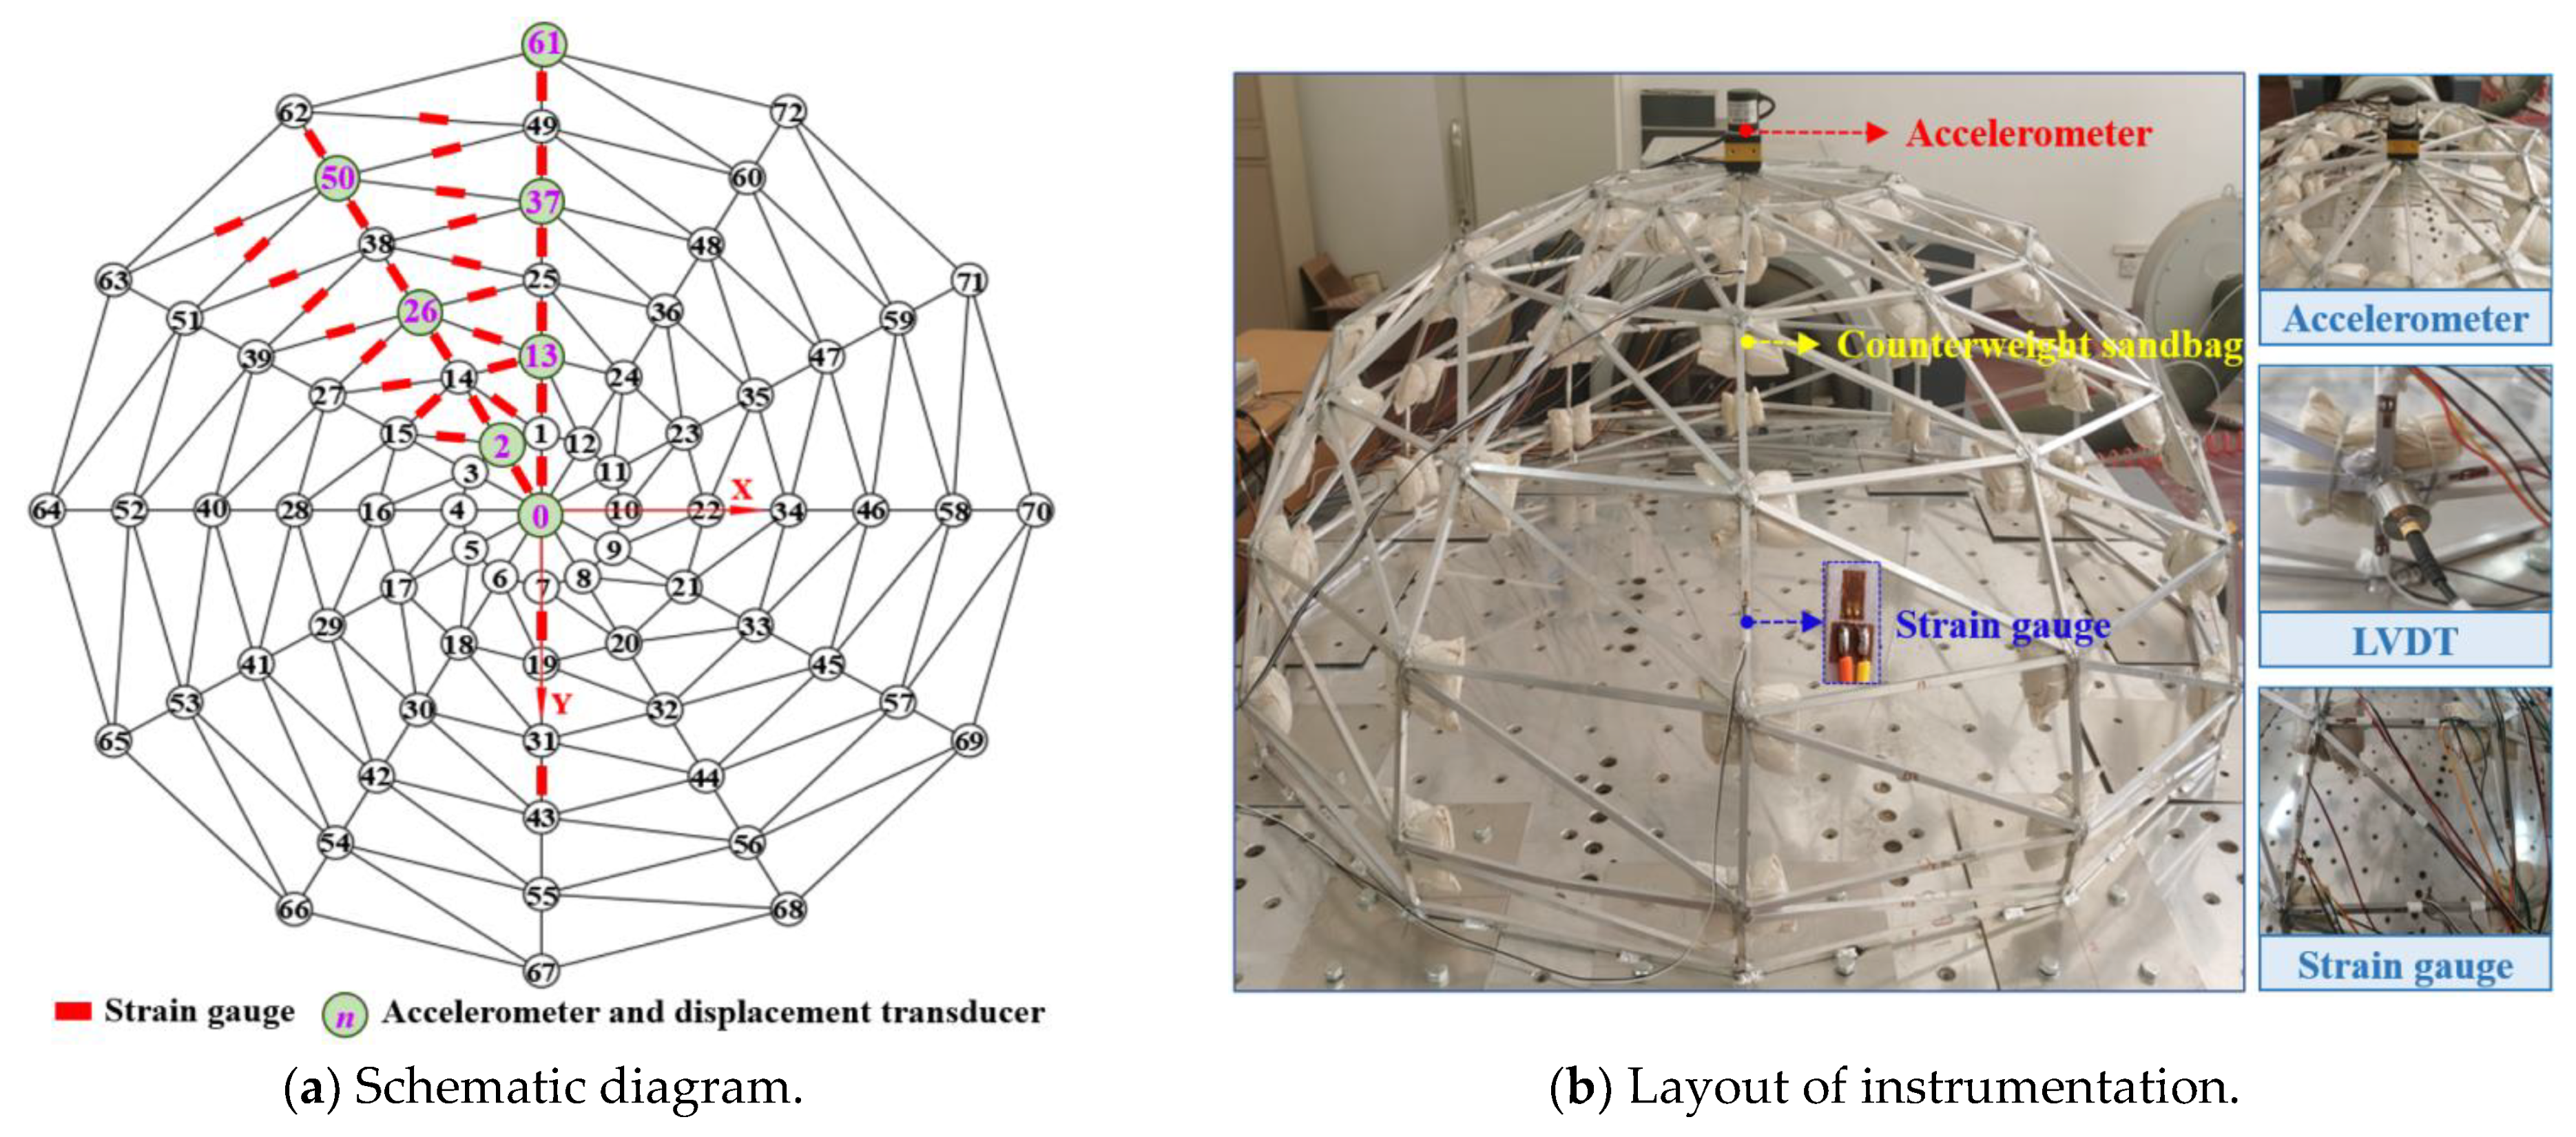
2.3. Test Setup and Measurement

In this study, a 20T electric shaking table was used. The technical parameters of the shaking table are shown in Table 1, and the shaking table test equipment is depicted in Figure 4. In order to measure the responses of dynamic characteristics including acceleration, displacement response, and strain changes of the model structure under earthquake action, various sensors were arranged in the area where the model structure was obviously deformed and the stiffness changed significantly. Accelerometers and cable displacement transducers were installed in the 1/12 area of the scale model of the reticulated shell, and strain gauges were installed in the 1/6 area of the scale model. The displacement transducers, strain gauges, and accelerometers were arranged as shown in Figure 5.
The scale model of the test used the method of underweight counterweight to achieve dynamic similarity. The actual mass of the scale model was 3.88 kg, and the counterweight needed to be increased to 15.06 kg. The counterweight was increased by attaching sandbags at the joints, with 0.251 kg of sandbags attached at each joint from joint 1 to joint 60. The total station was used to measure the actual joint coordinates of the scale model. The measurement results indicate that the maximum difference between the spatial geometric position of the welded joints and the theoretical value was 3.9 mm. This suggests that the quality and accuracy of the welding process were exceptionally high, reducing the error caused by the initial defect of the reticulated-shell scale model.

2.4. Input Ground Motion and Working Conditions

The shaking table test is an irreversible damage accumulation test. It can effectively stimulate the structure and measure the dynamic response, which is essential for making a reasonable assessment of the seismic performance of the structure. Therefore, the seismic wave should be selected scientifically and rationally. By observing the degree of fit of the main periodic points on the seismic wave response spectrum, the appropriate waveform is selected. According to the specification requirements [42], the El-Centro natural seismic wave, Taft natural seismic wave, and the Wenchuan artificial seismic wave were selected for loading in the shaking table test. The amplitude of each wave was adjusted to the target value (70 gal), and then, the response spectrum analysis with a damping value of 5.0% was performed to generate the response spectrum curve. The comparison of the seismic wave response spectrum and the Chinese standard response spectrum is shown in Figure 6.
The peak acceleration value was adjusted based on the reaction acceleration, and the time interval was adjusted as per the integral step size. According to the test similarity constant, the reaction acceleration was amplified by four times, and then, the test was conducted with seven different peak accelerations. Before loading the seismic wave, the model structure was scanned with 50 cm/s2 sine white noise to record the dynamic characteristics of the model structure. The working conditions of the shaking table test are presented in Table 2.

3. Shaking Table Test Results

3.1. Loading Process and Failure Modes

Figure 7 shows the damage state of the specimen after the last excitation was completed. When the specimen was subjected to working conditions 2~4 (200 gal), the table shaking was mild, with slight variations noted in the accelerometer and displacement meter readings, as well as in the strain gauge measurements. The calculated natural frequencies of the model showed no significant change, indicating that the components of the structure were in an elastic state. When the specimen was subjected to working conditions 18~20 (1200 gal), the displacement response and vibration amplitude of the scale model increased significantly, leading to strong shaking in the structural joints and members. Through the white noise frequency sweep, it was observed that the natural frequency of the scale model significantly decreased compared to the previous working condition. This suggests that certain members had reached the plastic state, leading to partial damage in the overall reticulated-shell scale model. When the specimen was subjected to working conditions 22~24 (1600 gal), the displacement response and vibration amplitude of the scale model increased significantly. The counterweight sandbags exhibited severe shaking and the members strongly vibrated. The members near the joints numbered 7, 15, 37, and 44 had slight yielding, and the outer ring inclined member near the bottom had the largest deformation. This shows that the plastic deformation of the structure increases with the amplitude of the seismic wave. The natural frequency of the reticulated-shell scale model had been significantly reduced, and the degradation of structural stiffness was more pronounced. When the specimen was subjected to working conditions 26~28 (2480 gal), the vibration of the scale model and the counterweight sandbag was very intense. After loading, the deformation of the oblique bar at the bottom of the reticulated-shell scale model had further increased, and some joints were also deformed.

3.2. Analysis of Structure’s Dynamic Characteristics

In order to test the dynamic characteristics of the structure, the white noise of the sine wave was used to sweep the frequency. By analyzing the structural feedback signal, the variation trend of the natural frequency f of the reticulated-shell scale model under various working conditions was derived and is shown in Figure 8. When the acceleration amplitude of the input seismic wave gradually increases, the natural frequency of the reticulated-shell scale model will show a decreasing trend, the period will also become longer, and the damage of the model will gradually increase. When the acceleration amplitude is 2480 gal, the frequency in the X direction of the model is reduced by 2.96% compared with the initial frequency. Under the acceleration amplitude, the stiffness of the scale model of the reticulated shell is obviously weakened so that some of the model members are in the state of plastic work.
The damping ratio (ξ) indicates the structure’s ability to gradually reduce vibration after being excited by oscillation. It also serves as an index to describe the rate of energy dissipation of the structure during loading. In this paper, the damping ratio of the scaled structure is calculated using the half-power method. This method involves determining the value from the frequency range extending from the peak amplitude to 1/ 2 of the peak amplitude. The calculation of the damping ratio is illustrated in Formula (1).
ξ = f 2 f 1 f 2 + f 1
Here, f1 and f2 represent the two frequencies of the intersection of the horizontal line of the amplitude peak divided by 2 and the response curve.
It can be seen from Figure 8 that as the earthquake intensity increases, the damping ratio of the model will gradually increase. In the range of small acceleration amplitudes, the damping ratio will not change significantly. This indicates that during the loading process of each working condition, the members of the reticulated-shell scale model will gradually buckle and deform, leading to a further reduction in stiffness. As the damage to the model increases, its damping ratio will also increase, leading to higher energy consumption in the internal structure.
When the mass of the model remains unchanged, the structural stiffness k is proportional to the square of the natural frequency f, and the natural frequency of the model will change with the change in structural stiffness. The stiffness degradation rate η is used to measure the specific degree of this change, and the calculation formula is shown in Formula (2).
η = k k 0 k 0 = f 2 f 0 2 f 0 2
Here, k represents the stiffness of the model after loading, k0 represents the initial stiffness, f represents the natural frequency of the model after loading, and f0 represents the initial natural frequency.
According to Formula (2), the stiffness degradation curve of the reticulated-shell scale model is obtained as shown in Figure 8. In the first seven white noise sweeps, the rate of decline in the overall stiffness of the model decreases rapidly after the earthquake. The maximum decrease in the X direction is 5.84%, indicating a slight decrease in the overall stiffness of the reticulated-shell scale model after the earthquake.

3.3. Seismic Acceleration Response of Scale Structure

In this shaking table test, the acceleration response of the reticulated-shell scale model under the action of the El-Centro seismic wave was larger compared to the other two selected seismic waves. Therefore, this paper discusses the acceleration response of the reticulated-shell scale model under the action of the El-Centro seismic wave. Under the action of middle earthquakes of 7° and 9° in the X direction, the acceleration response time history curves of joints No. 0, 13, 37, and 61 of the scaled model are illustrated in Figure 9. The acceleration response amplitude under the acceleration amplitude of the seismic wave is shown in Figure 10.
It can be concluded from Figure 9 that the acceleration response time history curve of the node of the reticulated-shell scale model does not change significantly under the action of a middle earthquake of 7° to 9°. The analysis indicates that the stiffness of the reticulated-shell scale model is not significantly affected and the members of the scale model remain in an elastic state. The acceleration response value of the joint in the reticulated-shell scale model is independent of the joint elevation. The acceleration response of the intermediate displacement joint in the reticulated shell model is greater and decreases towards both sides of the structure. It can be concluded from Figure 10 that the El-Centro seismic wave elicits the strongest acceleration response in the reticulated-shell scale model, followed by the Taft seismic wave, with the Wenchuan seismic wave showing the weakest response.

3.4. Seismic Displacement Response of Scale Structure

The displacement response of the scale model of the reticulated shell can be obtained using cable displacement transducers. The displacement of the joint is relative to the displacement of the horizontal sliding table. The displacement responses of joints No. 0, 13, 37, and 61 in the scaled model are depicted in Figure 11. Under the action of three types of seismic waves, Figure 12 illustrates the variation in the displacement amplitudes of the joints with respect to the seismic wave’s amplitude.
It can be concluded from Figure 11 that the displacement response time history curve of the joint of the reticulated-shell scale model does not change significantly. The model does not exhibit plastic deformation after experiencing a middle earthquake of 9°. According to Figure 12, the responses of the reticulated-shell scale model to seismic waves of different amplitudes are essentially the same. The displacement amplitude of the model increases with the acceleration amplitude of the seismic wave, and the relative displacement of each joint shows a positive growth trend.

3.5. Strain Analysis of Structure

To more accurately represent the strain at the measuring point of the model, the average value of the strain gauge data on each component is used for analysis. Typical strain gauge readings of the key structural components are shown in Figure 13 under the action of middle earthquakes of 7° and 9°. It can be seen from Figure 13 that when the acceleration of three types of seismic waves is subjected to a middle earthquake of 7°, the strain value of each component is less than 80. Among them, the average strain value of the bar under the El-Centro seismic wave is the highest, followed by those of the Taft wave and the Wenchuan wave. When the acceleration amplitude of the seismic wave reaches 1600 gal, the strain values of each component increase by approximately four times. By analyzing the strain values of each component, it can be determined that the strain response value of the outermost ring member of the reticulated-shell scale model is the highest. As the height of the reticulated shell increases, the strain value gradually decreases, and the strain response at the vertex is the smallest. During the entire earthquake action in our experiments, only a few aluminum alloy members experienced plastic deformation buckling while all members did not reach the crack deformation stage.

4. Numerical Simulation

4.1. Numerical Modelling

In this study, the seismic performance of an aluminum alloy single-layer spherical reticulated shell structure was numerically modeled and validated using Ansys. The bilinear model was used to replace the actual constitutive model of the material. The modulus of elasticity of the aluminum alloy is 6.78 × 10¹⁰ N/m2, the yield strength is 2.24 × 10⁸ N/m2, and the Poisson’s ratio is 0.33. The solid164 three-dimensional solid element was used for finite element modeling and analysis. The element was composed of eight nodes, each of which had nine degrees of freedom in each direction, including displacement, velocity, and acceleration in X, Y, and Z directions. When the surface load was applied to the model, it was applied to the element as a normal line. The model utilizes the MultiZone method in the Modal module to partition the mesh and divides the geometry into multiple regions to create a straightforward flow surface mesh. The specific model and mesh division are shown in Figure 14. To better simulate the actual situation, the test model used bolts to secure the bottom plate and the table of the reticulated shell together. Therefore, when the boundary requirements were set by the finite element software, the 12 nodes of the outermost ring in the finite element model were fixed to restrict their rotational and translational degrees of freedom. The structural damping ratios of the model structure under the action of a fortification earthquake and a rare earthquake were 0.02 and 0.03, respectively.

4.2. Verification of Numerical Model

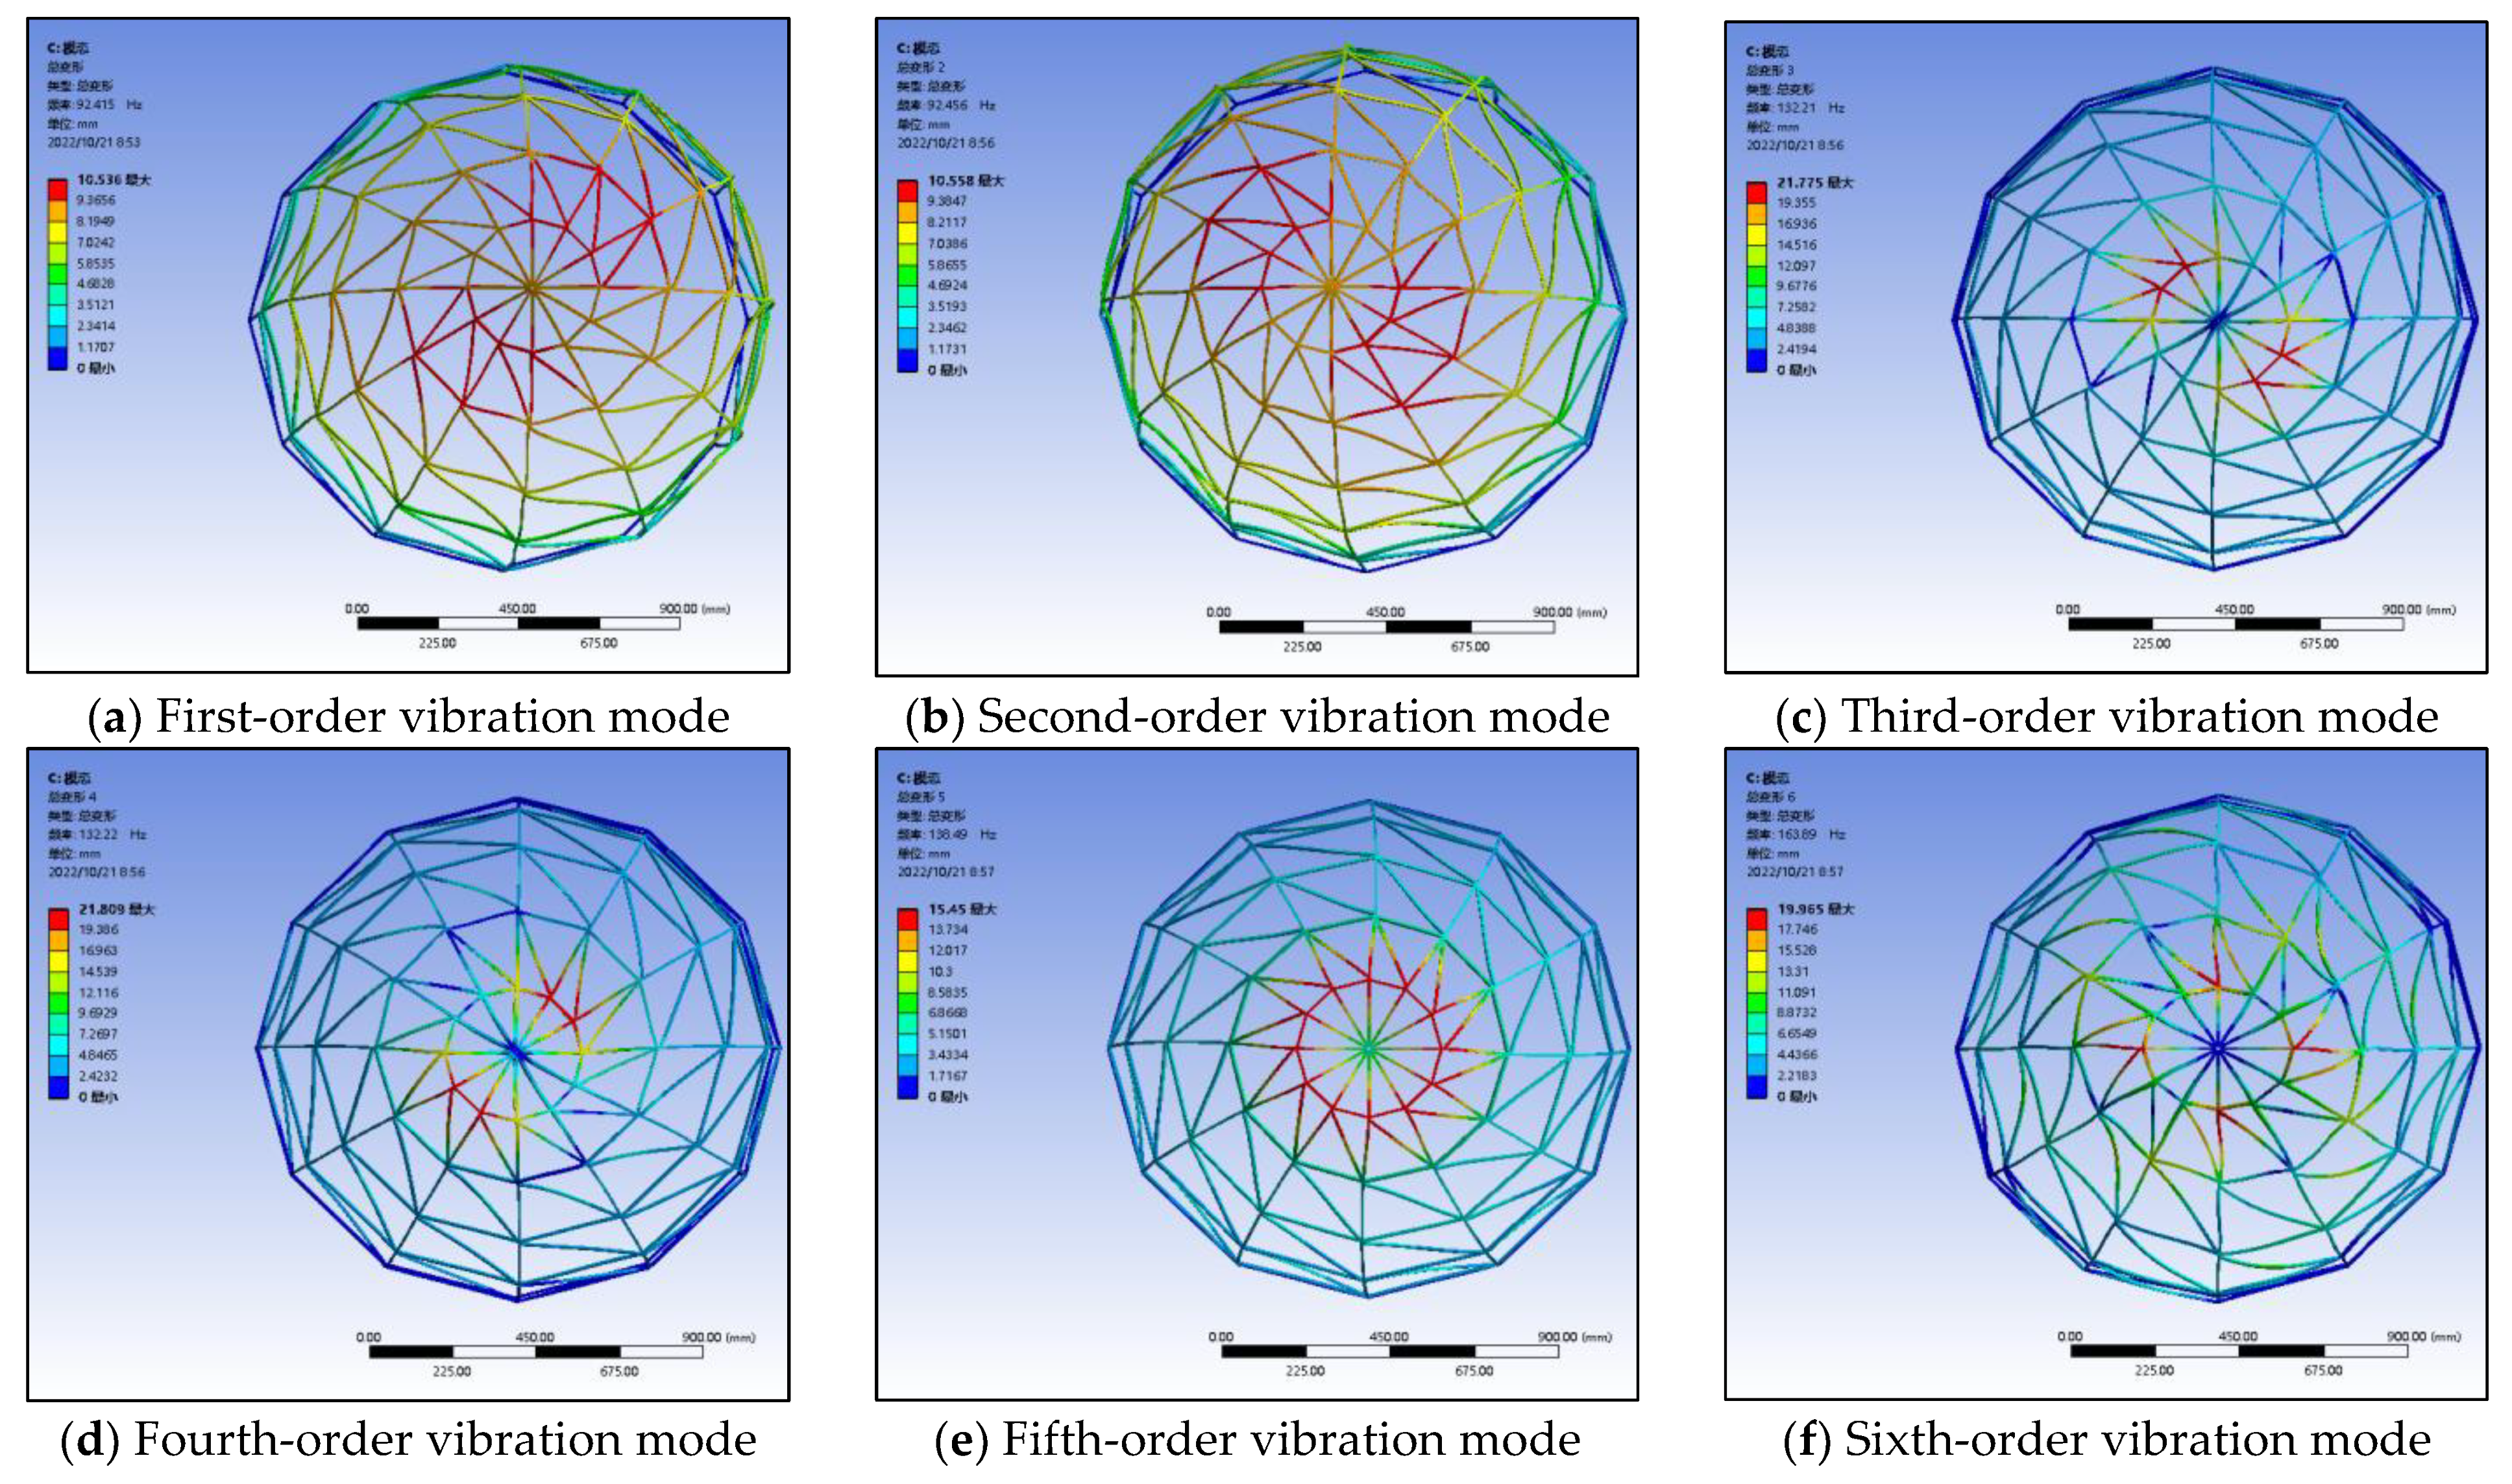
4.2.1. Comparison of Modal Analysis Results

The first six vibration modes of the scale model are shown in Figure 15. It can be seen from Figure 15 that the instability mode of the single-layer spherical reticulated shell is the symmetrical depression of the central circumferential members. This results in irreversible large deformation, causing the structure to lose its ability to continue bearing loads. A comparison of natural frequencies between the experimental and FE aspects of the scale model is presented in Table 3. All results were compared, and the predictive errors yielded by the numerical model were all within 7%, demonstrating the validity of the FE model and parameter analysis.

4.2.2. Comparison of Acceleration Time History Curves

The transient structural operation analysis was conducted using the FE software ANSYS 2021. The acceleration amplitude of the El-Centro seismic wave was adjusted to 400 gal and 1600 gal, and the acceleration time history response of the scale model was obtained by inputting along the X direction of the bottom plate. The time history curves of acceleration under the El-Centro wave are illustrated in Figure 16. The comparison of peak acceleration values under the middle earthquakes of 7° and 9° is presented in Table 4.
According to the acceleration time history curve of the test and numerical analysis in Figure 16, under the action of a middle earthquake of 7°, the change trends of the time history response curve of the numerical simulation and the test are essentially the same. Under the influence of a middle earthquake of 9°, there is a significant deviation in the trend, but the magnitudes of the observed peak point and the times of the response peak point are similar. In general, the curve trend and the peak time of the acceleration time history response of the model obtained via the FE method are similar to the experimental acceleration response characteristics. This indicates that the FE method can effectively simulate the vibration response of the actual structure during an earthquake.
According to Table 4, under the action of a middle earthquake of 7° and middle earthquake of 9°, the peak deviations of the acceleration response between the FE value and the experimental value are approximately 11.08% and 11.34%, respectively. Compared to the response values of the shaking table test, the FE calculation values are relatively small. The primary reason is that the connections set in the boundary of the FE model are completely rigid, with no relative rotation between the rods, and the material is an ideal elastic–plastic body. However, in the actual test, the connection may be affected by factors such as the bolt fixation of the bottom plate and the welding quality, which can result in deviations in the shaking table test results.

4.2.3. Comparison of Displacement Time History Curves

Under the action of X-direction El-Centro seismic waves with a middle earthquake of 7° (400 gal) and middle earthquake of 9° (1600 gal), the displacement responses of the No. 0, 13, and 37 joints of an aluminum alloy single-layer spherical reticulated-shell scale model were compared, drawing from the shaking table test and numerical analysis. The time history curves of displacement are illustrated in Figure 17. The comparison of peak displacement values is presented in Table 5.
It can be concluded from Figure 17 and Table 5 that under the action of the middle earthquake of 7° and middle earthquake of 9°, the maximum displacement errors between the FE calculation value and the shaking table test value were approximately 15.23% and 19.57%, respectively. The shaking table test value was slightly larger than the theoretical value obtained from the FE calculation. The reasons for the error may include the material selection, structural dynamic characteristics, joint welding quality, and bearing connection mode. In short, the error was reasonable and within an acceptable range, so it is feasible to use finite element software to replicate the shaking table test. Through the FE modeling of the reticulated-shell scale model test, the dynamic response values obtained corresponded to the data collected in the shaking table test. This indicates that the FE model can effectively reflect the stress and deformation of the reticulated-shell scale model under earthquake conditions during tests.

5. Parametric Studies

5.1. Dynamic Response of Reticulated Shell Structure under Different Rise–Span Ratios

5.1.1. General

Based on the test results, the numerical simulation method was employed to conduct a comprehensive FE analysis of the aluminum alloy reticulated shell’s structure. This section further analyzes the influence of different rise–span ratios on the spatial effect of the structure under the influence of a middle earthquake of 9° based on the FE modeling in Section 4.1. The models of four different rise–span ratios are shown in Figure 18.

5.1.2. Comparison of Natural Frequency

The first six natural frequencies of the reticulated shell structure with four different rise–span ratios are presented in Table 6. It can be seen from Table 6 that the first two natural frequencies of MSJ-2, MSJ-3, and MSJ-4 are very close. Compared with MSJ-2, the first-order frequency of MSJ-1 is reduced by 26.26%. From the third order, as the rise–span ratio increases, the natural frequency of the model gradually increases, indicating that the rise–span ratio has a significant influence on the stiffness of the reticulated shell model.

5.1.3. Comparison of Acceleration Time History Curves

In order to compare the seismic performance of four different rise–span ratios in a reticulated shell structure, the acceleration time history curves of the four specimens under a middle earthquake of 9° are shown in Figure 19. The comparison of peak acceleration values is shown in Figure 20.
According to Figure 19 and Figure 20, under the action of a middle earthquake of 9°, the acceleration amplitude of MSJ-4 is 22.19%, 24.39%, and 23.72% higher than that of MSJ-1 at joints 0, 13, and 37, respectively. With the increase in the rise–span ratio of the reticulated shell structure, the acceleration amplitude of the corresponding joints also increases, and the increase is significant. The acceleration amplitude of different joints in the reticulated shell structure follows the same trend as that of MSJ-3.

5.1.4. Comparison of Displacement Time History Curves

In order to compare the seismic performance of four different rise–span ratios in a reticulated shell structure, the displacement time history curves of the four specimens under a middle earthquake of 9° are shown in Figure 21. The comparison of peak displacements is shown in Figure 22.
According to Figure 21 and Figure 22, the displacement amplitude of MSJ-4 is 25.53%, 25.28%, and 25.32% larger than that of MSJ-1 at joints 0, 13, and 37, respectively. With the gradual increase in the rise–span ratio of the reticulated shell structure, the displacement amplitude of the corresponding joint also increases, and the increase is relatively significant. The displacement amplitude of various joints in the reticulated shell structure follows a similar trend to that of MSJ-3, and its dynamic performance is relatively similar.

5.2. Dynamic Response of Reticulated Shell Structure under Different Connection Constraints

5.2.1. General

According to the FE model in Section 4.1, MSJ-5 modifies the connection of the reticulated-shell scale model based on MSJ-3. It changes the circumferential members of joints No. 1-60 from rigid connections to hinged connections. Other members still maintain the original connection and do not change any other parameter settings. Under the action of a middle earthquake of 9°, the X-direction EI-Centro seismic wave is utilized to analyze the dynamic performance of the aluminum alloy single-layer spherical reticulated shell.

5.2.2. Comparison of Natural Frequency

The first six vibration modes of MSJ-5 are shown in Figure 23. It can be seen from Figure 23 that the change in vibration mode is relatively consistent compared to MSJ-3, with no significant variation. A comparison of the natural frequencies of reticulated shell models under different connections is presented in Table 7. It can be concluded from Table 7 that the first six natural frequencies of the hinged model structure are lower than those of the rigid model, and the maximum decrease is 50.95% for the sixth order. This indicates that the connection mode of the circumferential members in the model has been altered from rigid connection to hinged connection. This change significantly impacts the overall stiffness of the structure, reducing the natural frequency. However, the vibration mode remains largely unchanged.

5.2.3. Comparison of Acceleration Time History Curves

In order to compare the seismic performance of reticulated shell structures with two different connections, the acceleration time history curves of the two specimens under a middle earthquake of 9° are shown in Figure 24. The comparison of peak acceleration values is presented in Table 8. According to Figure 24 and Table 8, changing the connection of the circumferential component to hinged results in an increase in the acceleration amplitude of the corresponding joint. The acceleration amplitudes at joints 0, 13, and 37 are 16.72%, 10.15%, and 10.59% larger, respectively.

5.2.4. Comparison of Displacement Time History Curves

The displacement time history curves of the specimens with two different connections under a middle earthquake of 9° are shown in Figure 25. The comparison of peak displacement values is presented in Table 9. When the ring component is changed to a hinged connection, the displacement amplitude of the corresponding joint increases. The displacement amplitudes at joints 0, 13, and 37 are increased by 17.17%, 16.37%, and 17.53%, respectively. This shows that the dynamic performance of the reticulated shell structure will be reduced after the connection is changed to a hinge.

6. Conclusions

In this study, shaking table tests were conducted on a 1/25 scaled fully welded single-layer spherical reticulated shell structure. An FE model of the single-layer spherical reticulated shell structure was created in Ansys, and its accuracy was confirmed through comparison with experimental results. Compared with experiments, an extended parameter analysis of the various rise–span ratios and connection constraints of a single-layer spherical reticulated shell structure was conducted using the proposed FE model. The main conclusions of this study and the outlook on the use of aluminum alloys in structures are summarized as follows:
(1) As the seismic wave acceleration amplitude increases, the damage to reticulated shell structures gradually accumulates. This leads to a decrease in natural frequency and stiffness while the damping ratio and energy consumption increase.
(2) Under the action of an earthquake, the displacement and acceleration responses at the top of the reticulated shell structure are greater in the following two cycles. The strain on the platform increases as the height of the reticulated shell increases, reaching a peak before gradually decreasing.
(3) With the increase in the rise–span ratio of the aluminum alloy reticulated shell, the natural frequency of the structure increases while the dynamic performance decreases.
(4) The connection of the circumferential components changes from a rigid connection to a hinged connection. The natural frequency of the reticulated shell structure is reduced by about 40%. Additionally, the acceleration and displacement response values decrease by approximately 15%, leading to a reduction in dynamic performance.
(5) Based on the review and summary of previous studies, there is a greater research and application value in utilizing 3D printing technology for constructing innovative aluminum alloy structures and employing fiber-reinforced polymer (FRP) for strengthening existing aluminum alloy structures in the future.

Author Contributions

Conceptualization, Q.N., J.L. and X.L.; methodology, Q.N. and J.L.; software, J.L. and F.Y.; validation, F.Y., J.L. and X.L.; formal analysis, Q.N.; investigation, Q.N. and Y.W.; resources, Y.W.; data curation, Q.N. and X.L.; writing—original draft preparation, Q.N. and J.L.; writing—review and editing, Q.N.; visualization, Q.N. and X.L.; supervision, Y.W. and X.L.; project administration, X.L.; funding acquisition, J.L. and Y.W. All authors have read and agreed to the published version of the manuscript.

Funding

This study was supported by the project of the Shaanxi Province Key Research and Development Program (2022SF-121) and the project of the Research and Development Fund Project of China Northwest Architectural Design and Research Institute Co., Ltd. (NB-2021-JZ-15).

Data Availability Statement

The data used to support the findings of this study are available from the corresponding author upon request.

Conflicts of Interest

Author Yuanshun Wang is employed by the China Northwest Architecture Design and Research Institute Co., Ltd. The remaining authors declare that the research was conducted in the absence of any commercial or financial relationships that could be construed as a potential conflict of interest.

References

  1. Zhijie, Z.; Ruoqiang, F.; Qi, C. Study on the collapse performances of fabricated single-layer spatial network structures based on discrete beam elements. Thin-Walled Struct. 2023, 186, 110657. [Google Scholar]
  2. Song, X.; Li, H.; Wang, X.; Zhang, J. Experimental investigation of ultra-low-cycle fatigue behaviors of plate bearings in spatial grid structures. Eng. Struct. 2021, 231, 111764. [Google Scholar] [CrossRef]
  3. Chen, M.-T.; Zuo, W.; Chen, Y.; Zhao, O.; Cheng, B.; Zhao, J. Parametric topology optimization design and analysis of additively manufactured joints in spatial grid structures. Eng. Struct. 2024, 300, 117123. [Google Scholar] [CrossRef]
  4. Ma, H.H.; Hou, Q.; Jiang, Y.; Yu, Z. Mechanical performance of 6082-T6 aluminum alloy columns under eccentric compression at elevated temperatures. Thin-Walled Struct. 2022, 171, 108824. [Google Scholar] [CrossRef]
  5. Yan, J.B.; Kong, G.; Wang, Z.; Zhang, L.; Wang, X. Compression behaviours of aluminium alloy I-column at low temperatures. Structures 2022, 44, 418–435. [Google Scholar] [CrossRef]
  6. Sun, Y.; Zhang, K.; Gong, G. Material properties of structural aluminum alloys after exposure to fire. Structures 2023, 55, 2105–2111. [Google Scholar] [CrossRef]
  7. Zhu, S.; Cheng, Z.; Zhang, C.; Guo, X. Numerical analysis of aluminum alloy reticulated shells with gusset joints under fire conditions. Front. Struct. Civ. Eng. 2023, 17, 448–466. [Google Scholar] [CrossRef]
  8. Wang, H.; Li, P.; Wang, J. Shape optimization and buckling analysis of novel two-way aluminum alloy latticed shells. J. Build. Eng. 2020, 36, 102100. [Google Scholar] [CrossRef]
  9. Wang, G.; Zhao, C. Experimental and theoretical study on the bearing capacity of FGC joints for single-layer aluminium alloy lattice shell structures. Structures 2021, 33, 2445–2458. [Google Scholar]
  10. Li, P.; Chen, G.; Qiu, J.; Qian, J.; Ding, D.; Jian, B.; Zhang, X.; Xiong, G. Experimental and numerical investigation into the load-carrying capacity of aluminium alloy H-sectional stocky columns under axial compression. J. Build. Eng. 2024, 87, 108777. [Google Scholar] [CrossRef]
  11. Chen, Z.; Xu, W.; Liang, Y.; Mo, L.; Ning, F.; Liang, Y. Flexural behavior of novel marine concrete filled CFRP—Aluminum alloy tube member. Structures 2024, 62, 106184. [Google Scholar] [CrossRef]
  12. Ramberg, W. Description of Stress-Strain Curves by Three Parameters; Technical Note; National Advisory Committee for Aeronautics: Washington, DC, USA, 1943. [Google Scholar]
  13. ECCS. European Recommendations for Aluminum Alloy Structures, 1st ed.; ECCS: Brussels, Belgium, 1978. [Google Scholar]
  14. Tatemichi, I. A Study on the Damping of Vibrations in Space Structures. In Proceedings of the IASS Symposium 2001, Nagoya, Japan, 9–13 October 2001. [Google Scholar]
  15. Hagiwara, N. Study on Nonlinear Vibration and Deformation of Simple Reticulated Dome. In Proceedings of the IASS Symposium 2001, Nagoya, Japan, 9–13 October 2001. [Google Scholar]
  16. Ishikawa, K. Evaluation Method for Predicting Dynamic Collapse of Double Layer Latticed Space Truss Structures Due to Earthquake Motion. Int. J. Space Struct. 2000, 15, 249–258. [Google Scholar] [CrossRef]
  17. BS EN 1999-1-1; Eurocode 9: Design of Aluminum Structures—Part 1-1: General Structural Rules. CEN: Brussels, Belgium, 2007.
  18. Aluminum Association (AA). Aluminum Design Manual; Aluminum Association (AA): Washington, DC, USA, 2010. [Google Scholar]
  19. Wu, M.; Fan, S.; Zhao, Z.; Liu, M.; Hu, L.; Yu, T. Experimental study on the hysteretic behavior of aluminum alloy gusset joint with rectangular hollow sections. Thin-Walled Struct. 2024, 196, 111500. [Google Scholar] [CrossRef]
  20. Song, G.; Wang, Z.; Fan, X.; Liu, L. Research Progress of Aluminum Alloy Welding/Plastic Deformation Composite Forming Technology in Achieving High-Strength Joints. Materials 2023, 16, 7672. [Google Scholar] [CrossRef] [PubMed]
  21. Cheng, J.; Zhang, Z.; Dong, X.; Song, G.; Liu, L. A novel post-weld composite treatment process for improving the mechanical properties of AA 6061-T6 aluminum alloy welded joints. J. Manuf. Process. 2022, 82, 15–22. [Google Scholar] [CrossRef]
  22. Guo, X.; Liang, S.; Shen, Z. Experiment on aluminum alloy members under axial compression. Front. Struct. Civ. Eng. 2015, 9, 48–64. [Google Scholar] [CrossRef]
  23. Hu, X.; Cheng, Y.; Cui, Z.; Xing, H.; Guo, X. Performance of Chinese 701 Aluminum Alloy L-shaped Member under Axial Compression. IOP Conf. Ser. Earth Environ. Sci. 2020, 508, 012198. [Google Scholar] [CrossRef]
  24. Guo, X.; Zong, S.; Shen, Z.; Zhu, S.; Yuan, S. Mechanical Behavior of In-service Axial Compression Angle Steel Members Strengthened by Welding. J. Build. Eng. 2020, 32, 101736. [Google Scholar] [CrossRef]
  25. Adeoti, G.O.; Fan, F.; Wang, Y.; Zhai, X. Stability of 6082-T6 aluminium alloy columns with H-section and rectangular hollow sections. Thin-Walled Struct. 2015, 89, 1–16. [Google Scholar] [CrossRef]
  26. Yuan, L.; Zhang, Q.; Ouyang, Y. Experimental investigation and design method of the flexural buckling resistance of high-strength aluminum alloy H-columns. Structures 2021, 35, 1339–1349. [Google Scholar] [CrossRef]
  27. Mashrah, W.A.H.; Chen, Z.; Liu, H. Numerical and Theoretical Study on Mechanical Behaviors of New Dovetail Joint System (NDJs) Subjected to Tensile, Compressive, and Out-of-plane Bending Moment Forces. Int. J. Steel Struct. 2021, 21, 1108–1133. [Google Scholar] [CrossRef]
  28. Wang, G.; Zhao, C.; Ma, J. Experimental and numerical study on the bending performance of an aluminium alloy flower-gusset composite joint. Structures 2021, 33, 2475–2486. [Google Scholar]
  29. Sun, G.; Xiao, S.; Wu, J.; Yu, S.; Wei, M.; Qin, J.; Zang, M. Study on the static stability of aluminum alloy single-layer spherical reticulated shell. J. Build. Eng. 2024, 84, 108595. [Google Scholar] [CrossRef]
  30. Liu, H.; Ding, Y.; Chen, Z. Static stability behavior of aluminum alloy single-layer spherical latticed shell structure with Temcor joints. Thin-Walled Struct. 2017, 120, 355–365. [Google Scholar] [CrossRef]
  31. Jiang, Y.; Ma, H.; Fan, F. Stability Analysis of Single-Layer Aluminum Reticulated Shells with Improved Temcor Joints. J. Int. Assoc. Shell Spat. Struct. 2019, 60, 106–120. [Google Scholar] [CrossRef]
  32. Zhao, C.; Zhao, Y.; Ma, J. The Stability of New Single-Layer Combined Lattice Shell Based on Aluminum Alloy Honeycomb Panels. Appl. Sci. 2017, 7, 1150. [Google Scholar] [CrossRef]
  33. Xiong, Z.; Guo, X.; Luo, Y.; Zhu, S.; Liu, Y. Experimental and numerical studies on single-layer reticulated shells with aluminium alloy gusset joints. Thin Walled Struct. 2017, 118, 124–136. [Google Scholar] [CrossRef]
  34. Xiong, Z.; Zhu, S.; Zou, X.; Guo, S.; Qiu, Y.; Li, L. Elasto-plastic buckling behaviour of aluminium alloy single-layer cylindrical reticulated shells with gusset joints. Eng. Struct. 2021, 242, 112562. [Google Scholar] [CrossRef]
  35. Zhu, S.; Ohsaki, M.; Guo, X.; Zeng, Q. Shape optimization for non-linear buckling load of aluminum alloy reticulated shells with gusset joints. Thin-Walled Struct. 2020, 154, 106830. [Google Scholar] [CrossRef]
  36. Li, W.; Zhi, X.; Wang, D.; Fan, F.; Shen, S. Static stability analysis of a reticulated shell with a roofing system. Eng. Struct. 2019, 185, 3. [Google Scholar] [CrossRef]
  37. Gythiel, W.; Mommeyer, C.; Raymaekers, T.; Schevenels, M. A Comparative Study of the Structural Performance of Different Types of Reticulated Dome Subjected to Distributed Loads. Front. Built Environ. 2020, 6, 56. [Google Scholar] [CrossRef]
  38. Fan, F.; Zhi, X.; Li, W. Analysis of the Acceleration Response Spectra of Single-Layer Spherical Reticulated Shell Structures. Appl. Sci. 2022, 12, 2116. [Google Scholar] [CrossRef]
  39. Zhi, X.; Zhang, T.; Li, W.; Feng, F. Effect of Roof System on Elasto-plastic Stability and Seismic Performance of Single-layer Reticulated Shells. China Civ. Eng. J. 2017, 50, 19–26. [Google Scholar]
  40. GB/T228.1-2010; Metallic Materials Tensile Test-Room Temperature Test Method. China Standard Press: Beijing, China, 2010. (In Chinese)
  41. GB 50429-2007; MOHURD, Code for Design of Aluminum Structures. China Planning Press: Beijing, China, 2007. (In Chinese)
  42. GB50011-2015; Code for Seismic Design of Buildings, Modified Version. China Architecture & Building Press: Beijing, China, 2008. (In Chinese)
Figure 1. The detailed size of scaled structure.
Buildings 14 01354 g001
Figure 2. Experimental setup and the broken tensile coupons.
Buildings 14 01354 g002
Figure 3. Measured stress–strain curves.
Buildings 14 01354 g003
Figure 4. Test setup of aluminum alloy single-layer spherical reticulated shell.
Buildings 14 01354 g004
Figure 5. Test layout and instrumentation.
Buildings 14 01354 g005
Figure 6. Comparison between seismic wave response spectrum and Chinese code response spectrum [42].
Buildings 14 01354 g006
Figure 7. The failure mode of the scaled model.
Buildings 14 01354 g007
Figure 8. The structure’s dynamic characteristics in the scaled model.
Buildings 14 01354 g008
Figure 9. The acceleration curves of the scaled model in the X direction.
Buildings 14 01354 g009aBuildings 14 01354 g009b
Figure 10. The acceleration response amplitude under the acceleration amplitude of the seismic wave.
Buildings 14 01354 g010
Figure 11. The displacement curves of the scaled model in the X direction.
Buildings 14 01354 g011
Figure 12. The X-direction displacement response amplitude under the amplitude of the seismic wave.
Buildings 14 01354 g012
Figure 13. Typical strain readings for specimens.
Buildings 14 01354 g013
Figure 14. Mesh subdivision of FE model.
Buildings 14 01354 g014
Figure 15. The first six modes of the scale model.
Buildings 14 01354 g015
Figure 16. The comparison of acceleration time history curves of the scale model under El-Centro wave.
Buildings 14 01354 g016
Figure 17. The comparison of displacement time history curves of the scale model under El-Centro wave.
Buildings 14 01354 g017
Figure 18. The models of four different brace arrangements.
Buildings 14 01354 g018
Figure 19. The comparison of acceleration time history curves of the specimens under EI-Centro wave.
Buildings 14 01354 g019
Figure 20. The comparison of peak acceleration under middle earthquake of 9°.
Buildings 14 01354 g020
Figure 21. The comparison of displacement time history curves of the specimens under EI-Centro wave.
Buildings 14 01354 g021
Figure 22. The comparison of peak displacements under middle earthquake of 9°.
Buildings 14 01354 g022
Figure 23. The first six modes of MSJ-5.
Buildings 14 01354 g023
Figure 24. The comparison of acceleration time history curves of the reticulated shell structures with different connections.
Buildings 14 01354 g024
Figure 25. The comparison of displacement time history curves of the reticulated shell structures with different connections.
Buildings 14 01354 g025
Table 1. Technical parameters of shaking table.
Technical ParameterTable SizeMaximum DisplacementMaximum VelocityMaximum AccelerationWorking FrequencyDegree of Freedom in Control
Index value1500 × 1500 mm100 mm1.8 m/s750 m/s21~2600 Hz3-dimensional with 6 degrees of freedom
Table 2. Working conditions.
NumberSeismic IntensitySeismic WaveDesigned Acceleration Value (cm/s2)Testing Item
1The first white noise scanning-50Natural frequency and damping
2Small earthquake of 7°Wenchuan50 × 4 = 200Acceleration and strain
3Small earthquake of 7°Taft50 × 4 = 200Acceleration and strain
4Small earthquake of 7°EI-Centro50 × 4 = 200Acceleration and strain
5The second white noise scanning-50Natural frequency and damping
6Middle earthquake of 7°Wenchuan100 × 4 = 400Acceleration and strain
7Middle earthquake of 7°Taft100 × 4 = 400Acceleration and strain
8Middle earthquake of 7°EI-Centro100 × 4 = 400Acceleration and strain
9The third white noise scanning-50Natural frequency and damping
10Small earthquake of 8°Wenchuan150 × 4 = 600Acceleration and strain
11Small earthquake of 8°Taft150 × 4 = 600Acceleration and strain
12Small earthquake of 8°EI-Centro150 × 4 = 600Acceleration and strain
13The fourth white noise scanning-50Natural frequency and damping
14Middle earthquake of 8°Wenchuan200 × 4 = 800Acceleration and strain
15Middle earthquake of 8°Taft200 × 4 = 800Acceleration and strain
16Middle earthquake of 8°EI-Centro200 × 4 = 800Acceleration and strain
17The fifth white noise scanning-50Natural frequency and damping
18Large earthquake of 8°Wenchuan300 × 4 = 1200Acceleration and strain
19Large earthquake of 8°Taft300 × 4 = 1200Acceleration and strain
20Large earthquake of 8°EI-Centro300 × 4 = 1200Acceleration and strain
21The sixth white noise scanning-50Natural frequency and damping
22Middle earthquake of 9°Wenchuan400 × 4 = 1600Acceleration and strain
23Middle earthquake of 9°Taft400 × 4 = 1600Acceleration and strain
24Middle earthquake of 9°EI-Centro400 × 4 = 1600Acceleration and strain
25The seventh white noise scanning-50Natural frequency and damping
26Middle earthquake of 10°Wenchuan620 × 4 = 2480Acceleration and strain
27Middle earthquake of 10°Taft620 × 4 = 2480Acceleration and strain
28Middle earthquake of 10°EI-Centro620 × 4 = 2480Acceleration and strain
29The eighth white noise scanning-50Natural frequency and damping
Table 3. Comparison of natural frequencies between experiment and FE model.
Vibration ModeNatural Frequency (Hz)Deviation (%)
ExperimentFE
First-order mode87.4592.425.68
Second-order mode87.5192.465.66
Third-order mode124.92132.215.84
Fourth-order mode125.34132.225.49
Fifth-order mode133.76138.493.54
Sixth-order mode154.19163.896.29
Table 4. The comparison of peak acceleration of the scale model under El-Centro wave (unit: gal).
Measuring Point PositionThe Action of Middle Earthquake of 7° (400 gal)The Action of Middle Earthquake of 9° (1600 gal)
ExperimentFEDeviation (%)ExperimentFEDeviation (%)
No. 0507.33452.6910.771986.511794.249.68
No. 13549.64488.7511.082282.482023.7411.34
No. 37476.13430.819.521897.381692.1610.80
Table 5. The comparison of peak displacement of the scale model under El-Centro wave (unit: mm).
Measuring Point PositionThe Action of Middle Earthquake of 7° (400 gal)The Action of Middle Earthquake of 9° (1600 gal)
ExperimentFEDeviation (%)ExperimentFEDeviation (%)
No.02.112.3913.2713.1515.4317.34
No.132.562.9515.2315.2818.2719.57
No.371.721.9714.5310.9412.6115.27
Table 6. Comparison of natural frequencies of four different brace arrangements (unit: Hz).
VIBRATION MODEMSJ-1 (mm)MSJ-2MSJ-3 (mm)MSJ-4
First-order mode73.6192.9492.4292.28
Second-order mode73.6192.9492.4692.28
Third-order mode76.99109.45132.21146.16
Fourth-order mode101.51111.51132.22146.16
Fifth-order mode101.51111.51138.49153.5
Sixth-order mode105.21133.83163.89176.03
Table 7. Comparison of natural frequencies of reticulated shell models under different connections.
Vibration ModeNatural Frequency (Hz)Deviation (%)
MSJ-3 (Rigid Connection) MSJ-5 (Hinged Connection)
First-order mode92.4257.9437.31
Second-order mode92.4658.7136.5
Third-order mode132.2170.1747.05
Fourth-order mode132.2271.3246.06
Fifth-order mode138.4980.0042.23
Sixth-order mode163.8980.3850.95
Table 8. The comparison of peak accelerations of the reticulated shell structures with different connections.
Measuring Point PositionSpecimensDeviation (%)
MSJ-3 (Rigid Connection) MSJ-5 (Hinged Connection)
No. 01794.242094.3216.72
No. 132023.742229.1210.15
No. 371692.161871.3810.59
Table 9. The comparison of peak displacements of the reticulated shell structures with different connections.
Measuring Point PositionSpecimensDeviation (%)
MSJ-3 (Rigid Connection) MSJ-5 (Hinged Connection)
No. 015.4318.0817.17
No. 1318.2721.2616.37
No. 3712.6114.8217.53
Disclaimer/Publisher’s Note: The statements, opinions and data contained in all publications are solely those of the individual author(s) and contributor(s) and not of MDPI and/or the editor(s). MDPI and/or the editor(s) disclaim responsibility for any injury to people or property resulting from any ideas, methods, instructions or products referred to in the content.

