Article

Thermal Environment Analysis and Optimization for Large Space Buildings with Radiant Cooling Floors: A Case Study of Xianyang International Airport

1
School of Architecture and Traffic Engineering, Guilin University of Electronic Technology, Guilin 541004, China
2
China Academy of Building Research, Beijing 100013, China
3
School of Energy Science and Engineering, Central South University, Changsha 410083, China
*
Author to whom correspondence should be addressed.
Buildings 2024, 14(5), 1355; https://doi.org/10.3390/buildings14051355
Submission received: 7 April 2024 / Revised: 24 April 2024 / Accepted: 6 May 2024 / Published: 9 May 2024
(This article belongs to the Special Issue Research on Energy Performance in Buildings)

Abstract

:
Radiant cooling floors combined with ventilation systems have been widely applied in large space buildings. However, there has been a lack of research on system control strategies for their adaptation to weather changes. This study aimed to find control strategies for radiant cooling floors combined with displacement ventilation systems used in large space buildings in order to achieve energy conservation and environmental improvement. Supply air temperature and cooling surface temperature were determined to be the control variables. It was found that cooling capacity of the combined system and the comfort index, PMV (predicted mean vote), were linear in relation to the supply air temperature and cooling surface temperature. The linear equations regarding cooling capacity and PMV were established separately using environment data, and then the optimal region was determined. A case study on Terminal 3 of Xi’an Xianyang International Airport was conducted. The thermal environment was investigated through on-site measurements, questionnaires, and numerical simulations with CFD (computational fluid dynamics). It was found that supply air temperature and cooling surface temperature had a significant impact on PMV, and less impact on the cooling capacity. Therefore, it was determined that the supply air temperature should be altered first when the indoor temperature exceeds the upper limit, and then the cooling surface temperature should be changed if the indoor environment continues to overheat with the supply air temperature set to 18 °C. Thus, the supply air temperature was kept at 18 °C, and the floor surface temperature was set to be 22 °C on a high-temperature day. The average PMV was 0.87, and the cooling capacity of the combined system was 200 W/(m2·K), according to the CFD simulation. In addition, the surface heat transfer coefficient of the cooling floor was found to be 10.26 W/(m2·K). This research provides important references for the design and operational management of radiant cooling floors in large space buildings.

1. Introduction

Radiant cooling systems combined with displacement ventilation systems contribute significantly to energy savings and thermal environment maintenance [1,2], and as a result, they have been applied in some large space buildings [3,4]. The combined system stratifies indoor air in the vertical direction, thus maintaining the comfort level of persons located in areas up to 2 m above the ground, and reducing the cooling load caused by the heat gain in the upper part of a large space [3]. Compared to conventional all-air air conditioning systems, more parameters of the combined system can be adjusted. Hence, the application of a radiant cooling system combined with a displacement ventilation system may cause some confusion in operation. In a large space especially, different control strategies may result in different thermal environments and levels of energy consumption. Therefore, it is necessary to develop potential control strategies for large space buildings to maintain the indoor comfort level while using as little energy as possible.
In recent years, many scholars have paid attention to the thermal comfort of large space buildings. Wang et al. [5] studied the IEQ (indoor environmental quality) of eight major airports in China through environmental measurements and questionnaires. They found that the black bulb temperature was 3–5 °C higher than the air temperature on average because of the glass curtain wall. Liu et al. [6] studied the thermal comfort of Terminal 1 of Chengdu Shuangliu International Airport in China. The results showed that the thermal neutral temperature of passengers was 21.4 °C in winter and 25.6 °C in summer, and the comfortable temperatures ranged from 19.2–23.1 °C and 23.9–27.3 °C, respectively. According to the questionnaires, 78.3% of the passengers were satisfied with the thermal environment, and 95.8% thought that the thermal environment was acceptable. Geng et al. [7,8] adopted the POE (post-evaluation) method to carry out passenger satisfaction tests and surveys for 11 terminals of 8 airports in 5 different climatic regions in China. They found that the subjective satisfaction survey results had a strong correlation with the calculation based on environmental parameter test. Jia et al. [9] studied the thermal comfort of passengers walking within an airport terminal. It was found that the cooling design parameters (25–26 °C, 50% RH) were not able to meet the thermal comfort level requirements if the walking time exceeded 10 min. Kotopouleas [10,11] conducted seasonal monitoring of indoor environments at three airports in the United Kingdom, and investigated 3087 passengers and staff. It was found that the outdoor temperature determined indoor personnel wear level, and the personnel had high thermal tolerance and a wide range of temperature acceptance. Pichatwatana [12,13] investigated environmental quality at Suvarnabhumi Airport in Thailand. It was found that the inside surface temperature of the glass roof was as high as 56 °C. The large glass roof led to high indoor radiant temperatures, and caused slight discomfort and dissatisfaction among employees.
Many methods to improve indoor thermal environments have been identified, such as increasing the fresh air heat exchange rate, relocating air vents, and replacing refrigerants in chillers. Ramis and Santos [14] measured temperature and humidity at three international airports in Brazil, taking into account local climate characteristics to assess the current thermal comfort. The results showed that the indoor temperatures exceeded the requirements for thermal comfort, and that natural ventilation could provide the best thermal comfort. Liu et al. [15] studied the impacts of air infiltration on the space heating performance of 18 airport terminals in China. It was found that by improving air tightness and using floor heating, the annual heating demand could be reduced by 84% on average, alongside an increase in thermal comfort level. However, maintaining comfort in large space buildings requires a huge amount of energy consumption. For conventional all-air air conditioning systems, air temperature is the key variable for system regulation. Abdallah et al. [16] monitored the indoor environment, and the energy consumption of the HVAC system, in five areas in an Assiut International Airport terminal building. The HVAC system consumed 70% of the site’s electricity, and it was found that monthly energy consumption would reduce by 24.5% if the air conditioning set temperature was increased from 25 °C to 27 °C.
Radiant cooling floors employ large surfaces for heat transfer with the indoor environment, thereby producing a uniform temperature distribution and increasing the comfort level in areas where people are active [17]. In addition, high-temperature chilled water is pumped into the radiant system and undertakes a part of the room sensible cooling load. This not only reduces the fan power consumption on air delivery, but also increases the coefficient of the performance of chillers [18]. Zhou [19] announced that the radiant floor system of Terminal 3 at Xi’an Xianyang International Airport could contribute energy savings of 39%, compared to the all-air air conditioning system used in Terminal 2. However, according to research by Congedo et al. [20], while the energy efficiency of cooling floors is slightly higher than that of fan coils, the energy consumption required to operate these floors is 30% higher than that for fan coils. Therefore, it is necessary to conduct studies on the operation and management of floor cooling to improve performance. With regard to the combined system discussed in this study, several parameters can be adjusted to meet cooling demand, such as the supply air temperature of the ventilation systems, the supply water temperature of cooling floors, etc. Different control strategies may lead to different levels of energy use, even while maintaining the same comfort level, as radiant floors primarily exchange heat through radiation, while air ventilation systems exchange heat by convection [21]. However, there has been limited research performed on indoor environments in large spaces with regard to radiant floor/displacement ventilation system combinations under different weather conditions and different control strategies.
This study aims to develop a thermal environment analysis method and propose control strategies for cooling floors combined with displacement ventilation systems in large space buildings. This method aims to identify the relationship between the cooling capacity of the combined system, the comfort index, and the system control variables. Based on this method, system control strategies are proposed, which not only satisfy indoor thermal environment requirements, but also contribute to energy conservation. Terminal 3 building of Xi’an Xianyang International Airport was used as an example to conduct this research.

2. Theory and Methodology

Control strategies for radiant cooling–air conditioning combination systems will be identified through analyzing system cooling loads and indoor environment comfort levels, and determining their impact factors and the control variables.

2.1. Space Cooling Load and Control Variables

In a room only conditioned by convective air conditioning systems, the supply air temperature or flow rate is a key control variable that alters the system cooling capacity. In a space dominated by radiant cooling systems combined with auxiliary air conditioning systems, the cooling demand not only depends on outdoor weather conditions and indoor heat gain, but is also affected by the cooling proportion of radiant system. As Figure 1 illustrates, the heat gain caused by convection can directly become the system cooling load; a part of the radiant heat gain can also be directly absorbed by cooling surfaces, and the rest is absorbed by the surfaces of the enclosure structure and furniture, and then removed by the air conditioning system and cooling surface. Thus, the cooling surface can increase the cooling load and reduce the impacts of the thermal mass of enclosure structures and furniture on radiant heat gain. The higher the radiant heat gain, the greater the cooling load [22]. In addition, the heat gain absorbed by the cooling surface is conducted to its internal hydronic system, and it does not necessarily equal the cooling load of the radiant system because of the thermal mass surrounding the internal water pipes. This operation is generally in a non-steady state, and depends on many parameters [23,24]. As previous research has indicated, parameters like pipe diameter, material, pipe depth and spacing, supply water temperature, and flow rate influence the cooling capacity of radiant cooling systems [21]. For radiant systems in use, the cooling capacity can be adjusted by changing the water temperature or water flow rate, ultimately influencing the cooling surface temperature. Therefore, the heat transfer on cooling surfaces should characterize the capability of radiant cooling systems, and the cooling surface temperature should be the key control variable.
Thus, both the cooling surface temperature (tf) and the supply air temperature of the auxiliary air conditioning system (ts) are the key control variables for the combination of radiant cooling systems and constant volume (CAV) air conditioning systems.
Hence, the sensible cooling load of air conditioning systems, and the cooling capacities of radiant cooling systems and the combined system can be obtained by Equations (1)–(3), respectively.
Q a = G · C p · ( t a t s a )
Q f = A · h · ( t o p t f )
Q = Q a + Q c f = G · C p · t a t s a + A · h · ( t o p t f )
These equations show that the cooling capacity of a combined system is linear with the cooling surface temperature or supply air temperature, as the air flow rate, air specific heat capacity (Cp), and surface heat transfer coefficient ( h ) of the cooling surface are constant.

2.2. PMV–PPD

The indoor environment of large space buildings is evaluated using the PMV–PPD (predicted mean vote—predicted percentage dissatisfied) index [25], and the evaluation criteria can be summarized by the following thermal comfort equations:
P M V = [ 0.303 e x p 0.036 M + 0.0275 ] × { M W 3.05 5.733 0.007 M W P a                           0.42 [ M W 58.2 0.0173 M 5.867 P a 0.0014 M 34 t a                           3.96 × 1 0 8 f c l × t c l + 273 4 t m r t + 273 4 f c l h c ( t c l t a ) }
P P D = 100 95 × e x p [ ( 0.03353 P M V 4 + 0.2179 P M V 2 ) ]
P M V = [ 0.303   e x p ( 0.036 M ) + 0.0275 ] × { M W 3.05 [ 5.733 0.07 ( M W ) P a ] 0.42 [ ( M W 58.2 ) 0.0173 M ( 5.867 P a ) 0.0014 M ( 34 t a ) 3.96 × 10 8 f c l × h r t c l 1 n A i · t i A f + 1 n A i + A f · t f A f + 1 n A i f c l · h c ( t c l t a ) }
P M V t s = P M V t a = 0.0014 M + f c l · h c
P M V t f = 3.96 × 10 8 f c l · h r · A f 1 n A i + A f
According to heat transfer between the human body and the environment [26], Equation (4) can be also expressed by Equation (6). Therefore, as Equations (7) and (8) indicate, PMV is also linear with the supply air temperature or cooling surface temperature, as the metabolism of the human body and the heat transfer coefficients, hc and hr, are generally constant in a static state.

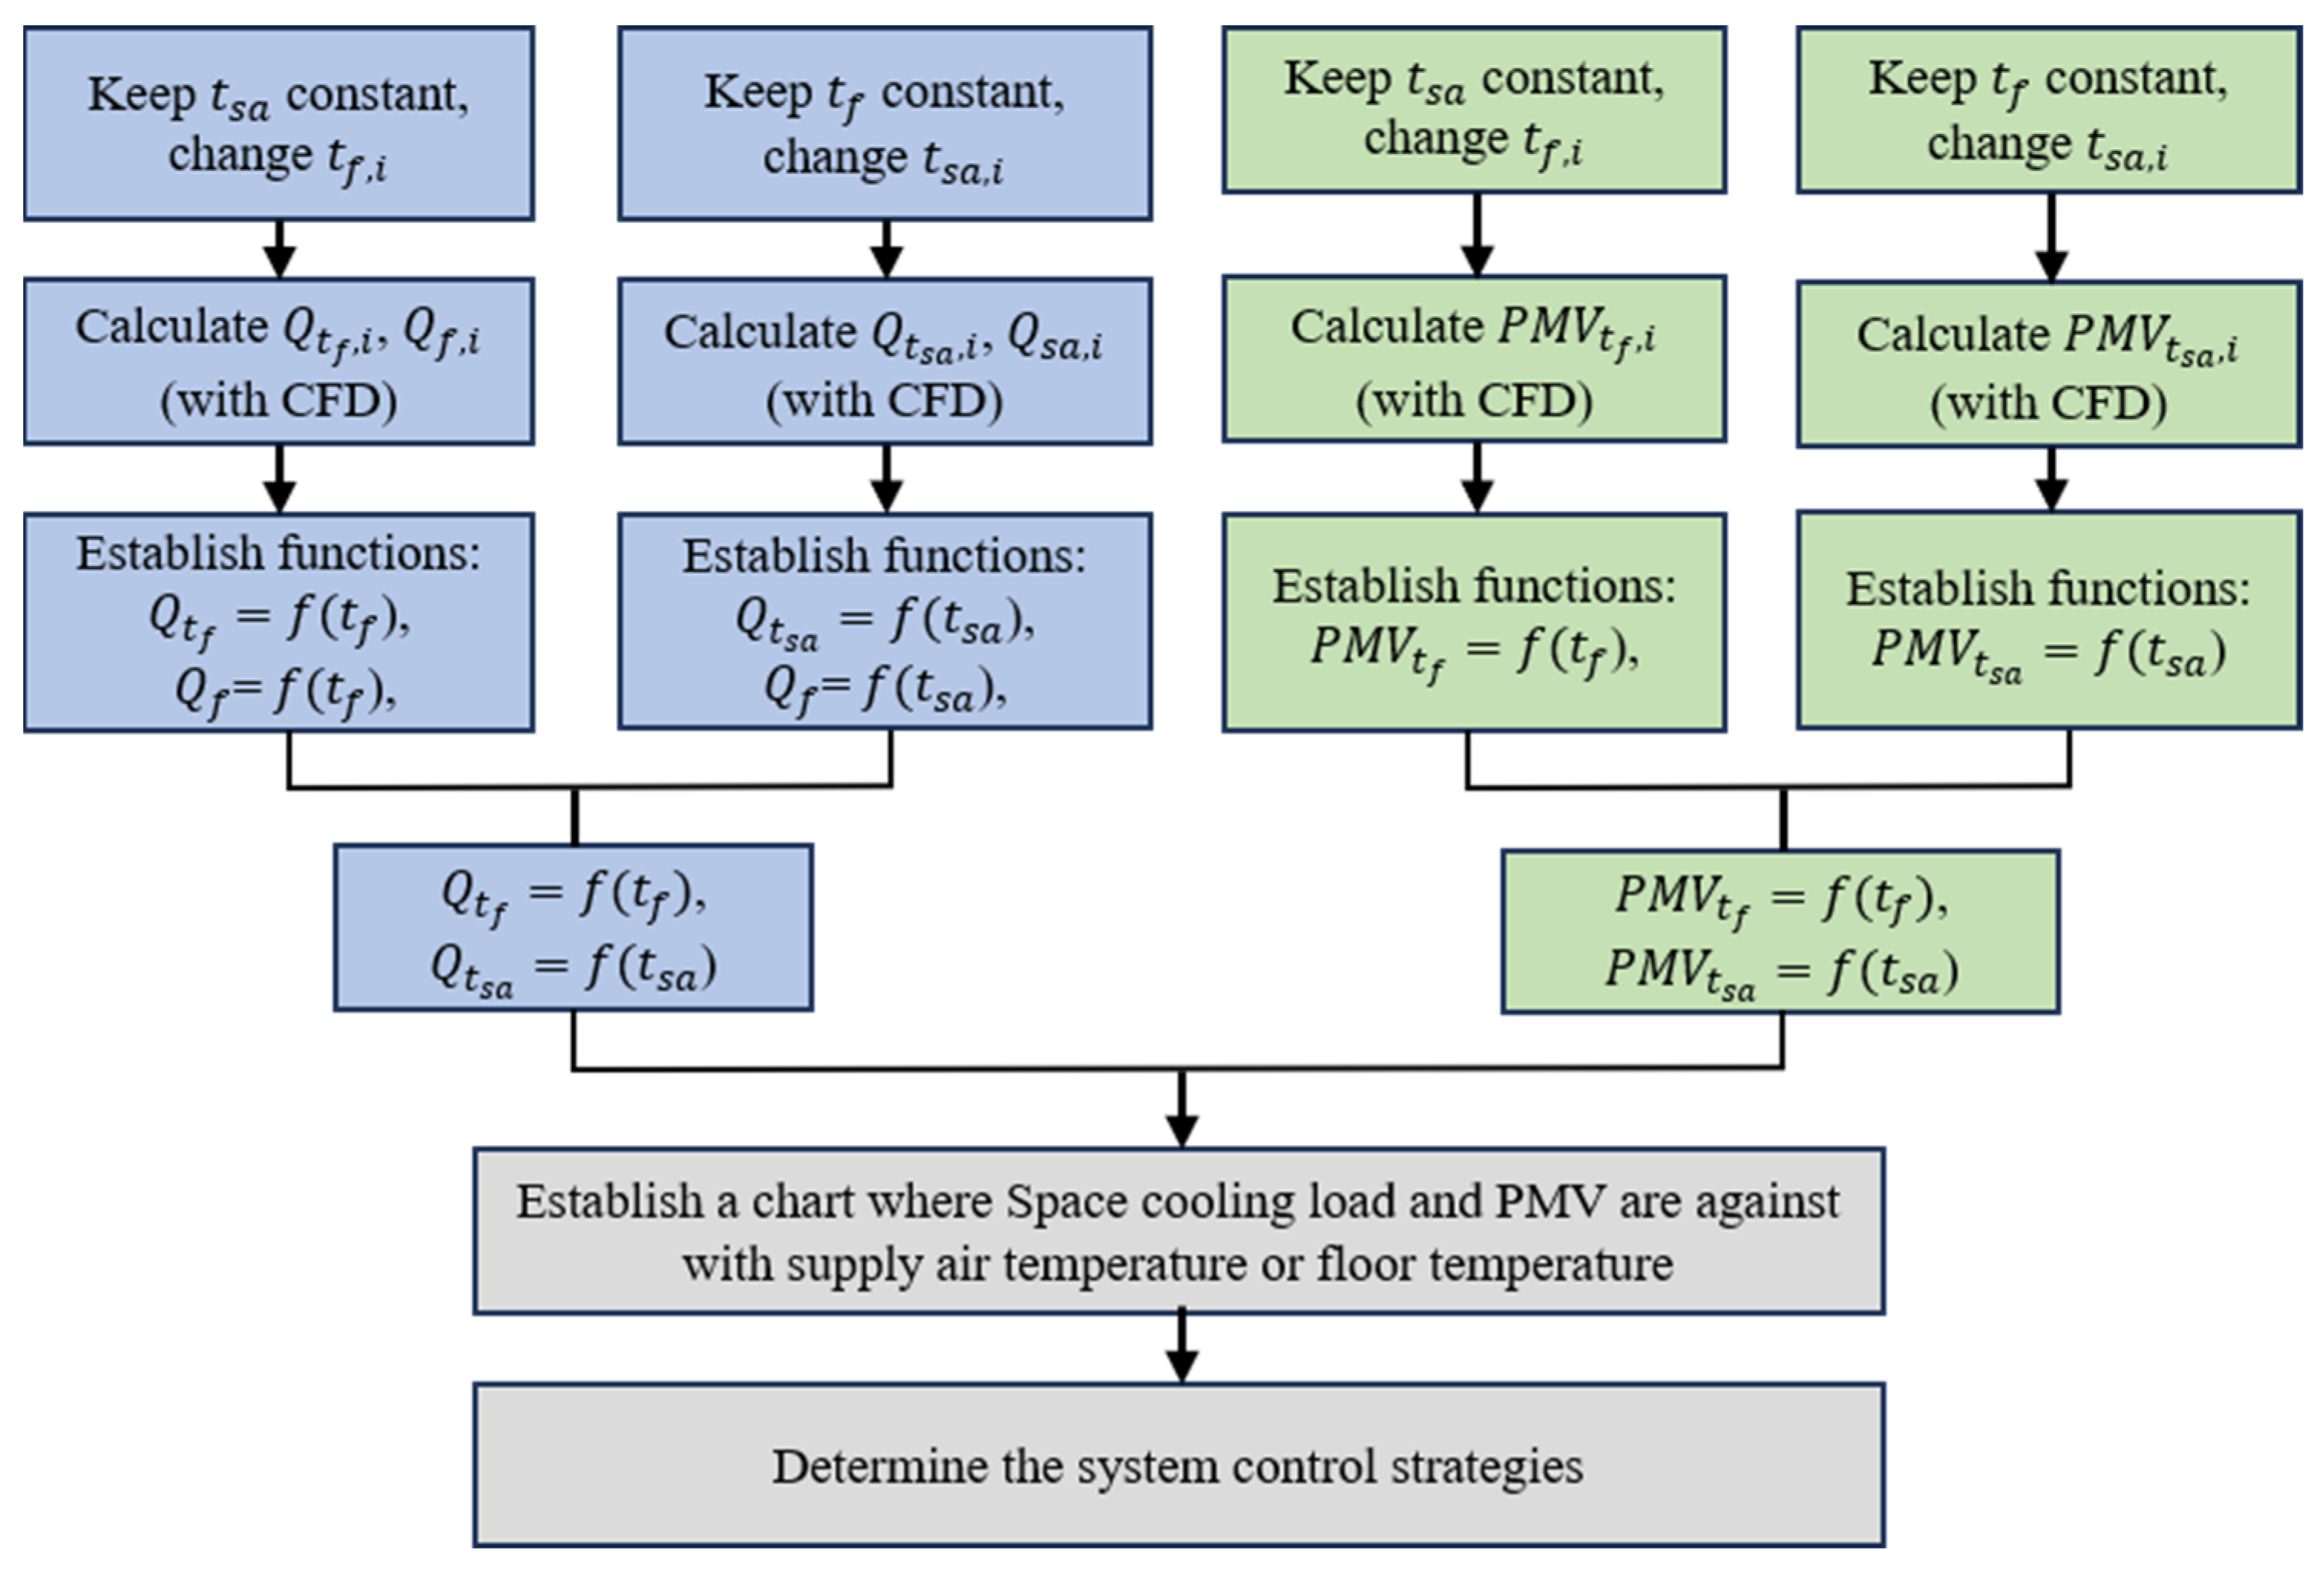
2.3. The Program for Optimizing Control Strategy

Based on the above theoretical analysis, cooling surface temperature and supply air temperature are the key control variables for the combination of radiant cooling and air conditioning systems; the PMV of a large space and the cooling capacity of the combined system are linear with the supply air temperature and cooling surface temperature, respectively. Therefore, as Figure 2 illustrates, several mathematical relationships can be established through collecting environmental data under different conditions, including cooling capacity function with cooling surface temperature or supply air temperature as independent variables, and PMV functions with cooling surface temperature or supply air temperature as dependent variables. These functions can be used to draw a chart to determine PMV and cooling capacity under different conditions, and to determine the optimal region and control strategy for the combined system.

3. Case Study

Terminal 3 of Xi’an Xianyang International Airport is the first terminal in China to use radiant floor and displacement ventilation for cooling, with the combined systems having been put into place in 2012. This research investigated and evaluated the indoor thermal environment in the terminal through on-site measurements and questionnaires, and then a CFD model was created using the simulation software Airpak 3.0, and was verified by comparison with the testing results. According to related national regulations, the verified CFD model was used to analyze the indoor thermal environment and the cooling capacity of the combined system. The laws of PMV and cooling capacity, varying with supply air temperature and radiant floor temperature, respectively, were determined. Based on the laws, some potential control strategies were found to maintain the indoor comfort level with less energy use.

3.1. Building Profile

Xi’an Xianyang International Airport is the fifth largest airport in China. The total building area is 258,000 m2. The main building includes ticket handling, baggage claim, and business and office operations. The height of the main building is 36.5 m, and the departure hall is located on the second floor with an area of 32,000 m2, an average height of 22 m, and a maximum height of 26.5 m. The building envelope mainly consists of double-layer glass curtain walls; the roof is made of insulating alloy plates, and 10% of the area is covered by a lighting belt that is made of polycarbonate.
A radiant cooling floor combined with a displacement ventilation system serves the ticket hall and waiting room. The radiant floor is responsible for part of the sensible cooling load. The indoor and outdoor airflows are mixed and handled, and then supplied to the building through displacement devices to maintain the indoor humidity and to undertake a part of the sensible cooling load.
The research area is located on the north side of the departure hall of Terminal 3, comprising a rest area connecting to Terminal 2. The length is 114 m, the width is 39.75 m, and the heigh ranges from 17.5 m to 26.5 m, with an average of 22 m.

3.2. On-Site Measurement

3.2.1. Indoor Thermal Environment Comfort Indicators

The indoor environment was evaluated using the PMV–PPD index (Equation (4)), where the mean radiant temperature can be calculated by Equation (9):
t m r t = t g + 273.15 4 + 1.1 × 1 0 8 × V 0.6 ε × D 0.4 ( t g t a ) 0.25 273.15
The north rest area of the departure hall in Terminal 3 was selected for measurement in the study, and it was divided into the perimeter zone, middle zone, and inner zone, according to the influence of the outdoor environment. As Figure 3 illustrates, each zone had 2–4 testing points. The on-site measurements were conducted in July 2021 and August 2022.
According to Equation (6), the testing environmental parameters included indoor air temperature (ta), indoor and outdoor relative humidity (RH), indoor air wind speed (v), indoor black bulb temperature (tg), glass curtain wall temperature, floor temperature, roof temperature, elevator and other indoor heat source surface temperatures, etc. The indoor air temperature and humidity were measured at heights of 0.1 m, 0.6 m and 1.1 m, corresponding to the position of the feet, waist, and head of a human body in sitting position. The wind speed and black ball temperature at the height of 1.1 m were measured, and the floor temperature was measured under the seat. Table 1 shows the measurement parameters and required instruments. In order to reduce measurement errors, the instrument needed to be calibrated using the comparison method before testing. Multiple measurements were taken at a point during testing, and the recorded data were analyzed after testing to eliminate outliers.
The questionnaire mainly included questions about gender, age, wearing condition, thermal sensation vote (TSV), thermal comfort vote (TCV), and thermal preference vote (TPV). Table 2 summarizes the scales of TSV, TCV, and TPV, and Table 3 shows the information of those who took the test.

3.2.2. On-Site Measurement Results

  • Outdoor weather
The on-site measurements were carried out twice, in the years 2021 and 2022. The first measurement was conducted from 8:00 to 19:00 on 21 and 22 July 2021. The average temperature during the day was 30.4 °C, and the average relative humidity was 53.1% (Figure 4). According to historical weather data for the area, the average outdoor temperature is 30.7 °C, so the weather on 22 July 2021 can be regarded as a “typical summer day”.
The weather in early August 2022 was extremely hot. On August 7, the second measurement period, the average daytime temperature was 34.5 °C and the average relative humidity was 57%. The outdoor air temperature had exceeded the high temperature value in meteorology, i.e., 35 °C. Hence, this day can be regarded as a “high-temperature day”.
2.
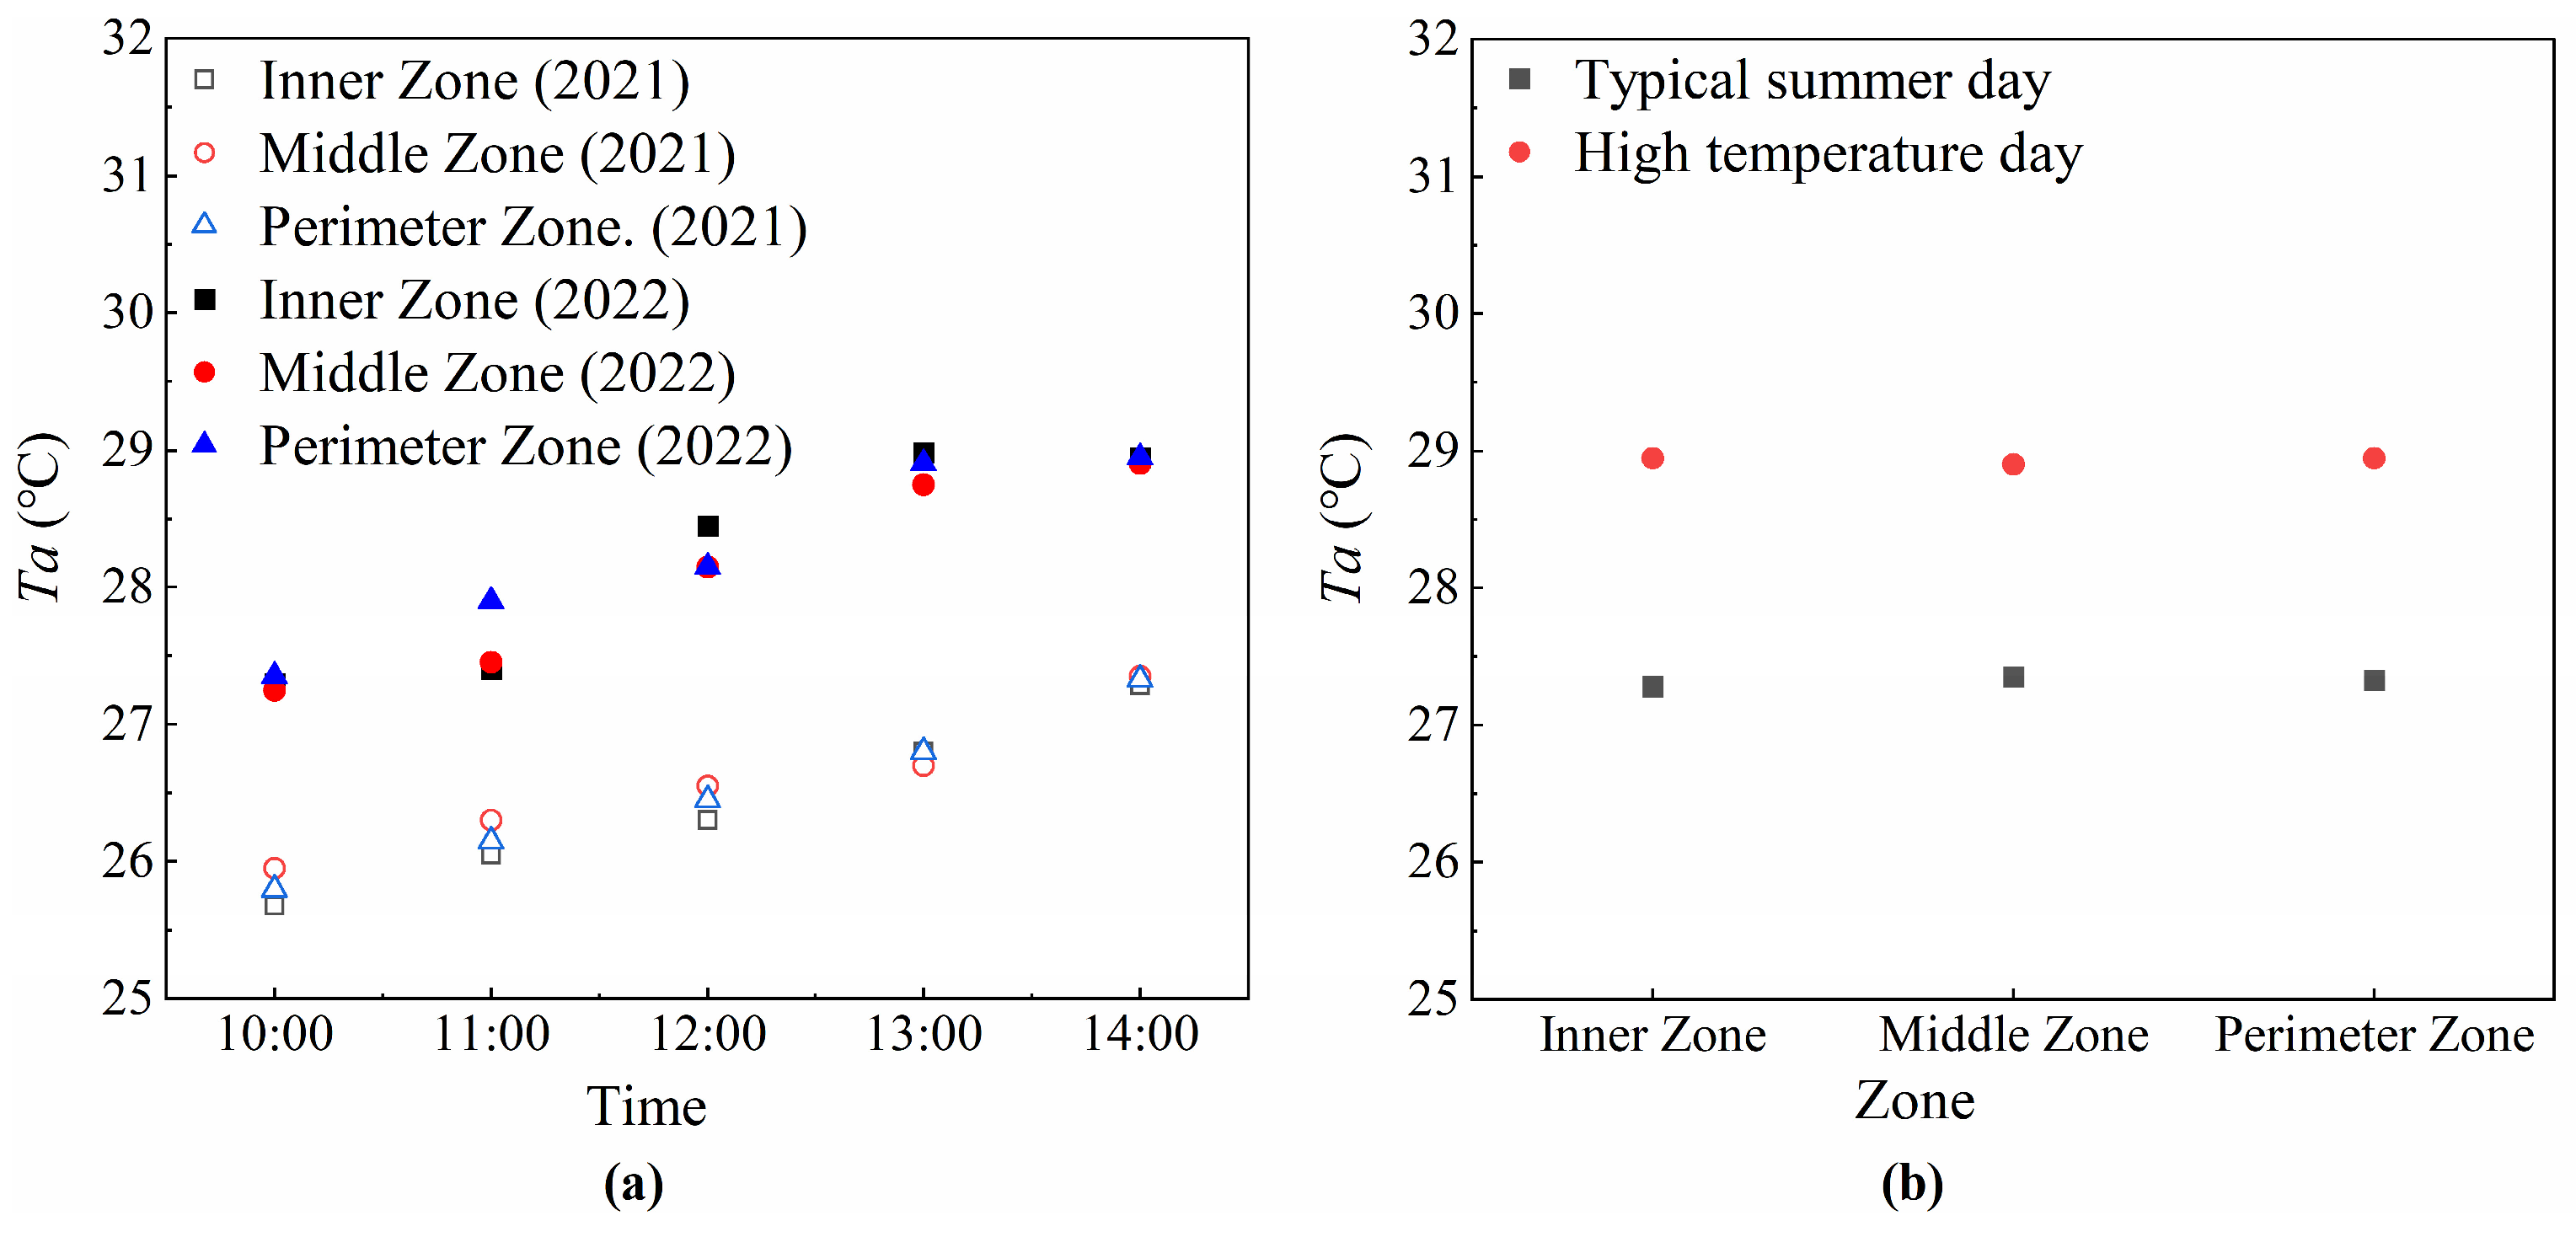
Horizontal temperature and humidity distribution
The horizontal temperature distribution at the height of 1.1 m is shown in Figure 5. During the testing period (10:00–14:00), the regional air temperature increased with time. Compared to the indoor air temperatures observed on a typical summer day, these temperature values were significantly higher on the high-temperature day. The air temperature of the inner zone on the typical summer day increased significantly as outdoor temperature increased (Figure 5a), followed by the perimeter zone, while the temperature of the middle zone increased slowly. This was because the inner zone temperature was affected by personnel activities, internal charging stations, and other service equipment. The temperature increased as the number of people increased, and the service equipment was more frequently used. Although 10 displacement air vents were installed in the zone, the wind speed was as low as 0.1 m/s at that time and was obstructed by chairs. An elevator operated in the middle zone, which had a large heat dissipation capacity. However, the airflow could not be effectively delivered to the vicinity of the elevator, even though the average supply temperature was 22 °C. Hence, compared to other areas, the air temperature appeared slightly higher from 10:00–12:00. However, from 12:00 to 14:00, since the middle zone was minimally impacted by the outdoor environment, the air temperature did not increase as significantly as in the other two zones. As Figure 5b illustrates, no significant difference in the average air temperature was observed among these three zones in the daytime, although the perimeter zone was mainly affected by the heat transmitted through the ceiling and the glass curtain wall. This was mainly attributed to the effect of the cooling floor.
On the high temperature day, the average wind speed at the air vents increased to 0.3 m/s, and the average wind temperature was 25 °C. The air temperature increased in the inner zone, and reached its peak at 13:00, while the peak temperatures occurred at 14:00 in the perimeter and middle zones. The inner zone was affected by human activities, the ceiling, and self-service vending machines, and the outdoor temperature increased significantly at noon; the heat gain in this area could not be effectively removed.
According to the air temperature distribution, no obvious difference existed in horizontal temperature among the three zones, indicating that the layout of air conditioning devices was reasonable. However, the indoor air temperature was greater than 28 °C on the high-temperature day, which significantly exceeded the comfort level II requirements of indoor air conditioning design criteria [27], and led to an overheated environment.
As Figure 6 illustrates, the relative humidity gradually decreased from 10:00 to 14:00, ranging between 58.95% and 68.45% at the height of 1.1 m, which met the comfort level II requirements of indoor air conditioning design criteria in summer (≤70%) [27].
3.
Vertical temperature distribution
Since the maximum indoor temperatures occurred at 14:00, the test data at 14:00 was used to analyze the vertical temperature distribution. As shown in Figure 7a–c, the indoor vertical temperature exhibited a rise of 0.6–0.8 °C from the ground to 0.1 m on the typical summer day, but little significant change was observed from the height of 0.1 m to 1.1 m. On the high-temperature day, the air temperature increased by 1.1–1.6 °C from the ground to 0.1 m height, and then the air temperature continued to increase gradually as the height increased from 0.1 m to 1.1 m, showing a significant temperature gradient.
The floor temperature exhibited no significant changes between these on-site measurements. However, the temperature of the ceiling surface increased on the high temperature day, reaching 38.2 °C. As shown in Figure 7d, the average temperature difference between the ceiling and floor was 10 °C on the high-temperature day, which was much higher than the gap of 3.9 °C on the typical summer day. Hence, the air buoyancy made the temperature gradient more pronounced on the high-temperature day.
4.
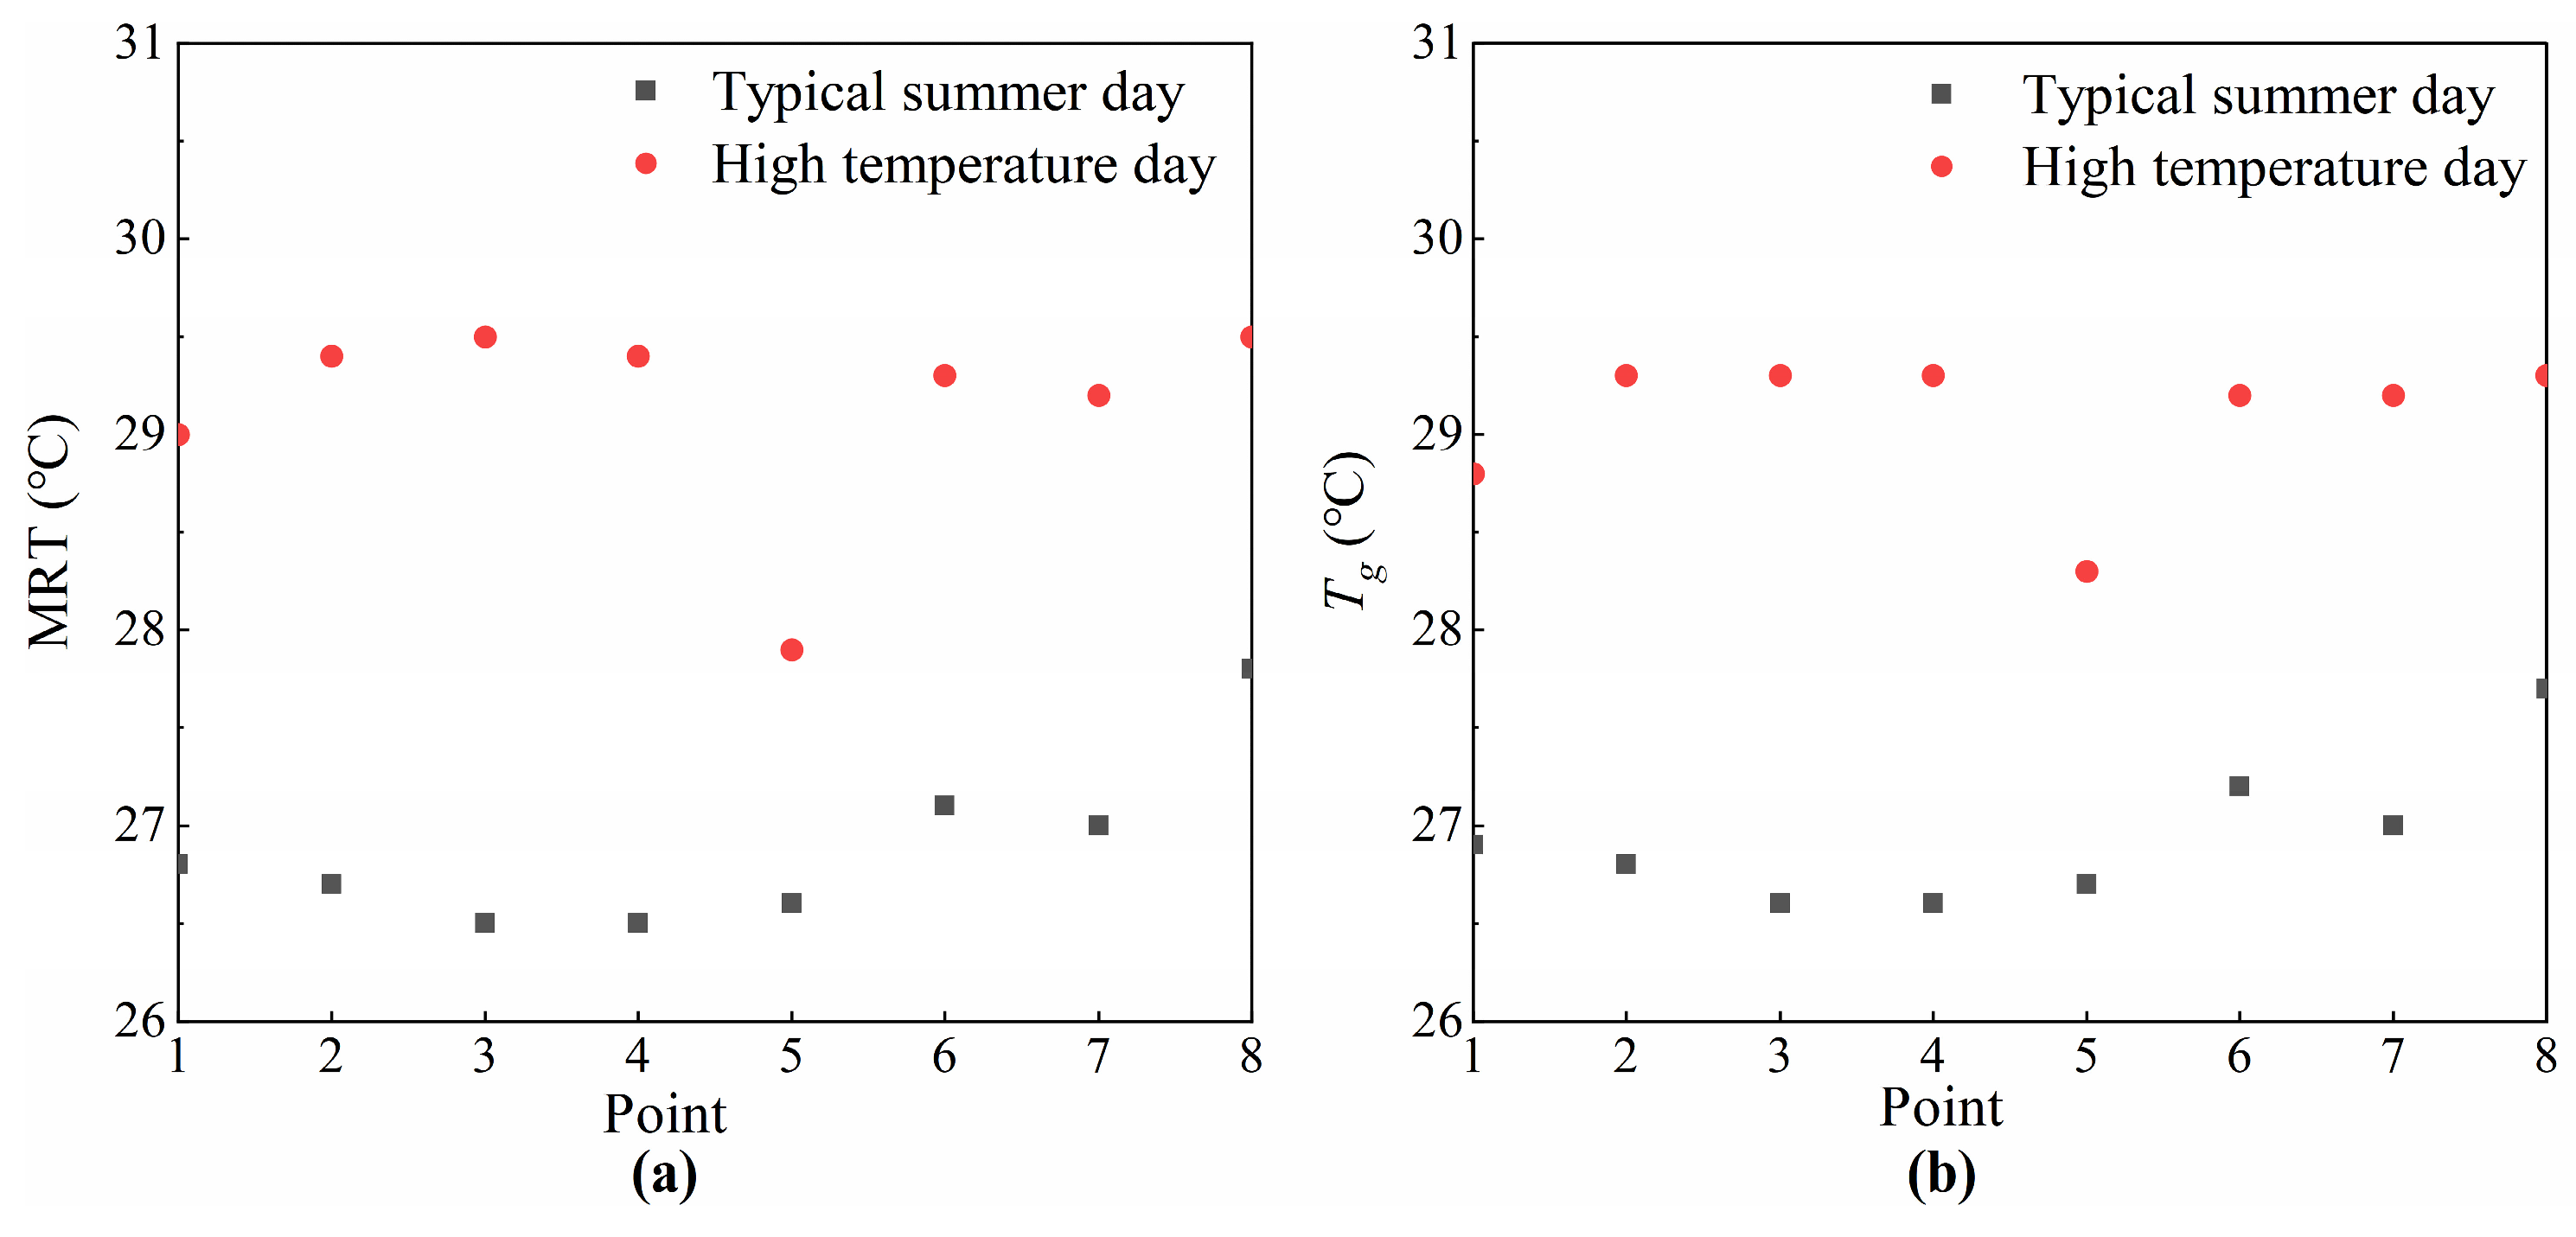
Mean radiant temperature (MRT)
The mean radiant temperature was obtained by measuring the air temperature and the black ball temperature, and taking the black ball emissivity of 0.95 and the black ball radius of 0.075 m into Equation (9).
The mean radiant temperature fluctuated within 2 °C during the testing periods. The mean radiant temperature was 26.5 °C on the typical summer day. The highest value of 27.8 °C occurred at 14:00 at point 8; the lowest value was 25.8 °C at 10:00 at point 3. On the high-temperature day, the mean radiant temperature was 28.4 °C. The highest value was 30.3 °C at 13:00 at point 4; the lowest value was 26.1 °C at 10:00 at point 1. As shown in Figure 8, the black ball temperature and mean radiant temperature were mainly affected by the surface temperatures around the points. Point 8 was near the glass curtain wall, and the radiant temperature at this point was significantly greater than that at other points on the typical summer day. The radiant temperature at point 5 appeared the lowest on the high-temperature day because point 5 was close to four displacement ventilation vents, and was therefore affected by the supply air temperature of 25 °C.
5.
PMV–PPD and Subjective Feltings Voting
The PMV–PPD index can be calculated with Equation (4) based on the measurement results and some reasonable assumptions [28]. The thermal resistance of clothing is 0.6 clo, and the metabolic equivalent is 1 met while sitting. The calculation results are shown in Figure 9. The average PMV value on the typical summer day was 0.54, and the maximum value was 0.87. The corresponding PPD values ranged between 7% and 22%, which met the class II standard (PMV values between ± 1) of the national code [27]. On the high-temperature day, the average PMV value was 1.16 and the maximum was 1.63, and the corresponding PPD values ranged from 12% to 58%. According to the index of PMV–PPD, the thermal environment did not meet thermal comfort requirements on the high-temperature day.
The PMV value was obtained by calculation with the environmental parameters, and it was verified by subjective feltings voting in the large space with the radiant cooling floor. As Figure 10a illustrates, the PMV value was greater than the TSV value in most cases, and it appeared significant on the high-temperature day. The main reasons for this were as follows: (1) The PMV value was calculated with environmental parameters, without considering the differences among people, while TSV represents a subjective sensation; (2) The PMV index did not consider the direct impact of the radiant cooling floor on the human body.
However, the PMV and TSV values showed similar trends of change in the indoor thermal environment during the testing periods. In addition, the black line in Figure 10b indicates that TSV was strongly correlated with PMV, and the red and green lines show that TCV and TPV were also correlated with PMV, respectively. This means that the objective indicator of PMV can reflect the comfort level of a large space with radiant cooling floors. Therefore, the index of PMV can be used for environmental evaluation, and can serve as a reference for optimizing control strategies of the combined system.
In addition, as shown in Figure 11a, the overall TSV value was 0.52 on the typical summer day, indicating that the environment was neutral-warm, and 86% of the people present believed that the current thermal sensation was within a comfortable range. On the high-temperature day, the overall TSV value was 0.87, and 59% of the people present thought that the current environment was slightly warm or warm. The air conditioning system was unable to effectively maintain the indoor thermal environment at the required comfort level on the high-temperature day.
As illustrated in Figure 11b, 79% of people believed that the current environment was “comfortable” on the typical summer day. However, the overall TCV value was −0.58 on the high-temperature day, and more than 50% of the people present believed that the environment was “slightly uncomfortable” or “uncomfortable”.
Figure 11c shows that the overall TPV value was −0.36 on the typical summer day, and 64% of the people present believed that there was no need to change the current environment; on the high-temperature day, the TPV was −0.73, and 73% of the people present hoped for a cooler environment.

3.3. Indoor Thermal Environment Simulation and Analysis

3.3.1. CFD Model Description and Validation

A CFD numerical analysis method was employed to analyze the indoor thermal environment through altering one or two parameters of the radiant cooling floor combined with a displacement ventilation system. The software Airpak was employed to conduct the simulation. The calculation involved a turbulence equation and a radiation equation. The k ε two-equation was used as the turbulence equation, and the radiation equation used the DO model. The k ε two-equation model has strong robustness and economy; it is widely used in large-scale turbulence calculation [29]. The DO radiation model is based on the radiation transfer equation from a finite solid angle, where each direction corresponds to a certain solid angle. This method is relatively simple, and the calculation results are relatively accurate [30].
There were many facilities in the survey area, and the simplified model is shown in Figure 12. In order to improve the thermal environment on the high-temperature day and to search for reasonable measures, the boundary conditions were based on the measurement data at 14:00, when the indoor average air temperature and relative humidity were 28.9 °C and 59.42%, respectively, and the related information is listed in Table 4. An unstructured hexahedron mesh was used to divide the model, and the mesh at the air outlet was densified. The total number of meshes was 2,626,660, and the number of nodes was 2,719,060.
The CFD model was verified before the subsequent simulation and thermal environment analysis. As Figure 13 illustrates, the simulation results were basically consistent with the measurement results on the high-temperature day, and the relative error was within 15%. As Figure 13a,b illustrates, the simulated values of air temperature and relative humidity were close to the measured values, with relative errors within ± 4 % , and the determination coefficients, R2, were higher than 0.7. The verification results show that the air temperature and relative humidity in the simulation strongly correlated with the measured values. As shown in Figure 13c, the relative errors of the mean radiation temperature ranged from 3% to 8%, but the determination coefficient, R2, was only 0.52. This means that some obvious errors existed between the simulation and measurement, and the most significant error occurred at point 5. Point 5 was surrounded by four displacement ventilation vents, as Figure 3 illustrates, and the wind speed was relatively higher than the other points on the high-temperature day, thereby affecting the radiation temperature. If the value at point 5 was ignored, the coefficient of R2 was as high as 0.76. Based on the statistical analysis, the CFD model can be used for subsequent environment analyses.
According to the simulation results, the air temperatures at the positions of the testing points were greater than 28 °C, the MRTs were greater than 30 °C, and the average PMV was 1.57. The environment was also in an overheated state. The average heat transfer rate on the floor surface (the capacity of the radiant floor) was 51.96 W/m2, the calculated heat exchange rate (the capacity of the ventilation system) of the displacement ventilation system was 97.76 W/m2, and the total heat exchange rate of the combined system was 149.72 W/m2. However, this rate could not meet the cooling demand on the high temperature day.

3.3.2. Thermal Environment Analysis

In order to meet comfort requirements while conserving energy, the radiant floor and ventilation system can be adjusted through reducing the air temperature or reducing the radiation floor temperature to maintain the PMV value and system cooling capacity within a reasonable region. According to the technical regulations for radiant heating and cooling [31], the supply air temperature should not be less than 18 °C, and the surface temperature of the radiant cooling panel should not be lower than 19 °C.
Therefore, optimizing schemes by altering individual system parameters was first considered. Several schemes were set as follows: (1) The floor temperature remained at the current 26 °C, and the supply air temperature was gradually reduced by 1 °C from 25 °C to 18 °C. (2) The supply air temperature was kept at 25 °C, and the temperature of the radiant floor was gradually reduced by 1 °C from 26 °C to 19 °C. Thus, there were 14 cases, and the details are shown in Table 5.
  • The scheme by reducing air supply temperature
As shown in Figure 14, the air temperatures at points 1–7 decreased gradually as the air supply temperature was reduced. In case 7, the average air temperature at points 1–7 was 27.35 °C, which had decreased by 1.3 °C compared to the original case, but the air temperature at point 8 remained at 29.4 °C. In addition, the MRT did not seem to be affected by the reduction in the air supply temperature (Figure 14b). Compared to the initial assessment, the average PMV value was 1.15, which had decreased by 0.42, and PPD values had decreased by 20.8% in case 7.
2.
The scheme by reducing floor temperature
As Figure 15 illustrates, the air temperature, mean radiation temperature, and PMV–PPD value at all points significantly decreased as the floor temperature was reduced in case 14. Compared with the initial performance, the average air temperature at points 1–8 was 27.58 °C, a decrease of 0.9 °C; the mean radiation temperature was 28.34 °C, a decrease of 2.57 °C; and the average PMV–PPD values were 1.01 and 27.4%, representing decreases of 0.56 and 27.1%, respectively. Compared to the performance in case 7, the mean radiation temperature decreased most significantly, and the air temperature distribution appeared more uniform in case 14.
3.
Cooling capacity and heat transfer coefficient of the cooling floor
A mathematical regression method was used to find the relationship between indoor comfort level and the cooling capacity of the combined system. As Figure 16 illustrates, the PMV value and the cooling capacity were both strongly correlated with the supply air temperature and the floor temperature, respectively. Hence, the mathematical relationships between the PMV and cooling capacity of the combined system and the supply air temperature and floor surface temperature can be obtained.
Compared to the cases where supply air temperature was individually changed, the cooling capacity was higher if only the floor temperature was changed to achieve a similar comfort level (i.e., the PMV value was the same). As the floor surface temperature decreased, the PMV value approached the ideal, and the cooling demand increased significantly. Figure 17 shows that the cooling capacity of the displacement ventilation system increased as the supply air temperature decreased, but the cooling capacity of the cooling floor decreased. This is because the temperature difference between the floor surface and the inactive surfaces decreased. When only the floor surface temperature was reduced, the heat transfer on the floor surface significantly increased (Figure 17). When the floor surface temperature dropped to 21 °C (in case 12), the heat exchange on the floor surface was higher than that of the ventilation system. In this case, the average air temperature and mean radiant temperature were 27.8 °C and 29.1 °C, respectively.
In the cases where only the floor temperature was changed, while the supply air temperature remained constant, the cooling capacity of the displacement ventilation system decreased as the floor temperature decreased. This was because the difference between the supply air temperature and the indoor air temperature became narrow, and the buoyancy of the air decreased. In addition, the mean radiant temperature was significantly and evenly reduced by reducing the floor surface temperature, and the air temperature was also affected.
In order to achieve the same PMV value, the floor surface temperature can be set higher compared to the cases where solely the supply air temperature is changed. For example, the floor surface temperature was set to 19 °C to achieve a PMV value of 1, and the corresponding cooling capacity of the combined system was about 200 W/m2. Meanwhile, the air supply temperature needed to be reduced to 16 °C to obtain the same PMV, but this was below the limit recommended by the specifications, and the cooling capacity of the combined system was 165 W/m2. Therefore, although floor cooling contributed more heat exchange in the large space building, it utilized energy at a lower grade, providing the potential to improve system efficiency.
In addition, taking the operative temperature as the reference temperature and using the form of Newton’s cooling formula, the mathematical expression of the heat transfer of the floor surface is shown by Equation (2). The calculation formula for operative temperature is shown by Equation (10). According to the definition of operative temperature and the simulation results, the operative temperature at the height of 1.1 m in the large space of the terminal can be approximately calculated by Equation (11). The specific values are summarized in Table 6.
t o p = h c t a 1.1 + h r t m r t 1.1 h c + h r
t o p ( 1.1 ) = R f t m r t + t a ( 1 R f )
As shown in Figure 18, according to the fitting equation, the heat transfer coefficient of the floor surface was 10.26 W/(m2·K). The recommended value of ISO11855-2 [32] is 7 W/(m2·K). Zhang et al. [33] studied the heat transfer performance of cooling/heating suspended ceilings in large spaces with glass curtain walls, and the results showed that the total surface heat transfer coefficient of cooling suspended ceilings was 9.2 W/(m2·K), while the total surface heat transfer coefficient of heating suspended ceilings was 11.8 W/(m2·K). Considering that the building in this study was a large space and was affected by solar radiation passing through the semi-transparent roof, the floor surface heat transfer coefficient should be higher than the recommended value by ISO11855-2, and the result was within a reasonable range compared to the research in reference [33].

3.4. System Control Strategy Optimization

3.4.1. Optimization by Changing Single System Parameter

According to the thermal environment analysis, changing the air supply temperature can effectively improve the environmental conditions near the displacement ventilation vents and reduce the indoor air temperature. However, this effect was very limited, especially in the perimeter zone near the glass curtain wall. Conversely, the radiant floor with a large area was able to effectively reduce the mean radiant temperature of the large space, and make air distribution more uniform.
In order to comprehensively understand the effects of optimization by altering single parameters, the environmental parameters of several typical testing points were analyzed. Considering many passengers were frequently present in the perimeter zone and inner zone, the environment at points 1 and 8 were the focus. Testing point 8 was located in the seat near the glass curtain wall, while testing point 1 was in the inner zone, located near a self-service vending machine and a displacement ventilation device. The original environment case is represented by case 0. As shown in Figure 19, the PMV value of point 1 was equal to or less than 1 in cases 7, 13, and 14. The PMV value of point 8 was close to 1 only in case 14. The air temperature of point 8 was 28 °C in case 14, which was in the comfort range. Therefore, if only a single system parameter can be changed, then the scheme of case 14 is proposed, as it was able to create an environment that meets the standard [25].

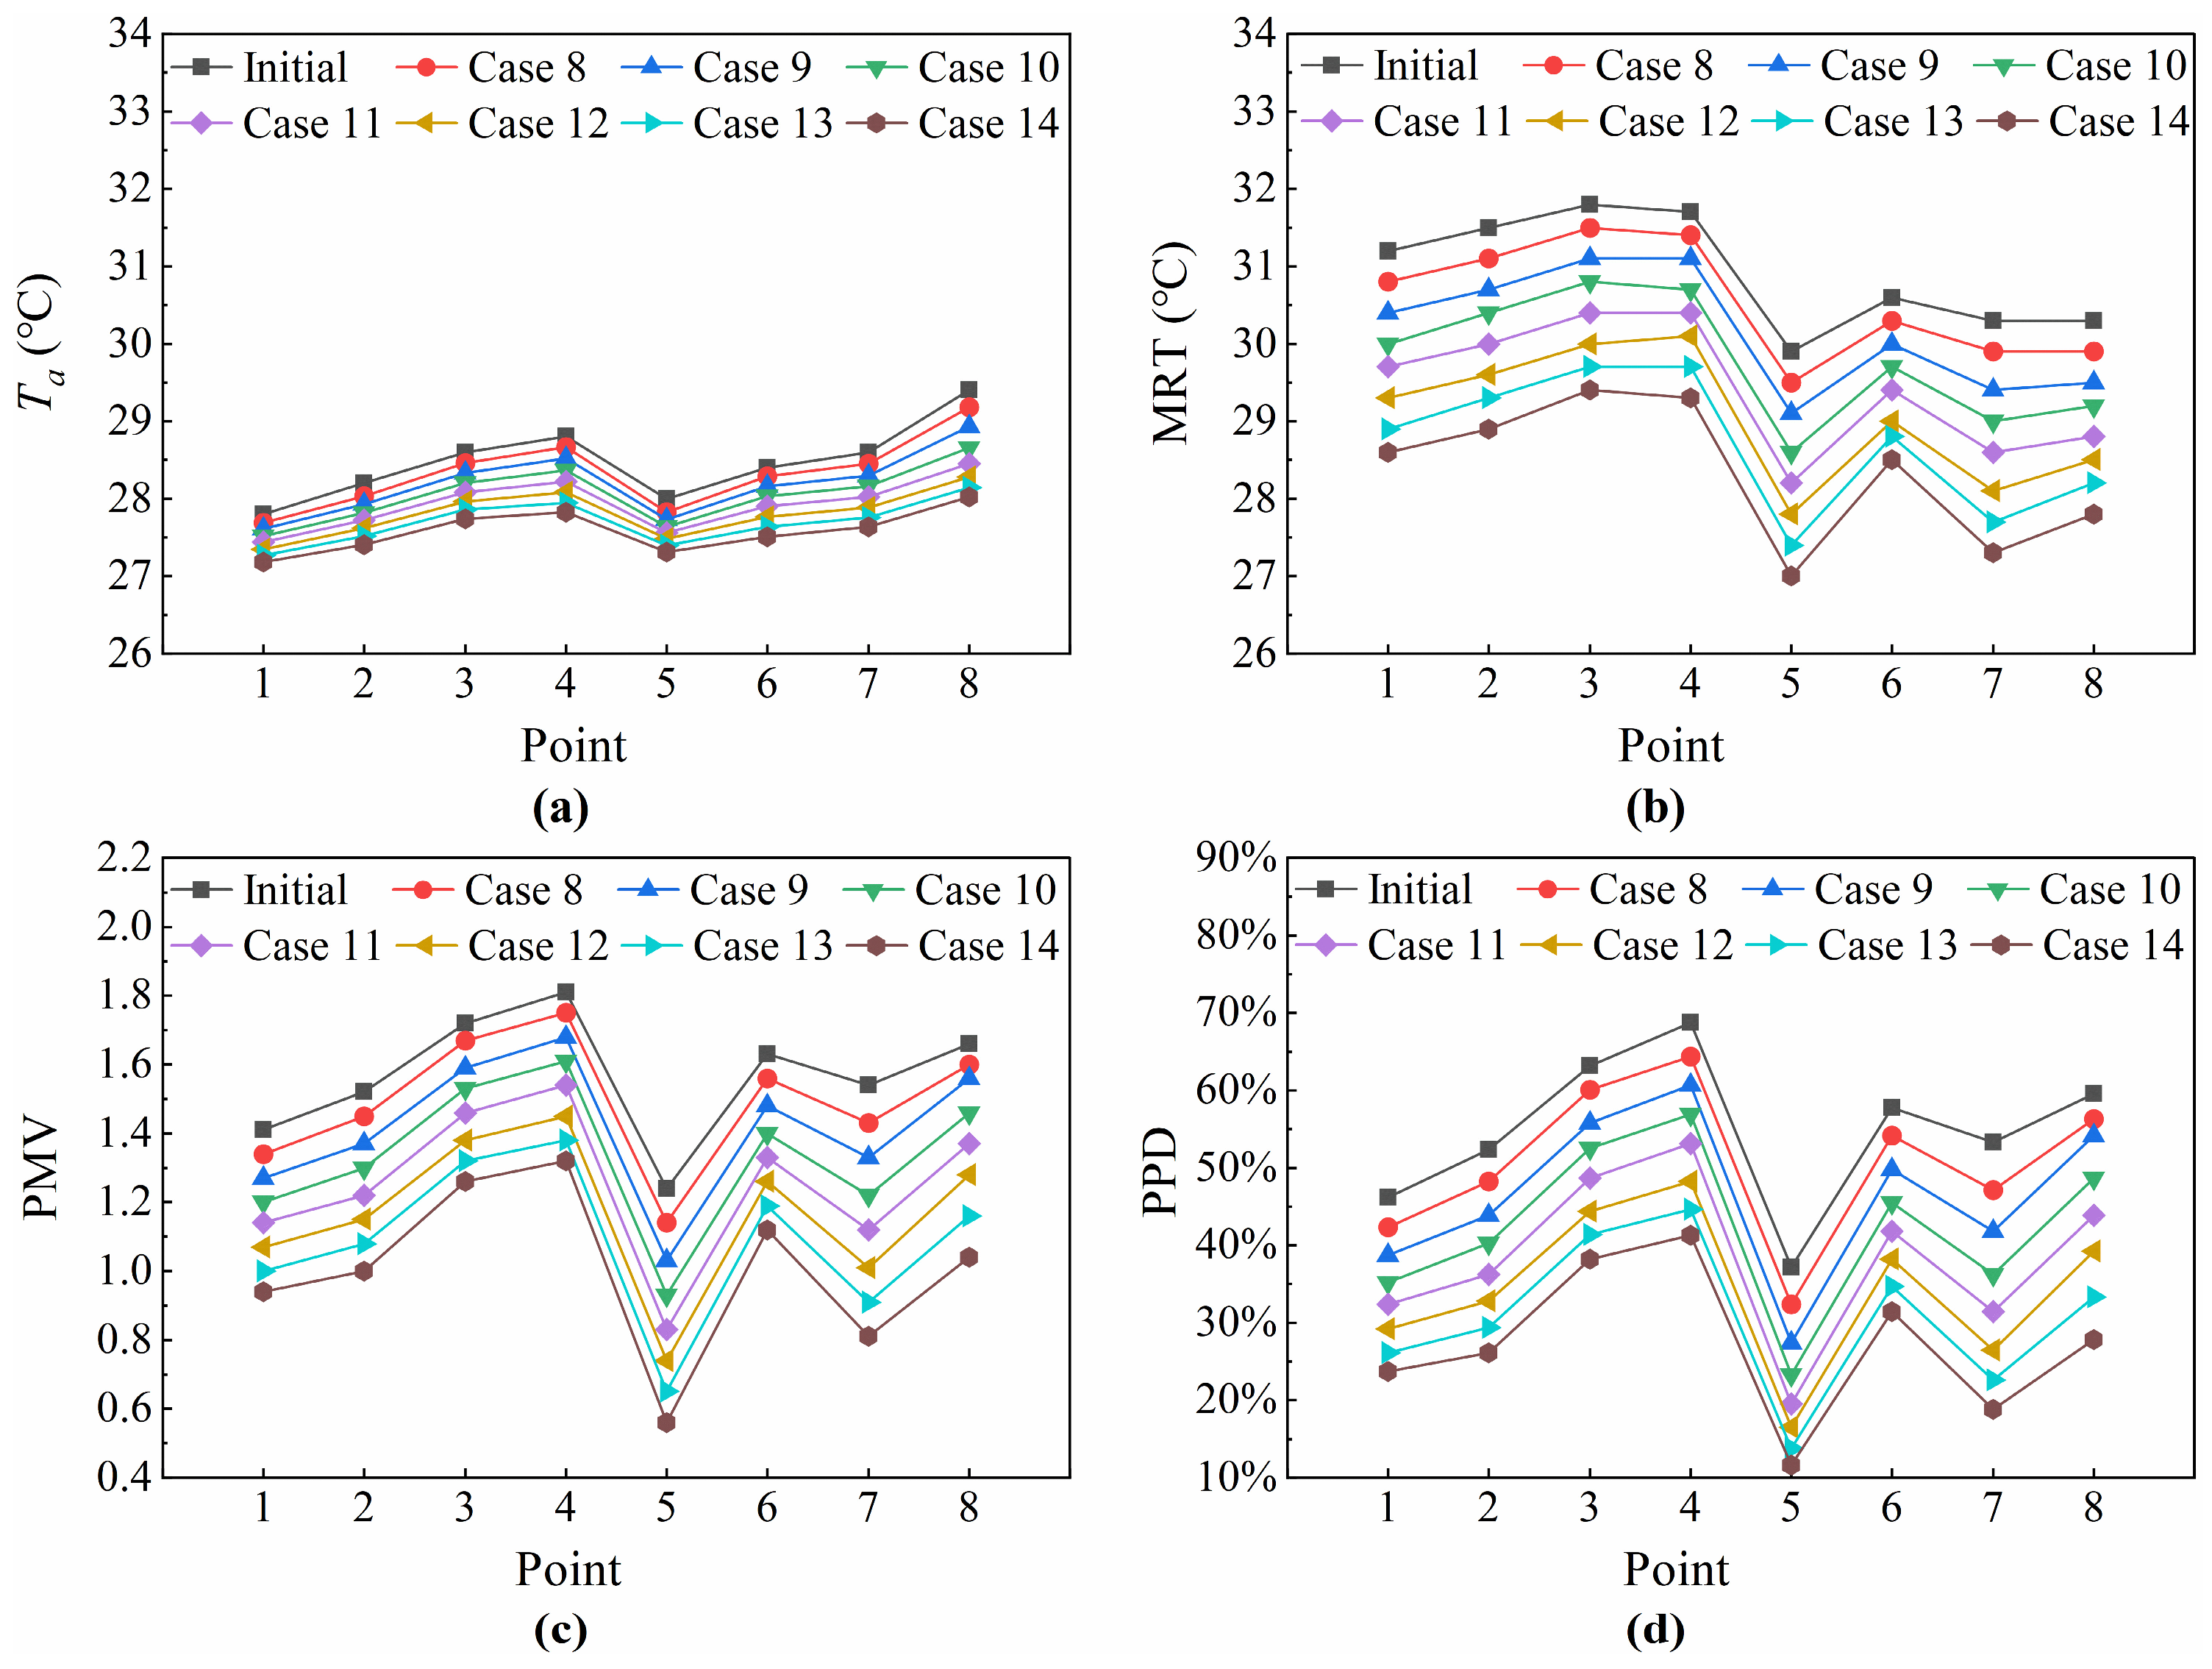
3.4.2. Optimization by Changing Multiple System Parameters

Multi-parameter adjustments should also be made to the radiant floor system and displacement ventilation system. Figure 16 illustrates the PMV values or cooling capacities of the combined system under conditions where only the supply air temperature changes, or only the floor surface temperature changes. It does not show the performance related to changing both the supply air temperature and the floor surface temperature simultaneously. According to the process of heat transfer in a space with a radiant system (Figure 1), the PMV value and cooling capacity should be within the range limited by the corresponding equations. Thus, the Taylor expansion method can be used to derive the PMV values or cooling capacities at different supply air temperatures and different floor surface temperatures. The results are shown in Figure 20. Based on the assessment, a scheme based on changing multiple system parameters should be selected.
Considering comfort requirements, the PMV should be within the range of ± 1 after system adjustment. Considering energy conservation, the cooling capacity of the combined system should not exceed the rate in case 14, where only the floor surface temperature was changed, and set to the limit value of 19 °C. Thus, the optimal region was determined. As shown in Figure 20, the optimal region was the triangle shaded area. In the region, the cooling capacities for different strategies ranged from 180 to 200 W/m2, within 10% difference of each other, while the PMV values ranged from 0.74 to 1.0, with a maximum difference of 26%. Therefore, optimizing strategies should prioritize meeting the comfort criterion, and supply air temperature should be adjusted first when the cooling load increases. The steps to optimize a thermal environment dominated by a radiant floor system combined with displacement ventilation are as following:
  • Decrease the supply air temperature if the indoor temperature exceeds the comfort limit of 28 °C;
  • Change the floor surface temperature if the indoor environment is still overheated and the supply air temperature has been set to the limit of 18 °C.
With regards to the situation on the high-temperature day, a scheme in which the supply air temperature is set to 18 °C and floor surface temperature is set to 22 °C was proposed. This was named case 15, in which the PMV and cooling capacity were expected to be 0.82 and 192 W/m2, respectively.
CFD simulation was conducted to further validate the assessment. According to the simulation, the average PMV was 0.87, and the cooling capacity of the combined system was 199.99 W/m2. Thus, the relative errors of the PMV and cooling capacity were 6% and 4%, respectively. As Figure 21 illustrates, the performance in case 15 was more acceptable. Compared to case 14, case 15 saw a significant improvement in the thermal environment, with a similar cooling capacity. In case 15, the air temperature in the inner zone approached the design criteria, and the distribution of PMV appeared more uniform.

4. Discussion

The thermal environment in large space buildings has always been a concern. Radiant cooling floors combined with displacement ventilation systems can maintain comfort levels in a large space building, but control strategies for these combined systems are still under discussion. The Terminal 3 of Xi’an Xianyang International Airport was taken as an example to study the indoor thermal environment of a large space. In addition to previous studies on the indoor thermal environment under single-weather conditions, multi-measurements and subjective surveys were carried out on a typical summer day and a high-temperature day to explore the distribution patterns under different weather conditions and develop a thermal environment analysis method. Based on the method, some system control strategies were also proposed. Nevertheless, there were some observations that warrant further discussions.
Firstly, the method for optimizing the control strategy of the combined system was based on some assumptions, i.e., that the air volume, the specific capacity of air, and the surface heat exchange coefficients were constant. The latter two are generally constant in the research field of HVAC; however, the air volume could vary with the cooling load or the number of passengers in many situations. Although changing either the air flow rate or supply air temperature can alter the cooling capacity of a ventilation system, the air volume plays an important role in temperature distribution and comfort level in large spaces. The corresponding effects should be considered in future studies.
Secondly, the index of PMV–PPD was used for evaluating the thermal environment of the large space building in the research, but its absolute value was higher than the subjective human perception value. Thus, the human subjective feeling in the optimization scheme should be more comfortable than the predicted PMV value in the simulation.
Thirdly, although the relative error of all of the calibration parameters was within 15% in the CFD model validation, the vertical temperature varied significantly with height in the actual measurements, and the phenomenon of stratification was more pronounced. This was because internal heat sources like humans were simplified by uniform temperature or heat flux density, without considering variation in the vertical direction.
The total cooling capacity of the combined system varied with the ratio of radiant cooling capacity. Ren et al. [34] stated that the proportion of the sensible heat removed by a radiant cooling floor to the total sensible heat removed by the ventilation system should be sufficiently high to make the PMV in the comfort zone of ± 0.5 in an office room, and that the proportion could be adjusted to pursue energy savings. In the large space of Terminal 3 of Xi’an Xianyang International Airport, the operation strategy of case 15 was proposed. The PMV in case 15 was 0.87 and the cooling capacity was 199.99 W/m2, while in case 14, where the ratio of radiant cooling capacity was up to 57.9%, the PMV was 1.01 and the heat exchange was 200.60 W/m2. Thus, it is not necessarily true that the use of more cooling energy leads to a more comfortable environment, and properly adjusting the supply air temperature and floor surface temperature is key to maintaining indoor comfort.
In addition, the calculation of operative temperature considered the impact of height, and was based on the proportion of the radiant cooling capacity. In fact, the ratio of radiant heat transfer in the space should be less than the estimate, so the real operative temperature should be higher, and the difference between operative temperature and floor surface was bigger than the assessment. Thus, the actual heat transfer coefficient of the floor surface should be slightly less than the current calculated value (10.26 W/m2). According to Figure 18, the cooling capacity of the radiant cooling floor should be 30.15–32.20 W/m2 when the outdoor air temperature is 32 °C, and the floor temperature was 26 °C on a typical summer day. The obtained value is basically consistent with the study conducted by Zhang et al. [3] and Zhao et al. [35], in which the cooling capacity was 30–40 W/m2. Therefore, the study result also acts as a reference for radiant cooling floor design in a large space.

5. Conclusions

This research developed a thermal environment analysis method for radiant cooling floor–displacement ventilation combined systems to improve the indoor thermal environments of large space buildings and reduce energy use. The rest area of the ticketing hall in Terminal 3 of Xi’an Xianyang International Airport was used as an example. The indoor thermal environment under different weather conditions in summer was studied through on-site measurements and CFD simulations with Airpak. The main results were as follows.
(1)
Supply air temperature and cooling floor surface temperature were taken as the control variables, and the cooling capacity of the combined system and the comfort index of PMV were linear with these two temperatures, respectively. Based on the functions, the optimal region was determined. In this region, the supply air temperature and the floor surface temperature had significant impacts on the comfort index of PMV, while only a slight impact on system cooling capacity. Thus, indoor comfort should be considered as a priority, and corresponding steps have been proposed for system adjustment.
(2)
The index of PMV value was basically consistent with the subjective voting results in the area where most people were in a static state in the assessed large space building, and this could still be used as a reference for optimizing the environment.
(3)
In the case study, the cooling capacity of the radiant floor combined with the ventilation system was not sufficient to meet the comfort requirements on a high-temperature day. Thus, the indoor environment needed to be improved by changing the supply air temperature and cooling floor surface temperature. According to CFD simulations, the radiant cooling floor acted on the entire rest area of the terminal, and it could effectively change the air temperature, the average radiant temperature, and the PMV value. However, decreasing the floor temperature led to an increase in the cooling capacity of the combined system, while the PMV value remained at the same level. The average PMV value was 1.01 when the radiant floor was set to 19 °C and the air supply temperature was kept at the initial value of 25 °C, and the heat exchange was about 200 W/m2. With the same cooling capacity, the PMV can be 0.87 if the radiant floor is set to 22 °C and the displacement ventilation air temperature is set 18 °C. Therefore, it is recommended that supply air temperature should be decreased first if the indoor temperature exceeds the upper limit, and then the floor temperature can be altered if the indoor environment is still in overheat after the supply air temperature has been set to 18 °C.
(4)
The surface heat transfer coefficient of the cooling floor was 10.26 W/(m2·K), determined through mathematical statistics based on simulation results in the case study.

Author Contributions

Conceptualization, R.H.; Data curation, J.L.; Investigation, X.L.; Methodology, W.Z.; Resources, W.Z.; Software, H.W.; Supervision, G.L.; Validation, X.L.; Visualization, J.L.; Writing—original draft, H.W.; Writing—review and editing, R.H. All authors have read and agreed to the published version of the manuscript.

Funding

This work is supported by the Guangxi Science and Technology base and talent program (NO. AD20159012) and the Guangxi Natural Science Foundation (NO. 2018GXNSFBA050022).

Data Availability Statement

The data presented in this study are available on request from the corresponding author.

Conflicts of Interest

The authors declare no conflicts of interest.

Abbreviations

Q a Sensible cooling load of air conditioning system (W)
Q f Cooling capacity of radiant cooling system (W)
Q Cooling capacity of combined system, (W) (subscript tf denotes that the cooling capacity of combined system when cooling surface is singly changed, and subscript tsa denotes that the cooling capacity when only supply air temperature is changed.)
t s a Supply air temperature of air conditioning system (°C)
t f Cooling surface temperature (°C)
f c l Area coefficient of clothing (clo)
h Surface heat transfer coefficient (W/(m2·K))
h c Convective heat transfer coefficient (W/(m2·K))
h r Radiation heat transfer coefficient (W/(m2·K))
MMetabolism of the human body (W/m2)
P a Partial pressure of water vapor around human body (kPa)
WMechanical power of the human body to the outside world (W)
AArea (m2), (subscript f denotes that cooling surface)
RThe ratio of the heat exchange on radiant floor surface to the total space heat exchange (%)
RHRelative Humidity (%)
t a Air temperature (°C)
t a 1.1 The average air temperature at the height of 1.1 m (°C)
t c l Outer surface temperature of clothes (°C)
t g Black ball temperature (°C)
t m r t Mean radiant temperature (°C)
DBlack sphere radius (m)
GMess air flow rate (kg/s)
t o p The operative temperature (°C)
VAir speed (testing value) (m/s)
ε Emissivity of black ball
iThe subscript of a variable under given condition
PMVPredicted mean vote
PPDPredicted percentage dissatisfied
CFDComputational fluid dynamics
IEQIndoor environmental quality
POEPost-evaluation
HVACHeating, Ventilation and Air Conditioning
IAQIndoor air quality
TSVThermal sensation vote
TCVThermal comfort vote
TPVThermal preference vote
MRTMean radiant temperature

References

  1. Zhao, K.; Liu, X.-H.; Jiang, Y. Application of Radiant Floor Cooling in Large Space Buildings—A Review. Renew. Sustain. Energy Rev. 2016, 55, 1083–1096. [Google Scholar] [CrossRef]
  2. Charara, J.; Ghaddar, N.; Ghali, K.; Zoughaib, A.; Simonetti, M. Cascaded Liquid Desiccant System for Humidity Control in Space Conditioned by Cooled Membrane Ceiling and Displacement Ventilation. Energy Convers. Manag. 2019, 195, 1212–1226. [Google Scholar] [CrossRef]
  3. Zhang, T.; Liu, X.; Zhang, L.; Jiang, J.; Zhou, M.; Jiang, Y. Performance Analysis of the Air-Conditioning System in Xi’an Xianyang International Airport. Energy Build. 2013, 59, 11–20. [Google Scholar] [CrossRef]
  4. Jiang, S.; Xu, H.; Ma, Y.; Li, B.; Li, L.; Cong, X.; Feng, T. Application analysis of capillary air conditioning system in terminal T3 of Wuhan Tianhe Airport. HV&AC 2022, 10, 1–9. (In Chinese) [Google Scholar] [CrossRef]
  5. Wang, Z.; Zhao, H.; Lin, B.; Zhu, Y.; Ouyang, Q.; Yu, J. Investigation of Indoor Environment Quality of Chinese Large-Hub Airport Terminal Buildings through Longitudinal Field Measurement and Subjective Survey. Build. Environ. 2015, 94, 593–605. [Google Scholar] [CrossRef]
  6. Liu, J.; Yu, N.; Bo, L.; Rong, X.; Yang, L. Research on indoor environment for the terminal 1 of Chengdu Shuangliu international airport. In Proceedings of the Eleventh International IBPSA Conference, Glasgow, UK, 27–30 July 2009; pp. 2138–2145. [Google Scholar]
  7. Geng, Y.; Yu, J.; Lin, B.; Huang, Y.; Pan, J.; Chen, G. Research on Indoor Environmental Quality and Passenger Satisfaction of Large Terminal Buildings in China. HV&AC 2016, 46, 60–63. (In Chinese) [Google Scholar]
  8. Geng, Y.; Yu, J.; Lin, B.; Wang, Z.; Huang, Y. Impact of Individual IEQ Factors on Passengers’ Overall Satisfaction in Chinese Airport Terminals. Build. Environ. 2017, 112, 241–249. [Google Scholar] [CrossRef]
  9. Jia, X.; Cao, B.; Zhu, Y. A Climate Chamber Study on Subjective and Physiological Responses of Airport Passengers from Walking to a Sedentary Status in Summer. Build. Environ. 2022, 207, 108547. [Google Scholar] [CrossRef]
  10. Kotopouleas, A.; Nikolopoulou, M. Evaluation of Comfort Conditions in Airport Terminal Buildings. Build. Environ. 2018, 130, 162–178. [Google Scholar] [CrossRef]
  11. Kotopouleas, A.; Nikolopoulou, M. Thermal Comfort Conditions in Airport Terminals: Indoor or Transition Spaces? Build. Environ. 2016, 99, 184–199. [Google Scholar] [CrossRef]
  12. Pichatwatana, K.; Wang, F.; Roaf, S.; Anunnathapong, M. An Integrative Approach for Indoor Environment Quality Assessment of Large Glazed Air-Conditioned Airport Terminal in the Tropics. Energy Build. 2017, 148, 37–55. [Google Scholar] [CrossRef]
  13. Pichatwatana, K.; Wang, F.; Roaf, S. Thermal Comfort Evaluation of an Existing Glazed Airport Terminal in Thailand. Proc. Inst. Civ. Eng. Eng. Sustain. 2019, 172, 184–197. [Google Scholar] [CrossRef]
  14. Ramis, J.E.; Santos, E.A.D. The Impact of Thermal Comfort in the Perceived Level of Service and Energy Costs of Three Brazilian Airports. J. Transp. Lit. 2013, 7, 192–206. [Google Scholar] [CrossRef]
  15. Liu, X.; Zhang, T.; Liu, X.; Li, L.; Lin, L.; Jiang, Y. Energy Saving Potential for Space Heating in Chinese Airport Terminals: The Impact of Air Infiltration. Energy 2021, 215, 119175. [Google Scholar] [CrossRef]
  16. Abdallah, A.S.H.; Makram, A.; Abdel-Azim Nayel, M. Energy Audit and Evaluation of Indoor Environment Condition inside Assiut International Airport Terminal Building, Egypt. Ain Shams Eng. J. 2021, 12, 3241–3253. [Google Scholar] [CrossRef]
  17. Corgnati, S.P.; Perino, M.; Fracastoro, G.V.; Nielsen, P.V. Experimental and numerical analysis of air and radiant cooling systems in offices. Build. Environ. 2009, 44, 801–806. [Google Scholar] [CrossRef]
  18. Lim, J.H.; Song, J.H.; Song, S.Y. Development of operational guidelines for thermally activated building system according to heating and cooling load characteristics. Appl. Energy 2014, 126, 123–135. [Google Scholar] [CrossRef]
  19. Zhou, M. Energy saving technology for Terminal 3 of Xi’an Xianyang International Airport. Build. Technol. 2014, 10, 65–69. (In Chinese) [Google Scholar] [CrossRef]
  20. Congedo, P.M.; Baglivo, C.; Agostino, D.; Mazzeo, D. The impact of climate change on air source heat pumps. Energy Convers. Manag. 2023, 276, 116554. [Google Scholar] [CrossRef]
  21. Hu, R.; Sun, S.; Liang, J.; Zhou, Z.; Yin, Y. A Review of Studies on Heat Transfer in Buildings with Radiant Cooling Systems. Buildings 2023, 13, 1994. [Google Scholar] [CrossRef]
  22. Hu, R.; Li, X.; Liang, J.; Wang, H.; Liu, G. Field Study on Cooling Performance of a Heat Recovery Ground Source Heat Pump System Coupled with Thermally Activated Building Systems (TABSs). Energy Convers. Manag. 2022, 262, 115678. [Google Scholar] [CrossRef]
  23. Nikolayer, V.S. Physical principles and state-of-the-art of modeling of the pulsating heat pipe: A review. Appl. Therm. Eng. 2021, 195, 117111. [Google Scholar] [CrossRef]
  24. Der, O.; Alqahani, A.A.; Marengo, M.; Bertola, V. Characterization of polypropylene pulsating heat stripes: Effects of orientation, heat transfer fluid, and loop geometry. Appl. Therm. Eng. 2021, 184, 116304. [Google Scholar] [CrossRef]
  25. ASHRAE. ASHRAE Handbook—Fundamentals; American Society of Heating, Refrigeration and Air Conditioning Engineers, Inc.: Altanta, GA, USA, 2013. [Google Scholar]
  26. Chida, C.; Shen, B.; Chu, Z. Convection and radiation heat transfer coefficients on the surface of the human body. Build. Technol. Res. Intell. 1978, 1, 90–99. (In Chinese) [Google Scholar]
  27. GB50736-2012; Design Code for Heating Ventilation and Air Conditioning of Civil Buildings. Ministry of Housing and Urban-Rural Development of the People’s Republic of China: Beijing, China, 2012.
  28. Tartarini, F.; Schiavon, S.; Cheung, T.; Hoyt, T. CBE Thermal Comfort Tool: Online Tool for Thermal Comfort Calculations and Visualizations. Available online: https://comfort.cbe.berkeley.edu/ (accessed on 20 January 2024).
  29. Han, Z.; Wang, J.; Lan, X. FLUENT: Examples and Applications of Fluid Engineering Simulation Calculation; Beijing Institute of Technology Press: Beijing, China, 2004; ISBN 9787231343212. [Google Scholar]
  30. Nie, J.; Wang, J.; Jia, J.; Yan, S.; Su, H.; Gao, H. Research on the Influence of the Different Radiation Model on Numerical Simulation of Solar Chimney. J. Sol. Energy 2022, 43, 100–105. [Google Scholar] [CrossRef]
  31. JGJ142-2012; Technical Specification for Radiant Heating and Cooling. China Architecture & Building Press: Beijing, China, 2013.
  32. Shin, D.U.; Shin, M.S.; Rhee, K.N.; Ryu, S.R.; Jeong, C.H.; Yeo, M.S.; Kim, K.W. The thermal output evaluation of radiant heating panels by experiment. Build. Serv. Eng. Res. Technol. 2015, 36, 580–595. [Google Scholar] [CrossRef]
  33. Zhang, L.; Liu, X.-H.; Jiang, Y. Experimental Evaluation of a Suspended Metal Ceiling Radiant Panel with Inclined Fins. Energy Build. 2013, 62, 522–529. [Google Scholar] [CrossRef]
  34. Ren, J.; Liu, J.; Zhou, S.; Kim, M.K.; Miao, J. Developing a collaborative control strategy of a combined radiant floor cooling and ventilation system: A PMV-based model. J. Build. Eng. 2022, 54, 104648. [Google Scholar] [CrossRef]
  35. Zhao, K.; Liu, X.-H.; Jiang, Y. On-Site Measured Performance of a Radiant Floor Cooling/Heating System in Xi’an Xianyang International Airport. Sol. Energy 2014, 108, 274–286. [Google Scholar] [CrossRef]
Figure 1. The process of heat transfer and cooling load formation in a space with a combined radiant cooling and air conditioning system [21].
Buildings 14 01355 g001
Figure 2. Program for optimizing the control strategy.
Buildings 14 01355 g002
Figure 3. Measurement area and testing point location. (a) Interior view of terminal 3. (b) Distribution of testing points on 22 July 2021.
Buildings 14 01355 g003
Figure 4. Outdoor meteorological parameters. (a) Air temperature. (b) Relative humidity.
Buildings 14 01355 g004
Figure 5. Air temperature at 1.1 m height. (a) Air temperature over time. (b) Air temperature distribution.
Buildings 14 01355 g005
Figure 6. Relative humidity at 1.1 m height.
Buildings 14 01355 g006
Figure 7. (ac) Vertical air temperature distribution at 14:00 at points 4, 6 and 8. (d) Floor temperature, curtain wall temperature, and roof temperature.
Buildings 14 01355 g007
Figure 8. Mean radiant temperature and black bulb temperature. (a) Mean radiant temperature. (b) Average black bulb temperature.
Buildings 14 01355 g008
Figure 9. PMV values. (a) PMV values at different testing times. (b) Proportion of PMV under different weather conditions.
Buildings 14 01355 g009
Figure 10. PMV vs. subjective feltings voting. (a) Average PMV and TSV values over time. (b) PMV verified by subjective feltings voting.
Buildings 14 01355 g010
Figure 11. Subjective voting results. (a) TSV voting results. (b) TCV voting results. (c) TPV voting results.
Buildings 14 01355 g011
Figure 12. Simulation model.
Buildings 14 01355 g012
Figure 13. Verified simulation results. (a) Air temperature. (b) Relative humidity. (c) Mean radiation temperature.
Buildings 14 01355 g013
Figure 14. Results of the scheme by changing air supply temperature. (a) Air temperature. (b) Mean radiation temperature. (c) PMV. (d) PPD.
Buildings 14 01355 g014
Figure 15. Results of the scheme by changing floor surface temperature. (a) Air temperature. (b) Mean radiation temperature. (c) PMV. (d) PPD.
Buildings 14 01355 g015
Figure 16. Relationship between the supply air temperature/floor temperature, PMV, and heat exchange under various conditions.
Buildings 14 01355 g016
Figure 17. Heat exchange of displacement ventilation and floor cooling under various conditions.
Buildings 14 01355 g017
Figure 18. Surface heat transfer coefficient of the cooling floor.
Buildings 14 01355 g018
Figure 19. Environmental parameters of point 1 and point 8 under different cases in simulation. (a) Air temperature. (b) PMV.
Buildings 14 01355 g019
Figure 20. (a) The correlations of PMV, floor surface temperature and supply air temperature. (b) The correlations of cooling capacity, floor surface temperature and supply air temperature.
Buildings 14 01355 g020
Figure 21. Simulation comparison of indoor environment in cases 14 and 15. (a) Case 14 t a distribution at 1.1 m, (b) case 15 t a distribution at 1.1 m, (c) case 14 MRT distribution at 1.1 m, (d) case 15 MRT distribution at 1.1 m, (e) case 14 t a distribution in vertical height, (f) case 15 t a distribution in vertical height, (g) case 14 PMV distribution at 1.1 m, (h) case 15 PMV distribution at 1.1 m.
Buildings 14 01355 g021
Table 1. Parameters of measuring instruments.
InstrumentParameterAccuracyRange
Temperature and humidity self-recorder RC-4HC (Elitech, San Jose, CA, USA)Ta (°C)
RH (%)
±0.5 °C−30–60°C/0–100 RH
Black Ball Temperature Recorder AZ-8778 (AZ Instrument Corp., Taichung City, Taiwan)Tg (°C)±0.6 °C0–30 m/s
Anemometer AR866A (METER Group, Pullman, WA)V (m/s)0.01 m/s0–50 °C
Thermometric F566-2 (Fluke, Everett, WA, USA)Ta (°C) (0 m)±1%−18–1500 °C
Infrared Thermal Imager Unitech UTi206B (Uni-Trend Technology Co., Dongguan, China)Curtain wall temperature, roof temperature and other heat source temperature±2 °C/±2%−20–150 °C
Table 2. Evaluation grade of subjective felting.
ScaleTSVTCVTPV
+3Hot
+2Warm
+1Slightly warm Warmer
0NeutralComfortableNo change
−1Slightly coolSlightly uncomfortableCooler
−2CoolUncomfortable
−3ColdVery uncomfortable
Table 3. Information regarding test-takers.
Test-Taker InformationNumber of People (July 2021/August 2022)
GenderMale56/53
Female44/47
IdentityStaff12/10
Passenger88/90
Age<184/2
19–3025/30
31–4532/40
45–6027/25
>6012/3
Table 4. Module geometric dimensions and boundary conditions for simulation.
ItemSpecificationsValueUnit
Seats2.25 × 0.75 × 1.1 m165W
Computer1 × 0.1 × 0.5 m40°C
Illuminated screen 112.5 × 0.1 × 4.8 m38°C
Illuminated screen 29 × 0.2 × 3.8 m40°C
heat source1.1 × 0.63 × 1.64 m37°C
Elevator 110.5 × 4.4 × 5.5 m35°C
Elevator 210.5 × 2.2 × 5.5 m34°C
Self-service vending machine6.75 × 1.3 × 2.4 m35°C
Displacement vent1.8 × 1.05 m, 0.6 × 1.05 m25, 0.3°C, m/s
Daylighting zone10 × 1.5 m, 30.25 × 1.5 m48.6, 2.7°C, W/m2·K
Floor114 × 39.75 × 0.02 m26, 0.16°C, W/m2·K
Insulating alloy plate10 × 17.63 m, 30.25 × 17.63 m38.6, 0.55°C, W/m2·K
Glass curtain wall (Lower part)39.75 × 5.83 m32, 2.3°C, W/m2·K
Glass curtain wall (Middle part)39.75 × 5.83 m35, 2.3°C, W/m2·K
Glass curtain wall
(Upper part)
39.75 × 5.83 m39, 2.3°C, W/m2·K
Table 5. Schemes by altering supply air temperature or floor surface temperature.
Cases1234567
Supply air temperature (°C)24232221201918
Floor surface temperature (°C)26262626262626
Cases891011121314
Supply air temperature (°C)25252525252525
Floor surface temperature (°C)25242322212019
Table 6. Statistical data of floor temperature and its heat transfer under various cases.
Condition0891011121314
Floor temperature tf(°C)2625242322212019
Mean air temperature ta(°C)28.0127.9227.8227.7327.6327.5427.4527.36
Mean radiant temperature tr(°C)30.3129.9429.5829.2228.8628.5128.1527.8
Floor heat flux density qr(W/m2)51.966569.9578.7987.5196.13104.62112.98
Floor cooling ratio Rf(%)34.740.542.946.14951.556.357.9
Operative temperature top(1.1)(°C)28.8128.7428.5728.4228.2328.0427.8627.61
top(1.1)tf(°C)2.813.744.575.426.237.047.868.61
Disclaimer/Publisher’s Note: The statements, opinions and data contained in all publications are solely those of the individual author(s) and contributor(s) and not of MDPI and/or the editor(s). MDPI and/or the editor(s) disclaim responsibility for any injury to people or property resulting from any ideas, methods, instructions or products referred to in the content.

