Article

Exploring the Impact of Urban Morphology on Building Energy Consumption and Outdoor Comfort: A Comparative Study in Hot-Humid Climates

1
State Key Laboratory of Subtropical Building and Urban Science, South China University of Technology, Guangzhou 510641, China
2
School of Architecture, South China University of Technology, Guangzhou 510641, China
3
Architectural Design and Research Institute Co., Ltd., South China University of Technology, Guangzhou 510641, China
4
School of Architecture and Urban Planning, Beijing University of Civil Engineering and Architecture, Beijing 100044, China
*
Authors to whom correspondence should be addressed.
Buildings 2024, 14(5), 1381; https://doi.org/10.3390/buildings14051381
Submission received: 2 April 2024 / Revised: 3 May 2024 / Accepted: 7 May 2024 / Published: 11 May 2024

Abstract

:
Research simultaneously examining building energy consumption and outdoor thermal comfort within urban environments remains limited. Few studies have delved into the sensitivity of design parameters based on building energy consumption and outdoor thermal comfort. The purpose of this study is to investigate the correlations between urban morphological design parameters and performance indicators, focusing on building energy consumption and outdoor thermal comfort (UTCI), across different urban block layouts in hot-humid regions, like Guangzhou. By establishing six fundamental morphological models—three individual unit layouts and three group layouts—the research explores both control and descriptive parameters through extensive simulation studies. Scatter plot visualizations provide insights into the impacts of various design parameters on energy consumption and UTCI, facilitating a comprehensive analysis of trends and quantitative relationships. Additionally, the study conducts sensitivity analyses on design parameters under different layout conditions to highlight their influences on target performance indicators. The findings reveal common trends, such as the significant impacts of plan dimensions and the Floor Area Ratio (FAR) on energy efficiency and outdoor comfort, as well as differential patterns, such as the varying sensitivities of the Shape Factor (S/V) and the Sky View Factor (SVF), across individual and collective layouts. Ultimately, this study offers a nuanced understanding of urban block morphology’s role in creating sustainable, comfortable, and energy-efficient urban environments, providing valuable guidelines for urban form design in hot-humid climates.

1. Introduction

More than half of the global population lives in cities [1], and with the current prevailing population growth and urbanization rate, by 2030, the global urban area will triple that at the beginning of the 20th century [2]. Urban dwellers keep pursuing more comfortable indoor and outdoor environments, which will exacerbate energy consumption and carbon emissions in cities [3,4]. Urban morphology, which encompasses the study of the physical form and structure of cities, has garnered increasing attention in recent years due to its profound impact on various aspects of urban sustainability and climate change [5,6,7,8,9]. Further research underscores that urban morphology exerts a considerable effect on public perceptions and overall quality of life, which contribute not only to enhanced thermal comfort but also to improved psychological health [10,11] and social interactions [12,13,14,15]. Consequently, thoughtful urban planning can generate substantial benefits from both technical and social perspectives.
As a major component of urban planning, urban blocks are responsible for daily transportation, outdoor sports, leisure activities, and other functions. The outdoor thermal comfort in street canyons has been widely studied across different climates, and different results are obtained in different climates regions. Sun et al. [16] focus on the influence of urban morphology on pedestrian outdoor thermal comfort in the severe cold region of northeast China; shallow and medium canyons (0.5 < H/W < 1.5) are more favorable, and the optimum streets are near the N–S orientation. This trend evidently differs from moderate or tropical regions, as they require more shading from streets to enhance thermal comfort during hot summers [17,18,19,20].
Some recent studies indicate that urban morphology significantly influences adaptation to the thermal environment or urban microclimate in hot and humid climates. An analysis can be conducted on urban morphologies in relation to global warming, considering factors, such as street canyon configurations, built structures, finishing materials, and urban greenery as modifiers influencing urban geometry [21,22,23]. These findings will facilitate the formulation of urban planning strategies for effectively reducing thermal threats, thereby supporting the healthy and sustainable development of high-density urban cities in hot and humid regions.
Numerous studies have investigated the relationship between urban form and various performance indicators, such as energy efficiency [24], daylight availability, and solar energy potential. In practice, urban planning conditions are variable, and thus, relevant studies have applied both realistic and generic models. The FAR, H/W, and SVF, are often used to characterize real cases [25,26]. Some studies have used satellite models on the city scale to generate analytical models, making it difficult to comprehensively reflect the energy performance and thermal comfort under different urban morphologies [27,28,29]. However, only a few general conclusions can be obtained owing to the complexity of real cases. By contrast, generic models can provide basic and universal insights into the processes in real urban areas [30,31]. For example, to examine the relationship between urban block typology and building energy use efficiency in the context of the tropical high-density city Singapore, J. Zhang et al. conducted simulations on thirty generic urban block cases representing a variety of urban forms to analyze the relationship between urban block typology and building energy use efficiency in the tropical high-density city of Singapore [32]. In addition, some research uniformly arranges patterns such as 3 × 3 tic-tac-toe grids or 5 × 5 twenty-five square grids, using this idealized urban model to fit real-world urban scenarios. Among them, scholars like Natanian J. et al. have studied the correlation among energy consumption, daylight autonomy, and morphological parameters in five typical neighborhood morphologies in the Mediterranean. The results showed that the performance of each type varied greatly under different design and density conditions [33,34]. The above research proves that the ideal models of urban blocks can accurately reflect the performance characteristics of real urban morphology.
A comprehensive analysis of the existing literature reveals that there are still several topics in this field that merit further research and analysis: (1) while numerous studies have investigated the relationship between urban morphology and outdoor thermal comfort [35,36,37], research simultaneously examining building energy consumption and outdoor thermal comfort within urban environments remains limited [38]. Many of these studies have focused on the ameliorating effects of the urban greenery canopy, as an adjunct to the building morphology, on the urban thermal environment [39]. Although trees, as pedestrian-scale solar radiation obstructions, have been identified as a crucial factor influencing outdoor thermal comfort in cities [40,41], the thermal environment is also highly dependent on urban spatial form factors, such as the sky view factor and building area ratio [42,43]. (2) Few studies have delved into the sensitivity of design parameters, i.e., the impact of changes in design parameters on building energy consumption and outdoor thermal comfort [44,45,46]. These limitations restrict the application of research results and findings in practical urban planning and architectural design. (3) Existing studies predominantly focus on specific regions or new urban blocks when selecting building forms, resulting in relatively uniform assumed building forms with limited control parameters [47,48,49,50,51].
To overcome the limitations in current urban morphology research and offer more flexible guidance for urban planning, this study starts by scrutinizing various representative block morphologies in Guangzhou, a city characterized by its humid subtropical climate. The objective is to generalize typical urban block morphological prototypes, establish more universally applicable ideal urban block research models, and statistically explore the correlation between control and descriptive parameters in urban design and building performance indicators. Ultimately, this study aims to offer insights to guide urban design practices.
This study aims to investigate the correlation between urban morphological design parameters and performance indicators, focusing on building energy consumption and outdoor thermal comfort across different urban block layouts in the urban area of Guangzhou. The main objectives of this research are as follows:
(1)
To establish six fundamental morphological models, including three individual unit layouts and three group layouts, and explore their control and descriptive parameters through extensive simulation data.
(2)
To visualize the impact of various design parameters on energy consumption and UTCI using scatter plots, facilitating a comprehensive analysis of trends and quantitative relationships.
(3)
To conduct sensitivity analysis on design parameters under different layout conditions, highlighting their influence on target performance indicators.
The remainder of this paper is structured as follows: Section 2 describes the research methodology, including model establishment, simulation setup, and data analysis techniques. Section 3 presents the results, focusing on the impact of design parameters on energy consumption and UTCI, as well as the sensitivity analysis of design parameters across different layouts. Section 4 discusses the findings, their implications for urban form design in hot-humid climates, and the limitations of the study. Finally, Section 5 concludes the paper and provides recommendations for future research.

2. Methodology

2.1. Research Framework

To develop and test typical research models for an analysis of the correlation between design parameters and performance indicators in the context of Guangzhou, this study used a complete analytical workflow (Figure 1):
Firstly, a satellite map combined with urban GIS data was used to obtain six typical research models; then, Rhinoceros3D and Grasshopper [52] were used to set design parameters and scenario settings, followed by the use of the DSE plugin [53] for Latin Hypercube sampling. The software simulations of the research involve simulating EUI with EnergyPlus [54,55] and simulating UTCI with the Ladybug & Honeybee plugin [56]. Finally, scatter matrix analysis was established through Matlab [57] to obtain the corresponding relationships between design parameters and performance indicators, and sensitivity analysis was conducted using Salib [58] through GH_CPython [59] to compare and analyze the descriptive parameters of the six typical models.

2.2. Research Model on the Block Scale

The aim of this study is to investigate the influence of urban block morphology design parameters on outdoor thermal comfort and building energy consumption. In real urban design projects, there is considerable flexibility in landscape design at the ground level, such as the distribution of lawns and shade trees. For this study, the ideal urban morphology research model assumes the ground layer to be in its least favorable condition, which is cement paving. By focusing on this least favorable scenario, the impact of later landscape design and other factors is excluded, allowing for a more precise examination of the relationship between urban morphology and thermal comfort.

2.2.1. Selection of Typical Block Morphologies in Hot-Humid Regions

In the urban area of Guangzhou, a hot-humid region, in conjunction with Baidu Maps satellite imagery, a thorough search was conducted across the entire city’s business and office districts. Several typical block morphologies were ultimately selected as representatives for the subsequent analysis, as shown in Table 1.

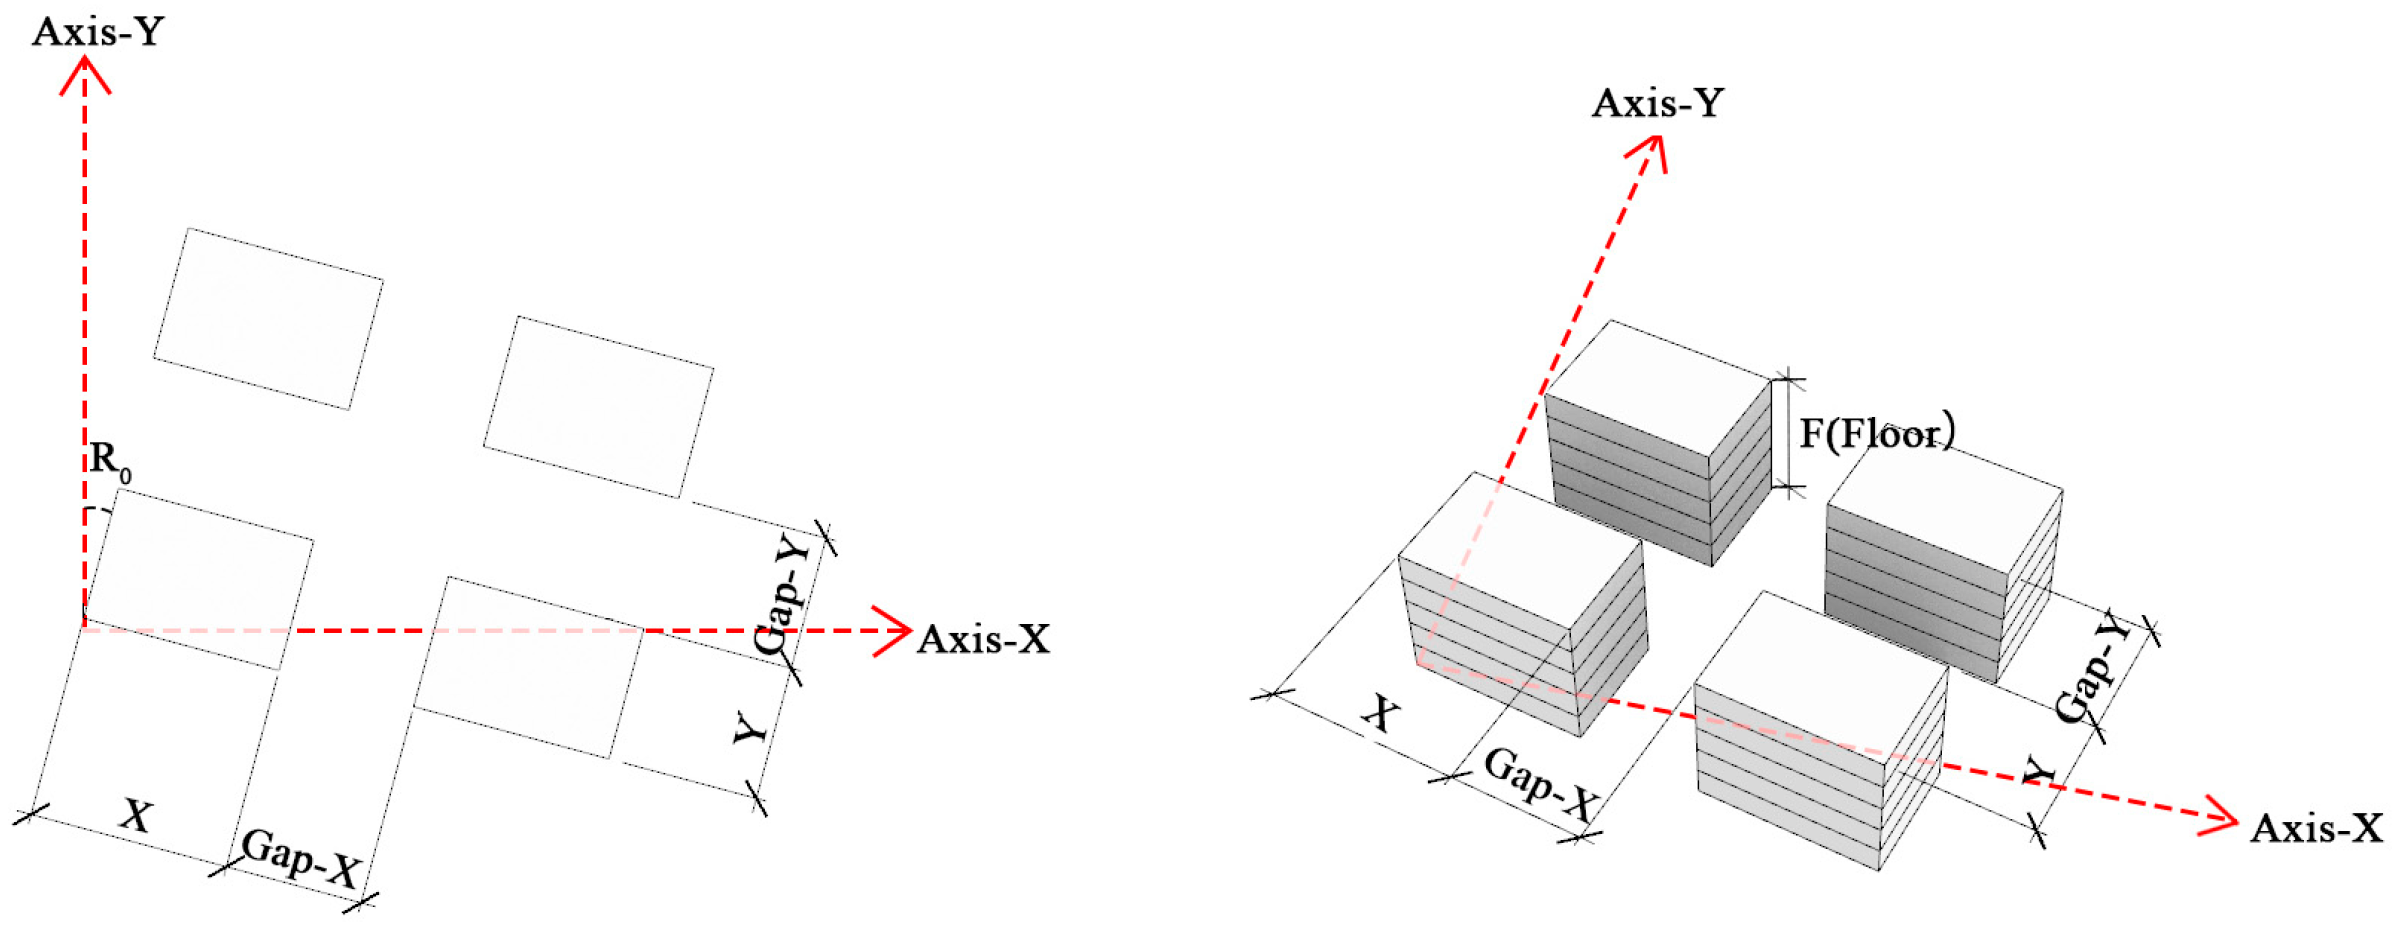
2.2.2. Urban Morphology Design Parameters

The study differentiates urban morphology design parameters into two types: control parameters and descriptive parameters. Control parameters refer to determinate parameters, such as the three-dimensional dimensions of buildings and the spacing between buildings, which designers can directly change to control urban morphology. Descriptive parameters, on the other hand, refer to parameters like FAR and SVF that architects can only indirectly adjust through control parameters. For homogeneously distributed building units, the correlation between urban morphology control parameters and performance indicators can be explored; however, for the complex urban blocks, the diversity of buildings leads to a surge in the number of control parameters, so the correlation between urban morphology and environmental performance or energy consumption can only be further explored through descriptive parameters.

Control Parameters

Different monolithic-shape-generation methods and group combination rules correspond to different morphological control parameters. For typical homogeneous urban block masses formed by arrays of cubic building volumes (as shown in Figure 2), the control parameters according to the illustration are as follows: Building X-direction length (X, the east-west direction), Building Y-direction width (Y, the north-south direction), Number of building floors (F), Building Y-axis orientation angle (Ro), Building X-direction spacing (Gap-X), Building Y-direction spacing (Gap-Y).

Descriptive Parameters

Descriptive parameters are overall indicators describing the distribution of building forms in a certain urban area. The parameters selected in this section are as follows: FAR, Density, S/V, H/W, SVF.

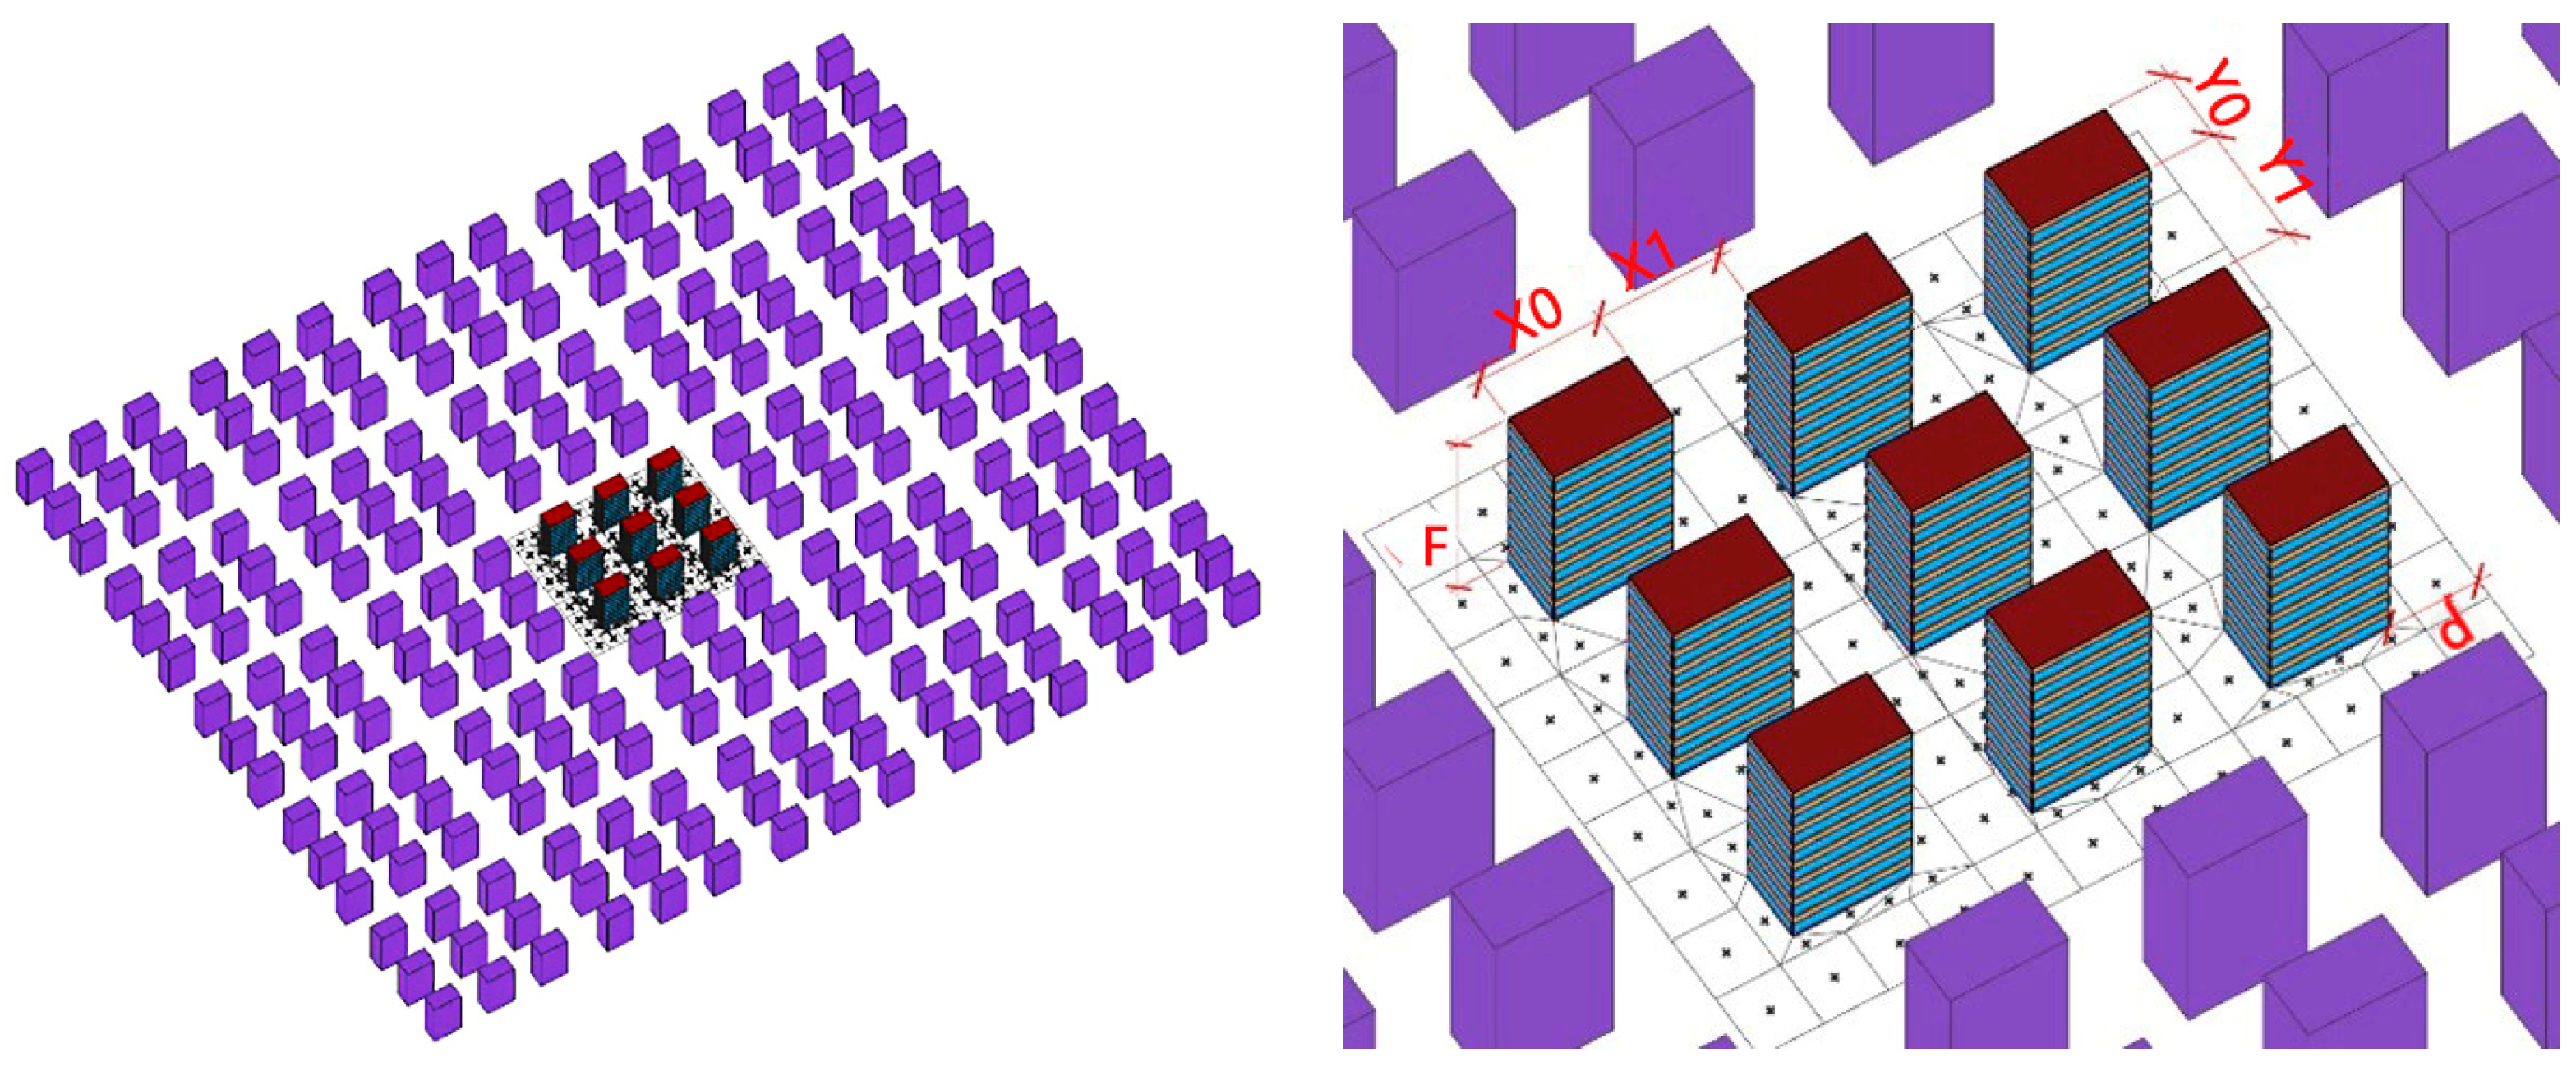
2.2.3. Establishment of Six Typical Research Models

Type 1–3: Individual Building-Models

The point style, enclosed style, and semi-enclosed style were selected as research prototypes, and the definitions of the three individual building models are as follows:
  • Type 1 Single point (strip) building model
This model fits the box-shaped office buildings commonly found in cities. Adjustments to the length and width conditions allow for the transformation between point and bar-shaped building forms, and hence, they are discussed together. Based on statistical data from existing common office building designs by design institutes, the model’s floor height is uniformly set at 4.5 m, X-direction length as X = 30~100 m, Y-direction length as Y = 20~30 m, number of floors as F = 3~22, X-direction spacing Gap—X = 20~60 m, Y-direction spacing Gap—Y = 20~60 m, and the entire group of buildings’ Y-direction angle with north as Rotate = 0~90° (Figure 3).
2.
Type 2 Enclosed building model
This model fits the “square-shaped” enclosed office buildings commonly found in cities. The model’s floor height is uniformly set at 4.5 m, with a volume width of W = 12~25 m, inner courtyard X-direction length of X = 10~25 m, Y-direction length of Y = 10~50 m, number of floors as F = 3~22, X-direction spacing Gap-X = 20~60 m, Y-direction spacing Gap-Y = 20~60 m, and the entire group of buildings’ Y-direction angle with north as Rotate = 0~90° (Figure 4).
3.
Type 3 Semi-enclosed building model
This study model fits semi-enclosed office buildings commonly found in cities. The model’s floor height is uniformly set at 4.5 m, with a volume width of W = 12~25 m, inner courtyard X-direction length of X = 10~25 m, Y-direction length of Y = 10~50 m, number of floors as F = 3~22, X-direction spacing Gap-X = 20~60 m, Y-direction spacing Gap-Y = 20~60 m, and the entire group of buildings’ Y-direction angle with north as Rotate = 0~90° (Figure 5).

Type 4–6: Collective building models

The multiple-stripes style, four buildings arranged at the corners and nine buildings arranged in the matrix, were selected as research prototypes, and the definitions of the three collective building-models are as follows:
  • Type 4—Blocks composed of two to four strip buildings arranged in rows.
This type of block includes two to four row-column buildings, with lengths of X = 10~50 m, widths of W = 12~25 m, spacing between bar-shaped buildings Y = 10~50 m, distance between the plot boundary and buildings d = 5~20 m, and building floors Floor = 3~22; the entire group of buildings’ Y-direction angle with north is set to Rotate = 0~90° (Figure 6). The building group being multi-story or high-rise, with FAR of more than 4.0, does not match real-world situations, and thus, it is automatically ignored in the building generation process, with the same below.
2.
Type 5—Blocks composed of four buildings arranged at the corners.
This type of block contains four buildings, with lengths of X0 = 20~50 m, widths Y0 = 12~50 m, X-direction building spacing X1 = 10~30 m, Y-direction spacing Y1 = 10~30 m, distance between the plot boundary and buildings d = 5 to 20, and building floors F = 3~22; the entire group of buildings’ Y-direction angle with north is set to Rotate = 0~90° (Figure 7).
3.
Type 6—Blocks composed of nine buildings arranged in a matrix.
This type of block contains nine buildings, similar to the previous scenario, with each building unit within the block having lengths of X0 = 20~50 m, widths Y0 = 12~50 m, X-direction building spacing X1 = 10~30 m, Y-direction spacing Y1 = 10~30 m, distance between the plot boundary and buildings d = 5~20 m, and building floors F = 3~22; the entire group of buildings’ Y-direction angle with north is set to Rotate = 0~90° (Figure 8).

2.3. Scenario Settings and Sampling Method

Each of the six building research models is replicated into a 5 × 5 building matrix arrangement, with the central building being the subject of study. Its energy consumption calculation is based on the air conditioning energy consumption per unit area of the entire building (including annual, cooling season, and peak week consumption); the calculation time for outdoor thermal comfort is based on 168 h of the hottest week in a typical meteorological year. The sampling points for pedestrian height at intervals of 20 m within a ring around the building are selected to calculate the average UTCI value, with the outdoor area limited to the median line between the building under study and the four adjacent buildings.
Furthermore, based on the survey of current office buildings, the WWR of buildings in the study is uniformly set at 0.55. Key parameters, such as the air conditioning operation mode and personnel activity patterns, refer to the settings for public or office buildings in hot summer and warm winter regions in the standard “General code for energy efficiency and renewable energy application in buildings”, Appendices C.0.6-1~C.0.6-8 [60]. Thermal parameters for different building components refer to the common settings for public buildings in Guangzhou, as shown in Appendix A Table A1.
The sampling procedure for the building models employs the Latin Hypercube Sampling method [61,62,63,64], which is widely accepted in the academic community. As a stratified sampling method, it ensures uniformity in the sampled parameters while covering a broader range of parameter intervals.

2.4. Sensitivity Analysis Method

Sensitivity analysis is a statistical data analysis method currently applied in the field of architecture to explore the impact of various design variables or their interactions on building performance indicators [65]. The research methods for the parameter sensitivity analysis are mainly divided into two categories: local sensitivity analysis and global sensitivity analysis. This paper employs the RBD-FAST algorithm for global sensitivity analysis.
The first-order sensitivity of a parameter is calculated by computing the contribution of the variance caused by the specified parameter to the total variance of the model output. The conceptual expression is as follows:
v a r x [ E ( Y | X ) ] v a r ( Y )  
where Y is the model output variable, X represents the parameter to be analyzed, E(Y|X) is the conditional expectation of Y given X, and var is the variance expression, with varx referring to the entire range of values for X.
The numerical model can be simply described as y = f(X), where y is the model output, f is the model operator, and X is the input parameter, with X = (x1, x2, …, xn), n being the number of parameters. Assume all input parameters can form a unit cube:
K n = ( X | 0 x i   1 ,   i = 1 ,   2 , , n )
Assuming that the input parameter X has a probability distribution P(X) = P (x1, x2, …, xn), then any order moment of y can be expressed as follows:
y ( r ) = K n   f r ( x 1 , x 2 , , x n ) × P   ( x 1 , x 2 , , x n )   d X
Using Fourier decomposition, the variation of parameters in n-dimensional space can be mapped to one-dimensional space. If there exists a transformation operator G, the following transformation can be established:
x i s = G i s i n ω i s , i = 1 ,   2 , ,   n  
where s is a scalar with values in [−∞, +∞], Gi is the transformation operator, and ωi is the frequency corresponding to each parameter.
Given the characteristics of the sine function, for any positive integer frequency ωi, s taking values in [−π, π] or [0, 2π] can display the full periodicity, allowing the model output y to be expanded into a Fourier series form:
y = f X = f x 1 , x 2 , , x n = f s = j = j = + A j cos j s + B j sin j s
The corresponding Fourier coefficients Aj and Bj can be obtained by definition:
A j = 1 π π π f ( s ) cos j s d s B j = 1 π π π f ( s ) sin j s d s
where j is a positive integer frequency j∈Z = {1, 2, …, +∞}. For numerical models, Fourier coefficients can be obtained through discrete uniform sampling, with S sampled as follows in the experiment:
S = { s 1 , s 2 , , s N } , s j = π + π N + 2 π N j 1 j = 1 ,   2 ,     ,   N
In the formula, N is the number of samples. Defining the modulus of the Fourier series as Λ j = 1 / 2 ( A j 2 + B j 2 ) ( j     Z ) , then the variance (Vi) corresponding to each parameter xi can be expressed as follows:
V i = p Z   Λ p ω i
where pωi≤(N − 1)/2. The total variance V of the Fourier series can be expressed as follows:
V i = j Z   Λ j
The first-order sensitivity Si for parameter xi is as follows:
S i = V i V
From the principles of Fourier decomposition, the selection of ωi needs to satisfy a condition: no ωi can be the sum of other ωi, it must satisfy the following:
i n r i ω i 0
In the RBD-FAST design, all ωi values are given a fixed value; then, by randomly permuting the sequence of si, disordered xi and thus disordered model outputs yNs are obtained. Rearranging yNs according to the original sequence of parameter xi and performing FFT (Fast Fourier Transform), followed by the calculations according to the series of formulas, the first-order sensitivity for parameter xi can be determined.

3. Results

3.1. Correlation between Design Parameters and Performance Indicators

3.1.1. Correlation between Control Parameters and Performance Indicators

The Plotmatrix scatter plot matrix can be used to study the distribution relationships between pairs of parameters within large datasets containing multiple sampled parameters. The horizontal and vertical dimensions of this scatter plot matrix are equal to the number of parameters under study, with a diagonal line from the top left to the bottom right displaying the distribution histogram of each parameter across the entire dataset; each scatter plot within the matrix indicates the statistical relationship between the two parameters represented by its horizontal and vertical coordinates.

Type 1 Model

The scatter plots within the 6 × 6 range in the upper-left area represent uniformly distributed and random sampling points, demonstrating the uniformity of sampling within each two-dimensional parameter space formed by every two sets of control parameters, achieved through the Latin Hypercube Sampling method. Analyzing the scatter plot matrix rows for UTCI and annual energy consumption below can lead to the following conclusions (Figure 9):
  • The dimensions of buildings in the X and Y directions show no significant statistical correlation with outdoor comfort UTCI values but are negatively correlated with building energy consumption. This means that larger building dimensions correspond to lower air conditioning loads per unit area. As building sizes increase from side lengths of 20 m to 30 × 80 m, the air conditioning load per unit area can decrease from 200 kWh/m2 to 160 kWh/m2, which is about a 20% reduction.
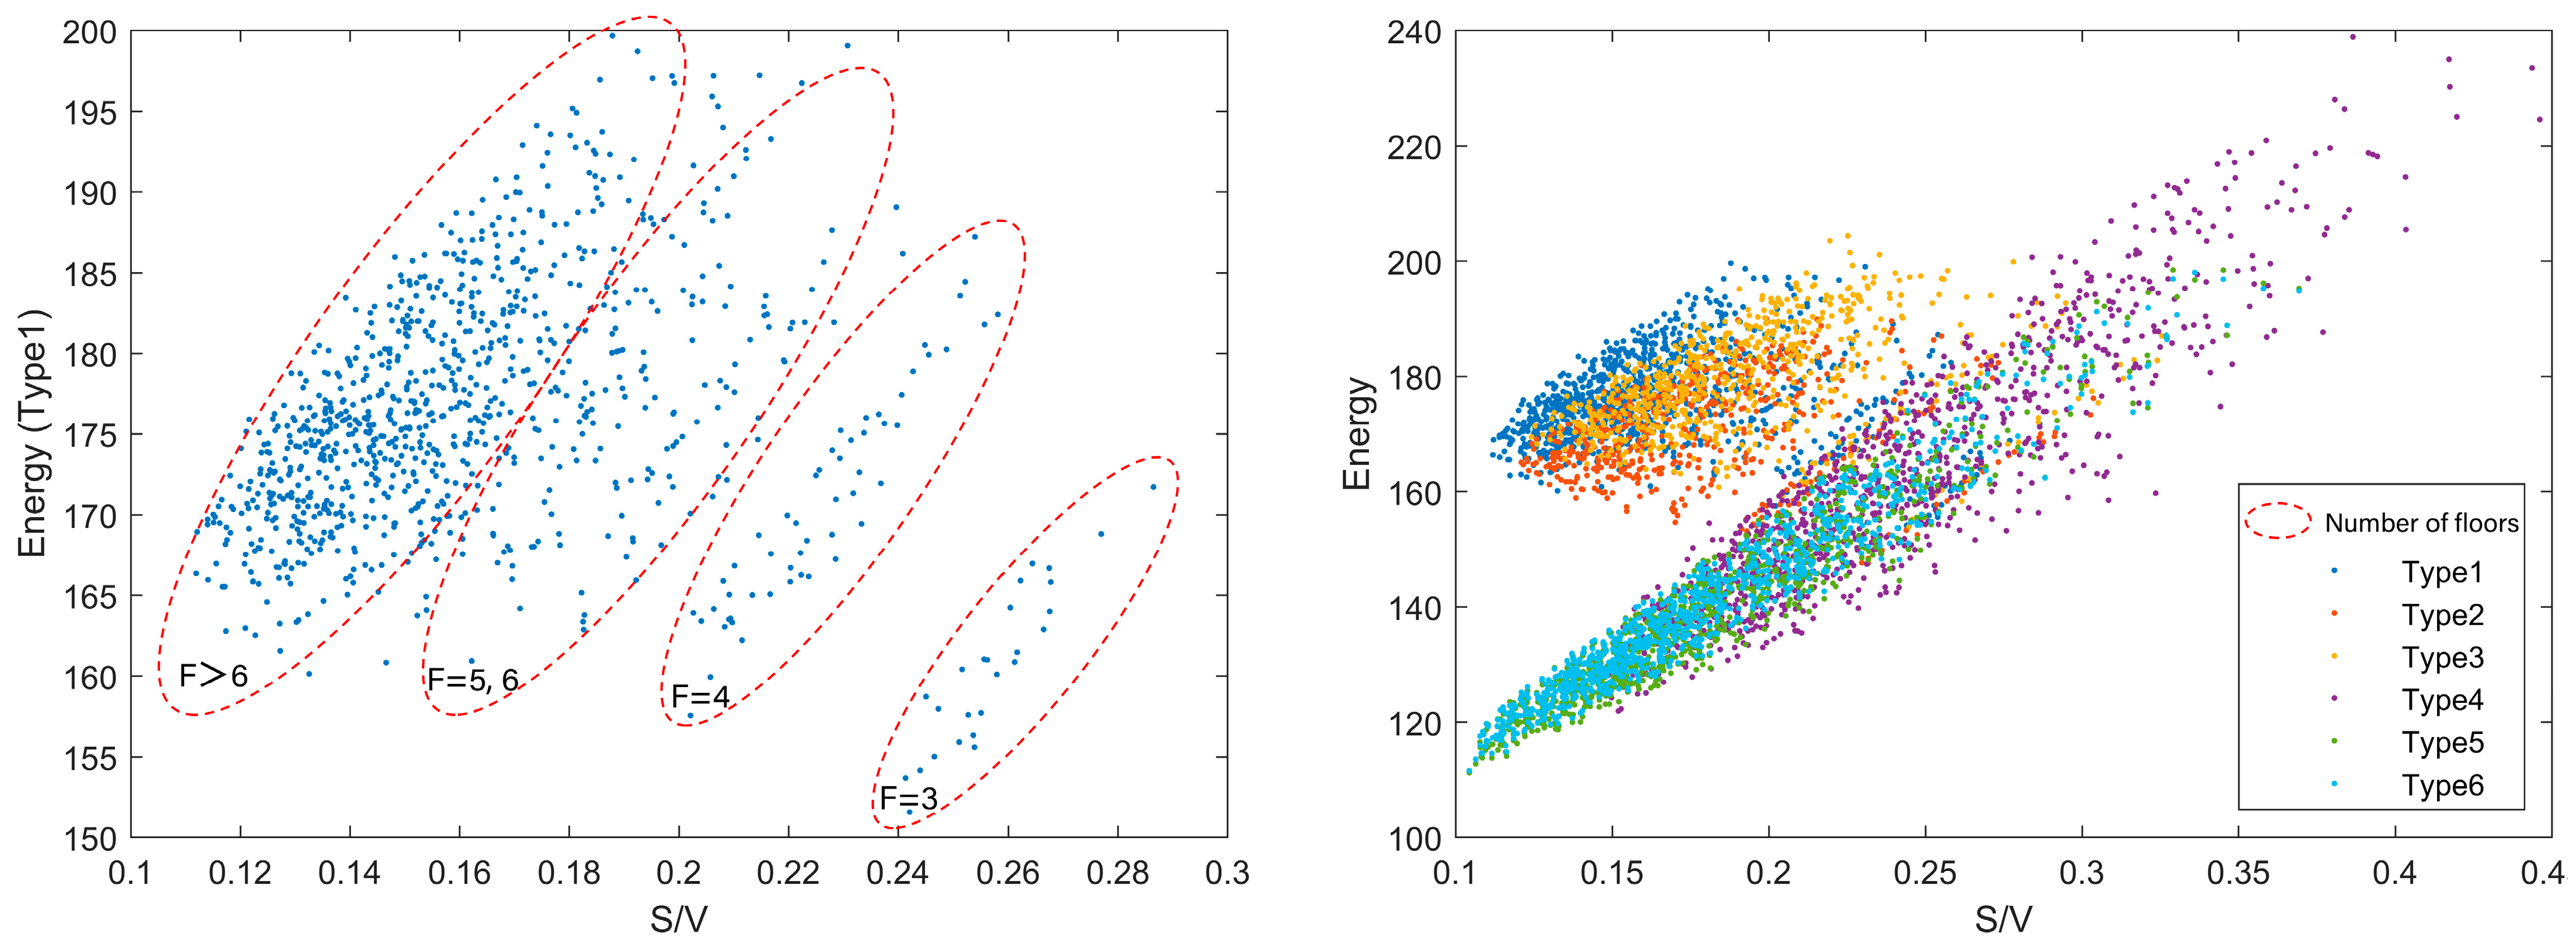
  • There is a clear negative correlation between the number of building floors and the UTCI, indicating that higher buildings result in lower average felt temperatures outdoors during the hottest week and thus higher thermal comfort. Increasing the building height from 3 to 22 floors can reduce the UTCI average by nearly 3 °C. This negative correlation can be interpreted as higher buildings producing stronger shading effects between them, reducing direct solar radiation and correspondingly lowering the felt temperature in pedestrian areas. The correlation between the number of floors and energy consumption is significant for buildings between three and seven floors, showing a positive relationship, but it is almost negligible above seven floors.
  • Building spacing has a weak correlation with both UTCI and energy consumption, suggesting that larger spaces between buildings may lead to a slight increase in energy consumption and outdoor UTCI values. However, the scattered distribution of data points indicates a high variance, implying that building spacing is not a reliable predictor of performance indicators when evaluating different design options.
  • The building orientation angle shows no statistical correlation with either UTCI or energy performance.
Scatter plots reveal a clear positive correlation between UTCI and energy consumption, indicating that higher building energy consumption is associated with higher UTCI values. This finding, in conjunction with conclusions (2) and (3), implies that the combined effect of building height and spacing strengthens the proportional relationship between UTCI and energy consumption. This is consistent with empirical judgment, as shading between buildings in subtropical hot-humid regions reduces cooling energy by mitigating direct solar radiation on building surfaces. Concurrently, this shading effect also improves outdoor thermal comfort for pedestrians. Therefore, in hot-humid regions, optimizing outdoor comfort and energy consumption is not a trade-off but a mutually reinforcing endeavor.

Type 2 and Type 3 Models

For the enclosed and semi-enclosed building model, the control parameters, site UTCI values, and annual energy consumption formed a 9 × 9 Plotmatrix scatter plot matrix (Figure 10):
  • There is no significant statistical correlation between building width and UTCI values; however, there is a strong inverse relationship between the building width and energy consumption. That is, larger building widths correspond to lower air conditioning loads per unit area. This strong correlation can serve as an empirical basis for preliminary architectural design decisions.
  • Compared to building width, the size of the inner courtyard formed within the building has no significant impact on either energy consumption or UTCI values.
  • Like point-style buildings, there is a clear negative correlation between the number of building floors and the UTCI, meaning that higher buildings result in lower average felt temperatures outdoors during the hottest week and thus higher thermal comfort. Increasing the building height from 3 to 22 floors can potentially reduce the UTCI average by up to 2 °C. The correlation between the number of floors and energy consumption is present only in low-rise situations.
  • In this scenario, the weak correlation between building spacing and both energy consumption and UTCI is similar to that observed in point-style buildings.
  • The building orientation angle shows no statistical correlation with either UTCI or energy performance.
  • Compared to point-style buildings, the relationship between UTCI and energy consumption is weaker.
Under the same control parameter settings, the energy consumption of enclosed buildings is relatively lower than that of semi-enclosed buildings, but there is no difference in the average UTCI values of the blocks.

Type 4 Model

Placing the control parameters of the Type 1 model, consisting of two to four row-column arranged buildings, along with site UTCI values and annual energy consumption, into the Plotmatrix scatter plot matrix (Figure 11) allows for an analysis of the statistical relationships between various parameters and performance indicators. An analysis of the scatter plot matrix leads to the following conclusions:
  • The number of buildings shows no correlation with per-unit-area energy consumption or UTCI.
  • Both the building width (Width) and length (X) dimensions are negatively correlated with the energy consumption distribution, indicating that larger building plan dimensions correspond to lower air conditioning loads per unit area. This effect is more pronounced with the building length; as length increases from 10 m to 50 m, per-unit-area air conditioning load can decrease from 220 kWh/m2 to 140 kWh/m2, a reduction of about 36%.
  • The north-south building spacing shows a weaker correlation with energy consumption but a gradual increase in outdoor UTCI values with larger north-south spacing.
  • There is a certain negative correlation between the number of building floors and energy consumption, particularly significant within 13 floors, with almost no effect from 13 to 22 floors.
  • The distance between the plot boundary and buildings shows a certain positive correlation with UTCI, while the building orientation angle shows a certain negative correlation with UTCI, with the UTCI range concentrated between 35 °C to 34.5 °C when the distance changes from 20 m to 5 m or when the angle changes from 0° to 90°; however, neither shows a statistical correlation with energy consumption.
  • Scatter plots of UTCI and energy consumption reveal a clear positive correlation—higher building energy consumption corresponds to higher UTCI values.

Type 5 and Type 6 Models

For the Type 5 and Type 6 model, the control parameters, site UTCI values, and annual energy consumption formed a 9 × 9 Plotmatrix scatter plot matrix (Figure 12), with the following relationships between various parameters and performance indicators:
  • There is no significant correlation between building length (X0) and width (Y0) with UTCI values. However, it is notable that the width (Y0) parameter demonstrates a significant inverse relationship with energy consumption. Specifically, larger building widths are associated with lower air conditioning loads per unit area.
  • The spacing in the east-west (X1) and north-south (Y1) directions between buildings has no significant impact on energy consumption or UTCI values.
  • The distance (d) between the plot boundary and buildings shows little correlation with energy consumption but is positively correlated with UTCI values.
  • Building height shows a clear negative correlation with both energy consumption and UTCI. As the building height increases from 3 to 13 floors, per-unit-area energy consumption can decrease by 50 kWh/m2, and the average UTCI value can reduce by up to 1 °C. The trend becomes less apparent when the number of floors exceeds 10.
  • The building orientation angle shows no statistical correlation with either UTCI or energy performance.
  • Outdoor environmental UTCI values continue to show a clear positive correlation with building energy consumption.
  • Under the same control parameter settings, the average UTCI of Type 5 buildings is relatively higher than that of Type 6 buildings, but there is no difference in the EUI values of the blocks.

3.1.2. Correlation between Descriptive Parameters and Performance Indicators

Type 1–3 Individual Building Models

The descriptive parameters of the three individual building model, along with site UTCI values and annual energy consumption, were analyzed in a Plotmatrix scatter plot matrix to understand their statistical relationships with performance indicators (Figure 13). Among them, FAR only considers cases less than 4.0. The statistical relationships between various descriptive parameters were visualized through scatter plots in the 6 × 6 range in the upper-left:
Although there is no overall statistical positive or negative correlation between the FAR and building density, a noticeable bar-shaped distribution is evident. These neat bands reflect that for buildings of fixed floors from 3 to 22, FAR and building density have a strict linear relationship, as the FAR is strictly the product of the building density and the number of floors under the same building base area conditions.
The FAR shows a certain negative correlation with the S/V, meaning that a larger FAR leads to a smaller S/V. There is also a strong correlation between the FAR and the Street H/W in both directions of the building, indicating that a higher FAR lead to higher street height-to-width ratios, making streets more canyon-like. This conclusion is also reflected by the SVF, which shows a strong inverse relationship with the FAR.
Building density is an important indicator in urban planning, but it does not show a significant correlation with the S/V, H/W, or SVF, due to the variability in building heights.
The S/V shows significant statistical correlations with all other descriptive parameters except building density. A larger Street H/W results in a smaller S/V, while a larger SVF leads to a larger S/V.
The Street H/W noticeably reflects the level of SVF, and vice versa.
Based on the scatter plot matrix for UTCI and annual energy consumption in Figure 13, the following can be inferred:
  • A higher FAR is associated with better outdoor thermal comfort (lower UTCI values). However, there is no strong statistical correlation between the FAR and building energy consumption.
  • There is an inverse relationship between building density and energy consumption, meaning that higher density leads to lower energy consumption, with a deviation of about 20%. Contrary to common belief, there is no strong statistical correlation between building density and outdoor comfort UTCI values. High-density urban areas do not necessarily offer better outdoor comfort, which could be attributed to building density not reflecting building height characteristics and thus not accurately depicting the shading effect between buildings.
  • The S/V is positively correlated with UTCI, meaning that a larger S/V results in higher UTCI and lower outdoor comfort. However, in hot-humid regions, the S/V does not show a strict positive or negative correlation with building energy consumption—a distortion that has been confirmed by scholars [66]. This finding should be considered in future design practices.
  • The Street Height-to-Width Ratio (HWx/HWy) is strongly negatively correlated with UTCI values, meaning a larger ratio, indicative of more canyon-like streets, results in lower UTCI values and higher outdoor thermal comfort. However, the street height-to-width ratio does not effectively reflect the energy consumption indicators of buildings on either side of the street.
  • SVF can effectively characterize changes in UTCI values, aiding designers in assessing potential outdoor thermal comfort levels. With an SVF below 0.6, it can to some extent reflect building energy consumption levels—the higher the SVF, the higher the building energy consumption. This correlation fails when SVF is greater than 0.6—analyzing scatter plots of building energy consumption alongside the FAR and HWx/HWy indicates that SVF becomes ineffective in scenarios with a FAR below 2 and street height-to-width ratio less than 1, where designers cannot rely on SVF for energy consumption estimates.
The correlation between UTCI and building energy consumption has been discussed earlier. The divergence is related to the SVF ineffectiveness scenario described previously, suggesting that in cases with Street Height-to-Width Ratios less than 1 or SVF greater than 0.6, optimizing for UTCI and energy consumption is not mutually beneficial, and no correlation exists between UTCI and energy consumption under these conditions.

Type 4–6 Group Building Models

The relationships between descriptive parameters and performance indicators for Type 4–6 are summarized in Figure 14. The statistical relationships among various descriptive parameters are initially analyzed through the scatter plots within the top-left 6 × 6 range:
The scatter plot of FAR values against building density ratio values exhibits an obvious bar-shaped distribution—these neat stripes reflect a strict linear relationship between the building Floor Area Ratio and building density for buildings with a fixed number of floors.
The FAR shows a negative correlation with both the S/V and SVF, and a strong positive correlation with the H/W of streets in two directions of the building. That is, the higher the FAR, the smaller the building S/V will be, making the streets more canyon-like, and the smaller the SVF.
Due to the variability in building heights, building density—an important indicator in urban planning—does not show a significant correlation with the S/V, the Street Height-to-Width ratio, or sky view factor parameters.
The S/V, apart from having a strong negative correlation with the FAR, shows little correlation with all other descriptive parameters.
The Street Height-to-Width ratio can significantly reflect the level of sky visibility, and vice versa. In summary, within the three-group layout verification model, the correlations among various descriptive parameters of buildings are broadly similar with those in individual building models. However, the correlation of the building S/V with other descriptive parameters, aside from the FAR, is generally weak.
Analyzing the scatter plot matrix for UTCI and annual energy consumption in Figure 14, we can draw the following conclusions:
  • For all three groups of collective layout verification models, across the entire range of FARs from 0.5 to 4, the following phenomenon is observed: a higher FAR correlates with better outdoor thermal comfort (lower UTCI values) and lower building energy consumption. The correlation between the FAR and UTCI values is more pronounced under the grid-style layout; the inverse relationship between the FAR and energy consumption is unaffected by the collective layout mode, meaning a specific FAR corresponds to a specific range of energy consumption values across different collective layouts.
  • Building density has an inverse relationship with energy consumption, meaning higher density leads to lower energy use. Like the conclusions drawn from individual building verification models, aside from a weak correlation within the linear group layout (Type 1), there is no strong statistical relationship between building density and outdoor comfort UTCI values, indicating that higher density does not necessarily improve outdoor comfort in urban areas.
  • The S/V has a weak positive correlation with UTCI; in contrast to individual building models, in all three collective layout scenarios, the S/V shows a strict positive correlation with building energy consumption.
  • The Street Height-to-Width Ratio does not effectively reflect the energy consumption indicators of buildings on either side of the street; its negative correlation with UTCI values is not as strong as in individual building models, and thus, the building energy consumption and UTCI values cannot be directly inferred from the Street Height-to-Width ratio.
  • Unlike single building models, the SVF in collective layout study models does not reflect changes in building energy consumption and UTCI performance indicators.
  • There exists a strong correlation between UTCI and building energy consumption.
Within the three collective layout verification models, the correlation among the FAR, energy consumption, and comfort parameters, the inverse relationship between building density and energy consumption, and the proportional relationship between UTCI and building energy consumption align with the conclusions from individual building models. However, there are differences; in collective layouts, the S/V shows a strong correlation with energy consumption, whereas the negative correlation between H/W and UTCI and the relationship between SVF and energy consumption and UTCI are not evident.

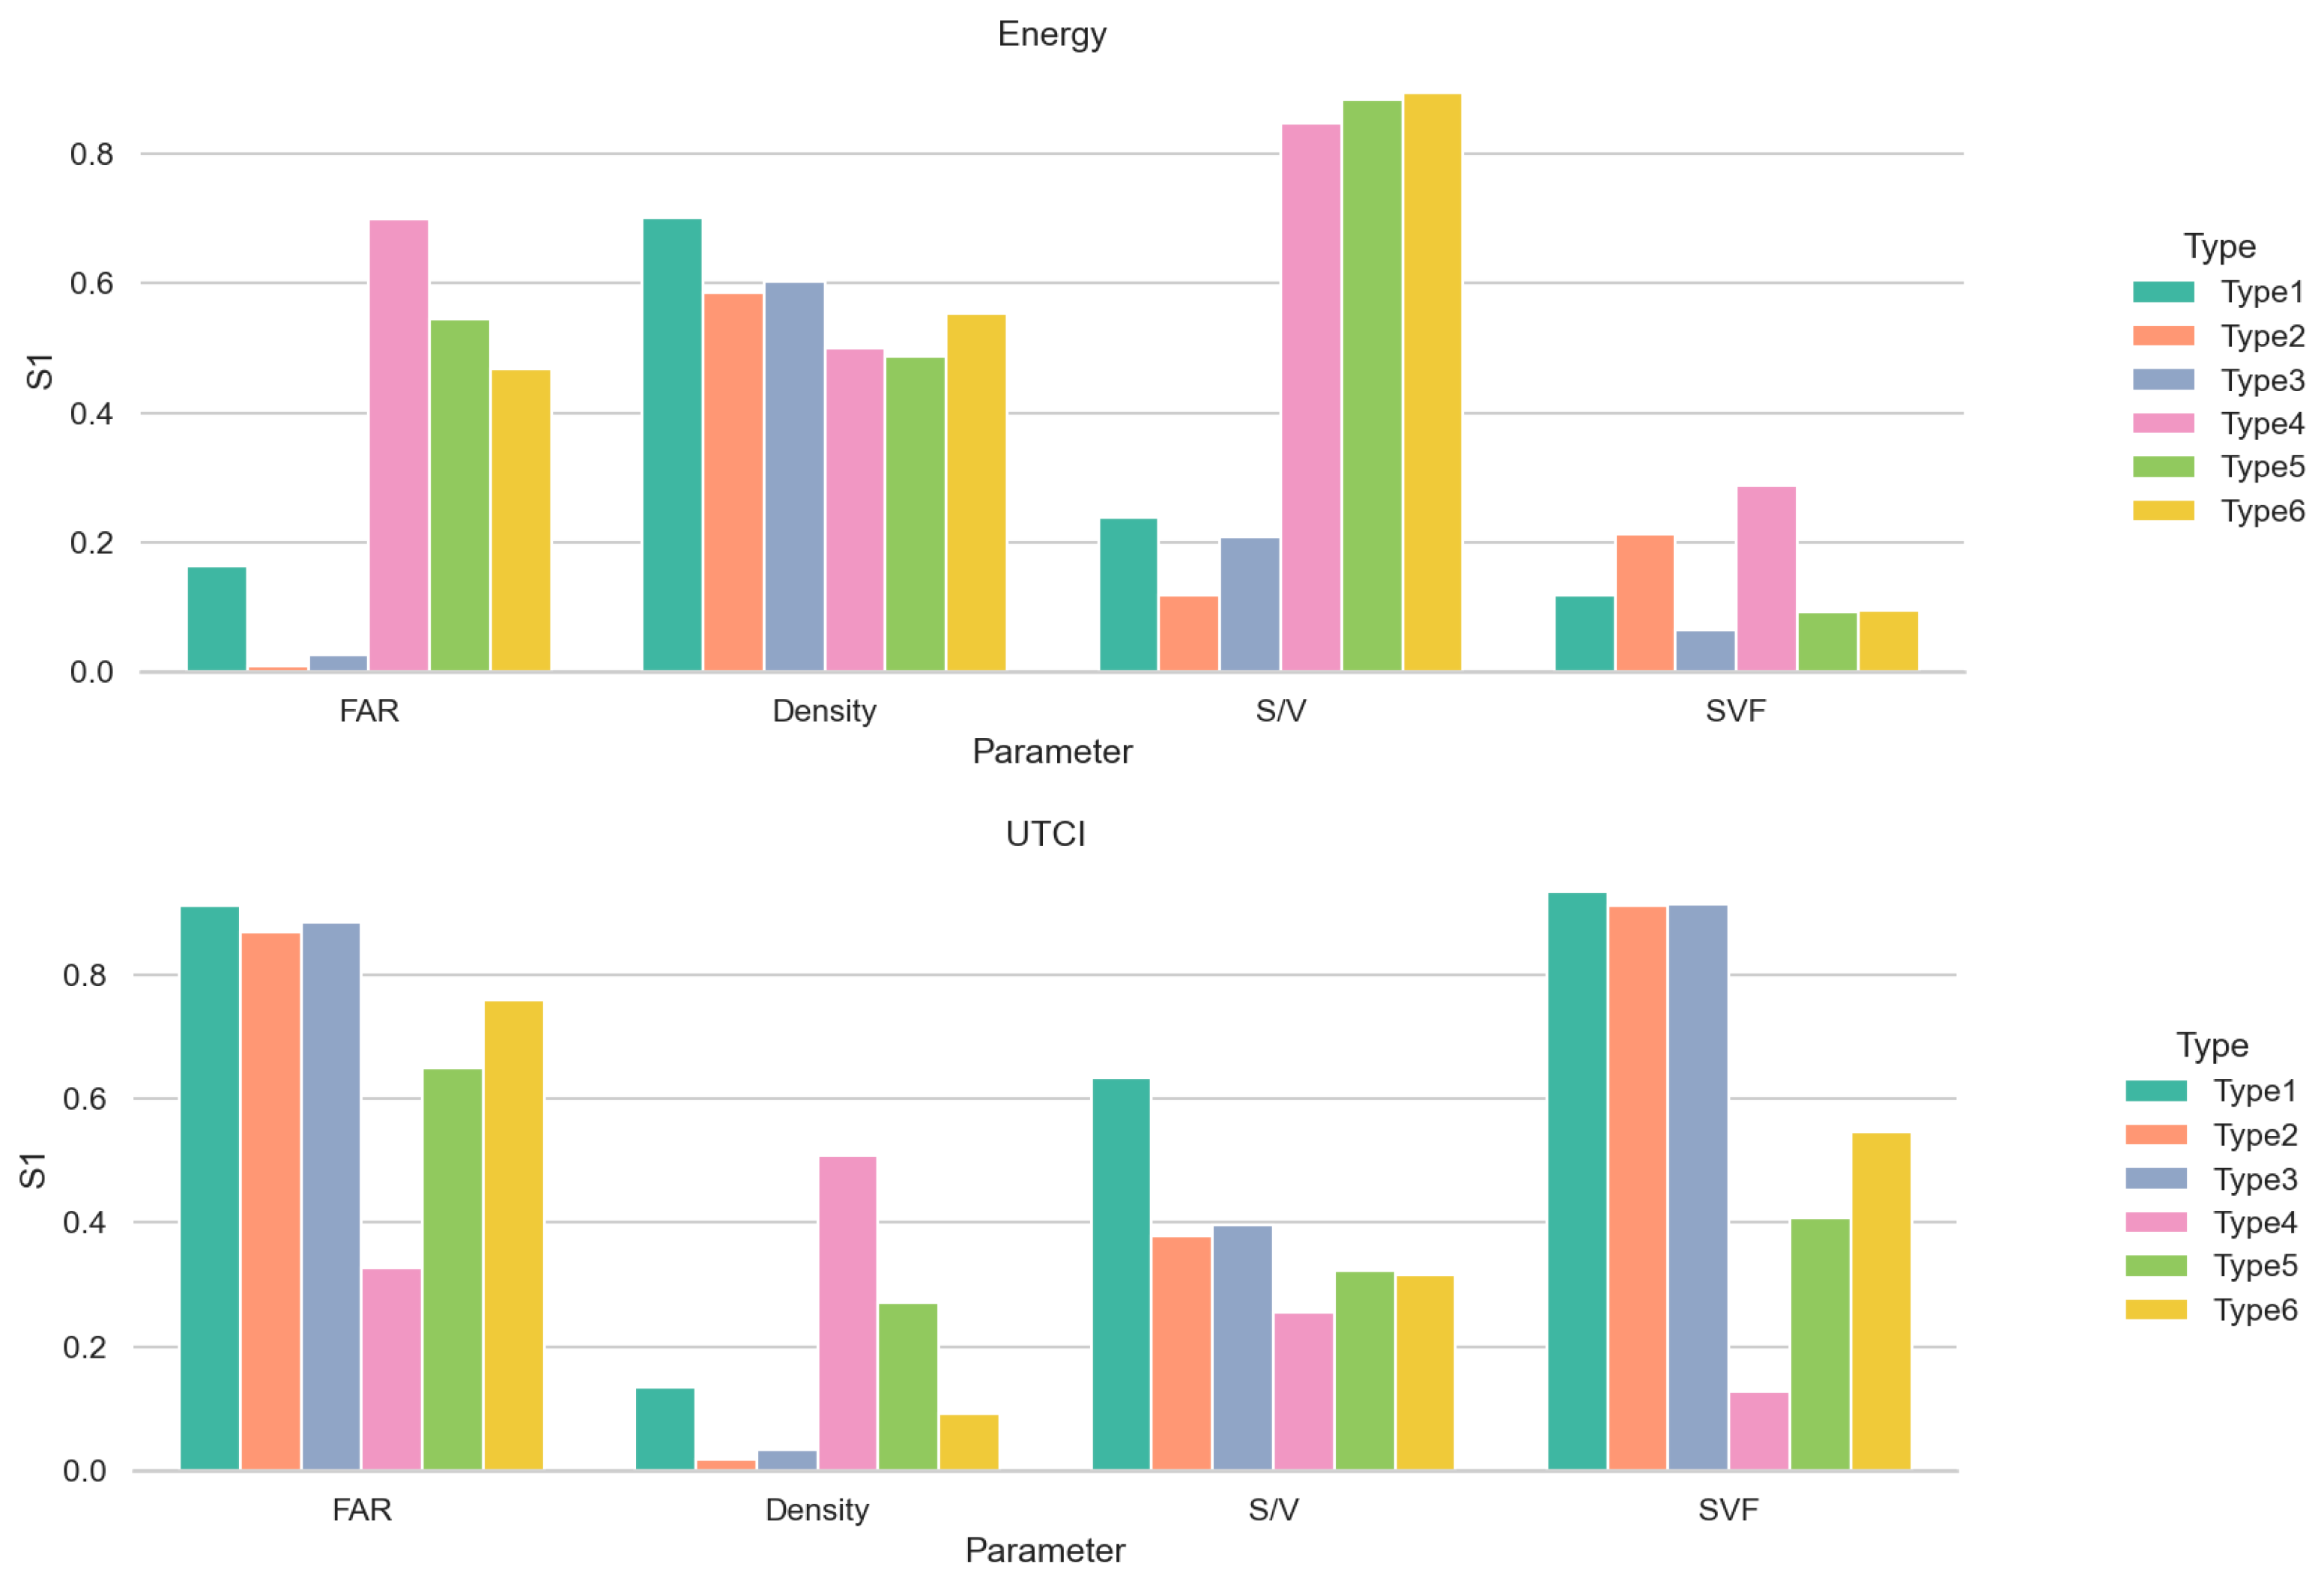
3.2. Sensitivity Analysis Results

The sensitivity analysis results for descriptive parameters across six layouts are shown in Figure 15. It is evident that in terms of energy consumption, individual layouts (Type 1–3) and collective layouts (Type 4–6) show significant differences in the sensitivity to the FAR and S/V, with the former being noticeably lower than the latter. Regarding building density, the sensitivity trend is consistent across all six layouts, showing a strong trend.
For UTCI, individual layouts and collective layouts exhibit clear differences in sensitivity to the FAR, building density, and SVF. The sensitivity to SVF is significantly higher in individual layouts than in collective layouts, while the opposite is true for the building density. Looking at the FAR and SVF alone, the sensitivity differences among the point, semi-enclosed, and enclosed styles of individual building layouts are minimal. In terms of the S/V, the point style shows higher sensitivity, while the other five styles have minor differences in average values.
These sensitivity analysis results reflect how variations in design parameters for different building layouts disrupt target performance indicators. Design parameters with higher sensitivity significantly impact the variations in target performance indicators. Due to the spatial heterogeneity of collective layout prototypes compared to individual building layout prototypes, the experience of the indicator adjustment applicable to collective layouts may not be directly transferable to the optimization design of individual building layouts, and vice versa. Based on the analysis in this section, the following more intuitive conclusions can be drawn.
Control of Building Energy Performance:
(1)
For both collective and individual building layout prototypes, controlling building density significantly affects energy consumption.
(2)
For collective layouts, controlling the FAR and S/V effectively adjusts building energy consumption, but this experience is not applicable to the more homogeneous single-building prototypes. This conclusion is also corroborated by the matrix scatter plots in Section 3.1.2, indirectly reflecting that conclusions based on homogeneous building study prototypes do not accurately reflect real urban layout experiences.
(3)
For collective layout modes, the experience of controlling building energy consumption by controlling descriptive parameters can apply to both bar-type layouts (Type 4) and checkerboard layouts (Type 5, Type 6).
(4)
For homogeneous individual building layouts, adjusting the other three types of descriptive indicators is not as effective as adjusting the building density.
Control of Outdoor Thermal Comfort (UTCI):
(1)
Due to the homogeneity of individual building layouts, FAR and SVF indicators show a strong correlation with UTCI, and controlling the S/V also significantly impacts UTCI. This correlation is notably strong across three different individual building layouts.
(2)
Due to the spatial heterogeneity of collective layout modes, the control strength of FAR and SVF indicators and the S/V values based on UTCI are relatively weaker, especially in bar-type building layouts (Type 4).
(3)
There is no strong correlation between the building density and UTCI (as building height more directly affects the outdoor thermal environment than building density does). However, for collective layout modes, the building density also impacts UTCI to some extent, especially in bar-type building combinations (Type 4).
The sensitivity analysis results can be intuitively helpful for designers in decision-making during urban design, providing targeted guidance for adjusting design parameters based on various building layouts and optimization goals for building energy consumption and outdoor thermal comfort (UTCI).

4. Discussion

The previous sections detailed the correlation between morphological design parameters and performance indicators for individual building layouts and collective urban block layouts in hot-humid regions, like Guangzhou. These data can serve as a reference for designers to preliminarily gauge the relationship between building volume and performance based on urban architectural forms before actual design. This section synthesizes these findings to draw broader conclusions and architectural guidance from the correlations observed across multiple layout prototypes.

4.1. Common Trends across Six Urban Block Prototypes

For both individual and collective morphological prototypes, the plan dimensions directly affect the energy consumption per unit area of the building—the larger the planar dimensions, the lower the building’s energy consumption. For point-type buildings, the impact range is around 20%, while for linear combination buildings, it can reach a difference of 36%. This statistical rule can be explained by the ratio of the building’s plan perimeter to its area. The perimeter of the external envelope corresponds to the air conditioning load generated by the building to overcome the indoor–outdoor temperature difference, and a larger plan area means that the total air conditioning load is distributed over a larger area.
Based on this, the relationship between the ratio of the perimeter to plan area (L/A) of the typical single-layer units of six types of block units and the building energy consumption per unit area is visualized in Figure 16 below. It can be confirmed that for any office building, the ratio of the standard layer L/A can describe the level of building energy consumption to a certain extent. That is, higher-performance buildings require a smaller L/A value.
In hot-humid regions like Guangzhou, there is no significant statistical correlation between the building orientation and energy consumption or outdoor comfort (UTCI). This suggests that, for city block-scale studies in similar climates, the building orientation has little impact on outdoor comfort or energy use. Subsequent studies may consider excluding this factor to streamline computational requirements.
Building spacing has a relatively weak influence on energy consumption and UTCI in both individual models and collective models. In individual building models, it predominantly affects low-rise buildings, while its impact in collective models is minimal.
The FAR and S/V—two design parameters applicable to all six building typologies—exhibit strong correlations with outdoor thermal comfort (UTCI). Specifically, as the volume ratio increases, the form factor decreases, or the SVF decreases, and outdoor thermal comfort within the neighborhood correspondingly improves (UTCI values decrease).
Building density exhibits an inverse relationship with energy consumption (approximately 20% deviation) across all six building typologies, making it a crucial indicator in urban planning. However, the building density does not exhibit a strong statistical correlation with outdoor UTCI, contradicting common perception. This discrepancy can be attributed to the building density failing to reflect the characteristics of building height, thus inadequately describing the shading effect between buildings.
Apart from the Type 2 and Type 3 models, a recurring significant finding across all other models is the unequivocal positive correlation between outdoor thermal comfort (UTCI) and building energy consumption. In urban areas with lower energy usage, UTCI tends to be lower as well, signifying enhanced outdoor comfort levels. This observation aligns with the prevailing understanding that, in sub-tropical hot-humid regions, implementing building shading strategies reduces air conditioning energy consumption by mitigating direct solar radiation on building surfaces. Consequently, this approach alleviates thermal discomfort for outdoor occupants. Thus, the simultaneous prioritization of outdoor comfort and energy efficiency in hot-humid areas not only represents compatible objectives but also synergistic ones.

4.2. Differential Rules across Urban Block Prototypes

The relationship between the number of building floors and UTCI is more pronounced in single building prototypes but not as prominent in collective building prototypes, a conclusion also supported by the sensitivity analysis. Given the findings from both correlation verification and sensitivity analysis, it is speculated that this phenomenon may be attributed to the FAR having a significant impact on UTCI in both types of building prototypes. Unlike collective building prototypes, where FAR can be increased through factors like building spacing and the number within the block, single building prototypes can only increase the FAR by enlarging plan dimensions or adding floors, thus making the relationship between the number of floors and UTCI more apparent in single-building than in collective prototypes.
The S/V has been an important guideline for estimating building energy consumption in previous standards for the energy-efficient design of public buildings, but this empirical conclusion has been questioned by the academic community [65]. This study in hot-humid regions finds that for collective building prototypes, there is a strict statistical correlation between the shape factor and energy consumption, meaning that a larger S/V leads to higher energy use. However, this correlation does not appear in single-building prototypes—e.g., in the point-style single-building prototype, a dispersion phenomenon in the distribution of per-unit-area energy consumption between low-rise and high-rise buildings is observed (as shown in Figure 17, left), suggesting that designers should pay attention to this finding in future design practices.
In individual building-models, the SVF effectively characterizes changes in UTCI values, aiding designers in assessing potential outdoor thermal comfort levels. However, this rule does not hold in collective layout models due to their lack of homogeneity found in single-building models, preventing a generalizable SVF value applicable across the entire block.

4.3. The Social Significance of Urban Morphology Research

Understanding and integrating these insights about urban morphology can lead to the creation of urban environments that promote environmental sustainability, enhance public health, and enrich cultural and social interactions. This holistic approach is vital for developing adaptable, resilient, and vibrant urban spaces for future generations.
For example, much more outer spaces that encourage interaction through design elements, like parks, open green spaces, and community hubs, promote greater social cohesion and interaction. According to the above conclusion, sufficient outer spaces can not only facilitate adjustments in the Floor Area Ratio (FAR) and Sky View Factor (SVF), but also contribute to a reduced L/A ratio and lower building density. Consequently, this research supports the reduction of energy consumption and enhances outdoor thermal comfort, thereby improving public attitudes and quality of life.
Integrating these considerations into urban planning requires a multi-disciplinary approach that acknowledges the complex interplay between physical layouts and social dynamics. Based on the existing research, planners can utilize a block prototype analysis when designing a new urban district to identify models that align with optimal performance indicators. During the following refinement phase, the integration of ample green spaces connected by pedestrian pathways not only reduces urban heat islands but also enhances physical health and facilitates social interactions.
Moreover, by establishing heterogeneous and homogeneous block models for a comparison, diverse designs of public spaces can support various cultural activities, thereby augmenting the area’s vibrancy. These approaches and quantitative results will be further explored and presented in our next research.

4.4. Implications for Public Policy and Recommendations

This study’s findings have significant implications for urban planning and public policy. Based on our analysis of urban morphology and its effects on building energy consumption and outdoor thermal comfort, several policy recommendations can be formulated to enhance urban sustainability. Firstly, policies could be established to regulate building density and the FAR in new developments to optimize natural light access and minimize shadow casting, which can significantly affect energy consumption and thermal comfort. Additionally, guidelines on building heights, building spacing, and orientations should be designed to promote adequate air circulation, reducing the urban heat island effect, and supporting more efficient natural cooling.

5. Conclusions

This study has contributed significant insights into the association between urban morphological design parameters and performance indicators, offering valuable guidelines for urban form design. Initially, the research background related to urban morphology design was reviewed, emphasizing the importance of utilizing ideal models to investigate universal principles and distinguishing between control parameters and descriptive parameters.
Six typical morphological models, representative of prevalent building blocks in Guangzhou, were constructed and thoroughly analyzed. Through scatter matrix plot visualizations, the relationships among control parameters, descriptive parameters, and performance indicators were examined, unveiling trends and quantitative insights into the influence of diverse block design parameters on building energy consumption (EUI) and outdoor thermal comfort (UTCI). These findings provide a solid foundation for urban design practices and can be consolidated into a comprehensive designer’s reference manual.
The key findings of this study, specific to the subtropical region represented by Guangzhou, can be succinctly summarized as follows:
(1)
Plan dimensions directly impact the energy consumption per unit area of buildings.
(2)
Building orientation shows no significant statistical correlation with energy consumption or outdoor comfort (UTCI).
(3)
Building spacing exerts a relatively weak influence on energy consumption and UTCI.
(4)
The Floor Area Ratio (FAR) and Surface-to-Volume Ratio (S/V) exhibit strong correlations with outdoor thermal comfort (UTCI).
(5)
Building density demonstrates an inverse relationship with energy consumption across all six building typologies, emphasizing its importance in urban planning.
(6)
There exists a positive correlation between outdoor thermal comfort (UTCI) and building energy consumption.
(7)
The assessment of the applicability of the S/V parameter in building energy consumption evaluations across different scenarios is crucial.
These findings, derived from a comprehensive quantitative analysis, not only shed light on the nuances of urban form design in subtropical regions but also establish a platform for future research endeavors. By integrating these key findings into practical applications, urban designers can make informed decisions to enhance both energy efficiency and outdoor comfort in urban environments.

Author Contributions

S.Z.: conceptualization, methodology, software, writing—original draft. C.M.: supervision, project administration, funding acquisition, software, writing—review and editing. Z.W.: resources, funding acquisition, supervision. Y.H.: data curation, validation, visualization, writing—review and editing. X.L.: data curation, funding acquisition, writing—review and editing. All authors have read and agreed to the published version of the manuscript.

Funding

This research was funded by the National Natural Science Foundation of China (Grant No. 52108011); the State Key Laboratory of Subtropical Building and Urban Science, South China University of Technology (Grant No. 2022ZB11); the Guangdong Basic and Applied Basic Research Foundation (Grant No. 2023A1515011137 and Grant No. 2024A1515012129); the 2022 Guangdong Philosophy and Social Science Foundation (Grant No. GD22XGL02); and the Guangzhou Philosophy and Social Science Planning 2022 Annual Project (Grant No. 2022GZQN14), which is gratefully acknowledged.

Data Availability Statement

Data will be made available on request.

Conflicts of Interest

Author Chenlong Ma, Zhongping Wu and Xiao Liu were employed by the company Architectural Design and Research Institute Co., Ltd. The remaining authors declare that the research was conducted in the absence of any commercial or financial relationships that could be construed as a potential conflict of interest.

Abbreviations

FAR: Floor Area Ratio; S/V: Shape Factor = Surface Area/Total Enclosing Volume; H/W: The Street Height-to-Width Ratio; SVF: Sky View Factor; UTCI: Universal Thermal Climate Index, which assesses Outdoor Thermal Comfort; EUI: Energy Use Intensity; WWR: Window-to-wall Ratio; L/A: the Ratio of the Perimeter to Plan Area.

Appendix A

Table A1. Several typical block morphology models.
MaterialThickness
mm
Thermal Conductivity
W/(m·K)
Density
Kg/m3
Specific Heat Capacity
J/(kg·K)
FlooringAnti-slip floor tile101.162000935
Polymer mortar50.9318001050
Mortar200.9318001050
C20 concrete801.742500920
RoofC30 fine aggregate concrete501.742500920
LC10 lightweight aggregate concrete300.9517001050
Reinforced concrete1201.742500920
WallStone cladding303.492800920
Waterproof mortar200.9318001050
Polymer mortar100.9318001050
Concrete hollow block wall1900.227001050
Lime plaster20.8116001050
MaterialThickness
(mm)
Heat Transfer Coefficient W/(m2·K)Radiation Transmittance RatioVisible Light Transmittance Ratio
External
windows
Translucent glass65.70.850.9
Medium light transmittance heat-reflective glass65.50.510.47
Low light transmittance heat-reflective glass64.80.420.32
High light transmission low-E glass64.00.690.80
6 Transparent glass + 12 Air layer + 6 Transparent glass3.40.750.81
6 Low light transmittance heat-reflective + 12 Air layer + 6 Transparent glass3.10.350.29
6 High light transmission low-E + 12 Air layer + 6 Transparent glass2.70.460.68
6 High light transmission low-E + 12 Argon gas layer + 6 Transparent glass2.70.450.68

References

  1. Heilig, G.K. World Urbanization Prospects: The 2011 Revision; United Nations, Department of Economic and Social Affairs (DESA), Population Division, Population Estimates and Projections Section: New York, NY, USA, 2012; Volume 14, p. 555. [Google Scholar]
  2. Seto, K.C.; Güneralp, B.; Hutyra, L.R. Global forecasts of urban expansion to 2030 and direct impacts on biodiversity and carbon pools. Proc. Natl. Acad. Sci. USA 2012, 109, 16083–16088. [Google Scholar] [CrossRef] [PubMed]
  3. Zhang, X.; Wang, X.; Du, S.; Tian, S.; Jia, A.; Ye, Y.; Gao, N.; Kuang, X.; Shi, X. A systematic review of urban form generation and optimization for performance-driven urban design. Build. Environ. 2024, 253, 111269. [Google Scholar] [CrossRef]
  4. Liu, X.; He, J.; Xiong, K.; Liu, S.; He, B.-J. Identification of factors affecting public willingness to pay for heat mitigation and adaptation: Evidence from Guangzhou, China. Urban Clim. 2023, 48, 101405. [Google Scholar] [CrossRef]
  5. Karimimoshaver, E.; Khalvandi, R.; Khalvandi, M. The effect of urban morphology on heat accumulation in urban street canyons and mitigation approach. Sustain. Cities Soc. 2021, 73, 103127. [Google Scholar] [CrossRef]
  6. Liu, K.; Xu, X.; Zhang, R.; Kong, L.; Wang, W.; Deng, W. Impact of urban form on building energy consumption and solar energy potential: A case study of residential blocks in Jianhu, China. Energy Build. 2023, 280, 112727. [Google Scholar] [CrossRef]
  7. Yang, J.; Zhao, Y.; Zou, Y.; Xia, D.; Lou, S.; Liu, W.; Ji, K. Effects of Tree Species and Layout on the Outdoor Thermal Environment of Squares in Hot-Humid Areas of China. Buildings 2022, 12, 1867. [Google Scholar] [CrossRef]
  8. Du, R.; Liu, C.-H.; Li, X.-X. A new method for detecting urban morphology effects on urban-scale air temperature and building energy consumption under mesoscale meteorological conditions. Urban Clim. 2024, 53, 101775. [Google Scholar] [CrossRef]
  9. Zou, Y.; Deng, Y.; Xia, D.; Lou, S.; Yang, X.; Huang, Y.; Guo, J.; Zhong, Z. Comprehensive analysis on the energy resilience performance of urban residential sector in hot-humid area of China under climate change. Sustain. Cities Soc. 2023, 88, 104233. [Google Scholar] [CrossRef]
  10. Nieuwenhuijsen, M.; de Nazelle, A.; Pradas, M.C.; Daher, C.; Dzhambov, A.M.; Echave, C.; Gössling, S.; Iungman, T.; Khreis, H.; Kirby, N.; et al. The Superblock model: A review of an innovative urban model for sustainability, liveability, health and well-being. Environ. Res. 2024, 251, 118550. [Google Scholar] [CrossRef]
  11. Zhu, W.; Wang, J.; Qin, B. The relationship between urban greenness and mental health: A national-level study of China. Landsc. Urban Plan. 2023, 238, 104830. [Google Scholar] [CrossRef]
  12. Askarizad, R.; He, J. Post-pandemic urban design: The equilibrium between social distancing and social interactions within the built environment. Cities 2022, 124, 103618. [Google Scholar] [CrossRef] [PubMed]
  13. Liu, S.; Wang, Y.; Liu, X.; Yang, L.; Zhang, Y.; He, J. How does future climatic uncertainty affect multi-objective building energy retrofit decisions? Evidence from residential buildings in subtropical Hong Kong. Sustain. Cities Soc. 2023, 92, 104482. [Google Scholar] [CrossRef]
  14. Sonta, A.; Jiang, X. Rethinking walkability: Exploring the relationship between urban form and neighborhood social cohesion. Sustain. Cities Soc. 2023, 99, 104903. [Google Scholar] [CrossRef]
  15. Jiuwen, S.; Xiaoxu, X.; Qiangmin, X.; Weihao, S. Impact of urban form on housing affordability stress in Chinese cities: Does public service efficiency matter? Cities 2024, 145, 104682. [Google Scholar] [CrossRef]
  16. Sun, C.; Lian, W.; Liu, L.; Dong, Q.; Han, Y. The impact of street geometry on outdoor thermal comfort within three different urban forms in severe cold region of China. Build. Environ. 2022, 222, 109342. [Google Scholar] [CrossRef]
  17. Li, J.; Liu, N. The perception, optimization strategies and prospects of outdoor thermal comfort in China: A review. Build. Environ. 2020, 170, 106614. [Google Scholar] [CrossRef]
  18. Potchter, O.; Cohen, P.; Lin, T.-P.; Matzarakis, A. Outdoor human thermal perception in various climates: A comprehensive review of approaches, methods and quantification. Sci. Total Environ. 2018, 631–632, 390–406. [Google Scholar] [CrossRef] [PubMed]
  19. Rodríguez-Algeciras, J.; Tablada, A.; Nouri, A.S.; Matzarakis, A. Assessing the influence of street configurations on human thermal conditions in open balconies in the Mediterranean climate. Urban Clim. 2021, 40, 100975. [Google Scholar] [CrossRef]
  20. Conzález Couret, D.; Collado Baldoquin, N.; de La Paz Pérez, G.A.; Rueda Guzmán, L.A. Urban variables for adaptation to global warming in a hot-humid climate. Cuban cities as a case study. Urban Clim. 2023, 51, 101633. [Google Scholar] [CrossRef]
  21. Paramita, B.; Kusuma, H.E.; Matzarakis, A. Urban performance based on biometeorology index in high-density, hot, and humid cities. Sustain. Cities Soc. 2022, 80, 103767. [Google Scholar] [CrossRef]
  22. Xu, Y.; Yang, J.; Zheng, Y.; Li, W. Impacts of two-dimensional and three-dimensional urban morphology on urban thermal environments in high-density cities: A case study of Hong Kong. Build. Environ. 2024, 252, 111249. [Google Scholar] [CrossRef]
  23. Yin, S.; Hua, J.; Ren, C.; Liu, S.; Lin, H.; Huang, S.; Wang, K.; Ma, J.; Xiao, Y. Impact of synoptic condition on urban microclimate variation: A measurement study in a humid subtropical city during summer season. Urban Clim. 2023, 47, 101350. [Google Scholar] [CrossRef]
  24. Ahmadian, E.; Sodagar, B.; Bingham, C.; Elnokaly, A.; Mills, G. Effect of urban built form and density on building energy performance in temperate climates. Energy Build. 2021, 236, 110762. [Google Scholar] [CrossRef]
  25. Rostami, E.; Nasrollahi, N.; Khodakarami, J. A comprehensive study of how urban morphological parameters impact the solar potential, energy consumption and daylight autonomy in canyons and buildings. Energy Build. 2024, 305, 113904. [Google Scholar] [CrossRef]
  26. Oh, M.; Jang, K.M.; Kim, Y. Empirical analysis of building energy consumption and urban form in a large city: A case of Seoul, South Korea. Energy Build. 2021, 245, 111046. [Google Scholar] [CrossRef]
  27. Gu, X.; Wu, Z.; Liu, X.; Qiao, R.; Jiang, Q. Exploring the Nonlinear Interplay between Urban Morphology and Nighttime Thermal Environment. Sustain. Cities Soc. 2024, 101, 105176. [Google Scholar] [CrossRef]
  28. Wu, Z.; Qiao, R.; Zhao, S.; Liu, X.; Gao, S.; Liu, Z.; Ao, X.; Zhou, S.; Wang, Z.; Jiang, Q. Nonlinear forces in urban thermal environment using Bayesian optimization-based ensemble learning. Sci. Total Environ. 2022, 838, 156348. [Google Scholar] [CrossRef]
  29. Chen, Y.; Yang, J.; Yang, R.; Xiao, X.; Xia, J. Contribution of urban functional zones to the spatial distribution of urban thermal environment. Build. Environ. 2022, 216, 109000. [Google Scholar] [CrossRef]
  30. Kamal, A.; Kadam, S.T.; Hou, D.; Hassan, I.G.; Wang, L.; Sezer, N.; Rahman, M.A. Detailed profiling of high-rise building energy consumption in extremely hot and humid climate. Clean. Energy Syst. 2023, 4, 100060. [Google Scholar] [CrossRef]
  31. Zhang, M.; Gao, Z. Effect of urban form on microclimate and energy loads: Case study of generic residential district prototypes in Nanjing, China. Sustain. Cities Soc. 2021, 70, 102930. [Google Scholar] [CrossRef]
  32. Zhang, J.; Le, X.; Shabunko, V.; Tay, S.E.R.; Sun, H.; Lau, S.S.Y.; Reindl, T. Impact of urban block typology on building solar potential and energy use efficiency in tropical high-density city. Appl. Energy 2019, 240, 513–533. [Google Scholar] [CrossRef]
  33. Natanian, J.; Aleksandrowicz, O.; Auer, T. A parametric approach to optimizing urban form, energy balance and environmental quality: The case of Mediterranean districts. Appl. Energy 2019, 254, 113637. [Google Scholar] [CrossRef]
  34. Natanian, J.; Wortmann, T. Simplified evaluation metrics for generative energy-driven urban design: A morphological study of residential blocks in Tel Aviv. Energy Build. 2021, 240, 110916. [Google Scholar] [CrossRef]
  35. Acero, J.A.; Koh, E.J.Y.; Ruefenacht, L.A.; Norford, L.K. Modelling the influence of high-rise urban geometry on outdoor thermal comfort in Singapore. Urban Clim. 2021, 36, 100775. [Google Scholar] [CrossRef]
  36. Deevi, B.; Chundeli, F.A. Quantitative outdoor thermal comfort assessment of street: A case in a warm and humid climate of India. Urban Clim. 2020, 34, 100718. [Google Scholar] [CrossRef]
  37. Yang, J.; Shi, Q.; Menenti, M.; Wong, M.S.; Wu, Z.; Zhao, Q.; Abbas, S.; Xu, Y. Observing the impact of urban morphology and building geometry on thermal environment by high spatial resolution thermal images. Urban Clim. 2021, 39, 100937. [Google Scholar] [CrossRef]
  38. Mirzabeigi, S.; Razkenari, M. Design optimization of urban typologies: A framework for evaluating building energy performance and outdoor thermal comfort. Sustain. Cities Soc. 2022, 76, 103515. [Google Scholar] [CrossRef]
  39. Mangan, S.D.; Koclar Oral, G.; Sozen, I.; Erdemir Kocagil, I. Evaluation of settlement textures in terms of building energy, economic performance, and outdoor thermal comfort. Sustain. Cities Soc. 2020, 56, 102110. [Google Scholar] [CrossRef]
  40. Su, Y.; Li, Z.; Meng, Q.; Zhao, Q.; Wu, X.; Liu, Q.; Wu, Z.; Wang, C. Simulation and optimization of thermal comfort in residential areas based on outdoor morphological parameters. Build. Environ. 2023, 245, 110837. [Google Scholar] [CrossRef]
  41. Ferreira, L.S.; Duarte, D.H.S. Exploring the relationship between urban form, land surface temperature and vegetation indices in a subtropical megacity. Urban Clim. 2019, 27, 105–123. [Google Scholar] [CrossRef]
  42. Yang, J.; Yang, Y.; Sun, D.; Jin, C.; Xiao, X. Influence of urban morphological characteristics on thermal environment. Sustain. Cities Soc. 2021, 72, 103045. [Google Scholar] [CrossRef]
  43. Maharoof, N.; Emmanuel, R.; Thomson, C. Compatibility of local climate zone parameters for climate sensitive street design: Influence of openness and surface properties on local climate. Urban Clim. 2020, 33, 100642. [Google Scholar] [CrossRef]
  44. Banerjee, S.; Pek, R.X.Y.; Yik, S.K.; Ching, G.N.; Ho, X.T.; Dzyuban, Y.; Crank, P.J.; Acero, J.A.; Chow, W.T.L. Assessing impact of urban densification on outdoor microclimate and thermal comfort using ENVI-met simulations for Combined Spatial-Climatic Design (CSCD) approach. Sustain. Cities Soc. 2024, 105, 105302. [Google Scholar] [CrossRef]
  45. Li, K.; Liu, X.; Zhang, H.; Ma, J.; He, B.-J. Evaluating and improving the adaptability of commonly used indices for predicting outdoor thermal sensation in hot and humid residential areas of China. Dev. Built Environ. 2023, 16, 100278. [Google Scholar] [CrossRef]
  46. Zheng, X.; Chen, L.; Yang, J. Simulation framework for early design guidance of urban streets to improve outdoor thermal comfort and building energy efficiency in summer. Build. Environ. 2023, 228, 109815. [Google Scholar] [CrossRef]
  47. He, P.; Xue, J.; Shen, G.Q.; Ni, M.; Wang, S.; Wang, H.; Huang, L. The impact of neighborhood layout heterogeneity on carbon emissions in high-density urban areas: A case study of new development areas in Hong Kong. Energy 2023, 287, 113002. [Google Scholar] [CrossRef]
  48. Chatzidimitriou, A.; Yannas, S. Street canyon design and improvement potential for urban open spaces; the influence of canyon aspect ratio and orientation on microclimate and outdoor comfort. Sustain. Cities Soc. 2017, 33, 85–101. [Google Scholar] [CrossRef]
  49. Banihashemi, F.; Weber, M.; Lang, W. Model order reduction of building energy simulation models using a convolutional neural network autoencoder. Build. Environ. 2022, 207, 108498. [Google Scholar] [CrossRef]
  50. Ge, J.; Wang, Y.; Zhou, D.; Gu, Z.; Meng, X. Building energy demand of urban blocks in Xi’an, China: Impacts of high-rises and vertical meteorological pattern. Build. Environ. 2023, 244, 110749. [Google Scholar] [CrossRef]
  51. Huang, K.-T.; Li, Y.-J. Impact of street canyon typology on building‘s peak cooling energy demand: A parametric analysis using orthogonal experiment. Build. Environ. 2017, 154, 448–464. [Google Scholar] [CrossRef]
  52. Rhinoceros3D. Available online: https://www.rhino3d.com/en/ (accessed on 26 March 2024).
  53. Design Space Exploration. Available online: https://www.food4rhino.com/en/app/design-space-exploration (accessed on 26 March 2024).
  54. Zhu, S.; Ma, C.; Zhang, Y.; Xiang, K. A hybrid metamodel-based method for quick energy prediction in the early design stage. J. Clean. Prod. 2021, 320, 128825. [Google Scholar] [CrossRef]
  55. EnergyPlus. Available online: https://energyplus.net/ (accessed on 26 March 2024).
  56. Ladybug Tools. Available online: https://www.food4rhino.com/en/app/ladybug-tools (accessed on 26 March 2024).
  57. Matlab. Available online: https://www.mathworks.com/products/matlab.html (accessed on 26 March 2024).
  58. SALib. Available online: https://github.com/SALib/SALib (accessed on 26 March 2024).
  59. GH_CPYTHON. Available online: https://www.food4rhino.com/en/app/ghcpython (accessed on 26 March 2024).
  60. GB55015-2021; General Code for Energy Efficiency and Renewable Energy Application in Buildings. Standardization Administration of China: Beijing, China, 2021.
  61. Hopfe, C.J.; Hensen, J.L.M. Uncertainty analysis in building performance simulation for design support. Energy Build. 2011, 43, 2798–2805. [Google Scholar] [CrossRef]
  62. Ouanes, S.; Sriti, L. Regression-based sensitivity analysis and multi-objective optimisation of energy performance and thermal comfort: Building envelope design in hot arid urban context. Build. Environ. 2024, 248, 111099. [Google Scholar] [CrossRef]
  63. Mottahedi, M.; Mohammadpour, A.; Amiri, S.S.; Riley, D.; Asadi, S. Multi-linear Regression Models to Predict the Annual Energy Consumption of an Office Building with Different Shapes. Procedia Eng. 2015, 118, 622–629. [Google Scholar] [CrossRef]
  64. Manache, G.; Melching, C.S. (Eds.) Sensitivity of Latin hypercube sampling to sample size and distributional assumptions. In Proceedings of the 32nd Congress of the International Association of Hydraulic Engineering and Research, Venice, Italy, 1–6 July 2007. [Google Scholar]
  65. Gagnon, R.; Gosselin, L.; Decker, S. Sensitivity analysis of energy performance and thermal comfort throughout building design process. Energy Build. 2018, 164, 278–294. [Google Scholar] [CrossRef]
  66. Bernardino D’Amico, F.P. A compactness measure of sustainable building forms. R. Soc. Open Sci. 2019, 6, 181265. [Google Scholar] [CrossRef]
Figure 1. Analytical workflow: model acquisition, sampling, simulation, and results analysis.
Buildings 14 01381 g001
Figure 2. Urban block model and control parameter diagram.
Buildings 14 01381 g002
Figure 3. Type 1 model and parameter description.
Buildings 14 01381 g003
Figure 4. Type 2 model and parameter description.
Buildings 14 01381 g004
Figure 5. Type 3 model and parameter description.
Buildings 14 01381 g005
Figure 6. Type 4 model and parameter description.
Buildings 14 01381 g006
Figure 7. Type 5 model and parameter description.
Buildings 14 01381 g007
Figure 8. Type 6 model and parameter description.
Buildings 14 01381 g008
Figure 9. Scatter matrix of Type 1 model’s control parameters.
Buildings 14 01381 g009
Figure 10. Scatter matrix of Type 2 and Type 3 models’ control parameters.
Buildings 14 01381 g010
Figure 11. Scatter matrix of Type 4 model’s control parameters.
Buildings 14 01381 g011
Figure 12. Scatter matrix of Type 5 and Type 6 models’ control parameters.
Buildings 14 01381 g012
Figure 13. Scatter matrix of Type 1-3 models’ descriptive parameters.
Buildings 14 01381 g013
Figure 14. Scatter matrix of Type 4–6 models’ descriptive parameters.
Buildings 14 01381 g014
Figure 15. Sensitivity analysis of six layout descriptive parameters.
Buildings 14 01381 g015
Figure 16. Correlation analysis of L/A and building energy consumption.
Buildings 14 01381 g016
Figure 17. Correlation analysis of building energy consumption per unit area and S/V.
Buildings 14 01381 g017
Table 1. Several typical block morphology models.
Satellite Map ExtractionModel Diagram
Single Point Style:
A single square-shaped building volume is arranged centrally.
Buildings 14 01381 i001Buildings 14 01381 i002
Enclosed Style:
Buildings are arranged along the perimeter of the street, forming an enclosed layout.
Buildings 14 01381 i003Buildings 14 01381 i004
Semi-Enclosed Style:
In a U-shape, buildings are primarily arranged along the north, east, and west sides of the site, while the south side remains open.
Buildings 14 01381 i005Buildings 14 01381 i006
Row Style:
Buildings are arranged in a long, rectangular shape, with their long edges parallel to each other.
Buildings 14 01381 i007Buildings 14 01381 i008
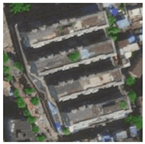
Four-Point Style:
Four square-shaped building volumes are arranged along the four corners of the site.
Buildings 14 01381 i009Buildings 14 01381 i010
Nine-Point Style:
Nine building volumes are arranged in a grid pattern.
Buildings 14 01381 i011Buildings 14 01381 i012
Disclaimer/Publisher’s Note: The statements, opinions and data contained in all publications are solely those of the individual author(s) and contributor(s) and not of MDPI and/or the editor(s). MDPI and/or the editor(s) disclaim responsibility for any injury to people or property resulting from any ideas, methods, instructions or products referred to in the content.

