
Laboratory Evaluation of Strength Performance of Full-Depth Reclamation with Portland Cement Material

1
College of Energy and Transportation Engineering, Inner Mongolia Agricultural University, Hohhot 010018, China
2
Henan Zhongping Jiaoke Research and Design Institute Co., Ltd., Pingdingshan 467000, China
3
School of Civil Engineering and Environment, Zhengzhou University of Aeronautics, Zhengzhou 450046, China
4
School of Transportation Science and Engineering, Civil Aviation University of China, Tianjin 300300, China
*
Author to whom correspondence should be addressed.
Coatings 2024, 14(5), 573; https://doi.org/10.3390/coatings14050573
Submission received: 10 April 2024
/
Revised: 26 April 2024
/
Accepted: 1 May 2024
/
Published: 6 May 2024
(This article belongs to the Special Issue Surface Treatment and Mechanical Properties of Sustainable Pavement Materials)
Abstract
:Full-depth reclamation with Portland cement (FDR-PC) represents an innovative cold recycling technology for pavements, holding significant promise due to its capacity to reuse deteriorated pavement base layers. This paper investigates the key factors influencing the strength properties of FDR-PC. The results indicate that, compared to the static compaction method, the vibratory compaction method yields cold-recycled mixtures with higher maximum dry density and unconfined compressive strength (UCS). Increasing the cement content and base-to-surface ratio, extending the curing time, and raising the curing temperature all contribute to enhancing UCS. Furthermore, increasing the base-to-surface ratio and cement content enhances both indirect tensile strength and flexural strength. An approximate linear correlation exists between indirect tensile strength and UCS, as well as between flexural strength and UCS. The strength characteristics of FDR-PC were comprehensively characterized in this study, providing effective verification of its applicability.
1. Introduction
In the domain of road reconstruction, a prominent technical system known as full-depth reclamation (FDR) has emerged in recent years, employing on-site cold recovery techniques. This innovative method utilizes on-site cold recovery equipment to simultaneously crush the surface and base of the old asphalt pavement, incorporating adhesive material and water to create a recycled mixture that is subsequently applied as a sub-base, base, or underlayer in the new road structure. The bonding materials utilized in FDR encompass asphalt-based substances, such as emulsified asphalt and foamed asphalt, or inorganic bonding agents like cement, lime, etc. Considering the growing demand for the reutilization of aged pavement structures on national highways in China, full-depth reclamation with Portland cement (FDR-PC) exhibits greater potential for widespread adoption within China.
Comparative analyses demonstrate that FDR-PC offers distinct advantages over other pavement rehabilitation techniques, such as lower energy use, reduced carbon dioxide emissions, and fewer environmental impacts. The efficacy of FDR-PC hinges on understanding the mechanical properties of recycled materials, which are vital for assessing pavement performance and longevity. Key characteristics, including strength, stiffness, and durability, dictate FDR-PC’s suitability for rehabilitation projects. Moreover, developing effective curing methods and strategies to minimize cracking is essential to mitigate common issues like shrinkage cracks and early fatigue fractures [1].
Studying the mechanical properties of FDR-PC is of paramount importance, particularly concerning its strength parameters. The mix design methods provided by the United States [2], Spain [3], Germany [4], Australia and New Zealand [5], South Africa [6], and Brazil [7] all regard the 7-day UCS as the primary design parameter. Moreover, tensile strength is also considered a pivotal parameter in designing pavement structures, as the bottom layer of the recycled pavements suffer the tensile stress failure.
FDR-PC is an emerging pavement recycling technology. When investigating its mechanical properties, it is prudent to draw upon established counterparts in the field. According to Chinese standard Technical Specifications for Highway Asphalt Pavement Recycling (JTG/T 5521-2019) [8], the technical framework of FDR-PC resembles that of inorganic-stabilized recycled materials. Consequently, it is viable to draw upon research concerning cement-stabilized crushed stone (CSCS) as a basis for designing experimental investigations into the mechanical properties of FDR-PC. The UCS is widely regarded as a pivotal metric for assessing the quality of CSCS [9]. Abundant research indicates that the compaction degree, cement content, curing time, and curing temperature are influential factors significantly affecting the UCS of CSCS.
Jiang et al. investigated the impact of the quasi-static compaction method (QSCM) and the vertical vibration compaction method (VVCM) on the UCS of CSCS [10] and concurrently examined the UCS under varying cement contents and curing times. The findings revealed that, irrespective of suspended dense structure specimens or skeletal dense structure specimens, VVCM demonstrates greater UCS. Through the entire curing process, the UCS growth rate of CSCS material utilizing VVCM markedly out-paced that of CSCS material employing QSCM, demonstrating VVCM’s superior capability in achieving higher UCS. Furthermore, some studies [11,12] also indicate that the density of a mixture is significantly decided by the degree of compaction. The UCS increases proportionally with the augmentation of dry density, and these two factors exhibit a logarithmic–linear relationship.
The inclusion of cement enhances both the adhesion and mechanical properties of CSCS. Numerous preceding studies [13,14,15,16,17] have corroborated the nearly linear correlation between cement content, ranging from 3% to 7%, and UCS for a specific gravel type. Moreover, within the range of 2% to 5% (cement content), both suspended dense structures and skeleton dense structures, prepared through QSCM and VVCM, exhibit an augmentation in UCS with increasing cement content [10]. Li [18] noted a significantly positive effect on the UCS of CSCS when the cement content was below 5%. The skeleton dense structure exhibits approximately 19% higher early-stage UCS and around 10% higher late-stage UCS compared to the suspended dense structure counterparts. Sun et al. [19] revealed that, within the range of 4.5% to 4.8% cement content, the gradation type exerts a relatively minimal influence on the UCS of 7-day specimens. While the UCS of specimens decreased after 28 days of curing, the magnitude of decline gradually diminished.
The influence of curing time on UCS has been extensively documented in numerous studies [15,20]. Li’s [13] research suggested an approximate logarithmic–linear relationship between UCS and curing time. The results of Lu et al. [21] indicate a progressive enhancement in the UCS of CSCS over time, reaching stabilization after approximately 90 days of curing. CSCS with shorter curing times exhibits significantly greater damage compared to specimens with longer curing times.
Regarding curing temperature, numerous studies [22,23] have addressed high-temperature curing, with the majority of findings indicating its potential to enhance initial UCS. Escalante et al. [24] conducted UCS tests on CSCS at five temperatures ranging from 10 °C to 60 °C, indicating that elevated temperatures indeed enhance initial UCS, although there is a subsequent decline in UCS under prolonged exposure to high temperatures. Similarly, Wang et al. [25] investigated the UCS of calcium sulfoaluminate cement under varied curing temperatures, observing an initial increase in UCS with rising temperatures yet a subsequent decrease within the range of 40 °C to 80 °C. Regarding low-temperature curing, Price et al. [26] found that the rate of UCS development in mixed concrete is significantly slower at low temperatures compared to room temperature. Husem et al. [27] investigated the UCS of both ordinary concrete and high-performance concrete subjected to standard curing temperatures as well as various low-temperature conditions. The findings indicated that the UCS at temperatures of 10 °C and below is inferior to the standard curing conditions. Kim et al. [28] investigated the UCS development under curing temperatures of 5 °C, 20 °C, and 40 °C. The findings suggested slight differences during the initial process, while appearing nearly indistinctive with time. Xu et al. [29] simulated local air temperature fluctuations and found that the UCS of 5% CSCS increases with prolonged curing time, with the rate of gain being lower at low temperatures compared to standard temperatures. Marzouk et al. [30] conducted experiments over three months at five temperatures ranging from −10 °C to 20 °C, revealing a proportional relationship between UCS and temperature. Furthermore, Saul [31] proposed the concept of maturity in 1951, defining it as the product of curing time and temperature. The Nurse–Saul maturity function indicates that the UCS will be approximately the same when maturity is equivalent.
Considering research on tensile strength, several studies [17,32] indicate that the ratio of flexural strength to UCS ranges between 1:10 and 1:6, with the ratio of low-strength mixtures reaching 1:6 and high-strength mixtures being 1:10, approximating a linear relationship. Additionally, studies [33,34,35] suggest an approximate linear relationship between UCS and indirect tensile strength. Therefore, it can be inferred that the parameters influencing UCS also influence tensile strength.
Several recent studies have investigated the mechanical properties of full-depth reclamation with Portland cement (FDR-PC). Ghanizadeh et al. [36] examined the UCS of cold-recycled mixtures composed of varying base-to-surface ratios of reclaimed asphalt pavement (RAP) (0%, 20%, and 40%) mixed with two types of soil and different cement contents (3%, 4%, and 5%). The findings revealed that increasing cement content while reducing RAP content could enhance the UCS. Gonzalo et al. [37] analyzed the relationship between UCS and tensile strength across 24 groups of FDR-PC specimens. The study found linear correlations between UCS and indirect tensile strength; indirect tensile strength and flexural strength; as well as among UCS, indirect tensile strength, and flexural strength. Ghanizadeh et al. [38] employed multivariate adaptive splines to analyze the UCS of various mixtures made of FDR-PC cold-recycled mixtures. The study concluded that cement content, RAP content, optimal moisture content, and curing time had the most significant impact on UCS.
The primary objective of this paper is to investigate the principal factors influencing the UCS, indirect tensile strength, and flexural strength of FDR-PC. Based on the research on the UCS and the tensile strength of CSCS mentioned above, and relying upon the ordinary road asphalt pavement reclamation projects in Inner Mongolia in China, this paper employed the static compaction method and the vibratory compaction method to fabricate specimens. The specimens were systematically subjected to varying cement contents (4%, 5%, and 6%), base-to-surface ratios (10:0, 8:2, and 6:4), curing temperatures (20 °C, 30 °C, 40 °C, and 50 °C), and curing times (3 days, 7 days, 28 days, and 90 days) to assess the UCS. Additionally, the indirect tensile strength and flexural strength of specimens were evaluated under different cement contents (4%, 5%, and 6%) and base-to-surface ratios (10:0, 8:2, and 6:4).
2. Materials and Specimen Preparation
2.1. Raw Materials
FDR-PC material compositions: RAP, reclaimed inorganic-binder-stabilized aggregate (RAI), cement, and water. The reclaimed materials were sourced from the 110 National Highway, a secondary road within Inner Mongolia in China. The old pavement comprises a 4 cm layer of asphalt material (AC-16) and a 20 cm base layer of cement-stabilized crushed stone (CSCS). The RAP and RAI are obtained by separately milling the asphalt layer and base layer using a milling machine.
After conducting drying treatment and screening experiments on RAP and RAI, the resulting materials were mixed in accordance with three different mass ratios to produce recycled ore, as illustrated in Figure 1. The grade curve of the blended recycled materials conforms to the specifications outlined in Highway Asphalt Pavement Recycling (JTG/T 5521-2019) [7], as depicted in Figure 2. In this study, Figure 2 was incorporated to illustrate the design of three representative recycled materials, which were formulated based on varying mass ratios of RAI and RAP. These materials exhibited distinct base-to-surface ratios, namely 10:0, 8:2, and 6:4. The selection of the aforementioned three representative base-to-surface ratios takes into account factors such as the thickness ratio between old asphalt pavement and the base layer, actual construction conditions, and economic considerations in China’s national road system.
This study employed cement of 42.5-grade ordinary Portland cement, with technical specifications detailed in Table 1. The test water requirements can be met by ordinary drinking water.
2.2. Determining the Optimum Water Content and the Maximum Dry Density
Before preparing the strength test specimen, it is essential to determine the maximum dry density and optimal moisture content of th eFDR-PC mixture. Following the testing methodology delineated in the Chinese standard JTG E51-2009 [39], the heavy compaction test method (T0804-1994) and vibration compaction test method (T0842-2009) were utilized to determine the maximum dry density and optimal water content of FDR-PC. Specimens with different cement contents, consisting of 4%, 5%, and 6% of the mass of the recycled mixture, were individually prepared. By manipulating the water content, distinct curves depicting the relationship between dry density and water content for each mixture were obtained. The peaks of these curves serve as indicators to determine the optimal water content and maximum dry density, with the combined results presented in Table 2.
2.3. Specimen Preparation
The cylindrical specimens (with a diameter of 150 mm and a height of 150 mm) used for the UCS test were fabricated using static forming and vibration forming methods. The procedures for static forming and vibration forming followed the guidelines specified in JTG E51-2009 (T0843-2009) [39] and JTG D50-2006(Appendix A) [40], respectively. The majority of the specimens underwent standard curing in a designated room, specifically 6-day curing followed by 1-day soaking. The control conditions were as follows: the air temperature was maintained at 20 ± 2 °C and the relative humidity was kept at 95%. Another portion of the specimens was subjected to prolonged exposure to elevated temperatures and extended duration.
The cylinder specimens used in the splitting strength test have the same size as all the cylinder specimens in the UCS test, which can be formed via static pressing according to the specification JTG E51-2009 (T0843-2009) [39]. The specimens were then subjected to a standard 90-day curing period. A total of nine sets of specimens were prepared, comprising three base-to-surface ratios (10:0, 8:2, and 6:4) and three cement contents (4%, 5%, and 6%).
The flexural tensile strength test utilizes prisms measuring 100 mm × 100 mm × 400 mm as specimens, which can be prepared following the static pressure method outlined in JTG E51-2009 (T0844-2009) [39]. Subsequently, a standard curing period of 90 days was employed for the specimens prior to testing. A total of nine sets of specimens were prepared, comprising three base-to-surface ratios (10:0, 8:2, and 6:4) and three cement contents (4%, 5%, and 6%).
The weight of FDR-PC required for the preparation process of various test pieces mentioned above can be calculated and controlled using Equation (1), based on the maximum dry density and optimum water content.
In Equation (1), signifies the weight of an individual specimen, ; denotes the volume relative to a single specimen, ; represents the maximum dry density, ; and indicates the optimum water content.
3. Test Method
3.1. Unconfined Compressive Strength Test Method
The unconfined compressive strength test was conducted according to the JTG E51-2009 (T0806-1994) [39] procedure, as illustrated in Figure 3. During the test, it is imperative to maintain a constant loading rate of 1 mm/min while meticulously documenting the maximum pressure P at the precise moment of specimen failure. The UCS value for each specimen was calculated using Equation (2).
In Equation (2), represents the unconfined compressive strength of the specimen, ; represents the maximum pressure applied to the specimen at the point of failure, ; and represents the diameter of the specimen, .
3.2. Splitting Strength Test Method
The splitting strength tests of nine groups of cylinder specimens were conducted according to the JTG E51-2009 (T0806-1994) [39] procedure, as illustrated in Figure 4. During the test, the deformation rate of the specimen should be uniformly increased while maintaining a constant loading rate of 1 mm/min. The maximum pressure P at the point of specimen failure should be accurately recorded. The ITS value for each specimen was calculated using Equation (3).
In Equation (3), represents the indirect tensile strength of the specimen, ; represents the maximum pressure applied to the specimen at the point of failure, ; and represents the height of the specimen, .
3.3. Flexural–Tensile Strength Test Method
Testing is conducted following the JTG E51-2009, as specified by T0851-2009 [39]. The specimens were placed on fixtures, with the load direction consistent with the pressure direction during specimen formation. Upper and lower pressure blocks were positioned at one-third points along the length of the specimen, as shown in Figure 5. Rapid loading was applied at a rate of 50 mm/min, with the ultimate load (P) recorded at failure. The formula for calculating flexural tensile strength is provided as Equation (4).
In Equation (3), represents the flexural tensile strength of the specimen, . denotes the ultimate load at failure of the specimen, . signifies the span, which is the distance between two supports, . indicates the width of the specimen, . denotes the height of the specimen, .
4. Results and Discussion
4.1. Influencing Factors of UCS
4.1.1. Cement Content and Base-to-Surface Ratios
The experimental results of the 7 d standard UCS of FDR-PC cold-recycled mixtures under different cement contents and base-to-surface ratios are presented in Table 3. Figure 6 illustrates a bar chart depicting the data from Table 3.
As evident from Figure 6, the UCS under varying cement contents demonstrated an upward trend with an increase in the base-to-surface ratio. Specifically, the mixture’s UCS reached its peak when the base-to-surface ratio was 10:0, followed by a slightly reduced value at a base-to-surface ratio of 8:2, and a minimum value at a base-to-surface ratio of 6:4. This phenomenon is attributed to the increase in the proportion of surface layer materials, indicating a higher content of RAP materials with relatively lower UCS. Additionally, the UCS of recycled mixtures depends on the adhesive properties of the cement, but the presence of an asphalt film on the surface of RAP materials reduces the contact between cement and RAP materials, hindering hydration reactions and resulting in a decrease in strength.
In addition, with an increase in cement content, the UCS exhibited an initial rapid increase in transitioning to a stable state. Notably, the UCS achieved through the vibratory compaction method surpasses that obtained through the static compaction method. For example, at a base-to-surface ratio of 8:2, changing the compaction method results in a sequential increase of 1.30, 1.31, and 1.31 times in UCS for cement contents of 4%, 5%, and 6%, respectively, highlighting the superior UCS exhibited by specimens fabricated through the vibratory compaction method.
Furthermore, in accordance with the regulations, the unconfined compressive strength (UCS) of the large flow base level should range between 4.0 MPa and 6.0 MPa, while for the sub-base it should be within 3.0 MPa to 5.0 MPa. Consequently, even when employing the static compaction method, the 7-day standard UCS values of the nine types of FDR-PC cold regeneration mixtures designed in this study fall between 4.1 and 5.8 MPa, satisfying Chinese secondary and below highway specifications requirements. This demonstrates that when an adequate cement dosage is utilized and a reasonable base ratio is maintained, FDR recycled material can be effectively employed in road bases.
4.1.2. Curing Temperature
To study the influence pattern of curing temperatures on the UCS of FDR-PC cold-recycled mixtures, experiments were conducted to determine the 7 d UCS under varying curing temperature conditions. The results are presented in Table 4 and Figure 7. The selection of the curing temperature range was made considering the recommended ranges stipulated by standards and the pragmatic conditions encountered in the field. Simultaneously, it was essential to ensure that the temperature settings would not excessively impact the stability of RAP.
According to Table 4 and Figure 7, it is evident that, whether employing the static compaction method or the vibratory compaction method, an overall increase in the curing temperature is conducive to the development of UCS in FDR-PC cold-recycled mixtures. This phenomenon arises from the accelerated formation of hydration products due to temperature rise. To clarify the pattern of UCS variation more clearly, Figure 5 presents a bar chart illustrating the data from Table 5. The graph reveals not only an increase in UCS with rising curing temperature but also a significant difference between 20 °C and 40 °C, indicating a notable enhancement in UCS within this temperature range. Beyond 30 °C, while UCS continues to rise, the rate of increase gradually diminishes. For instance, with a base-to-surface ratio of 8:2, the UCS corresponding to the static compaction method increases by factors of 1.10, 1.09, and 1.03, whereas for the vibratory compaction method the increases occur by factors of 1.11, 1.07, and 1.02, respectively. Moreover, the influence of curing temperature on UCS under different base-to-surface ratios follows a certain regularity, where a larger base-to-surface ratio experiences a more significant effect from curing temperature on its UCS, while a smaller base-to-surface ratio exhibits a lesser impact. For instance, during the curing process at 20 °C~30 °C, as the base-to-surface ratio decreases, the corresponding increases in UCS for the static compaction method are 1.13 times (10:0), 1.10 times (8:2), and 1.06 times (6:4), whereas for the vibratory compaction method the increases are 1.12 times (10:0), 1.10 times (8:2), and 1.04 times (6:4). To explain the observed characteristics, we might consider the impact of temperature on the cement hydration process, which shows larger susceptibility for the higher RAI ratio.
4.1.3. Curing Time
The curing time plays a crucial role in the development of UCS in cement-stabilized materials. Under normal conditions, the standard indoor curing time typically extends to 7 days. However, for FDR-PC cold-recycled mixtures, distinguished by their unique composition that includes RAP, the adequacy of a 7-day curing time to meet practical usage requirements requires further experimental verification. Moreover, few studies have focused on the evolution of UCS in relation to curing time for such materials. Consequently, this section investigates the impact of extended curing time on UCS.
Table 5 illustrates the variation in UCS with curing time under different base-to-surface ratios, with a curing temperature of 20 °C. From the table, it is evident that extending the curing time significantly enhances the UCS, with the growth rate of UCS increasing as the curing time extends. Figure 8 graphically illustrates the impact of curing time on UCS in the form of a bar chart. The graph reveals that the UCS experiences a rapid increase within the 3-day to 7-day curing time, with growth rates ranging from 1.38 to 1.58 times. Beyond 7 days, the rate of UCS growth gradually decelerates, ranging between 1.02 to 1.23 times.
Moreover, when the curing time surpasses 28 days, the rate of UCS growth for FDR-PC cold-recycled mixtures with base-to-surface ratios of 8:2 and 6:4 is notably less obvious compared to the counterpart with a base-to-surface ratio of 10:0. For instance, specimens fabricated using the vibratory compaction method exhibit varying rates of UCS growth at 28 days and 90 days under different base-to-surface ratio conditions, specifically 1.07 times (10:0), 1.03 times (8:2), and 1.02 times (6:4). The reason lies in the relatively lower proportion of cement-stabilized materials within the low base-to-surface mixture, resulting in fewer hydration products. Consequently, once the hydration reaction finishes, the UCS no longer exhibits significant increments. Furthermore, the aging process of RAP may induce material hardening and consequent hardness enhancement, although it is not the primary influencing factor.
4.2. The Tensile Strength of FDR-PC
4.2.1. Indirect Tensile Strength
A summary of the indirect tensile strength results for different FDR-PC cold-recycled mixtures is presented in Table 6, with a graphical representation of the representative values of indirect tensile strength illustrated in Figure 9.
Combining Table 6 and Figure 9, it can be observed that the results of the indirect tensile strength tests exhibit relatively low dispersion, indicating that for FDR-PC cold-recycled mixtures conducting nine parallel tests for each group effectively maintains the coefficient of variation within 15%. This suggests that the quantity of specimens utilized for indirect tensile strength testing evaluation is sufficiently adequate.
For FDR-PC cold-recycled mixtures with a 4% cement content, the indirect tensile strength ranged from 0.4 MPa to 0.6 MPa across the three base-to-surface ratios. For the other two groups with different cement contents, the representative values of indirect tensile strength generally fell within the range of 0.6 to 1.0 MPa. All of these values meet the recommended indirect tensile strength values of 0.4 MPa to 0.6 MPa stipulated in JTG D50-2017 [41]. From this perspective, cautious consideration should be given to the utilization of mixtures with low cement contents and high proportions of RAP in engineering applications.
The indirect tensile strength of FDR-PC cold-recycled mixtures composed of various base-to-surface ratios increases with the rise in cement contents. Comparatively, when the base-to-surface ratio is 6:4, the variation in indirect tensile strength with cement content is more gradual. Across different cement contents, the trend of increasing indirect tensile strength with higher base-to-surface ratios is evident, indicating that the presence of RAP is detrimental to the formation of mixture strength. The fundamental reason lies in the increased proportion of reclaimed asphalt materials affecting the interconnection between cement and aggregates, hindering the smooth formation of cement hydration products. Both the cement content and base-to-surface ratio are the primary factors influencing the indirect tensile strength of mixtures. However, in comparison, the impact of cement content appears to be more significant.
4.2.2. Flexural Strength
A summary of the flexural tensile strength results for each group are provided in Table 7 and Figure 10. For FDR-PC cold-recycled mixtures, each group underwent 12 parallel tests, with the coefficient of variation overall controlled within 10%. This suggests that the quantity of specimens utilized for evaluating flexural strength tests is sufficiently effective.
The flexural strength of FDR-PC cold-recycled mixtures, composed of various base-to-surface ratios, increases with the rise in cement contents. Specifically, at base-to-surface ratios of 10:0, 8:2, and 6:4, the representative values of flexural strength increase by 69%, 58%, and 51%, respectively, with the increase in cement content. Moreover, at each cement content level, the flexural strength of FDR-PC cold-recycled mixtures increases with higher base-to-surface ratios. When the cement content is 4%, 5%, and 6%, the representative values of flexural strength increase by 36%, 34%, and 36%, respectively, with the increase in base-to-surface ratios. These findings indicate that both the cement content and base-to-surface ratio significantly influence the flexural strength of the cold-recycled mixtures. However, the impact of cement content appears to be more significant. Additionally, the effect of the base-to-surface ratio on flexural strength remains relatively stable and is nearly independent of the cement content.
In the test groups with 4% cement content, the flexural strength of FDR-PC cold-recycled mixtures ranges from 0.7 MPa to 1.0 MPa. These results closely align with the recommended flexural strength range of 0.6 MPa to 1.0 MPa for cement-stabilized soil materials outlined in JTG D50-2017 [41]. In the test groups with 5% and 6% cement contents, the flexural strength of FDR-PC cold-recycled mixtures ranges from 1.0 MPa to 1.8 MPa. These results also closely correspond to the recommended flexural strength range of 0.9 MPa to 2.0 MPa for cement-stabilized aggregate materials specified in the aforementioned design specifications. Therefore, from the perspective of flexural strength requirements, when utilizing FDR-PC cold-recycled mixtures for base layers, it is recommended that the cement content not be less than 5%. Particularly when the proportion of old asphalt mixtures is relatively high, a cement content of not less than 6% is recommended.
4.3. The Linear Relationship between UCS and Tensile Strength
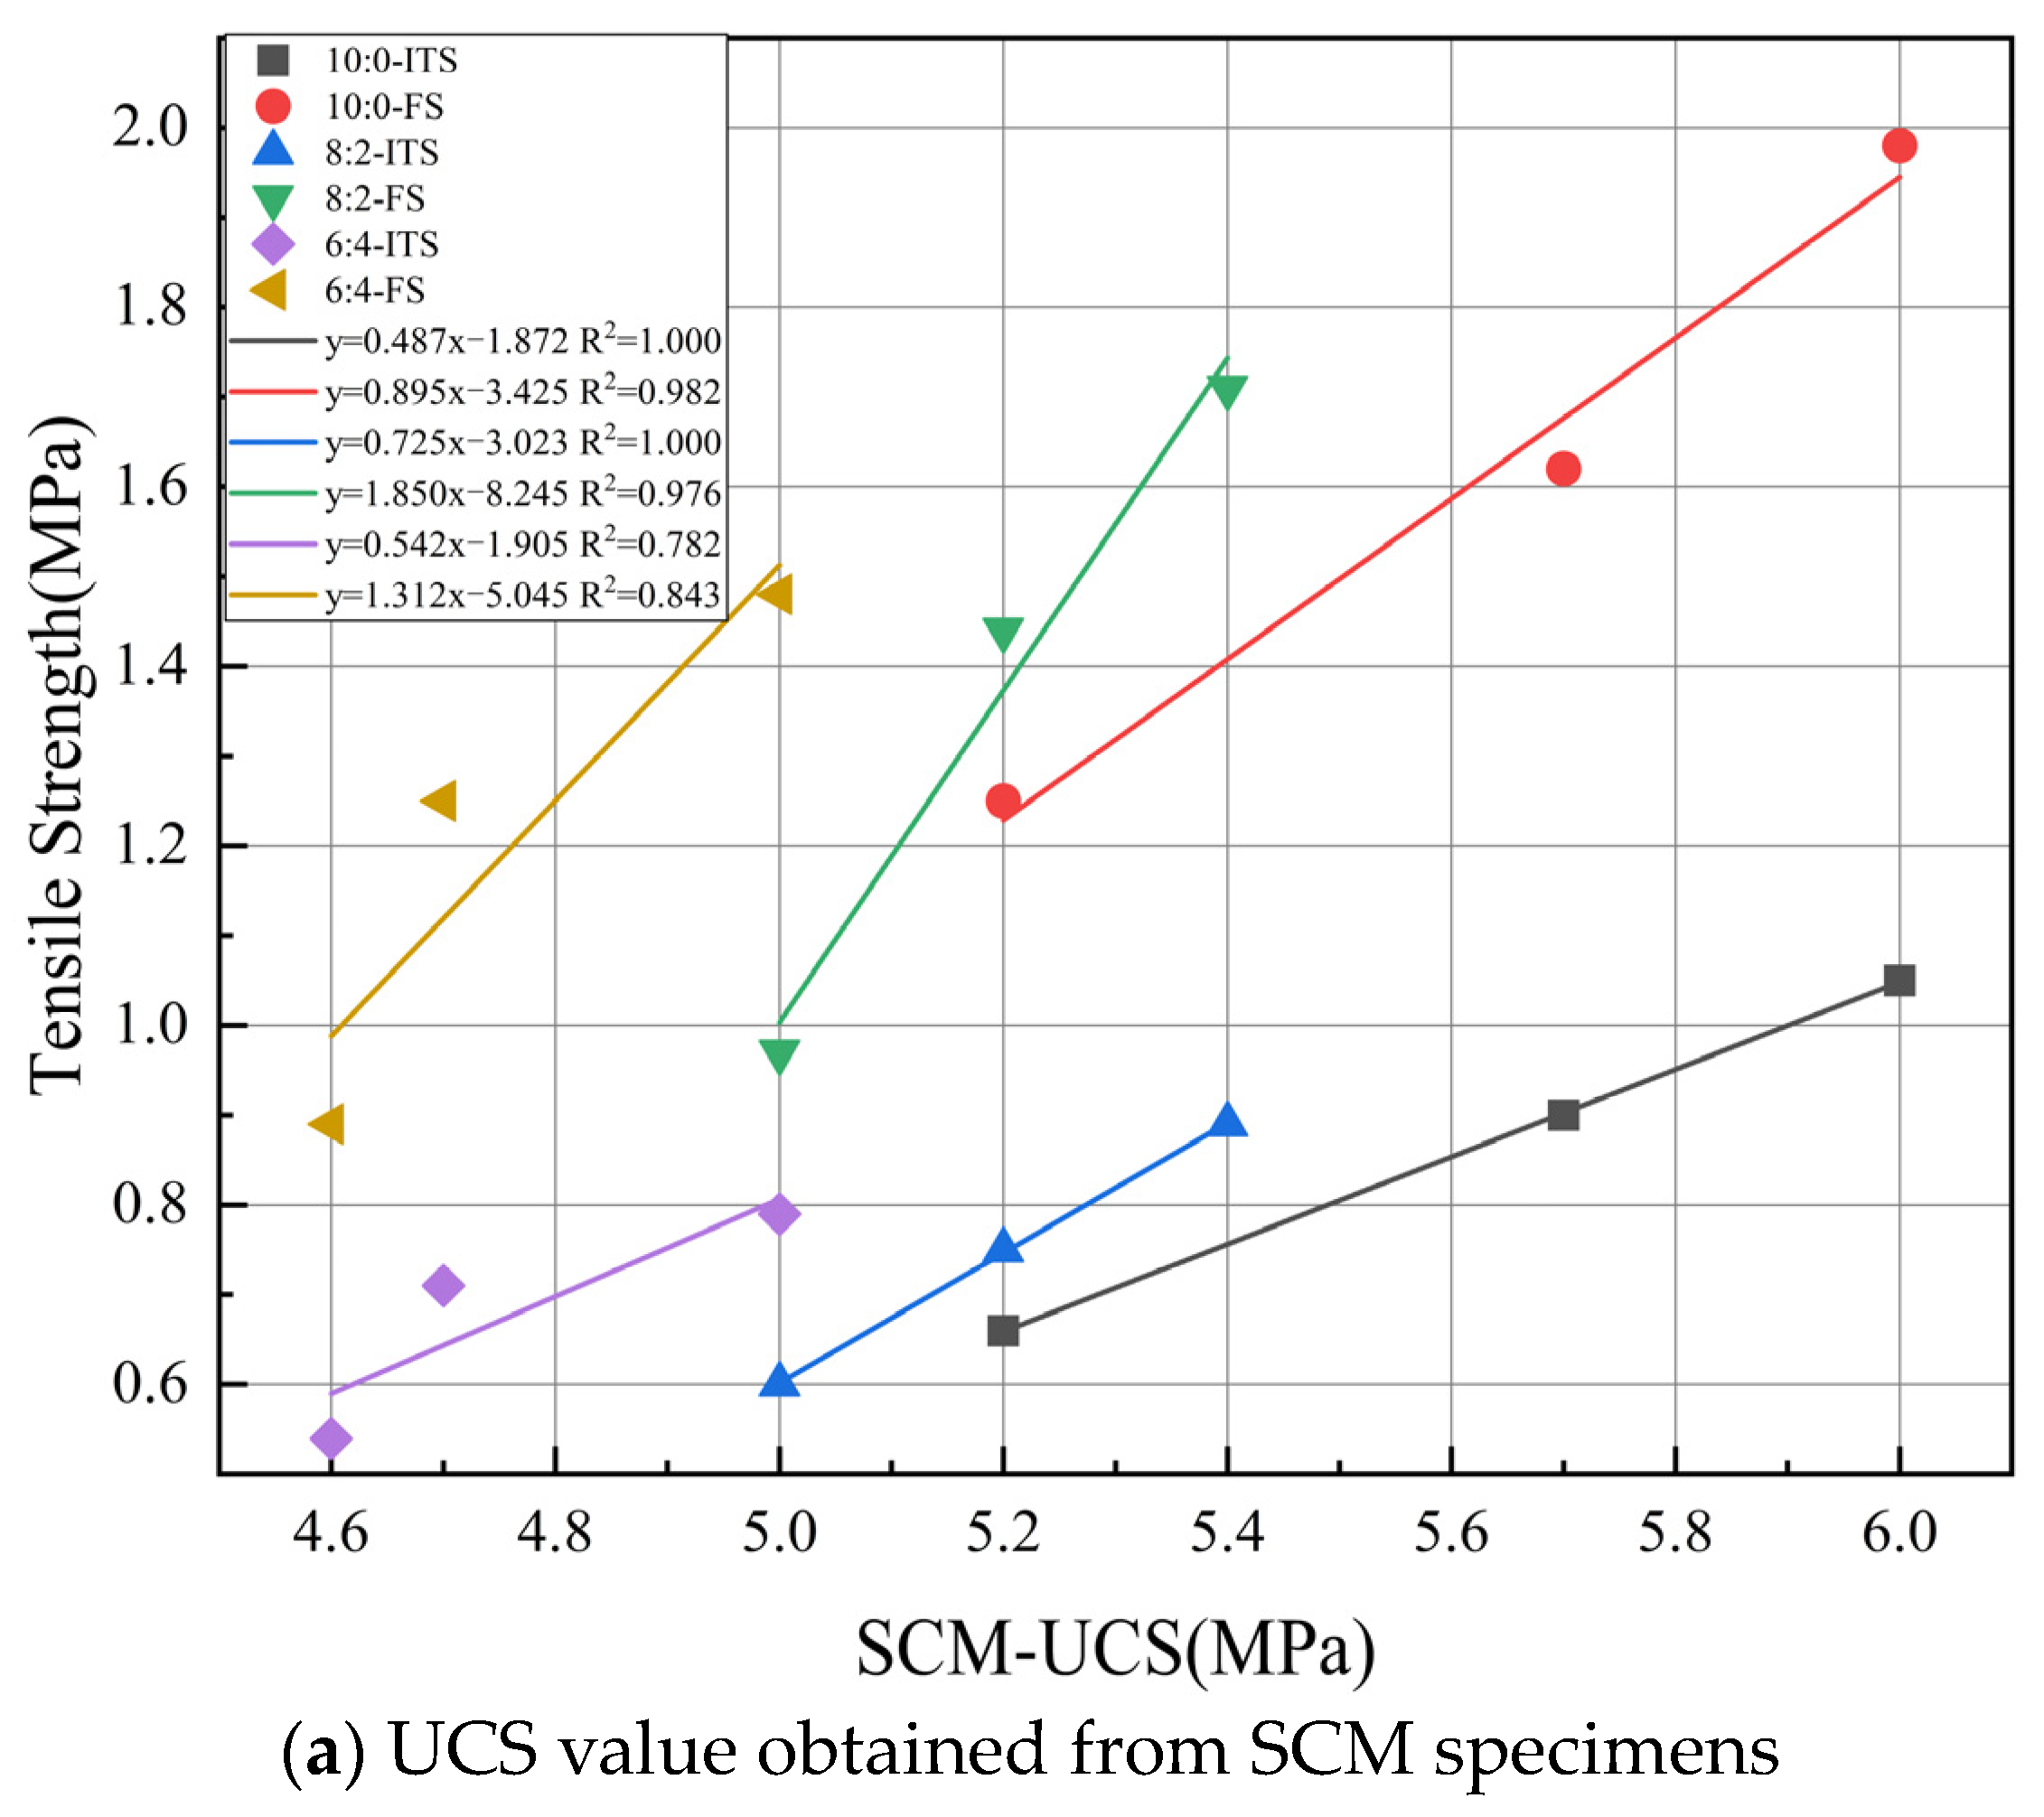
The UCS and tensile strength values were combined for comparison on the same base-to-surface ratio, as depicted in Table 8. The 7 d UCS average values in Table 8 were obtained from the measurements of specimens outlined in Table 3. The indirect tensile strength (ITS) utilized the average value from Table 6, while the flexural strength (FS) utilized the average value from Table 7. Each dataset represents three sets of UCS-ITS and UCS-FS values corresponding to different cement contents under the same base-to-surface ratio. Linear regression was performed on each dataset, and the results are illustrated in Figure 11. The coefficients and of the linear regression equation in Figure 11 are shown in Table 9.
The UCS data in Figure 11a are obtained from specimens formed via SCM. The values of the three groups of UCS-ITS are 0.782~0.999, indicating a strong linear correlation between UCS and ITS, and the values of the three groups of UCS-FS are 0.843~0.999, further confirming a highly significant linear relationship. The UCS data in Figure 11b are obtained from specimens formed via VCM. The values of the three groups of UCS-ITS are 0.866~0.999, indicating a strong linear correlation between UCS and ITS, and the values of the three groups of UCS-FS are 0.939~0.984, further confirming a highly significant linear relationship. Thus, it can be inferred that a significant linear relationship exists between 7 d UCS and tensile strength.
5. Conclusions
This paper investigates the strength parameters of FDR-PC, including UCS, indirect tensile strength, and flexural strength. The study examines the impact of molding methods, cement content, the base-to-surface ratio, curing temperature, and curing time on UCS. Additionally, it explores the effects of the cement content and base-to-surface ratio on indirect tensile strength and flexural strength. These factors are critical for enhancing the effectiveness of road maintenance and extending the lifespan of roads using FDR-PC technology. The significance of this study lies in providing engineers with specific data and guidance to help them select optimal material proportions and curing conditions in practice, thereby enhancing the performance and economic efficiency of road projects. The primary findings are summarized as follows:
- (1)
- A higher cement content and base-to-surface ratio correspond to higher UCS in FDR-PC cold-recycled mixtures. The 7-day standard UCS of FDR-PC mixtures can meet the requirements of ordinary highway base strength, provided that the cement dosage exceeds 4% and the base surface ratio is no less than 6:4.
- (2)
- Compared to static compaction methods, vibration compaction methods can achieve higher unconfined compressive strength (UCS) in FDR-PC recycled mixtures, thereby confirming the feasibility of this testing method in FDR-PC research.
- (3)
- The UCS of the FDR-PC mixture can be enhanced by prolonging the curing duration and elevating the curing temperature, which is analogous to that observed in conventional cement stabilized materials.
- (4)
- Both the ITS and FS exhibit a noticeable increase as the base-to-surface ratio increases, with variation rates reaching up to 30%–40%. Compared to the influence of the base-to-surface ratio, the impact of cement content is more significant. From the perspective of flexural strength requirements, when utilizing FDR-PC mixtures for base layers, it is recommended that the cement content is not less than 5%.
- (5)
- The regression analysis revealed a strong correlation coefficient between the UCS and ITS, as well as between UCS and FS of the FDR-PC mixture, indicating a clear linear relationship among these variables. This suggests that the 7-day standard UCS can serve as a predictor for both 90-day ITS and FS.
The advantages of this study lie in its systematic investigation of multiple key factors affecting the UCS and tensile strengths of FDR-PC, providing practical reference data for engineering applications. However, the limitations of the study include a relatively limited number of samples and a focus on specific experimental conditions. Future research could validate these findings under a broader range of environmental and operational conditions to further enhance the applicability and impact of the research.
Author Contributions
Conceptualization, Y.L. and K.J.; Data curation, Y.L. and C.L.; Formal analysis, B.S.; Funding acquisition, C.L., H.Z. and B.S.; Investigation, C.L., H.Z. and B.S.; Methodology, Y.L. and H.Z.; Project administration, Y.L.; Resources, C.L.; Software, K.J. and B.S.; Visualization, B.S.; Writing—original draft, K.J. and H.Z.; Writing—review and editing, H.Z. All authors have read and agreed to the published version of the manuscript.
Funding
This research was funded by Fundamental Research Funds for the Universities (BR230145); Inner Mongolia Autonomous Region Science and Technology Plan: (2022YFHH0082); Pingdingshan Major Science and Technology Project (2021ZD07); and Fundamental Research Funds for the Central Universities (KJZ53420230066).
Institutional Review Board Statement
Not applicable.
Informed Consent Statement
Not applicable.
Data Availability Statement
The data presented in this study are available on request from the corresponding author.
Conflicts of Interest
As author Chuangdan Luo was employed by the company Henan Zhongping Jiaoke Research and Design Institute Co., Ltd. The remaining authors declare that the research was conducted in the absence of any commercial or financial relationships that could be construed as a potential conflict of interest.
References
- Fedrigo, W.; Nunez, W.P.; Visser, A.T. A review of full-depth reclamation of pavements with Portland cement: Brazil and abroad. Constr. Build. Mater. 2020, 262, 120540. [Google Scholar] [CrossRef]
- Portland Cement Association (PCA). Guide to Full Depth Reclamation (FDR) with Cement; Portland Cement Association (PCA): Skokie, IL, USA, 2005. [Google Scholar]
- Spanish Institute of Cement and Its Applications. Pavement In Situ Recycling with Cement: Technical Guide; Spanish Institute of Cement and Its Applications: Madrid, Spain, 2013. [Google Scholar]
- Wirtgen. Wirtgen Cold Recycling Technology; Wirtgen: Windhagen, Germany, 2012. [Google Scholar]
- Austroads. Mix Design for Stabilized Pavement Materials: Austroads Publication AP-T16; Austroads: Sydney, Australia, 2002. [Google Scholar]
- South African National Roads Agency Limited (SANRAL). South African Pavement Engineering Manual; South African National Roads Agency Limited (SANRAL): Pretoria, South Africa, 2014.
- Franco, F.A.C.P. Mechanistic-Empirical Asphalt Pavement Design Method; Federal University of Rio de Janeiro: Rio de Janeiro, Brazil, 2007.
- JTG/T 5521—2019; Technical Specifications for Highway Asphalt Pavement Recycling. Ministry of Transportation: Beijing, China, 2019.
- Xuan, D.X.; Houben, L.J.M.; Molenaar, A.A.A.; Shui, Z.H. Mechanical properties of cement-treated aggregate material–a review. Mater. Des. 2012, 33, 496–502. [Google Scholar] [CrossRef]
- Jiang, Y.; Fan, L. An investigation of mechanical behavior of cement-stabilized crushed rock material using different compaction methods. Constr. Build. Mater. 2013, 48, 508–515. [Google Scholar] [CrossRef]
- Kolias, S.; Williams, R.I.T. Estimation of the modulus of elasticity of cement stabilized materials. Geotech. Test. J. 1984, 7, 26–35. [Google Scholar] [CrossRef]
- Sherwood, P.T. Soil Stabilization with Cement and Lime; HMSO Press: London, UK, 1995. [Google Scholar]
- Sherwood, P.T. The Properties of Cement Stabilized Materials; Road Research Laboratory: Crowthorne, UK, 1968. [Google Scholar]
- Bell, F.G. Engineering Treatment of Soils; E & FN Spon: London, UK, 1993. [Google Scholar]
- Transport, D.O.; Technical Recommendations for Highways. Cementitious Stabilizers in Road Construction South Africa; Technical Recommendations for Highways: Pretoria, South Africa, 1985. [Google Scholar]
- BS 6031; Code of Practice for Site Investigation. Building Standards Institution: London, UK, 1981.
- Kennedy, J. Cement-Bound Materials for Sub-Bases and Roadbases, Material Selection and Mix Design, Construction and Control Testing; Cement and Concrete Association: Slough, UK, 1983. [Google Scholar]
- Li, M. Experimental Study on Influencing Factors of Strength of Cement Stabilized Macadam. J. Highw. Transp. Res. Dev. 2010, 27, 6–11. [Google Scholar]
- Sun, Z.; Wang, T.; Xu, Z. Trial Study on Influence Factors of Cement-Stabilized Macadam Strength. J. Build. Mater. 2006, 3, 285–290. [Google Scholar]
- Moore, R.K.; Kennedy, T.W.; Hudson, W.R. Factors affecting the tensile strength of cement-treated materials. Highw. Res. Rec. 1970, 315, 64–80. [Google Scholar]
- Lu, S.; Zheng, J.; Zhong, W. Characteristics of Strength, Modulus and Fatigue Damage for Cement Stabilized Macadam in Curing Period. China J. Highw. Transp. 2015, 28, 9–15. [Google Scholar]
- Burg, R.G. The Influence of Casting and Curing Temperature on the Properties of Fresh and Hardened Concrete; Portland Cement Association: Skokie, IL, USA, 1996. [Google Scholar]
- ACI Committee 517; Accelerated Curing of Concrete at Atmospheric Pressure: State of the Art. American Concrete Institute: Farmington Hills, MI, USA, 1992.
- Escalante-Garcıa, J.I.; Sharp, J.H. Effect of temperature on the hydration of the main clinker phases in Portland cements: Part II, blended cements. Cem. Concr. Res. 1998, 28, 1259–1274. [Google Scholar] [CrossRef]
- Wang, P.; Li, N.; Xu, L. Hydration evolution and compressive strength of calcium sulphoaluminate cement constantly cured over the temperature range of 0 to 80 C. Cem. Concr. Res. 2017, 100, 203–213. [Google Scholar] [CrossRef]
- Price, W.H. Factors influencing concrete strength. J. Proc. 1951, 47, 417–432. [Google Scholar] [CrossRef]
- Husem, M.; Gozutok, S. The effects of low temperature curing on the compressive strength of ordinary and high performance concrete. Constr. Build. Mater. 2005, 19, 49–53. [Google Scholar] [CrossRef]
- Kim, J.K.; Moon, Y.H.; Eo, S.H. Compressive strength development of concrete with different curing time and temperature. Cem. Concr. Res. 1998, 28, 1761–1773. [Google Scholar] [CrossRef]
- Xu, Y.; Yang, G.; Zhao, H. Compressive strength gain behavior and prediction of cement-stabilized macadam at low temperature curing. J. Adv. Transp. 2020, 2020, 2469436. [Google Scholar] [CrossRef]
- Marzouk, H.; Hussein, A. Effect of curing age on high-strength concrete at low temperatures. J. Mater. Civ. Eng. 1995, 7, 161–167. [Google Scholar] [CrossRef]
- Saul, A.G.A. Principles underlying the steam curing of concrete at atmospheric pressure. Mag. Concr. Res. 1951, 2, 127–140. [Google Scholar] [CrossRef]
- Soil Stabilization in Pavement Structures: A User’s Manual; Department of Transportation, Federal Highway Administration, Office of Development, Implementation Division: Washington, DC, USA, 1979.
- Molenaar, A.A.A. Lecture Notes CT4860 Structural Pavement Design, Design of Flexible Pavements; Delft University of Technology: Delft, The Netherlands, 2007; p. 165. [Google Scholar]
- Williams, R.I.T. The Effect of Cement Content on the Strength and Elastic Properties of Dry Lean Concrete; Cement and Concrete Association: London, UK, 1962. [Google Scholar]
- Kolias, S.; Williams, R.I.T. Relationships between the static and the dynamic moduli of elasticity in cement stabilised materials. Mater. Struct. 1980, 13, 99–107. [Google Scholar] [CrossRef]
- Ghanizadeh, A.R.; Rahrovan, M.; Bafghi, K.B. The effect of cement and reclaimed asphalt pavement on the mechanical properties of stabilized base via full-depth reclamation. Constr. Build. Mater. 2018, 161, 165–174. [Google Scholar] [CrossRef]
- Gonzalo-Orden, H.; Linares-Unamunzaga, A.; Pérez-Acebo, H.; Díaz-Minguela, J. Advances in the study of the behavior of full-depth reclamation (FDR) with cement. Appl. Sci. 2019, 9, 3055. [Google Scholar] [CrossRef]
- Ghanizadeh, A.R.; Rahrovan, M. Modeling of unconfined compressive strength of soil-RAP blend stabilized with Portland cement using multivariate adaptive regression spline. Front. Struct. Civ. Eng. 2019, 13, 787–799. [Google Scholar] [CrossRef]
- JTG E51-2009; Test Methods of Materials Stabilized with Inorganic Binders for Highway Engineering. Ministry of Transportation: Beijing, China, 2009.
- JTG D50-2006; Specifications for Design of Highway Asphalt Pavement. Ministry of Transportation: Beijing, China, 2006.
- JTG D50-2017; Specifications for Design of Highway Asphalt Pavement. Ministry of Transportation: Beijing, China, 2017.
Figure 1.
Reclaimed material.

Figure 2.
Synthesized gradation curve of FDR-PC cold-recycled mixture; the base-to-surface ratios are 10:0, 8:2, and 6:4.
Figure 2.
Synthesized gradation curve of FDR-PC cold-recycled mixture; the base-to-surface ratios are 10:0, 8:2, and 6:4.

Figure 3.
Unconfined compressive strength test apparatus.

Figure 4.
Splitting strength test apparatus.

Figure 5.
The four-point bending test apparatus.

Figure 6.
Comparison of UCS under different base-to-surface ratios and cement contents.

Figure 7.
Comparison of UCS under different base-to-surface ratios concerning curing temperature.

Figure 8.
Comparison of UCS under different base-to-surface ratios concerning curing time.

Figure 9.
Comparison chart of indirect tensile strength for each mixture.

Figure 10.
Comparison chart of flexural strength for each mixture.

Figure 11.
Linear regression for 7 d UCS-ITS and 7 d UCS-FS.


Table 1.
Technical indicators of cement.
| Testing Item | Technical Indicator | Testing Result | |
|---|---|---|---|
| Setting Time (min) | Initial Setting | ≥180 | 218 |
| Final Setting | ≤600 | 385 | |
| Flexural Strength (MPa) | 3 d | ≥3.5 | 3.8 |
| 28 d | ≥6.5 | 10.6 | |
| Compressive Strength (MPa) | 3 d | ≥17.0 | 19.9 |
| 28 d | ≥42.5 | 45.5 | |
Table 2.
The optimum water content and the maximum dry density of specimens fabricated with different cement content and base-to-surface ratio combinations.
Table 2.
The optimum water content and the maximum dry density of specimens fabricated with different cement content and base-to-surface ratio combinations.
| Design Method | Cement Content (%) | Base-to-Surface Ratio | Optimal Water Content (%) | Maximum Dry Density (g/cm3) |
|---|---|---|---|---|
| Heavy Compaction Test | 4 | 10:0 | 6.7 | 2.232 |
| 5 | 10:0 | 7.1 | 2.236 | |
| 6 | 10:0 | 7.3 | 2.238 | |
| 4 | 8:2 | 5.9 | 2.242 | |
| 5 | 8:2 | 6.6 | 2.246 | |
| 6 | 8:2 | 6.8 | 2.240 | |
| 4 | 6:4 | 5.8 | 2.246 | |
| 5 | 6:4 | 6.2 | 2.250 | |
| 6 | 6:4 | 6.2 | 2.245 | |
| Vibration Compaction Test | 4 | 10:0 | 5.8 | 2.268 |
| 5 | 10:0 | 6.1 | 2.272 | |
| 6 | 10:0 | 6.2 | 2.273 | |
| 4 | 8:2 | 4.7 | 2.282 | |
| 5 | 8:2 | 5.2 | 2.291 | |
| 6 | 8:2 | 5.6 | 2.284 | |
| 4 | 6:4 | 4.3 | 2.291 | |
| 5 | 6:4 | 4.6 | 2.297 | |
| 6 | 6:4 | 4.6 | 2.301 |
Table 3.
Seven-day standard UCS of FDR-PC materials.
| Forming Method | Base-to-Surface Ratio | 4% Cement Content | 5% Cement Content | 6% Cement Content | ||||||
|---|---|---|---|---|---|---|---|---|---|---|
MPa | % | MPa | MPa | % | MPa | MPa | % | MPa | ||
| Static Compaction | 10:0 | 5.2 | 4.8 | 4.8 | 5.7 | 6.5 | 5.1 | 6.0 | 2.0 | 5.8 |
| 8:2 | 5.0 | 7.0 | 4.4 | 5.2 | 10.8 | 4.3 | 5.4 | 11.5 | 4.4 | |
| 6:4 | 4.6 | 4.1 | 4.3 | 4.7 | 5.1 | 4.3 | 5.0 | 10.8 | 4.1 | |
| Vibratory Compaction | 10:0 | 6.7 | 7.6 | 5.9 | 6.9 | 4.9 | 6.3 | 7.4 | 5.3 | 6.8 |
| 8:2 | 6.5 | 2.2 | 6.3 | 6.8 | 2.6 | 6.5 | 7.1 | 3.0 | 6.8 | |
| 6:4 | 6.1 | 3.8 | 5.7 | 6.3 | 2.1 | 6.1 | 6.5 | 5.4 | 5.9 | |
Table 4.
Comparison in UCS under different base-to-surface ratios concerning curing temperature.
| Forming Method | Base-to-Surface Ratio | 20 °C | 30 °C | 40 °C | 50 °C | ||||||||
|---|---|---|---|---|---|---|---|---|---|---|---|---|---|
MPa | % | MPa | MPa | % | MPa | MPa | % | MPa | MPa | % | MPa | ||
| Static Compaction | 10:0 | 5.7 | 6.5 | 5.1 | 6.4 | 5.8 | 5.8 | 7.0 | 1.7 | 6.8 | 7.2 | 3.5 | 6.8 |
| 8:2 | 5.2 | 6.9 | 4.6 | 5.7 | 8.1 | 4.9 | 6.2 | 5.2 | 5.7 | 6.4 | 7.3 | 5.6 | |
| 6:4 | 4.7 | 5.1 | 4.3 | 5.0 | 4.8 | 4.6 | 5.4 | 4.4 | 5.0 | 5.6 | 2.7 | 5.4 | |
| Vibratory Compaction | 10:0 | 6.9 | 3.5 | 6.5 | 7.7 | 4.4 | 7.1 | 8.5 | 4.6 | 7.9 | 8.7 | 3.8 | 8.2 |
| 8:2 | 6.8 | 2.6 | 6.5 | 7.5 | 2.4 | 7.2 | 8.2 | 2.6 | 7.9 | 8.4 | 4.0 | 7.8 | |
| 6:4 | 6.3 | 2.1 | 6.1 | 6.5 | 2.0 | 6.3 | 6.9 | 5.1 | 6.3 | 7.0 | 4.0 | 6.5 | |
Table 5.
Comparison in UCS of the recycled mixture under different base-to-surface ratios concerning curing time.
Table 5.
Comparison in UCS of the recycled mixture under different base-to-surface ratios concerning curing time.
| Forming Method | Base-to-Surface Ratio | 3 d | 7 d | 28 d | 90 d | ||||||||
|---|---|---|---|---|---|---|---|---|---|---|---|---|---|
MPa | % | MPa | MPa | % | MPa | MPa | % | MPa | MPa | % | MPa | ||
| Static Compaction | 10:0 | 3.9 | 9.5 | 3.3 | 5.7 | 6.5 | 5.1 | 6.7 | 4.3 | 6.2 | 7.3 | 3.8 | 6.8 |
| 8:2 | 3.7 | 9.7 | 3.1 | 5.2 | 6.9 | 4.6 | 6.4 | 5.5 | 5.8 | 6.6 | 5.3 | 6.0 | |
| 6:4 | 3.4 | 7.1 | 3.0 | 4.7 | 5.1 | 4.3 | 5.5 | 3.1 | 5.2 | 5.7 | 2.6 | 5.5 | |
| Vibratory Compaction | 10:0 | 4.5 | 5.3 | 4.1 | 6.9 | 3.5 | 6.5 | 8.6 | 0.9 | 8.5 | 9.2 | 2.6 | 8.8 |
| 8:2 | 4.3 | 4.2 | 4.0 | 6.8 | 2.6 | 6.5 | 8.2 | 3.0 | 7.8 | 8.5 | 3.2 | 8.1 | |
| 6:4 | 4.0 | 3.3 | 3.8 | 6.3 | 2.1 | 6.1 | 7.2 | 4.9 | 6.6 | 7.4 | 3.4 | 7.0 | |
Table 6.
Summary of indirect tensile strength results for various FDR-PC cold-recycled mixtures.
| Base-to-Surface Ratios | Cement Content 4% | Cement Content 5% | Cement Content 6% | ||||||
|---|---|---|---|---|---|---|---|---|---|
MPa | % | MPa | MPa | % | MPa | MPa | % | MPa | |
| 10:0 | 0.66 | 7.6 | 0.58 | 0.90 | 6.7 | 0.80 | 1.05 | 6.7 | 0.93 |
| 8:2 | 0.60 | 5.0 | 0.55 | 0.75 | 4.0 | 0.70 | 0.89 | 4.5 | 0.82 |
| 6:4 | 0.54 | 7.4 | 0.47 | 0.71 | 5.6 | 0.64 | 0.79 | 10.1 | 0.66 |
Table 7.
Summary of flexural strength results for various FDR-PC cold-recycled mixtures.
| Base-to-Surface Ratios | Cement Content 4% | Cement Content 5% | Cement Content 6% | ||||||
|---|---|---|---|---|---|---|---|---|---|
MPa | % | MPa | MPa | % | MPa | MPa | % | MPa | |
| 10:0 | 1.25 | 8.8 | 1.07 | 1.62 | 7.4 | 1.42 | 1.98 | 6.1 | 1.78 |
| 8:2 | 0.97 | 6.2 | 0.87 | 1.44 | 7.6 | 1.26 | 1.71 | 8.2 | 1.48 |
| 6:4 | 0.89 | 6.7 | 0.79 | 1.25 | 8.8 | 1.07 | 1.48 | 7.4 | 1.30 |
Table 8.
The UCS, ITS, and FS values correspond to different cement contents under the same base-to-surface ratio.
Table 8.
The UCS, ITS, and FS values correspond to different cement contents under the same base-to-surface ratio.
| Method | Cement Content | Base-to-Surface Ratio | ||||||||
|---|---|---|---|---|---|---|---|---|---|---|
| 10:0 | 8:2 | 6:4 | ||||||||
| UCS | ITS | FS | UCS | ITS | FS | UCS | ITS | UCS | ||
| Static Compaction | 4% | 5.2 | 0.66 | 1.25 | 5 | 0.6 | 0.97 | 4.6 | 0.54 | 0.89 |
| 5% | 5.7 | 0.9 | 1.62 | 5.2 | 0.75 | 1.44 | 4.7 | 0.71 | 1.25 | |
| 6% | 6 | 1.05 | 1.98 | 5.4 | 0.89 | 1.71 | 5 | 0.79 | 1.48 | |
| Vibratory Compaction | 4% | 6.7 | 0.66 | 1.25 | 6.5 | 0.6 | 0.97 | 6.1 | 0.54 | 0.89 |
| 5% | 6.9 | 0.9 | 1.62 | 6.8 | 0.75 | 1.44 | 6.3 | 0.71 | 1.25 | |
| 6% | 7.4 | 1.05 | 1.98 | 7.1 | 0.89 | 1.71 | 6.5 | 0.79 | 1.48 | |
Table 9.
Coefficients and of the linear regression equations for 7 d UCS-ITS and 7 d UCS-FS.
| Compaction Method | Item | Base-to-Surface Ratio | |||
|---|---|---|---|---|---|
| Static Compaction | UCS-ITS | 10:0 | 0.487 | −1.872 | 0.999 |
| 8:2 | 0.725 | −3.023 | 0.999 | ||
| 6:4 | 0.542 | −1.905 | 0.782 | ||
| UCS-FS | 10:0 | 0.895 | −3.425 | 0.982 | |
| 8:2 | 1.850 | −8.425 | 0.976 | ||
| 6:4 | 1.312 | −5.045 | 0.843 | ||
| Vibratory Compaction | UCS-ITS | 10:0 | 0.508 | −2.684 | 0.866 |
| 8:2 | 0.483 | −2.540 | 0.999 | ||
| 6:4 | 0.625 | −3.258 | 0.959 | ||
| UCS-FS | 10:0 | 0.981 | −5.249 | 0.939 | |
| 8:2 | 1.233 | −7.013 | 0.976 | ||
| 6:4 | 1.475 | −8.086 | 0.984 | ||
Disclaimer/Publisher’s Note: The statements, opinions and data contained in all publications are solely those of the individual author(s) and contributor(s) and not of MDPI and/or the editor(s). MDPI and/or the editor(s) disclaim responsibility for any injury to people or property resulting from any ideas, methods, instructions or products referred to in the content. |
© 2024 by the authors. Licensee MDPI, Basel, Switzerland. This article is an open access article distributed under the terms and conditions of the Creative Commons Attribution (CC BY) license (https://creativecommons.org/licenses/by/4.0/).
Share and Cite
MDPI and ACS Style
Li, Y.; Luo, C.; Ji, K.; Zhang, H.; Sun, B. Laboratory Evaluation of Strength Performance of Full-Depth Reclamation with Portland Cement Material. Coatings 2024, 14, 573. https://doi.org/10.3390/coatings14050573
AMA Style
Li Y, Luo C, Ji K, Zhang H, Sun B. Laboratory Evaluation of Strength Performance of Full-Depth Reclamation with Portland Cement Material. Coatings. 2024; 14(5):573. https://doi.org/10.3390/coatings14050573
Chicago/Turabian StyleLi, Yongxiang, Chuangdan Luo, Kuiliang Ji, Haiwei Zhang, and Bowei Sun. 2024. "Laboratory Evaluation of Strength Performance of Full-Depth Reclamation with Portland Cement Material" Coatings 14, no. 5: 573. https://doi.org/10.3390/coatings14050573
Note that from the first issue of 2016, this journal uses article numbers instead of page numbers. See further details here.