Article

Detecting Smell/Gas-Source Direction Using Output Voltage Characteristics of a CMOS Smell Sensor

1
National Institute of Technology (KOSEN), Nagano College, Nagano 381-8550, Japan
2
Department of Electrical and Electronic Information Engineering, Faculty of Engineering, Toyohashi University of Technology, Toyohashi 441-8580, Japan
3
Aroma Bit, Inc., Tokyo 105-0061, Japan
*
Author to whom correspondence should be addressed.
Electronics 2024, 13(10), 1847; https://doi.org/10.3390/electronics13101847
Submission received: 25 November 2023 / Revised: 31 March 2024 / Accepted: 23 April 2024 / Published: 9 May 2024

Abstract

:
Various organisms, such as dogs and moths, can locate their prey and mates by sensing their smells. Following this manner, if an engineering device with the capability to detect a smell or gas source is realized, it can have a wide range of potential applications, such as searching for landmines, locating gas leaks, and rapid detection of fire. A previous study on the estimation of smell and gas-flow direction successfully detected the smell/gas-source direction in low-wind-velocity environments using a semiconductor gas sensor array. However, some problems are generally associated with the use of semiconductor gas sensors due to the use of heaters. This study aimed to detect the location of a smell/gas source using an integrated CMOS smell sensor array, which operates at room temperature without a heater. The experiment showed that under ideal conditions, the order of gas responses and concentration gradient of the gas enabled the estimation of the direction of the smell/gas-source location on one side of the sensor.

1. Introduction

One of the major issues faced by the international community is the problem of landmines, of which more than 60 million remain buried today, thereby requiring their prompt detection and removal [1]. Once buried, the removal of landmines requires a large amount of money and time. Metal detectors have traditionally been used to detect landmines, but they need a significant amount of time and pose problems, such as a high risk of personal injury. Conversely, a method using the olfaction of rats has been reported [2]. This method enables much faster detection of landmines than conventional metal detectors. However, the training of one rat costs more than CHF 5000 (USD 5500). In addition to the problem of uncertainty and animal ethics due to the use of creatures, the propagation of infection is a possibility. Therefore, without the use of living organisms, a smell/gas direction detection system, in addition to scenting, must be developed. If an engineering device that can detect the source of a smell or gas is realized, it can have a wide range of potential applications, such as searching for landmines, locating gas leaks, and rapid detection of fire [3].
Under ideal conditions without wind velocity, an estimation of the smell/gas-source direction is possible if the diffusion concentration gradient from the smell/gas-source can be detected by the sensor. As a method that enables smell/gas-source detection in low-wind-velocity environments, a semiconductor gas sensor array that detects smell/gas-source direction has been studied [4,5]. However, as semiconductor gas sensors require a heater for operation, the heat from the heater can disrupt gas diffusion due to air convection.
Our group has developed a CMOS smell sensor that operates at room temperature without a heater. This study aimed to use CMOS smell sensor arrays for directional estimation of smell and smell/gas-source positions.

2. Directional Estimation System for Locating Smell and Gas Sources

2.1. Principle

In an ideal environment where the wind velocity is small in relation to the diffusion velocity of the gas, gas diffusion plays a crucial role in determining the direction of smell/gas source. When a gas source is present in an environment, gas spreads with decreasing concentration owing to diffusion. If the sensor can detect gas concentration at several points in the concentration gradient caused by gas diffusion, the location of the gas source can be estimated (Figure 1). However, when the wind velocity due to air convection is high relative to gas diffusion velocity, gas diffusion is disturbed by wind, which causes difficulty in the estimation of the gas-source location (Figure 2). Two primary contributors to convection have been identified: natural convection due to meteorological factors and forced convection using heating elements and fans. The sun heats the Earth’s atmosphere unevenly, which, coupled with the planet’s rotation, generates differences in air pressure that cause air convection and influence wind patterns. In addition, forced convection may complicate convection. For example, the heat generated by the sensor and the convection caused by the fan result in forced convection around the sensor [6,7].
This research focuses on detection in an ideal environment as a foundational step towards addressing challenges related to real environment applications. Additionally, it is considered the fact that it does not cause forced convection.

2.2. Semiconductor Gas Sensor

Semiconductor gas sensors are commonly used as gas sensors. As shown in Figure 3, these sensors comprise a metal oxide, such as tin oxide, an alumina substrate, and a heater. The n-type metal oxide is heated to several hundred degrees Celsius by a heater element, and oxygen is adsorbed on the particle surface through the capture of electrons in the metal oxide. If the sensor is exposed to a reducing gas, surface oxygen is removed via the reaction with the reducing gas. Consequently, electrons trapped in the oxygen are released, and the number of electrons in the metal oxide increases. Semiconductor gas sensors detect gases through a mechanism that reads this change in resistivity in the metal oxide. When the reducing gas is removed, the resistivity returns to its original state before gas exposure [8,9,10,11,12].

2.3. Conventional Method

An estimation of smell and gas-flow direction was proposed by Ishida et al. [4]. In this study, gas-source detection in low-wind-velocity environments was made possible by arranging semiconductor gas sensors in an array. There are three problems associated with the use of semiconductor gas sensors with heaters: the heat from the heater may cause air convection and disrupt gas diffusion, array structure with low density, and power consumption. In this study, a pulse-driven semiconductor-type sensor with a low power consumption was used to reduce the amount of heating.

3. Proposed Directional Estimation System

3.1. CMOS Smell Sensor

We have been studying charge-transfer-type ion image sensors and have applied them to the field of bio-chemical analyses. These sensors, which have a 128 × 128 pixel arrangement with a 23 μm pixel pitch, have achieved outputs with lower variability between each pixel than those achieved by other groups [13,14,15,16]. Based on the ion image sensors, a CMOS smell sensor that is completely different from conventional semiconductor gas sensors was demonstrated. A CMOS smell sensor consists of a smell-sensitive membrane on a CMOS potential sensor (Figure 4) [17,18,19]. The CMOS potential sensor array is fabricated in a standard CMOS process and also includes an electrode for applying the membrane bias (VM). The VM and the sensing area (SA) are connected by the smell-sensitive membrane, which is based on polyaniline (PANI), an organic semiconductor film.
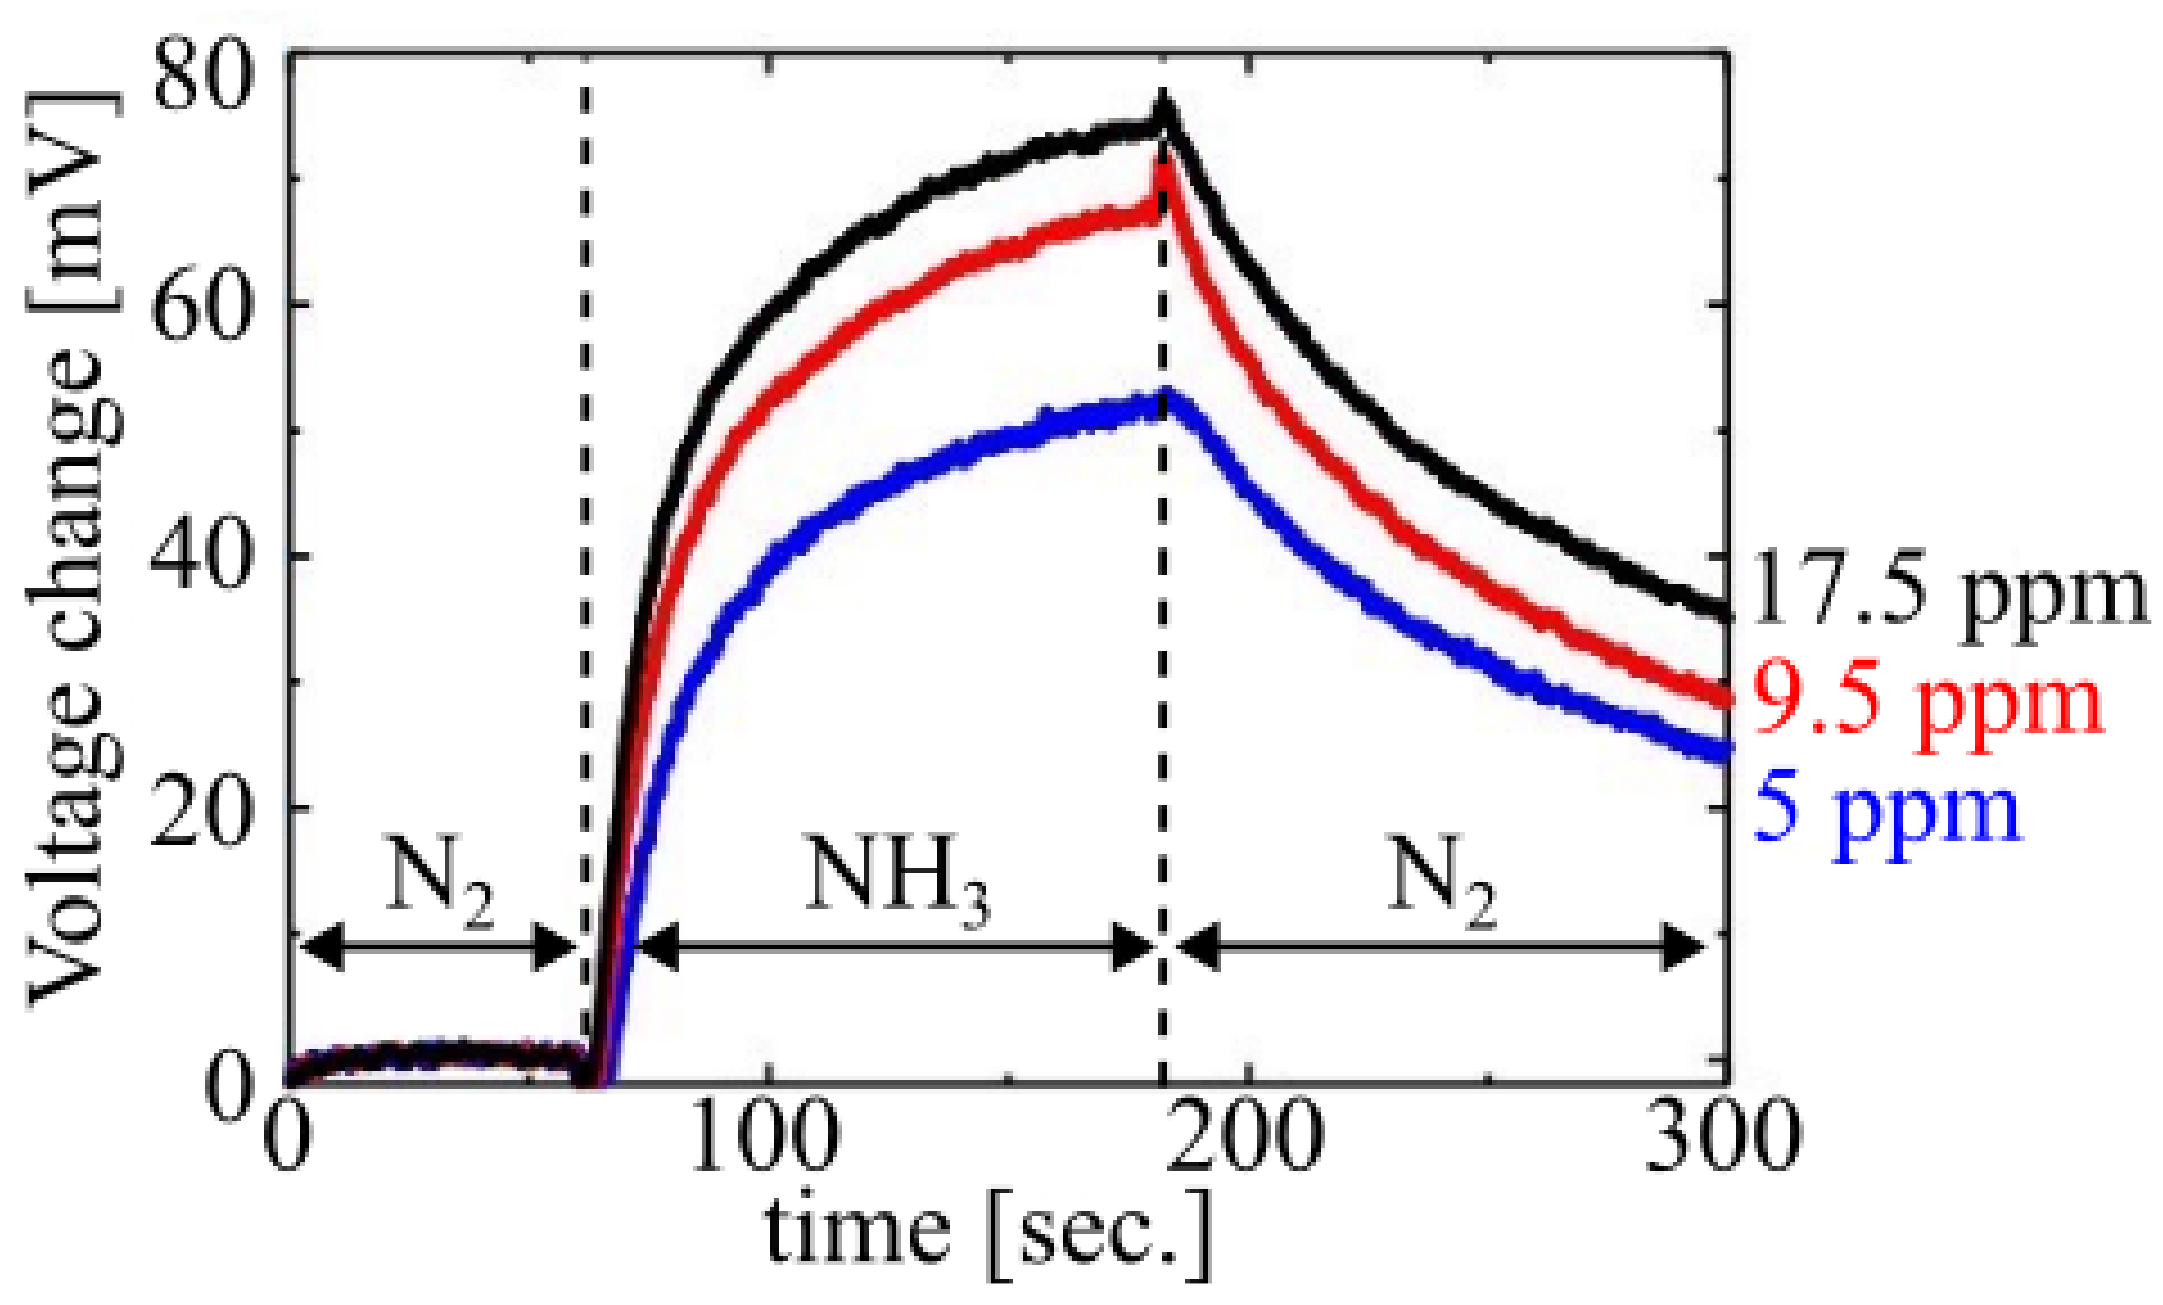
When the smell-sensitive membrane adsorbs a specific smell molecule, the charge in the sensing membrane changes, resulting in a shift of the characteristic line (Figure 5) [20]. Smell and gases have been successfully detected by using this shift in the characteristic line to detect the extent of potential change before and after smell adsorption at the measurement point. Figure 6 shows the results of ammonia gas adsorption and desorption.

3.2. Proposed Sensor

As discussed in Section 2.3, there are three problems that are associated with the use of semiconductor gas sensors with heaters in the conventional study: the heat from the heater may cause air convection and disrupt gas diffusion, array structure with low density, and power consumption. Therefore, a sensor that can solve these problems is used to detect smelling direction.
The CMOS smell sensor described in the previous section operates at room temperature without a heater, and thus, no risk of heat-induced air convection may occur. Furthermore, this sensor has the advantage of being easily integrated and multiplexed. In our laboratory, the integrated arrayed CMOS smell sensor is called a CMOS smell sensor array (Figure 7). As they are already arrayed, the sensors can be applied to gas-source detection.
In recent years, attention has been focused on CCDs and other devices that use CMOS and OFETs as transistors for potential sensors. OFETs are particularly suitable for flexible and lightweight products due to their low-temperature solution processability and the mechanical flexibility of organic materials [21]. CCD sensors are known for their high image quality and low noise levels, but they consume relatively high amounts of power and are complex and expensive to manufacture. CMOS sensors, on the other hand, are characterized by low power consumption and fast readout, and are less expensive to manufacture; although they tend to be noisier than CCDs, recent technological innovations have significantly improved image quality. In this study, since flexibility is not necessary for smell sensing, CMOS was selected because of its advantage in low power consumption [22,23]. The advantage of temporal resolution is also expected to play an important role in the detection of actual natural convection, which is the outlook of this study. Therefore, the CMOS smell sensor arrays were used in this study as a smell and gas-source location estimation system.

3.3. Proposed Method for Gas-Source Location Direction Estimation

Two methods are proposed for gas-source detection.
First, when the gas source was on one side of the sensor, the sensor was assumed to respond from the membrane closest to the gas source due to gas diffusion (Figure 8). Therefore, a comparison of the order of responses of each membrane was used to determine the position of the gas source.
Second, as shown in Figure 9, the concentration of gas on the sensor is estimated to be higher the closer it is to the gas source, and vice versa, due to diffusion from the gas-source. Therefore, the location of the gas source can be estimated by checking the concentration gradient on the sensor.

4. Experimental Section

Experimental Methods

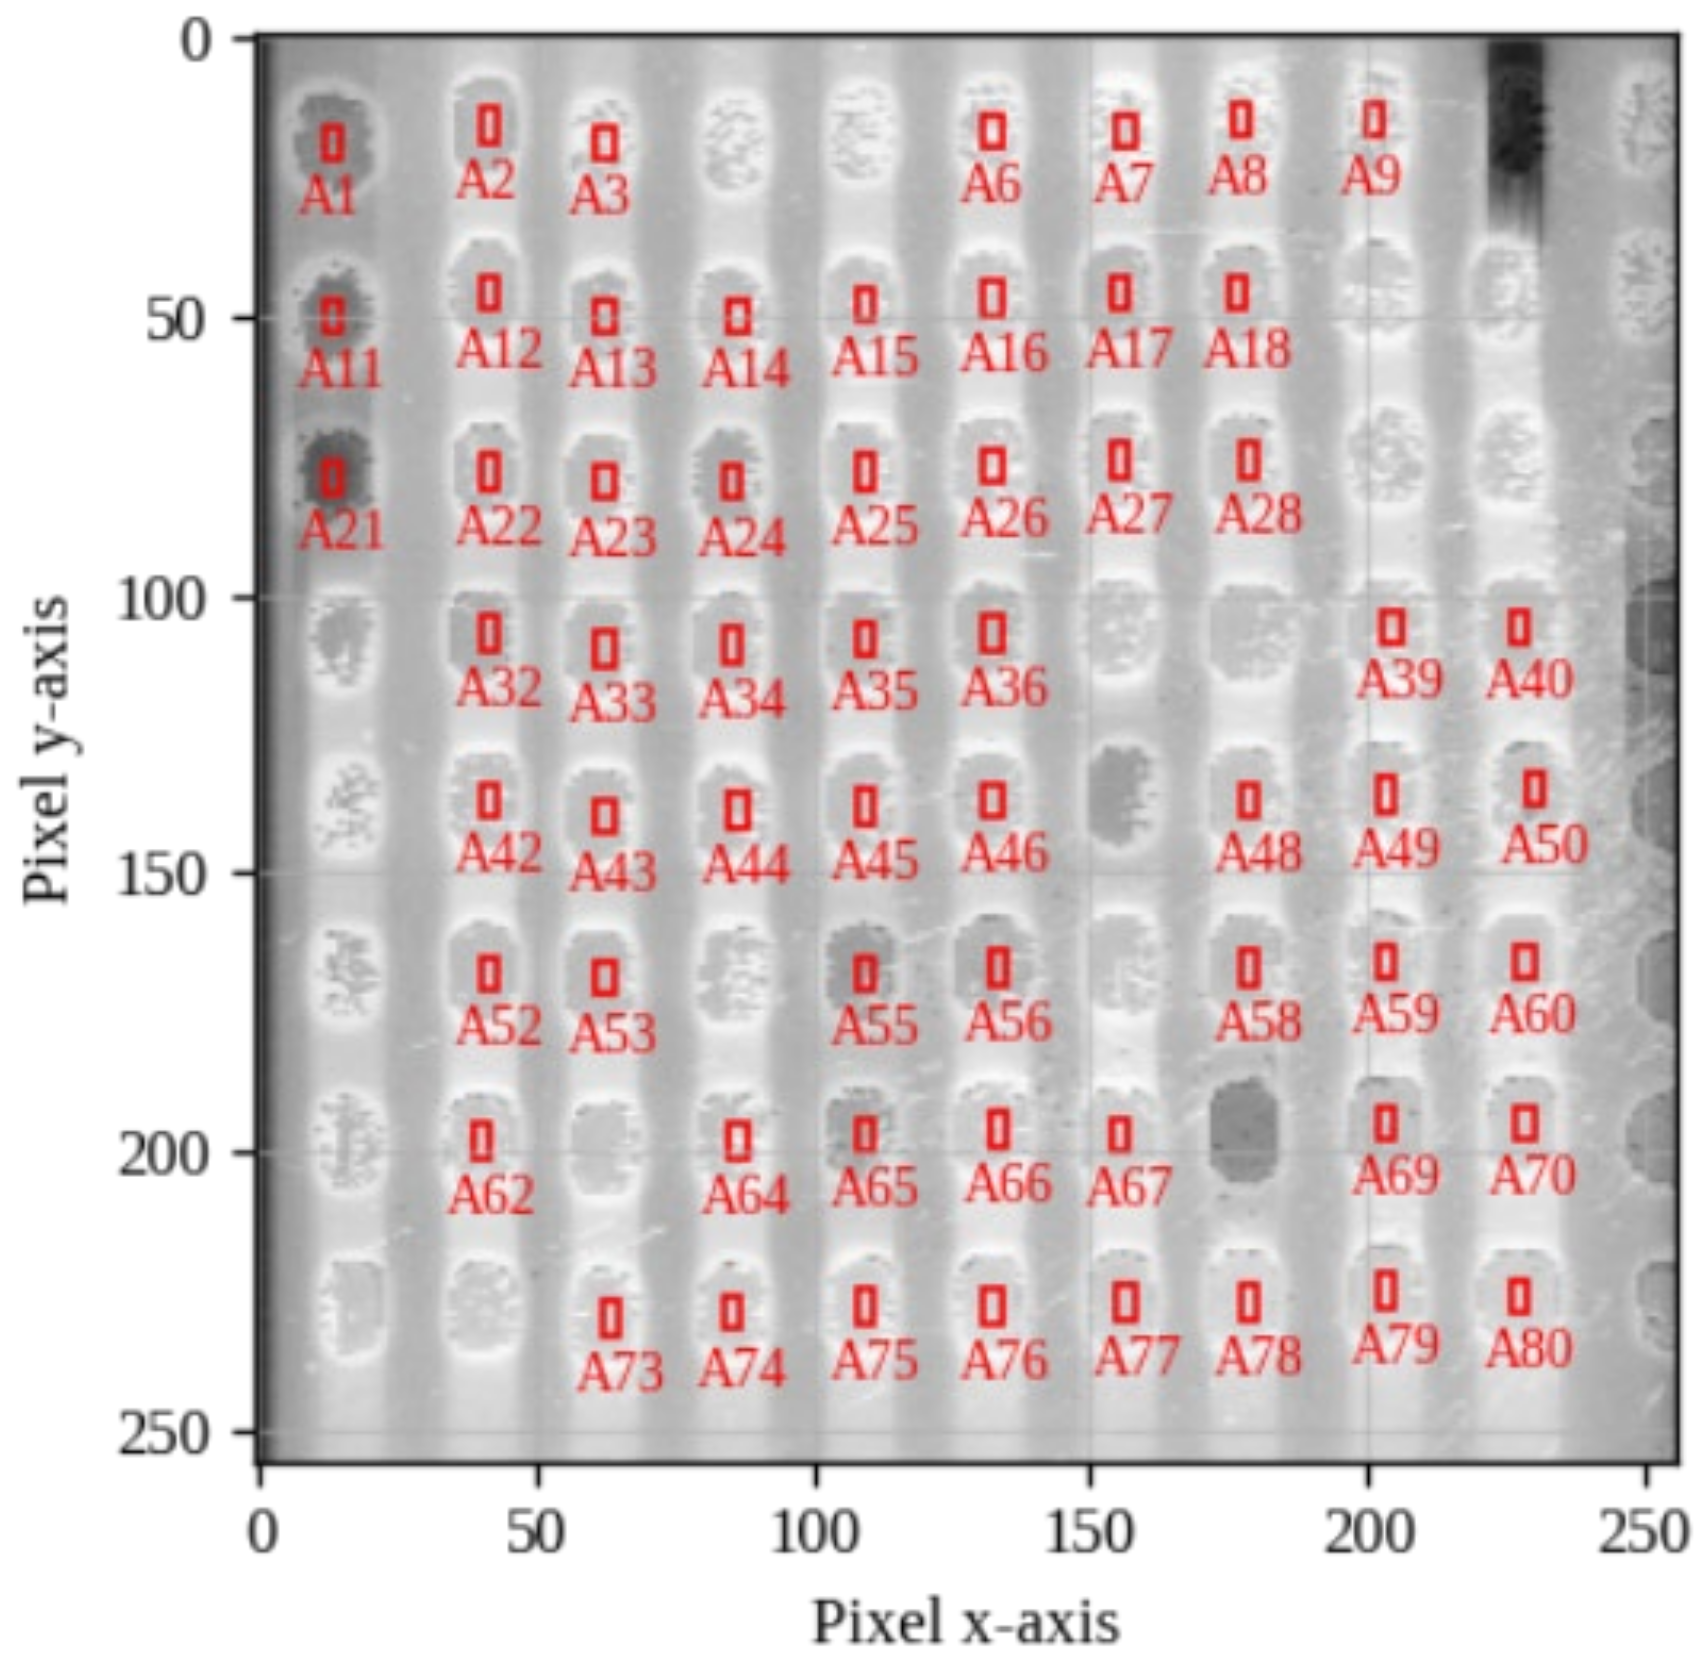
As shown in Figure 10, the experimental system comprised a pump, a mass flow meter, a cock, a reagent, and a nozzle. The nozzle employed is a needle-type with an outlet diameter of 1 mm. Both the nozzle and the sensor were enclosed within a box, which was shielded by a blackout curtain to mitigate any potential light-induced noise. An aqueous ammonia solution with a concentration of 1% was used as a reagent, and the gas supply volume was adjusted by a mass flow meter. In this experiment, a needle nozzle was used to supply the gas, which created an ideal environment that resulted in the concentration gradient of the gas, and gas turbulence caused by the pump wind speed was difficult to generate. After the sensor output was stabilized, the cock was turned, and gas was supplied from one side of the sensor using a needle nozzle. The gas supply position was changed to four points, namely, the top, bottom, left, and right sides of the sensor, and the time resolution of the sensor was 0.1 s. As shown in Figure 11, the same type of about 100 membranes were deposited in this experiment to detect the gas-source direction of one type of gas throughout the sensor. The membranes with good properties, which are circled in red in Figure 11, were used in the experiment. The output voltage of the membranes is the average of the 18 pixels circled in red.

5. Results and Discussion

5.1. Results

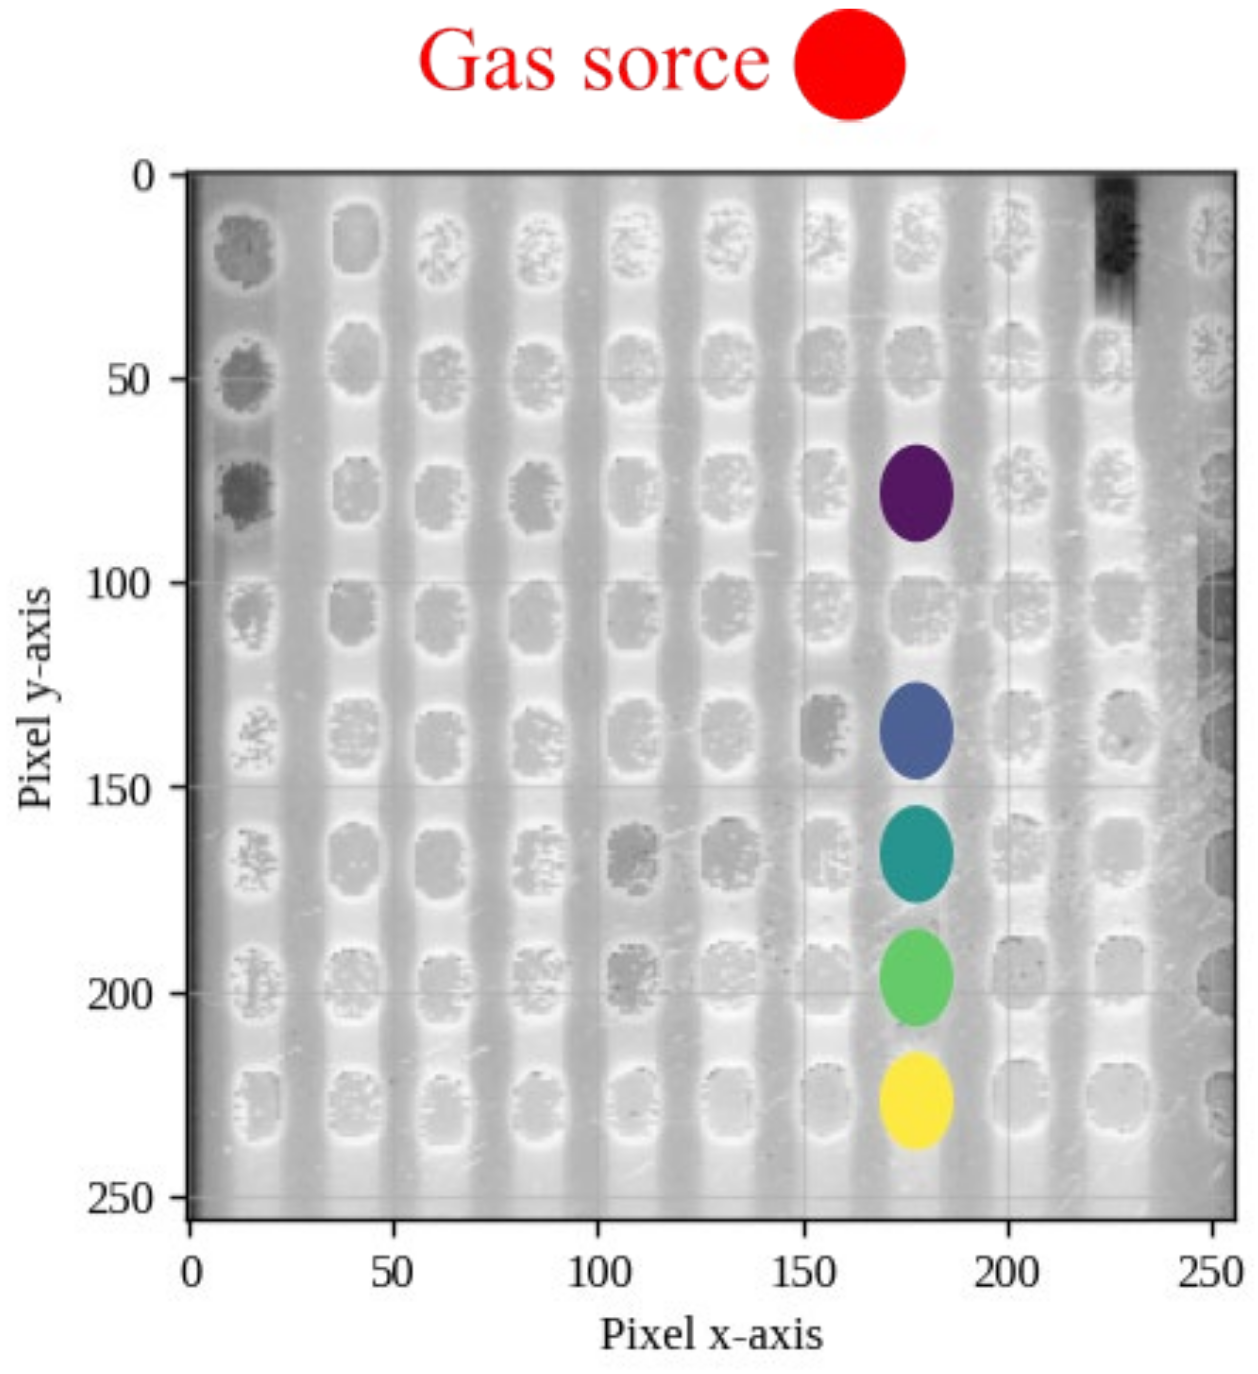
Figure 12, Figure 13 and Figure 14 show the experimental results, which were obtained when the gas-source was placed on the upper side of the sensor. The ammonia gas was supplied at the pump flow rate of 300 mL/min. The output characteristics of the five membranes aligned in the y-axis direction from the gas-source are shown in Figure 12 and plotted in Figure 13a. Additionally, for a detailed comparison of the order of gas responses, the 1 s period immediately after the gas supply is enlarged and described in Figure 13b. Next, a three-dimensional (3D) map of the voltage change was constructed Figure 14 to confirm the concentration gradient of the gas on the sensor.
Figure 15 and Figure 16 show results of experiment to detect the different gas-source direction of one-type of gas throughout the sensor. The gas was supplied at the pump flow rate of 50 mL/min. 3D map of the voltage change was constructed Figure 15 to confirm the concentration gradient of the gas on the sensor. The relationship between the membrane location and the voltage change values is shown in Figure 16.

5.2. Discussion

When looking at the graph in Figure 13, corresponding to the membrane colors shown in Figure 12, the purple line is the reaction of the membrane closer to the gas source and the yellow is the reaction of the membrane farther away. Since it is difficult to discern the order of the reactions in Figure 13a, by looking at Figure 13b, which is a magnified image of the area immediately after the sensor response, one can read that the reactions start in the order in which the gases arrive. As above, each membrane responded in the order of gas diffusion, as expected from the gas-source position direction estimation method in Figure 8. The same results were obtained when the gas-source position was changed. From the above findings, the position of the gas-source can be estimated based on the order of the response of gas diffusion speed under ideal conditions.
In Figure 13a, an observable trend emerges wherein the membrane proximal to the gas source (the purple line) exhibits a higher saturation voltage, whereas the membrane distal to the source (the yellow line) manifests a lower saturation voltage. The 3D map in Figure 14, a trend for the entire sensor, shows a peak of concentration in the membrane near the gas-source, that is, the gas diffused while gradually decreasing in concentration. Given the ideal environment, a concentration gradient was obtained, in which the gas gradually decreased in concentration while continuously spreading. Therefore, it was found that the gas source location can be estimated as per the proposed method for capturing concentration gradients in Figure 9.
The gas-source was changed as shown in Figure 15, and the direction of the gas-source position was determined by checking the peak of concentration gradient. In both cases Figure 15a–d, the peak of the concentration gradient is found in the membrane near the gas source. As shown in Figure 16, when the gas-source was located top or bottom of the sensor, or left or right, they could be separated by comparing their concentration gradients reliably.
Therefore, the direction of the gas-source location can be estimated by determining the order of sensor responses and the concentration gradient of gas on the CMOS smell sensor array.
Future studies should focus on the directional estimation of smell and gas-source locations for real-world environments. In real environments, wind and air currents caused by the weather disrupt gas diffusion, thereby creating gas clouds that change irregularly and discontinuously [24,25]. To detect these gas clouds, pixel resolution is required in addition to high temporal resolution to follow irregular and rapid changes in gas concentration. Therefore, the CMOS smell sensor array can be expected to be applied in the realization of smell and gas-source direction estimation in real environments.

6. Conclusions

This study aimed to detect the location of a gas source using the CMOS smell sensor array, which operates at room temperature without a heater. Under ideal conditions, the order of gas responses and concentration gradient of the gas enabled the estimation of the location direction of the gas source on one side of the sensor.
The technology to detect smell/gas source with engineered devices is a cornerstone for the creation of many innovations. In particular, the results of this study represent an important first step toward detecting landmine location in real-world environments. Future research will require analysis in real-world environments where natural convection of air exists and the concentration gradient of gases on the sensor varies over time. The ability to use the high temporal resolution of CMOS smell sensors to analyze real-world conditions and detect complex landmine smells is highly anticipated as a new method for real-world landmine detection.

Author Contributions

Conceptualization, Y.A.; Software, Y.Y.; Resources, K.M. and K.H.; Supervision, T.N. and M.A.; Project administration, K.S. All authors have read and agreed to the published version of the manuscript.

Funding

This research was funded by Japan Science and Technology Agency (grant number: OPERA JPMJOP1834) and Ministry of Education, Culture, Sports, Science and Technology (grant number: X-NICS JPJ011438.

Data Availability Statement

The data presented in this study are available in this article.

Conflicts of Interest

Authors Kenichi Maeno and Kenichi Hashizume were employed by the company Aroma Bit, Inc. The remaining authors declare that the research was conducted in the absence of any commercial or financial relationships that could be construed as a potential conflict of interest.

References

  1. International Campaign to Ban Landmines, Landmine Monitor 2013, 2013/11. OCHA. Available online: https://reliefweb.int/report/world/landmine-monitor-2013 (accessed on 24 November 2023).
  2. Hunt, J. Rats Save Lives in Landmine-Infested Areas. Available online: https://www.swissinfo.ch/eng/sci-tech/lifesavers-landmines-explosives-rats-cambodia-deadly/44928164#:~:text=Rats%20often%20get%20a%20bad,words%2C%20rats%20save%20many%20lives (accessed on 24 November 2023).
  3. Takei, Y.; Tashiro, T.; Misawa, T.; Nanto, H.; Kasahara, H.; Iwasaki, Y. Odor Sensor System for Early Fire Detection and Its Application to Utility Mobile Robot. Sens. Mater. 2005, 17, 413–421. [Google Scholar]
  4. Ishida, H.; Kushida, N.; Yamanaka, T.; Nakamoto, T.; Moriizumi, T. Study of gas/odor flow visualization system using array of pulse drive semiconductor gas sensors. IEEJ Trans. Sens. Micromach. 1999, 199, 194–200. [Google Scholar] [CrossRef]
  5. Ishida, H.; Yamanaka, T.; Kushida, N.; Nakamoto, T.; Moriizumi, T. Study of real-time visualization of gas/odor flow image using gas sensor array. Sens. Actuators B Chem. 2000, 65, 14–16. [Google Scholar] [CrossRef]
  6. Csanady, G.T. Wind effects on surface to bottom fronts. J. Geophys. Res. Ocean. 1978, 83, 4633–4640. [Google Scholar] [CrossRef]
  7. Wu, J.; Zha, J.; Zhao, D.; Yang, Q. Changes in terrestrial near-surface wind speed and their possible causes: An overview. Clim. Dyn. 2018, 51, 2039–2078. [Google Scholar] [CrossRef]
  8. Taguchi, N. A Metal Oxide Gas Sensor. Japanese Patent S45-38200, 26 October 1962. [Google Scholar]
  9. Deshmukh, S.; Pandey, R.; Jana, A.; Bhattacharyya, N.; Bandyopadhyay, R. P2. 9.11 Monitoring of obnoxious odorants generated from pulp and paper industry using electronic nose. In Proceedings of the 14th International Meeting on Chemical Sensors—IMCS 2012, Nuremberg, Germany, 20–23 May 2012; pp. 1727–1730. [Google Scholar]
  10. Dey, A. Semiconductor metal oxide gas sensors: A review. Mater. Sci. Eng. B 2018, 229, 206–217. [Google Scholar] [CrossRef]
  11. Gebicki, J. Application of electrochemical sensors and sensor matrixes for measurement of odorous chemical compounds. TrAC Trends Anal. Chem. 2016, 77, 1–13. [Google Scholar] [CrossRef]
  12. Pearce, T.C.; Schiffman, S.S.; Nagle, H.T.; Gardner, J.W. Handbook of Machine Olfaction: Electronic Nose Technology; WILEY-VCH Verlag GmbH & Co. KGaA: Weinheim, Germany, 2002. [Google Scholar]
  13. Lee, Y.N.; Araki, T.; Kimura, Y.; Dasai, F.; Iwata, T.; Takahashi, K.; Sawasa, K. High-density 2-μm-pitch pH image sensor with high-speed operation up to 1933 fps. IEEE Trans. Biomed. Circuits Syst. 2019, 13, 352–363. [Google Scholar] [CrossRef]
  14. Hizawa, T.; Sawada, K.; Takao, H.; Ishida, M. Fabrication of a two-dimensional pH image sensor using a charge transfer technique. Sens. Actuator B 2006, 117, 509–515. [Google Scholar] [CrossRef]
  15. Nakao, M.; Yoshinobu, T.; Iwasaki, H. Scanning-laser-beam semiconductor pH-imaging sensor. Sens. Actuators B 1994, 20, 119–123. [Google Scholar] [CrossRef]
  16. Milgrew, M.J.; Hammond, P.A.; Cumming, D.R.S. The development of scalable sensor arrays using standard CMOS technology. Sens. Actuators B 2004, 103, 37–42. [Google Scholar] [CrossRef]
  17. Wada, T.; Choi, Y.J.; Takahashi, K.; Sawada, K.; Noda, T. Verification of basic characteristics of gas sensor using CMOS potential sensor array. In Proceedings of the The Papers of Technical Meeting on “Chemical Sensor”, Shizuoka, Japan, 18–20 November 2022; pp. 45–49. [Google Scholar]
  18. Nicolas-Debarnot, D.; Poncin-Epaillard, F. Polyaniline as a new sensitive layer for gas sensors. Anal. Chim. Acta 2003, 475, 1–15. [Google Scholar] [CrossRef]
  19. Pauly, A.; Ali, S.S.; Varenne, C.; Brunet, J.; Llobet, E.; Ndiaye, A.E. Phthalocyanines and Porphyrins/Polyaniline Composites (PANI/CuPctBu and PANI/TPPH2) as Sensing Materials for Ammonia Detection. Polymers 2022, 14, 891. [Google Scholar] [CrossRef] [PubMed]
  20. Chabukswar, V.V.; Pethkar, S.; Athawale, A.A. Acrylic acid doped polyaniline as an ammonia sensor. Sens. Actuators B Chem. 2001, 77, 657–663. [Google Scholar] [CrossRef]
  21. Nawaz, A.; Merces, L.; Ferro, L.M.M.; Sonar, P.; Bufon, C.C.B. Impact of Planar and Vertical Organic Field-Effect Transistors on Flexible Electronics. Adv. Mater. 2023, 35, 2370077. [Google Scholar] [CrossRef]
  22. Zhang, L.; Jin, Y.; Lin, L.; Li, J.; Du, Y. The comparison of CCD and CMOS image sensors. In Proceedings of the 2008 International Conference on Optical Instruments and Technology: Advanced Sensor Technologies and Applications, Beijing, China, 16–19 November 2008; Volume 7157. [Google Scholar]
  23. Shi, C. Applications of CMOS image sensors: Applications and innovations. Appl. Comput. Eng. 2023, 11, 95–103. [Google Scholar] [CrossRef]
  24. Matsunashi, J. Environmental Fluid Transport (Kankyo Ryutai Yusou); The Nikkan Kogyo Shimbun: Kogyo, Japan, 1991; pp. 1–9. [Google Scholar]
  25. Murlis, J.; Elkinton, J.S.; Carde, R.T. Odor plumes and how insects use them. Annu. Rev. Entomol. 1992, 37, 505–532. [Google Scholar] [CrossRef]
Figure 1. Principle of gas-source location estimation.
Electronics 13 01847 g001
Figure 2. Estimation of gas-source location during air convection.
Electronics 13 01847 g002
Figure 3. Schematic of semiconductor gas sensor.
Electronics 13 01847 g003
Figure 4. CMOS smell sensor.
Electronics 13 01847 g004
Figure 5. Shift in threshold voltage.
Electronics 13 01847 g005
Figure 6. Example of CMOS smell sensor output voltage.
Electronics 13 01847 g006
Figure 7. CMOS smell sensor array.
Electronics 13 01847 g007
Figure 8. Proposal 1: a method for capturing diffusion velocity.
Electronics 13 01847 g008
Figure 9. Proposal 2: method for capturing concentration gradients.
Electronics 13 01847 g009
Figure 10. Experimental equipment.
Electronics 13 01847 g010
Figure 11. Arrangement of smell-sensitive membranes with good properties, which are circled in red and numbered Area 1 (A1) through Area 80 (A80).
Electronics 13 01847 g011
Figure 12. Gas-source location and specified membranes for Figure 13. The color of the circle corresponds to the solid line on the graph of Figure 13.
Electronics 13 01847 g012
Figure 13. Output voltage characteristics of the membrane specified in Figure 12. Note that the solid line in the graph corresponds to the color of the membrane location in Figure 12.
Electronics 13 01847 g013
Figure 14. Three-dimensional map of voltage changes from 180 s to 240 s.
Electronics 13 01847 g014
Figure 15. Three-dimensional map of voltage changes when gas is supplied from different sides.
Electronics 13 01847 g015
Figure 16. Voltage difference at the pixel position of the selected membranes.
Electronics 13 01847 g016
Disclaimer/Publisher’s Note: The statements, opinions and data contained in all publications are solely those of the individual author(s) and contributor(s) and not of MDPI and/or the editor(s). MDPI and/or the editor(s) disclaim responsibility for any injury to people or property resulting from any ideas, methods, instructions or products referred to in the content.