Article

QTL Mapping of Yield-Related Traits in Tetraploid Wheat Based on Wheat55K SNP Array

1
State Key Laboratory for Crop Stress Resistance and High-Efficiency Production, College of Agronomy, Northwest A&F University, Yangling 712100, China
2
Qinghai Key Laboratory of Hulless Barley Genetics and Breeding, Qinghai Academy of Agricultural and Forestry Sciences, Qinghai University, Xining 810016, China
3
Agricultural Bio-Technology Research Center, Ningxia Academy of Agriculture and Forestry Science, Yinchuan 750002, China
4
Department of Agriculture, Hetao College, Bayan Nur City 015000, China
*
Authors to whom correspondence should be addressed.
Plants 2024, 13(10), 1285; https://doi.org/10.3390/plants13101285
Submission received: 9 April 2024 / Revised: 1 May 2024 / Accepted: 4 May 2024 / Published: 7 May 2024
(This article belongs to the Special Issue Genetics, Genomics, and Biotechnology for Cereal Crop Improvements)

Abstract

:
To enhance the understanding of yield-related traits in tetraploid wheat, it is crucial to investigate and identify genes that govern superior yield characteristics. This study utilized the wheat55K single nucleotide polymorphism array to genotype a recombinant inbred line (RIL) population consisting of 120 lines developed through the crossbreeding of two tetraploid wheat varieties, Qin Hei-1 (QH-1) and Durum Wheat (DW). An investigation and analysis were conducted on 11 yield-related traits, including peduncle length (PL), neck length (NL), spike length (SL), flowering date (FD), heading date (HD), thousand-kernel weight (TKW), kernel area ratio (KAR), kernel circumference (KC), kernel length (KL), kernel width (KW), and kernel length–width ratio (KL-WR), over a period of three years in two locations, Yang Ling, Shaanxi, and Lin He, Inner Mongolia. The analysis identified nine stable loci among eight agronomic traits, named QSL.QD-1A.1, QNL.QD-4B.2, QPL.QD-4B.1, QFD.QD-2B, QHD.QD-2B.1, QHD.QD-4B, QKC.QD-4B.2, QKL-WR.QD-4B.6, and QKL.QD-4B.2. Among them, the additive effects of three QTLs, QSL.QD-1A.1, QNL.QD-4B.2, and QFD.QD-2B, were positive, indicating that the enhancing alleles at these loci were derived from the parent line QH-1. These three QTLs showed significant positive effects on the phenotypes of the population materials. Furthermore, potential functional genes were identified within the mapping intervals of QSL.QD-1A.1 and QNL.QD-4B.2, which regulate the development of spike length and neck length, respectively. These results provide potential QTLs and candidate genes, which broaden the genetic basis of agronomic traits related to yield, such as SL, NL, PL, and FD, and benefits for wheat breeding and improvement.

1. Introduction

Wheat yield, a complex trait influenced by numerous genes and the interaction of environmental and genetic factors throughout plant growth stages [1], encompasses various components, including plant morphology such as peduncle length (PL), neck length (NL), and spike length (SL). Additionally, yield traits are influenced by growth stage indicators like flowering date (FD) and heading date (HD), along with grain development-related characteristics such as thousand-kernel weight (TKW), kernel area ratio (KAR), kernel circumference (KC), kernel length (KL), kernel width (KW), and kernel length–width ratio (KL-WR). Peduncle length, a component of plant height representing the distance from the panicle base to the flag leaf petiole [2], plays a pivotal role in shaping overall plant architecture and is closely linked to inflorescence development and the transport of reserves to the spike and grain [3,4]. NL, a constituent of PL, denotes the distance from the internode at the base of the spike to the tip of the flag leaf sheath, specifically referring to the retracted portion of the flag leaf sheath. Through extensive breeding efforts, it has been observed that cultivars exhibiting a higher NL to PL ratio tend to display accelerated grain filling, enhanced senescence, earlier maturity, and increased grain weight per spike, suggesting a positive correlation between NL relative to PL and grain weight increment [5]. However, heightened plant stature resulting from increased PL and NL may predispose the plant to panicle bending or lodging, potentially leading to reduced grain yield and quality [6]. Furthermore, the metabolism and signaling of gibberellic acid (GA) significantly impact the development of PL and NL [3,7]. Therefore, PL and NL are often closely related to plant height genes. However, there are exceptions to this rule. At present, there are two site independent of plant height gene on 5AS and 6D for PL trait, providing a chance to modulate the PL [8,9]. Spike architecture traits such as spike length (SL) are closely related to grain production in wheat [10]. A number of studies have identified stable QTLs for SL on various chromosomes of hexaploid wheat [11]. It has been reported that the Q gene on chromosome 5A, which encodes an AP2 transcription factor, affects SL in wheat [12].
FD and HD not only govern the duration of wheat dry matter accumulation but also play a significant role in enhancing wheat’s adaptability to varying environmental conditions [13]. Over 100 quantitative trait loci (QTLs) associated with HD have been identified across all wheat chromosomes [11]. Studies have shown that vernalization demand and photoperiod sensitivity are the main factors influencing and controlling HD genetics [14]. VRN1, VRN2, VRN3, and VRN4 are the main vernalization genes affecting wheat vernalization [15,16,17,18]. The three homologous dominant loci Ppd-A1, Ppd-B1, and Ppd-D1, which mainly respond to photoperiodic regulation, are situated on chromosomes 2A, 2B, and 2D, respectively [19].
Kernel traits encompass several characteristics such as KL, KW, KC, KAR, TKW, and KL-WR. KL is predominantly determined during the initial stages of kernel development, exhibiting lower susceptibility to environmental influences [20,21]. In contrast, KW and KC are established later in development and are more responsive to environmental conditions. Recent investigations have identified numerous quantitative trait loci (QTLs) associated with kernel traits distributed across all 21 chromosomes of wheat [11,22]. These kernel traits are closely interrelated and directly impact both yield and end-use quality of wheat [23]. Consequently, comprehending the genetic mechanisms governing wheat yield-related traits is of paramount importance for enhancing wheat varieties and developing novel cultivars with superior yield and quality attributes.
Common wheat (Triticum aestivum) is the most widely cultivated cereal crop globally and is a typical allohexaploid (AABBDD), formed by the hybridization and genome duplication of cultivated tetraploid wheat (AABB) and the diploid wild goatgrass (DD). With human migration activities, it has spread worldwide. Therefore, the genome of hexaploid common wheat can be traced back to tetraploid cultivated wheat, ultimately tracing back to the wild diploid wheat lineage [24]. Synthetic hexaploid wheat (SHW) is a valuable genetic resource that can enhance the performance of common wheat by transferring favorable genes from a wide range of tetraploid or diploid donors [25]. Previous studies have shown that hexaploid wheat contains six HMW-GS genes (Glu-1) located on chromosomes 1A, 1B, and 1D, whereas tetraploid wheat has four HMW-GS loci on chromosomes 1A and 1B. The main difference is the absence of HMW glutenin subunits from 1D in tetraploid wheat. However, three classes of HMW-GS protein exist in tetraploid wheat: 1Ax (encoded by Glu-A1), and 1Bx and 1By (encoded by Glu-B1), while hexaploid wheat has five classes: 1Ax (encoded by Glu-A1), 1Bx and 1By (encoded by Glu-B1), and 1Dx and 1Dy (encoded by Glu-D1), showing genetic gene sharing between tetraploid and hexaploid wheat [26]. Therefore, in the mapping of quantitative traits, especially yield-related traits, comparisons and tracing between the genomes of diploid, tetraploid, and hexaploid wheat are often conducted. For instance, Mo Z et al. predicted the involvement of some development-related genes in spikelet growth and their impact on spikelet number per spike by comparing the genetic positions of tetraploid Triticum turgidum and hexaploid Chinese Spring [27]. Liu J et al. identified twenty common genes in the physical interval between flanking markers on chromosome 4B of “Chinese Spring” and wild emmer, which regulate productive tiller number [28]. Considering the phenomenon of shared genetic variation in yield-related traits between tetraploid and hexaploid wheat, and the relative simplicity of the tetraploid wheat genome, research on the localization of yield-related traits in tetraploid wheat is beneficial for accelerating the breeding process of common wheat.
QH-1, characterized as a spring wheat variant, exhibits notable phenotypic traits and resistance attributes, including a compact plant stature of approximately 90 cm, increased tillering, slender grains, and robust disease resistance. In contrast, DW, a tetraploid wheat variety, holds the second position after common wheat and accounts for approximately 5% of the global annual wheat yield. DW is extensively cultivated across Europe, North Africa, and West Asia, where it is predominantly used in local culinary practices [29,30]. The plants are shorter in height, with sturdy stems that are resistant to lodging, and have larger grains. Furthermore, they exhibit strong stress resistance and high grain hardness, rendering them exceptional parental lines for genetic breeding. This study utilized a RIL population derived from two tetraploid wheat materials, “QH-1” and “DW”, as parents. The investigation focused on 11 yield-related traits over a period of three years in two environmental locations, Yang Ling, Shaanxi, and Lin He, Inner Mongolia. By combining the survey results of the parents and RIL population materials with genotyping using the wheat55K SNP chip strategy, additive QTL analysis was conducted in single and multiple environments, aiming to identify the major genes or loci influencing yield-related traits in tetraploid wheat. This study conducted gene mining and material characteristic evaluation on two levels to provide a theoretical basis for genetic improvement of yield-related traits in wheat.

2. Results

2.1. Phenotypic Differences and Analysis

To assess variances among materials, an examination of 11 traits within the recombinant inbred line (RIL) population comprising parental and hybrid combinations was conducted. The findings indicated a marked elevation in the lengths of PL, NL, and SL linked to yield in QH-1 in contrast to DW and KW in DW, which significantly surpassed that of QH-1, with no observable change in KL. Consequently, it is evident that TKW, KC, and KAR in DW exhibit slight superiority over those in QH-1 (Figure 1 and Table 1).
Through BLUE analysis of parental and RIL populations across five environmental time points (2021-2023YL and 2022-2023LH), followed by normal distribution assessment, it was observed that all 11 yield-associated traits displayed a continuous distribution and transgressive segregation, indicative of quantitative trait attributes governed by multiple genes (Table 1 and Figure S1). Examination of population phenotypes via H2 analysis unveiled that FD, HD, and KAR are prone to environmental influences, whereas the remaining traits are predominantly determined by genetic factors (Table 1).

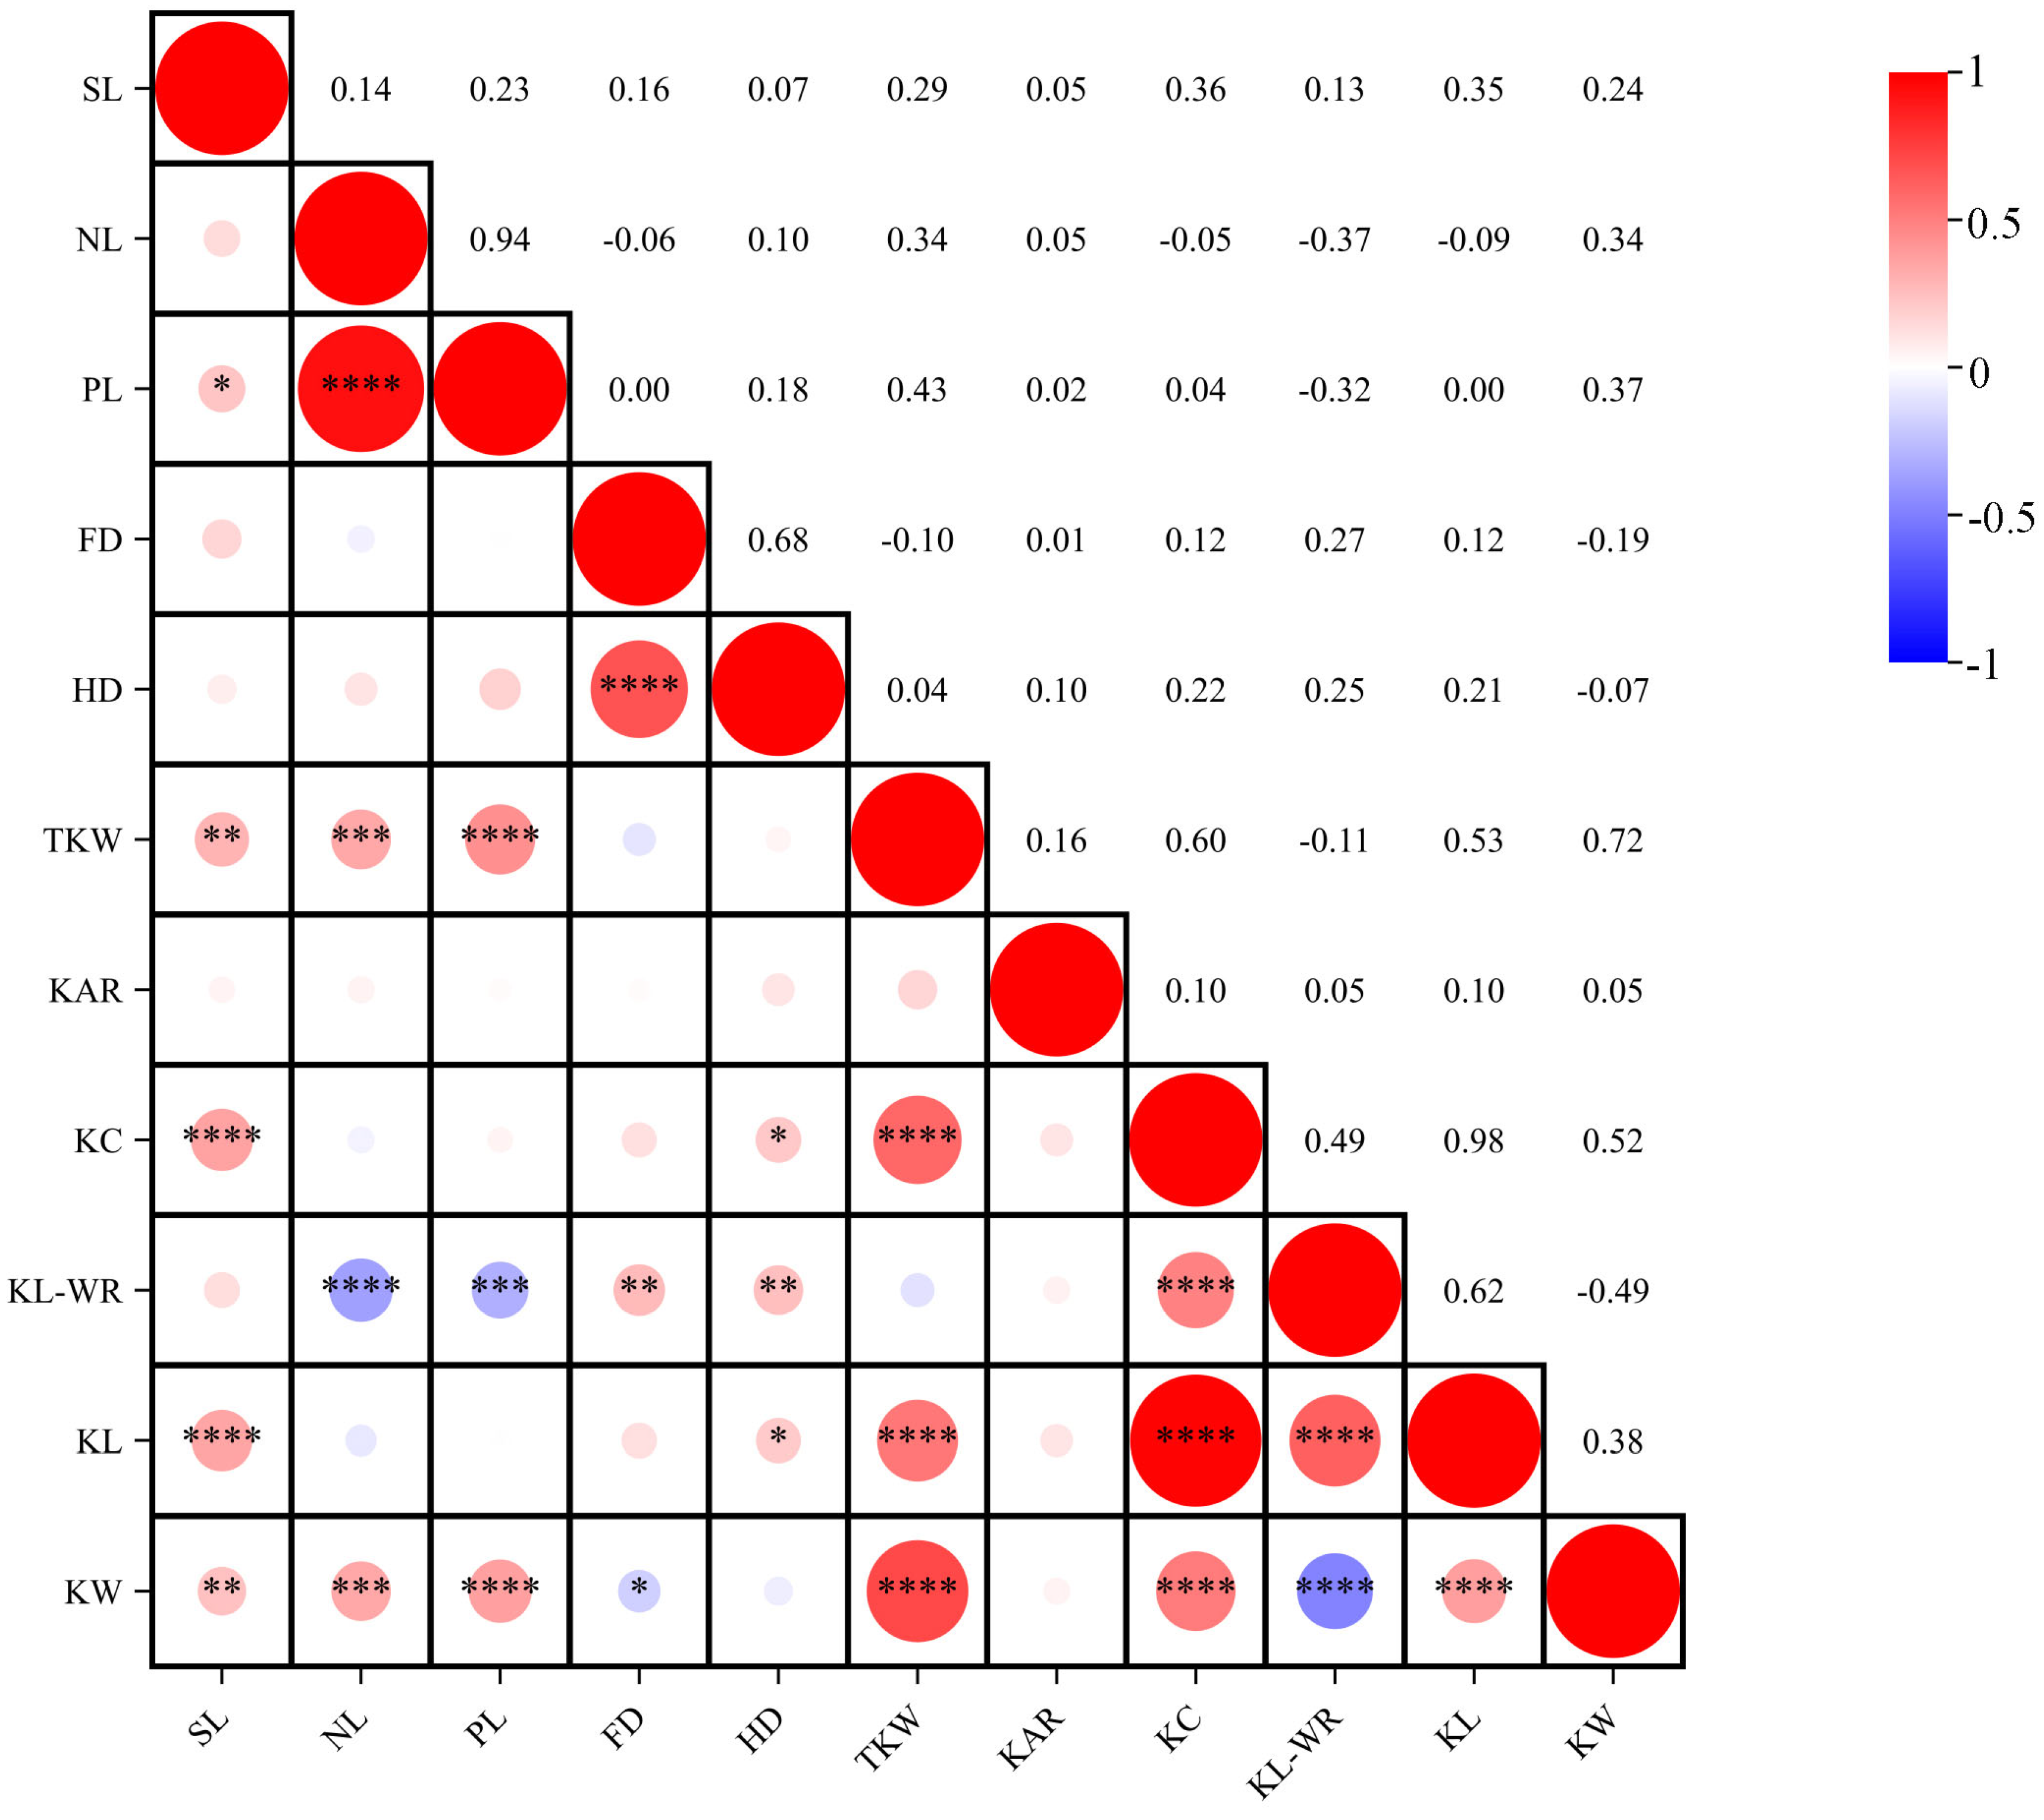
2.2. Correlation Analyses among Different Traits

The phenotypic correlations among the 11 agronomic traits, as determined by BLUE values, are visually depicted in Figure 2. The analysis indicates notably strong positive correlations (p < 0.01) between PL and NL; HD and FD; TKW and SL, NL, PL; KC and SL, TKW; KL-WR and FD, HD, KC; KL and SL, TKW, KC, KL-WR; KW and SL, NL, PL, TKW, KC, KL. Notably, the correlation coefficient between KC and KL is the most pronounced at 0.98, followed by 0.94 between PL and NL. Furthermore, a significant negative correlation (p < 0.01) is observed between KL-WR and NL, PL, and KW, with the strongest correlation coefficient being −0.49. Collectively, the holistic evaluation of yield traits indicates a marked positive correlation among the majority of traits within the population, exerting a supportive role in the developmental trajectory.

2.3. Genetic Map Construction

Genotyping of all 120 families of RILs was performed using the Wheat 55K SNP chip. Following thorough filtration through software and manual curation, a total of 11,704 pure and polymorphic SNP markers differing between the parental lines were identified after excluding SNPs with unsuccessful genotype calls. Subsequently, employing the BIN function of IciMapping V4.1, measures were taken to eliminate missing values, segregational distortions surpassing the predefined threshold, and redundant markers, resulting in a refined collection of 913 high-quality SNP markers. The constructed genetic map spans a total length of 2141.26 cM, showcasing an average marker density of 2.35 cM per SNP. Through a comparative analysis of the probe information in the SUM file of the mapping outcomes with the genomic data of Chinese Spring wheat, a subset of 848 informative probes residing on the A/B chromosome groups was identified, distributed across 26 linkage groups spanning 14 chromosomes (Table S1).

2.4. QTL Mapping Analysis

The ICIM-BIP approach was employed to identify additive QTLs associated with the 11 specified traits, leading to the detection of a total of 100 additive QTLs as presented in Table S2. These QTLs exhibited a range of LOD values from 2.50 to 26.71 and were located on 14 chromosomes, explaining 0.23% to 55.42% of the phenotypic variance (Table S2). Notably, within the identified additive QTLs, a subset of 41 were categorized as major QTLs, with 9 demonstrating stability across multiple environmental conditions, spanning eight distinct traits. These nine stable QTLs are named QSL.QD-1A.1, QNL.QD-4B.2, QPL.QD-4B.1, QFD.QD-2B, QHD.QD-2B.1, QHD.QD-4B, QKC.QD-4B.2, QKL-WR.QD-4B.6, and QKL.QD-4B.2 (Table 2 and Table S2, Figure 3).

2.5. Combined QTL–Environment Interaction Analysis

The MET-Add method was used for cQTL analysis, and a total of 259 additive cQTLs for SL (22), NL (26), PL (21), FD (10), HD (16), TKW (28), KAR (18), KC (27), KL-WR (42), KL (28), and KW (21) were mapped (Table S4). Most of these cQTLs were minor QTLs. Moreover, all of the nine stable QTL detected using the ICIM-BIP method were similarly detected using the MET-Add method (Tables S2 and S3), showing that they might be stable in expression and less susceptible to environmental influences. Among the nine stable QTLs located on eight traits, the proportion of phenotypic variance explained (PVE) by the additive genetic effect (PVE (A)) is higher than PVE (A/E) for six QTLs associated with SL, PL, HD, KC, and KL traits. This indicates that the additive effects of these six stable major loci have a greater impact on the phenotypic variation compared to environmental effects, suggesting that genetic factors play a dominant role in phenotypic variation. Therefore, these loci can be utilized for genetic improvement to effectively enhance the quality traits. On the other hand, for NL, FD, and KL-WR traits, the PVE (A) is lower than PVE (A/E) for the stable major loci associated with these traits. This suggests that environmental effects have a greater influence on phenotypic variation compared to additive effects, indicating that environmental factors dominate the phenotypic variation for these traits.
In addition, the analysis results of the ICIM-BIP method and the MET-Add method both show that the additive effect values of QSL.QD-1A.1, QNL.QD-4B.2, QPL.QD-4B.1, and QFD.QD-2B in the nine stable QTLs are positive, indicating that the enhancing alleles at these four loci originate from the parent QH-1. The additive effect values of QHD.QD-2B.1, QHD.QD-4B, QKC.QD-4B.2, QKL-WR.QD-4B.6, and QKL.QD-4B.2 are negative, indicating that the enhancing alleles at these five loci originate from the parent DW.

2.6. Analysis of the Effects of Stable Major Loci

To assess the impact of different genotypes on the associated phenotypes, families with predicted homozygous genotypes at relevant loci were identified using genotyping data generated by the wheat 55K SNP chip and genotypic values predicted by IciMapping. Families exhibiting plausible homozygous genotypes for the respective loci were selected. These families were then categorized into the Qin Hei (QH) type and Durum Wheat (DW) type based on the sources of homozygous alleles at the corresponding QTL loci within the population. Subsequently, the phenotypic traits linked to stable loci in the two genotype groups were subjected to analysis.
As can be seen from Figure 4, the genotypic effects predicted by IciMapping for the eight traits characterized by stable loci show consistently higher values in the QH type lines compared to the DW type. This observation suggests that the allelic genotype of the parental line QH-1 exerts an additive influence on these eight traits. Specifically, in the yield-related trait SL, noteworthy variations between the two types were apparent at environmental points 2023LH and 2022YL, with the QH type exhibiting superior performance by 6.55% and 9.97% (p < 0.01), respectively. For the NL trait, substantial differences between the two types were observed at environmental points 2023LH and 2022YL, with the QH type surpassing the DW type by 54.7% and 27.8% (p < 0.01), respectively. Furthermore, in the FD trait, significant differences between the two types were detected at environmental points 2023YL and 2022YL, with the QH type outperforming the DW type by 7.11% and 11.77% (p < 0.01), respectively. These three genotypes with notable or highly notable differences exhibit positive additive effects attributed to QH-1, corroborating the notion that the enhancing alleles at these three loci stem from the parent QH-1, as evidenced by the positive additive effect values of stable QTLs QSL.QD-1A.1, QNL.QD-4B.2, and QFD.QD-2B in the aforementioned investigation.

2.7. Candidate Gene Prediction Analysis

Firstly, gene prediction was conducted for two identified QTLs demonstrating significant enhancing effects among the nine stable loci. The stable locus QSL.QD-1A.1 associated with the SL trait is positioned between the flanking markers AX-109410802 and AX-108955152 at 20.71–22.71 cM on chromosome 1A. This genomic region corresponds to 573262270 to 577688284 bp in the Chinese Spring (CS) v2.1 genome and 543283549 to 566194763 bp in the Durum Wheat (cv. Svevo) genome, where a total of 69 and 345 genes were annotated, respectively (Figure 5a, Tables S4 and S5). The stable locus QNL.QD-4B.2 linked to the NL trait is situated between the flanking markers AX-110031800 and AX-108848122 at 78.59–79.09 cM on chromosome 4B. This genomic interval corresponds to 34621265 to 36338556 bp in the Chinese Spring (CS) v2.1 genome and 30286784 to 31756035 bp in the Durum Wheat (cv. Svevo) genome, with a total of 25 and 19 annotated genes, respectively (Figure 5b, Tables S4 and S5). Similarly, predictive analyses were performed for the remaining seven QTLs. In the Chinese Spring (CS) v2.1 genome, within the corresponding loci of QPL.QD-4B.1, QFD.QD-2B, QHD.QD-2B.1, QHD.QD-4B, QKC.QD-4B.2, QKL-WR.QD-4B.6, and QKL.QD-4B.2, 25, 110, 3, 94, 18, 15, and 18 genes were annotated, respectively. In the Durum Wheat (cv. Svevo) genome, within the corresponding loci, 19, 883, 85, 295, 14, and 295 genes were annotated, respectively (Figure S2, Tables S4 and S5).

3. Discussion

3.1. Analysis and Discussion of Enrichment of QTL Clusters in Agronomic Traits and Correlation among Agronomic Traits

In most crop localization studies, QTLs related to some agronomic traits are clustered on chromosomes, indicating that genes controlling multiple traits may be located in the same marker interval or adjacent regions. Researchers refer to this phenomenon as QTL clusters [31,32]. In addition, researchers have found a direct relationship between the enrichment of agronomic traits in QTL clusters and the traits themselves [33,34]. In this study, through the analysis of QTL positioning results in a single environment, it was found that a total of 20 QTL clusters were located on six chromosomes (Table S6). These QTL clusters collectively contain 51 QTLs, with 7 stable QTLs distributed in 5 QTL clusters, accounting for about 77.8% of the stable QTLs detected by the ICIM-BIP method. In-depth analysis of these five QTL clusters revealed that traits such as FD and HD in cluster C5 belong to phenological traits with a significantly high correlation coefficient between them, but their correlation with the plant type trait SL in the same QTL cluster is not high. Cluster C18 contains four QTLs for FD, KW, NL, and PL, respectively. Combined with the analysis of the correlation between the corresponding agronomic traits, it was found that FD and KW are significantly negatively correlated with a correlation coefficient of −0.19; FD has no significant correlation with NL or PL; NL, with PL and KW, shows a significant positive correlation, with correlation coefficients of 0.94 and 0.34, respectively. Similarly, through the comprehensive analysis of the other three QTL clusters, it was found that there are single-locus multiple-trait effects within the QTL clusters, and the performance of agronomic traits in the field cannot be directly correlated. The magnitude of the correlation coefficient of agronomic traits and whether they are positively or negatively correlated can only be used as a reference but cannot directly determine whether the traits will appear in the same QTL cluster.

3.2. Exploration of the Application of Different Types of Arrays in Wheat Materials with Different Ploidies

The application of marker-assisted selection (MAS) at the whole-genome level has accelerated the breeding process of wheat. Subsequently, there have been advancements ranging from PCR-based molecular markers and extensive coverage provided by Genotyping-by-Sequencing (GBS) offered by NGS, to flexible and diverse SNP arrays. Of course, within these methods, there are certain advantages and limitations. For example, PCR-based molecular markers exhibit lower throughput and density, and many wheat traits are often influenced by multiple genes, leading to poor detection of minor genes by functional markers. Although NGS can significantly improve coverage and reduce time and cost, the poor detection ability of GBS, especially in heterozygous or early populations, is particularly evident. In addition, GBS is a time-consuming and complex process in terms of library construction, data analysis, and storage. On the other hand, SNP arrays offer great flexibility in sample and data point customizations. There are currently 9 K, 15 K, 35 K, 55 K, 90 K, 820 K, and 660 K arrays available for wheat. In the determination of SNP density distribution, the chromosomes were divided into 1 MB windows for calculation. It was observed that almost all bins in the Wheat 660 K SNP array contained SNPs, whereas the other four arrays detected many bins without SNPs (especially the Wheat 35 K, 55 K, and 90 K SNP arrays). In comparison to the Wheat 820 K SNP array, more SNPs were found at the top or end of the chromosomes in the Wheat 660 K SNP array, indicating a higher frequency of recombination events in these regions compared to the centromeric regions [35]. Thus, it is suggested that a lower coverage array such as the 55 K array could satisfy the purpose of mapping loci in a small-sized population [36]. The high-throughput SNP arrays are more suited for larger-sized fne-mapping populations or for detecting as many polymorphism loci as possible for wheat-related species in Triticeae such as Agropyron [37].
Currently, the application of the 55 K and 660 K arrays is primarily focused on hexaploid wheat, with relatively limited application in tetraploid wheat. One of the reasons for this is the reduced number and density of applied markers, which subsequently impacts the length of the genetic map and the size of the localization interval. In a study by Jiajun Liu et al., utilizing the 55 K array in common wheat (Triticum aestivum L.), a genetic map of an RIL population with 2524 bin markers was mapped on 34 linkage maps for the 21 chromosomes of wheat. The genetic map length was found to be 3021.04 cM, with an average of 1.20 cM per marker [28]. In a study by Ziqiang Mo, utilizing a RILs population created from tetraploid wheat materials, 150 bin markers were mapped onto 15 linkage groups across the 14 chromosomes of tetraploid wheat, with a total length of 2411.8 cM and an average marker density of 2.10 cM per bin [27]. In this study, 486 effective probes were obtained from a RIL population created from tetraploid materials using the 55 K array. The genetic map generated from these effective probes spanned 21 linkage groups, with a total genetic distance of 4397.21 cM. The average marker density between adjacent markers was 9.05 cM. Another factor contributing to the limited application on tetraploid wheat is the interference of D genome group probes during database alignment, which may lead to the inclusion of some unreliable localization intervals. These intervals often exhibit discrepancies between the information of neighboring probes, necessitating their exclusion.

3.3. Candidate Gene Prediction Analysis within the QTL Mapping Interval

The stable locus QSL.QD-1A.1 on the spike length trait is located on 543283549 to 566194763 bp in the Durum Wheat (cv. Svevo) genome. Mengistu et al. identified QTL related to yield in this interval [38]. In this mapping interval, M. Graziani et al. identified QTLs regulating grain weight and test weight [39]. Within this interval, there is a potential gene, TRITD1Av1G218480, corresponding to Chinese Spring v2.1 genome TraesCS1A03G1004700, which belongs to the AP2/B3 transcription factor family protein and plays a role as an ethylene-responsive transcription factor. Wang Yuange et al. identified DUO-B1, encoding an AP2/ERF transcription factor, using wheat as a model. This transcription factor regulates the spikelet structure of bread wheat. Furthermore, mutations in DUO-B1 result in slightly more spikelets and increased grain number per spike [40]. In this interval, there is also a gene, TraesCS1A02G413800, which is functionally annotated as DELLA protein GAI. The function of DELLA protein in dwarfing genes is well understood, and the plant height also has a direct impact on spike length. NL is part of PL and the peduncle is part of plant height (PH); they are significantly influenced by the GA metabolism and signaling [3,7] and thus tightly linked to the PH genes. Recently, a PL QTL independent of PH was identified on 5AS [8], providing a chance to modulate the PL. In this study, QNL.QD-4B.2 and QPL.QD-4B.1 are located in the same interval. In this interval, we speculate that the genes TRITD4Bv1G012860 or TRITD4Bv1G012960 may play a regulatory role in PL and NL. These genes have a Vps4 function. Vps4 is a key component required for ESCRT-III disassembly and endosomal vesicle formation. The plant-specific ESCRT component, known as PROS, is a positive regulator of Vps4 ATPase activity. PROS interacts with Vps4 and the Vps4 positive regulator LIP5/VTA1. PROS is expressed in various tissues and cell types in Arabidopsis, and its silencing results in reduced cell proliferation and abnormal organ growth [41,42].
Synchronization of flowering time with favorable conditions for seed reproduction plays a vital role in plant species survival and is crucial for enhancing crop yield and global food security. The developmental process of wheat is intricate and governed by multiple genes categorized based on their response to vernalization (Vrn) and photoperiod (Ppd), or their influence on earliness per se (Eps). These genes orchestrate flowering time by regulating variations in the ultimate leaf count, phyllochron, and the duration of the flag leaf-anthesis phase. Notably, this study identified a previously documented locus associated with flowering time within the mapping region of QFD.QD-2B [43,44]. There is a corresponding region identified by previous researchers within the mapping interval of QHD.QD-2B.1 [45]. Within the mapping interval of QHD.QD-4B, there is a corresponding region where previous researchers have identified a similar mapping interval [44].
KC and KL are located in the same interval (653.1 MB–654.8 MB, Durum Wheat reference genome), where known QTLs regulating grain weight are present [46]. The aspect ratio of the kernel is often directly related to the length of the kernel and the weight of the kernel. Within this range, there is a mapping interval for the aspect ratio of the kernel, as studied by Peleg and others [47,48]. In previous research reports, the interaction module between miR1432 and acyl-CoA synthetase significantly increased kernel weight by improving the grain filling rate, thereby increasing total grain yield [49]. The ZmCesA5 gene in corn encodes a glycosyltransferase protein. Overexpression of the ZmCesA5 gene results in heavier grains, while its deletion affects the metabolism of starch and sucrose, leading to a reduction in corn grain weight [50]. Therefore, we speculate that within the QKC.QD-4B.2 and QKL.QD-4B.2 loci, the functional annotation of TRITD4Bv1G199600 as fatty acyl-CoA reductase may play a role in regulating KL and KC. Additionally, within the QKL-WR.QD-4B.6 locus, the functional annotation of TRITD4Bv1G017750 as glycosyltransferase may influence the KL-WR.

4. Materials and Methods

4.1. Plant Materials and Field Trials

In this study, two tetraploid wheat cultivars, namely “Qin Hei-1” (QH-1) and “Durum Wheat T6” (DW), were selected as the parental lines for crossbreeding. A population of 120 genotypes of recombinant inbred lines (RILs) was generated through the single seed descent method and employed as the experimental subjects.
Throughout the wheat growing seasons in Yang Ling, Shaanxi (108°07′ E, 34°30′ N) during 2020–2021 (YL21), 2021–2022 (YL22), and 2022–2023 (YL23), as well as in Lin He, Inner Mongolia (107°44′ E, 44°17′ N) during the 2021–2022 (LH22) and 2022–2023 (LH23) seasons, RILs along with the parental lines were cultivated for this study. Before sowing, the experimental fields were plowed, leveled, and fertilized. Throughout the growth phase of the plants, standard field management practices such as weeding and winter irrigation were implemented. The population was randomly segregated into three distinct small plots situated in various sections of the experimental field, with each small plot containing one replicate. Each line was sown in a single row, with a row length of 1.5 m, plant spacing set at 10 cm, and row spacing at 25 cm.

4.2. Phenotypic Evaluation and Statistical Analysis

Eleven significant agronomic traits related to yield were assessed across parental and population materials from diverse perspectives. These traits encompassed three plant type-related agronomic characteristics that were manually assessed post-flowering, namely, peduncle length (PL), neck length (NL), and spike length (SL). Specifically, PL denotes the distance from the spike’s base to the initial internode, NL represents the measurement from the spike’s base to the flag leaf ear, while SL indicates the length of the spike itself. Additionally, two traits linked to the growth phase, namely, flowering date (FD) and heading date (HD), were examined. For each trait, five plant materials were selected in each replicate for subsequent statistical analysis. After harvest, six grain-related agronomic traits were quantified using an SC-G type automatic grain analyzer from Hangzhou Wanshen Testing Technology Co., Ltd., China (Hangzhou, China). These traits comprised thousand-kernel weight (TKW), kernel area ratio (KAR), kernel circumference (KC), kernel length (KL), kernel width (KW), and kernel length–width ratio (KL-WR). Each line material in the population was measured five times per replicate for statistical analysis. For data processing, we referred to the method proposed by Ma et al. [22].

4.3. Genotyping and Genetic Map Construction

The genomic DNA (gDNA) of each RIL and the wheat 55K SNP array work were entrusted to Beijing CapitalBio Corporation (https://www.capitalbiotech.com/, accessed on 8 September 2022) for execution.
After genetic typing results were obtained, a comparison of SNP markers was conducted between the parental entities, leading to the elimination of failed markers and the identification of polymorphic markers. Additionally, SNP markers showing heterozygous genotypes and allele frequencies less than 0.3 or greater than 0.7 between the parents were further excluded. Considering that the RIL population was derived from the tetraploid wheat background and the reference was the 55K chip based on the hexaploid wheat background, the probe positions in the BIN template file were all marked as “0” in the Anchor table using the QTL IciMapping V4.1 (https://isbreeding.caas.cn/, accessed on 26 September 2023) mapping software. The redundant markers were then removed using the “By Missing” command to obtain BIN markers for constructing the genetic map. In the MAP module, a LOD value of 7.5 was selected, and the nnTwoOpt algorithm and SARF standard were used for marker sorting and rippling. The output sum file from MAP was used for mapping and labeling screening, with reference to the Chinese Spring wheat reference genome (https://urgi.versailles.inrae.fr/download/iwgsc/IWGSC_RefSeq_Assemblies/v2.1/, accessed on 12 October 2023). By comparing and filtering, erroneous values were removed or replaced, and the positioning map was ultimately limited to only the 14 chromosomes of the A and B chromosome groups. The genetic distances were converted from recombination rates to centimorgans (cM) using the Kosambi mapping function, and a genetic linkage map was drawn using MapChart V2.3.

4.4. Quantitative Trait Loci Mapping

QTL analysis was undertaken for the 11 agronomic traits using IciMappingV4.1 [22,23,27]. Among the detected additive QTLs, those with LOD > 3 and that explained phenotypic variation > 10% were defined as major QTLs. Additive QTLs that can be detected in two or more individual environments were also considered stable QTLs. The multi-environment trials (MET-Add) module of IcimappingV4.1 was used to identify cQTL (combined quantitative trait loci), and epistatic analysis was performed using the IciMappingV4.1 MET-EPI module and eQTL (epistatic quantitative trait loci) detection [22]. QTLs were named based on the International Rules of Genetic Nomenclature, where “QD” is the abbreviation of the parents QH-1 and DW.
For flanking sequences of key or consistent QTL data processing, we referred to the method proposed by Ma et al. [22]. Subsequently, Uniprot was employed for in-depth annotation and functional scrutiny of the candidate genes within the QTL regions (https://www.uniprot.org/, accessed on 25 October 2023) [22].

Supplementary Materials

The following supporting information can be downloaded at: https://www.mdpi.com/article/10.3390/plants13101285/s1, Figure S1: Frequency distributions for spike length (SL), neck length (NL), peduncle length (PL), flowering date (FD), heading date (HD), thousand-kernel weight (TKW), kernel area ratio (KAR), kernel circumference (KC), kernel length (KL), kernel width (KW), and kernel length–width ratio (KL-WR) based on BLUE; Figure S2. Physical maps of the QPL.QD-4B.1 (a), QFD.QD-2B (b), QHD.QD-2B.1 (c), QHD.QD-4B (d), QKC.QD-4B.2 (e), QKL-WR.QD-4B.6 (f), and QKL.QD-4B.2 (g) on “CS” and Durum Wheat; dotted lines indicate homologous genes; Table S1: Distribution of markers on 26 linkage groups in the genetic map; Table S2: All of the QTLs in this study for the 11 traits in different environments; Table S3: QTL detected for the 11 traits from multi-environment trials (MET); Table S4: Gene and functional annotation on the reference genome of Chinese Spring or Durum Wheat within the localization interval; Table S5: The candidate genes in the localization interval were compared between Chinese Spring and Durum Wheat genomes; Table S6: QTL clusters affecting two or more traits.

Author Contributions

Y.J. performed the experiments and analyzed the data. C.M. provided help in data analysis and manuscript preparation. Y.Z. and Y.S. participated in field experiments and phenotype measurement. H.Z. and J.H. contributed the materials. Z.W. conceived and designed the study, and revised and polished the manuscript. Y.J. wrote the manuscript. Y.B., Y.W., W.J., H.B. and S.H. provided assistance in the revision of the article. All authors have read and agreed to the published version of the manuscript.

Funding

This work was supported by the Programme of Introducing Talents of Innovative Discipline to Universities (Project 111) from the State Administration of Foreign Experts Affairs ‘Crop breeding for disease resistance and genetic improvement’ (B18042), the “Science and Technology Boosting Inner Mongolia” project, enhancement of industrialization of hard wheat in the Yellow River Basin (NMKJXM202201), and the National Natural Science Foundation of China (31960428).

Data Availability Statement

The data presented in this study are available in this article and the Supplementary Materials.

Conflicts of Interest

The authors declare no conflicts of interest.

References

  1. Slafer, G. Genetic basis of yield as viewed from a crop physiologist’s perspective. Ann. Appl. Biol. 2003, 142, 117–128. [Google Scholar] [CrossRef]
  2. Kim, J.; Song, M.; Lee, J.; Ahn, S.; Ku, J. QTL Analysis of Seed and Growth Traits using RIL Population in Soybean. Cancer 2008, 83, 98–102. [Google Scholar]
  3. Zhang, N.; Fan, X.; Cui, F.; Zhao, C.; Zhang, W.; Zhao, X.; Yang, L.; Pan, R.; Chen, M.; Han, J.; et al. Characterization of the temporal and spatial expression of wheat (Triticum aestivum L.) plant height at the QTL level and their influence on yield-related traits. Theor. Appl. Genet. 2017, 130, 1235–1252. [Google Scholar] [CrossRef]
  4. Dixon, L.; Pasquariello, M.; Boden, S. TEOSINTE BRANCHED1 regulates height and stem internode length in bread wheat. J. Exp. Bot. 2020, 71, 4742–4750. [Google Scholar] [CrossRef]
  5. Dai, L.; Liu, C. Relationship between relative length of head neck and grain weight per spike of wheat. Agric. Technol. Commun. 1988, 11, 6. [Google Scholar]
  6. Bridgemohan, P.; Bridgemohan, R. Evaluation of anti-lodging plant growth regulators on the growth and development of rice (Oryza sativa). Acad J. 2014, 5, 12–16. [Google Scholar]
  7. Li, F.; Wen, W.; Liu, J.; Zhang, Y.; Cao, S.; He, Z.; Rasheed, A.; Jin, H.; Zhang, C.; Yan, J.; et al. Genetic architecture of grain yield in bread wheat based on genome-wide association studies. BMC Plant Biol. 2019, 19, 168. [Google Scholar] [CrossRef] [PubMed]
  8. Li, C.; Luo, W.; Zhang, X.; Mu, Y.; Deng, M.; Liu, Y.; Jiang, Q.; Chen, G.; Qi, P.; Pu, Z.; et al. A novel, validated, and plant height-independent QTL for spike extension length is associated with yield-related traits in wheat. Theor. Appl. Genet. 2020, 133, 3381–3393. [Google Scholar] [CrossRef]
  9. Liu, Z.; Zhao, P.; Lai, X.; Wang, X.; Ji, W.; Xu, S. The selection and application of peduncle length QTL QPL_6D.1 in modern wheat (Triticum aestivum L.) breeding. Theor. Appl. Genet. 2023, 136, 32. [Google Scholar] [CrossRef]
  10. Yao, H.; Xie, Q.; Xue, S.; Luo, J.; Ma, Z. HL2 on chromosome 7D of wheat (Triticum aestivum L.) regulates both head length and spikelet number. Theor. Appl. Genet. 2019, 132, 1789–1797. [Google Scholar] [CrossRef]
  11. Xiong, H.; Li, Y.; Guo, H.; Xie, Y.; Liu, L. Genetic Mapping by Integration of 55K SNP Array and KASP Markers Reveals Candidate Genes for Important Agronomic Traits in Hexaploid Wheat. Front. Plant Sci. 2021, 12, 628478. [Google Scholar] [CrossRef] [PubMed]
  12. Zhang, J.; Xiong, H.; Guo, H.; Li, Y.; Xie, X.; Xie, Y.; Zhao, L.; Gu, J.; Zhao, S.; Ding, Y. Identification of the Q Gene Playing a Role in Spike Morphology Variation in Wheat Mutants and Its Regulatory Network. Front. Plant Sci. 2022, 12, 807731. [Google Scholar] [CrossRef] [PubMed]
  13. Jung, C.; Müller, A. Flowering time control and applications in plant breeding. Trends Plant Sci. 2009, 14, 563–573. [Google Scholar] [CrossRef] [PubMed]
  14. Zhang, X.; Liu, G.; Chuan, L.; Xia, T.; Zhao, J. Fine Mapping of a Novel Heading Date Gene, TaHdm605, in Hexaploid Wheat. Front. Plant Sci. 2018, 9, 1059. [Google Scholar] [CrossRef]
  15. Fu, D.; Szucs, P.; Yan, L.; Helguera, M.; Skinner, J.; von Zitzewitz, J.; Hayes, P.; Dubcovsky, J. Large deletions within the first intron in VRN-1 are associated with spring growth habit in barley and wheat. Mol. Genet. Genom. 2005, 273, 54–65. [Google Scholar] [CrossRef] [PubMed]
  16. Kippes, N.; Zhu, J.; Chen, A.; Vanzetti, L.; Lukaszewski, A.; Nishida, H.; Kato, K.; Dvorak, J.; Dubcovsky, J. Fine mapping and epistatic interactions of the vernalization gene VRN-D4 in hexaploid wheat. Mol. Genet. Genom. 2014, 289, 47–62. [Google Scholar] [CrossRef] [PubMed]
  17. Yan, L.; Loukoianov, A.; Blechl, A.; Tranquilli, C.; Ramakrishna, W.; Sanmiguel, P.; Bennetzen, J.L.; Echenique, V.; Dubcovsky, J. The Wheat VRN2 Gene Is a Flowering Repressor Down-Regulated by Vernalization. Science 2004, 303, 1640–1644. [Google Scholar] [CrossRef] [PubMed]
  18. Yoshida, T.; Nishida, H.; Zhu, J.; Nitcher, R.; Distelfeld, A.; Akashi, Y.; Kato, K.; Dubcovsky, J. Vrn-D4 is a vernalization gene located on the centromeric region of chromosome 5D in hexaploid wheat. Theor. Appl. Genet. 2010, 120, 543–552. [Google Scholar] [CrossRef]
  19. Murai, K.; Miyamae, M.; Kato, H.; Takumi, S.; Ogihara, Y. WAP1, a wheat APETALA1 homolog, plays a central role in the phase transition from vegetative to reproductive growth. Plant Cell Physiol. 2003, 44, 1255–1265. [Google Scholar] [CrossRef]
  20. Prashant, R.; Kadoo, N.; Desale, C.; Kore, P.; Dhaliwal, H.S.; Chhuneja, P.; Gupta, V. Kernel morphometric traits in hexaploid wheat (Triticum aestivum L.) are modulated by intricate QTL×QTL and genotype×environment interactions. J. Cereal Sci. 2012, 56, 432–439. [Google Scholar] [CrossRef]
  21. Lizana, X.; Riegel, R.; Gomez, L.; Herrera, J.; Isla, A.; McQueen-Mason, S.J.; Calderini, D.F. Expansins expression is associated with grain size dynamics in wheat (Triticum aestivum L.). J. Exp. Bot. 2010, 61, 1147–1157. [Google Scholar] [CrossRef]
  22. Ma, C.; Liu, L.; Liu, T.; Jia, Y.; Jiang, Q.; Bai, H.; Ma, S.; Li, S.; Wang, Z. QTL Mapping for Important Agronomic Traits Using a Wheat55K SNP Array-Based Genetic Map in Tetraploid Wheat. Plants 2023, 12, 847. [Google Scholar] [CrossRef] [PubMed]
  23. Qu, X.; Li, C.; Liu, H.; Liu, J.; Luo, W.; Xu, Q.; Tang, H.; Mu, Y.; Deng, M.; Pu, Z. Quick mapping and characterization of a co-located kernel length and thousand-kernel weight-related QTL in wheat. Theor. Appl. Genet. 2022, 8, 135. [Google Scholar] [CrossRef]
  24. Wang, Z.; Wang, W.; Xie, X.; Wang, Y.; Yang, Z.; Peng, H.; Xin, M.; Yao, Y.; Hu, Z.; Liu, J.; et al. Dispersed emergence and protracted domestication of polyploid wheat uncovered by mosaic ancestral haploblock inference. Nat. Commun. 2022, 13, 3891. [Google Scholar] [CrossRef]
  25. Wan, H.; Yang, F.; Li, J.; Wang, Q.; Liu, Z.; Tang, Y.; Yang, W. Genetic Improvement and Application Practices of Synthetic Hexaploid Wheat. Genes 2023, 14, 283. [Google Scholar] [CrossRef]
  26. Giancaspro, A.; Giove, S.; Zacheo, S.; Blanco, A.; Gadaleta, A. Genetic Variation for Protein Content and Yield-Related Traits in a Durum Population Derived From an Inter-Specific Cross Between Hexaploid and Tetraploid Wheat Cultivars. Front. Plant Sci. 2019, 10, 1509. [Google Scholar] [CrossRef]
  27. Mo, Z.; Zhu, J.; Wei, J.; Zhou, J.; Xu, Q.; Tang, H.; Mu, Y.; Deng, M.; Jiang, Q.; Liu, Y.; et al. The 55K SNP-Based Exploration of QTLs for Spikelet Number Per Spike in a Tetraploid Wheat (Triticum turgidum L.) Population: Chinese Landrace “Ailanmai” × Wild Emmer. Front. Plant Sci. 2021, 12, 732837. [Google Scholar] [CrossRef] [PubMed]
  28. Liu, J.; Luo, W.; Qin, N.; Ding, P.; Zhang, H.; Yang, C.; Mu, Y.; Tang, H.; Liu, Y.; Li, W.; et al. A 55 K SNP array-based genetic map and its utilization in QTL mapping for productive tiller number in common wheat. Theor. Appl. Genet. 2018, 131, 2439–2450. [Google Scholar] [CrossRef]
  29. de Sousa, T.; Ribeiro, M.; Sabença, C.; Igrejas, G. The 10,000-Year Success Story of Wheat! Foods 2021, 10, 2134. [Google Scholar] [CrossRef] [PubMed]
  30. Shewry, P.; Sandra, H. Do “ancient” wheat species differ from modern bread wheat in their contents of bioactive components? J. Cereal Sci. 2015, 65, 469–476. [Google Scholar] [CrossRef]
  31. Su, Q.; Zhang, X.; Zhang, W.; Zhang, N.; Song, L.; Liu, L.; Xue, X.; Liu, G.; Liu, J.; Meng, D.; et al. QTL Detection for Kernel Size and Weight in Bread Wheat (Triticum aestivum L.) Using a High-Density SNP and SSR-Based Linkage Map. Front. Plant Sci. 2018, 9, 1484. [Google Scholar] [CrossRef]
  32. Hina, A.; Cao, Y.; Song, S.; Li, S.; Sharmin, R.A.; Elattar, M.A.; Bhat, J.A.; Zhao, T. High-Resolution Mapping in Two RIL Populations Refines Major “QTL Hotspot” Regions for Seed Size and Shape in Soybean (Glycine max L.). Int. J. Mol. Sci. 2020, 21, 1040. [Google Scholar] [CrossRef]
  33. Roncallo, P.F.; Akkiraju, P.C.; Cervigni, G.L.; Echenique, V.C. QTL mapping and analysis of epistatic interactions for grain yield and yield-related traits in Triticum turgidum L. var. durum. Euphytica 2017, 213, 277. [Google Scholar] [CrossRef]
  34. Maccaferri, M.; Cane’, M.; Sanguineti, M.; Salvi, S.; Colalongo, M.; Massi, A.; Clarke, F.; Knox, R.; Pozniak, C.; Clarke, J.; et al. A consensus framework map of durum wheat (Triticum durum Desf.) suitable for linkage disequilibrium analysis and genome-wide association mapping. BMC Genom. 2014, 15, 873. [Google Scholar] [CrossRef]
  35. Sun, C.; Dong, Z.; Zhao, L.; Ren, Y.; Zhang, N.; Chen, F. The Wheat 660K SNP array demonstrates great potential for marker-assisted selection in polyploid wheat. Plant Biotechnol. J. 2020, 18, 1354–1360. [Google Scholar] [CrossRef]
  36. Ren, T.; Fan, T.; Chen, S.; Li, C.; Chen, Y.; Ou, X.; Jiang, Q.; Ren, Z.; Tan, F.; Luo, P. Utilization of a Wheat55K SNP array-derived high-density genetic map for high-resolution mapping of quantitative trait loci for important kernel-related traits in common wheat. Theor. Appl. Genet. 2021, 134, 873. [Google Scholar]
  37. Zhou, S.; Zhang, J.; Che, Y.; Liu, W.; Lu, Y.; Yang, X.; Li, X.; Jia, J.; Liu, X.; Li, L. Construction of Agropyron Gaertn. genetic linkage maps using a wheat 660K SNP array reveals a homoeologous relationship with the wheat genome. Plant Biotechnol. J. 2018, 16, 818–827. [Google Scholar] [CrossRef]
  38. Mengistu, D.K.; Kidane, Y.G.; Catellani, M.; Frascaroli, E.; Fadda, C.; Pè, M.; Dell, A. High-density molecular characterization and association mapping in Ethiopian durum wheat landraces reveals high diversity and potential for wheat breeding. Plant Biotechnol. J. 2016, 14, 1800–1812. [Google Scholar] [CrossRef]
  39. Graziani, M.; Maccaferri, M.; Royo, C.; Salvatorelli, F.; Tuberosa, R.J.C.; Science, P. QTL dissection of yield components and morpho-physiological traits in a durum wheat elite population tested in contrasting thermo-pluviometric conditions. Field Crops Res. 1998, 59, 163–173. [Google Scholar] [CrossRef]
  40. Wang, Y.; Du, F.; Wang, J.; Wang, K.; Tian, C.; Qi, X.; Lu, F.; Liu, X.; Ye, X.; Jiao, Y. Improving bread wheat yield through modulating an unselected AP2/ERF gene. Nat. Plants 2022, 8, 930–939. [Google Scholar] [CrossRef]
  41. Reyes, F.; Buono, R.; Roschzttardtz, H.; Di Rubbo, S.; Yeun, L.; Russinova, E.; Otegui, M. A novel endosomal sorting complex required for transport (ESCRT) component in Arabidopsis thaliana controls cell expansion and development. J. Biol. Chem. 2014, 289, 4980–4988. [Google Scholar] [CrossRef]
  42. Steffens, A.; Jakoby, M.; Hülskamp, M. Physical, Functional and Genetic Interactions between the BEACH Domain Protein SPIRRIG and LIP5 and SKD1 and Its Role in Endosomal Trafficking to the Vacuole in Arabidopsis. Front. Plant Sci. 2017, 8, 1969. [Google Scholar] [CrossRef]
  43. Giunta, F.; De, P.; Mastrangelo, A.; Sanna, G.; Motzo, R. Environmental and Genetic Variation for Yield-Related Traits of Durum Wheat as Affected by Development. Front. Plant Sci. 2018, 18, 9. [Google Scholar] [CrossRef]
  44. Milner, S.; Maccaferri, M.; Huang, B.; Mantovani, P.; Massi, A.; Frascaroli, E.; Tuberosa, R.; Salvi, S. A multiparental cross population for mapping QTL for agronomic traits in durum wheat (Triticum turgidum ssp. durum). Plant Biotechnol. J. 2016, 14, 735–748. [Google Scholar] [CrossRef]
  45. Soriano, J.M.; Malosetti, M.; Roselló, M.; Sorrells, M.; Royo, C. Dissecting the old Mediterranean durum wheat genetic architecture for phenology, biomass and yield formation by association mapping and QTL meta-analysis. PLoS ONE 2017, 12, e0178290. [Google Scholar] [CrossRef]
  46. Mangini, G.; Gadaleta, A.; Colasuonno, P.; Marcotuli, I.; Signorile, A.; Simeone, R.; De, P.; Mastrangelo, A.; Laidò, G.; Pecchioni, N.; et al. Genetic dissection of the relationships between grain yield components by genome-wide association mapping in a collection of tetraploid wheats. PLoS ONE 2018, 13, e0190162. [Google Scholar] [CrossRef]
  47. Peleg, Z.; Fahima, T.; Krugman, T.; Abbo, S.; Saranga, Y. Genomic dissection of drought resistance in durum wheat x wild emmer wheat recombinant inbreed line population. Plant Cell Environ. 2009, 32, 758–779. [Google Scholar] [CrossRef] [PubMed]
  48. Peleg, Z.; Fahima, T.; Korol, A.B.; Abbo, S.; Saranga, Y. Genetic analysis of wheat domestication and evolution under domestication. J. Exp. Bot. 2011, 62, 5051–5061. [Google Scholar] [CrossRef]
  49. Zhao, Y.; Peng, T.; Sun, H.; Teotia, S.; Wen, H.; Du, Y.; Zhang, J.; Li, J.; Tang, G.; Xue, H.; et al. miR1432-OsACOT (Acyl-CoA thioesterase) module determines grain yield via enhancing grain filling rate in rice. Plant Biotechnol. J. 2019, 17, 712–723. [Google Scholar] [CrossRef]
  50. Dong, E.; Liu, C.; Bai, Y.; Mei, X.; Zhao, Z.; Zhu, S.; Zhang, J.; Cai, Y. A new network containing MYB109-ZmCesA5 is involved in kernel development. Biochem. Biophys. Res. Commun. 2022, 602, 15–20. [Google Scholar] [CrossRef]
Figure 1. Phenotypic characteristics of the parents “QH-1” and “DW”. (a) Plant visual phenotype. The white line represents the scale = 10 cm. (b) Peduncle length (PL) and neck length (NL). Scale bar = 10 cm. (c) Spike length (SL). Scale bar = 2 cm. (d) Kernel length (KL). The black line represents the scale = 1 cm. (e) Kernel width (KW). Scale bar = 1 cm.
Plants 13 01285 g001
Figure 2. Correlation analysis of different traits based on BLUE. * Significance at the 0.05 probability level; ** Significance at the 0.01 probability level; *** Significance at the 0.001 probability level; **** Significance at the 0.0001 probability level. The colored scale on the right represents the values of correlation coefficients.
Plants 13 01285 g002
Figure 3. Chromosome positions of the major or stable additive QTLs for the 11 traits described. The underlined QTLs indicate that they are the stable QTLs identified in this study. Different slash types on the QTLs represent QTL clusters at different locations. The colored marker names and bars to the right of each linkage group indicate the location of the stable QTLs or QTL clusters. Different colors are used to highlight and distinguish different traits on the same chromosome.
Plants 13 01285 g003aPlants 13 01285 g003b
Figure 4. Effects of different allele genotypes of stable QTLs on correlated traits. * Significance at the 0.05 probability level; ** Significance at the 0.01 probability level.
Plants 13 01285 g004
Figure 5. Physical maps of QSL.QD-1A.1 (a) and QNL.QD-4B.2 (b) on “CS” and Durum Wheat; dotted lines indicate homologous genes.
Plants 13 01285 g005
Table 1. Phenotypic variation and heritability of characters in different environments in parents and RILs.
TraitsYearParental LinesRIL Population
QH-1DWMinMaxMeanSDCV%SKKUH2
SL22LH11.176.256.0037.509.043.0333.498.1276.370.48
22YL12.729.667.3012.129.341.0611.310.24−0.08
23LH11.176.936.3311.808.501.0612.430.620.18
23YL10.777.504.5040.909.093.1434.528.8490.10
BLUE11.467.586.3319.759.011.5116.803.9824.76
NL21YL21.3316.174.5035.1717.025.8834.510.640.350.86
22LH17.3315.004.2528.5017.526.0734.65−0.25−0.86
22YL20.1819.143.5036.9422.007.1832.63−0.27−1.02
23LH24.3320.003.0035.0020.187.2435.900.00−0.87
23YL31.9716.809.0346.6724.8311.4646.143.3824.61
BLUE23.0317.428.5741.5420.316.0929.970.22−0.07
PL21YL46.0035.8316.0062.1738.288.1921.400.330.030.77
22LH39.3331.0018.2550.0036.397.9121.73−0.37−0.88
22YL24.3019.9814.4827.8020.713.0014.480.14−0.47
23LH45.6337.0021.0059.0038.739.1723.67−0.03−0.97
23YL55.0035.5024.7767.6745.3410.9024.04−0.13−1.17
BLUE42.1731.9822.7451.6236.016.7018.60−0.12−0.89
FD22YL5.44.254.245.904.410.398.872.414.360.19
23LH6.106.065.126.176.080.121.99−6.5347.19
23YL4.264.214.175.084.280.163.814.3518.22
BLUE5.545.134.835.855.210.163.161.934.01
HD21YL4.204.194.164.284.210.030.610.35−0.310.09
22YL4.304.204.185.604.280.245.604.3117.63
23YL4.194.154.124.234.180.020.530.020.14
BLUE4.244.194.174.704.240.082.004.0215.95
TKW21YL41.8261.0934.5063.8949.425.5311.18−0.380.660.73
22LH46.8050.0231.0771.0647.994.9010.211.045.36
22YL39.0656.2039.9261.6449.744.348.730.010.00
23LH48.7952.9538.9259.6748.474.118.480.060.12
23YL37.7049.4028.1255.4643.905.1311.68−0.260.58
BLUE42.8353.9339.2056.8847.903.276.830.220.34
KAR21YL24.5019.301.7517.128.252.4129.190.571.190.00
22LH6.0110.561.3118.8810.223.0329.600.290.29
22YL7.895.524.0215.128.402.7132.340.44−0.80
23LH12.6717.140.9421.5614.322.7819.44−0.854.49
23YL10.329.717.8121.3013.882.6018.700.27−0.06
BLUE12.0112.186.7213.4810.751.2111.28−0.240.16
KC21YL20.2021.1112.6121.5218.911.538.08−1.452.860.48
22LH17.8117.6916.6519.9818.110.703.870.24−0.41
22YL17.7319.7014.6921.3418.891.216.40−1.723.84
23LH19.6419.4217.3420.6118.700.673.580.450.40
23YL19.2518.8117.3220.7918.750.693.670.400.13
BLUE18.8919.3116.9520.5618.640.633.360.080.23
KL-WR21YL2.632.272.162.762.410.114.580.26−0.090.82
22LH2.472.282.072.672.310.114.900.400.28
22YL2.752.382.132.762.410.114.730.430.40
23LH2.502.332.042.682.300.125.320.210.11
23YL2.742.402.122.862.410.125.080.400.41
BLUE2.612.322.132.602.360.093.890.210.03
KL21YL7.948.075.148.417.450.587.72−1.302.570.63
22LH7.287.096.638.187.270.314.320.31−0.37
22YL7.477.976.038.797.710.516.57−1.362.81
23LH8.007.806.828.367.510.314.090.270.07
23YL7.977.676.948.607.600.303.960.350.39
BLUE7.727.716.858.417.500.283.680.240.28
KW21YL3.043.572.203.623.120.247.76−1.081.670.49
22LH2.983.132.883.543.170.134.000.040.56
22YL2.733.372.503.503.220.206.26−1.693.01
23LH3.223.382.923.623.280.133.91−0.04−0.04
23YL2.933.222.763.513.190.154.64−0.24−0.11
BLUE2.983.332.903.463.200.103.22−0.06−0.02
SD: standard deviation; CV: coefficient of variation; SK: skewness; KU: kurtosis; H2: broad-sense heritability; SL: spike length (cm); NL: neck length (cm); PL: peduncle length (cm); FD: flowering date; HD: heading date; TKW: thousand-kernel weight (g); KAR: kernel area ratio (mm2); KC: kernel circumference (mm); KL-WR: kernel length–width ratio; KL: kernel length (mm); KW: kernel width (mm); BLUE: best linear unbiased estimation.
Table 2. Stable QTLs for the quality-related trait under single-environment analysis.
TraitsQTLEnvInterval(cM)Left MarkerRight MarkerLODPVE(%)Add
SLQSL.QD-1A.12022YL20.71–22.71AX-109410802AX-1089551524.556713.53810.3519
2023LH20.71–22.71AX-109410802AX-1089551529.238720.20210.4992
NLQNL.QD-4B.22021YL78.59–79.09AX-110031800AX-10884812212.621434.70743.3629
2022LH78.59–79.09AX-110031800AX-1088481226.671318.19642.4966
2023LH78.59–79.09AX-110031800AX-10884812220.494444.20684.7673
2023YL78.59–79.09AX-110031800AX-10884812270.390627.268828.1164
PLQPL.QD-4B.12021YL78.59–79.09AX-110031800AX-10884812220.388952.48515.7827
2022LH78.59–79.09AX-110031800AX-1088481228.352231.3313.9071
2022YL78.59–79.09AX-110031800AX-10884812220.58343.31162.0306
2023LH78.59–79.09AX-110031800AX-10884812219.272744.27486.0188
FDQFD.QD-2B2022YL103.48–110.53AX-108817536AX-10992777115.256629.45350.275
2023YL103.48–110.53AX-108817536AX-1099277713.76893.83730.0701
HDQHD.QD-2B.12021YL25.99–26.47AX-89458348AX-1117179784.311812.679−0.0086
2023YL25.99–26.47AX-89458348AX-1117179784.220614.4486−0.0076
QHD.QD-4B2021YL79.09–89.74AX-108848122AX-1110680795.20716.2552−0.0099
2023YL79.09–89.74AX-108848122AX-1110680793.905913.967−0.0075
KCQKC.QD-4B.22022LH64.88–69.63AX-108801712AX-1099594237.878921.595−0.352
2022YL64.88–69.63AX-108801712AX-1099594234.06514.4427−0.4677
2023LH64.88–69.63AX-108801712AX-1099594237.175516.32−0.2934
2023YL64.88–69.63AX-108801712AX-1099594236.489416.8047−0.3074
KL-WRQKL-WR.QD-4B.62021YL72.85–74.24AX-86176450AX-1099252678.960816.7457−0.0499
2023YL72.85–74.24AX-86176450AX-1099252679.04976.2925−0.0545
KLQKL.QD-4B.22022LH64.88–69.63AX-108801712AX-10995942311.23427.3212−0.1853
2022YL64.88–69.63AX-108801712AX-1099594234.66227.6794−0.2111
2023YL64.88–69.63AX-108801712AX-1099594235.907216.453−0.1307
The underlined QTLs indicate that they are the stable QTLs and the bold font identifies that they are the major QTLs in this study. Env: Environments.
Disclaimer/Publisher’s Note: The statements, opinions and data contained in all publications are solely those of the individual author(s) and contributor(s) and not of MDPI and/or the editor(s). MDPI and/or the editor(s) disclaim responsibility for any injury to people or property resulting from any ideas, methods, instructions or products referred to in the content.

