
Effects of Organic Fertilizer on Photosynthesis, Yield, and Quality of Pakchoi under Different Irrigation Conditions

State Key Laboratory of Eco-Hydraulics in Northwest Arid Region, Xi’an University of Technology, Xi’an 710048, China
*
Author to whom correspondence should be addressed.
Plants 2024, 13(10), 1308; https://doi.org/10.3390/plants13101308
Submission received: 2 April 2024
/
Revised: 3 May 2024
/
Accepted: 8 May 2024
/
Published: 9 May 2024
(This article belongs to the Special Issue Management and Efficient Utilization of Water and Fertilizer in Field Crops II)
Abstract
:Water scarcity and the overuse of chemical fertilizers present significant challenges to modern agriculture, critically affecting crop photosynthesis, yield, quality, and productivity sustainability. This research assesses the impact of organic fertilizer on the photosynthetic attributes, yield, and quality of pakchoi under varying irrigation water conditions, including fresh water and brackish water. Findings reveal that the modified rectangular hyperbolic model most accurately captures the photosynthetic reaction to organic fertilization, outperforming other evaluated models. The maximum net photosynthesis rate (Pnmax), yield, soluble sugar (SS), and soluble protein content (SP) all exhibited a downward-opening quadratic parabolic trend with increasing amounts of organic fertilizer application. Specifically, under fresh-water irrigation, the optimal Pnmax, yield, SS, and SP were obtained at organic fertilizer rates of 65.77, 74.63, 45.33, and 40.79 kg/ha, respectively, achieving peak values of 20.71 µmol/(m2·s), 50,832 kg/ha, 35.63 g/kg, and 6.25 g/kg. This investigation provides a foundational basis for further research into the intricate relationship between water salinity stress and nutrient management, with the goal of crafting more sophisticated and sustainable farming methodologies. The insights gained could significantly influence organic fertilizer practices, promoting not only higher yields but also superior quality in agricultural outputs.
1. Introduction
In arid regions, where water resources are scarce, enhancing agricultural production efficiency is crucial for economic growth [1]. Concurrently, soil salinization poses a global challenge in dry and semi-arid zones, reducing plant diversity and inhibiting soil microbial activity, which can lead to land desertification and water pollution [2].
Arid areas commonly experience a dearth of fresh water, often exacerbated by its over-extraction for industrial and agricultural use. This is notably evident in the extensive Southern Xinjiang province of China, where fresh water is limited and evaporation rates are high [3,4]. Such water scarcity hampers crop growth and development, diminishing photosynthetic efficiency and thereby impacting yields and quality. Insufficient water availability curtails the crop root system water absorption, which is essential for photosynthesis, adversely affecting plant growth. Sensible use of brackish water serves as a viable solution to mitigate local water deficits, diversify agricultural water supplies, and counteract drought [5]. Nonetheless, the elevated mineral content in brackish water used for irrigation can escalate soil salinity, which hinders crop vitality and degrades soil quality [6,7]. Moreover, using brackish water for irrigation can precipitate physiological drought, necessitating adaptive physiological responses in crops and influencing the allocation of photosynthates [8].
Building upon traditional practices of water and nutrient management, the use of chemical fertilizers in agriculture can indeed initially elevate crop yields [9]; however, this short-term gain is overshadowed by long-term consequences, such as the degradation of soil structure, decline in fertility, and environmental pollution, which collectively compromise crop quality and the sustainable future of agriculture. Excessive application of elements like nitrogen, phosphorus, and potassium not only squanders resources but also contributes to the buildup of soil salinity, impairing both soil aeration and moisture retention [10,11,12]. Over time, these conditions can inflict significant damage on soil health and diminish its productivity. Conversely, organic fertilizers, which are abundant in organic materials, microbial life, and a mix of organic and inorganic nutrients, offer multifaceted benefits for improving the physical, chemical, and biological attributes of soil [7,13,14]. Research consistently shows that sensible utilization of organic fertilizers can substantially bolster crop photosynthesis, leading to increased yields across a diversity of crops [15,16,17]. Furthermore, organic fertilizers can improve crop quality by enhancing levels of soluble sugar, vitamin C, and organic matter while also refining the growth environment and the soil mineral profile [18,19]. Strategically combining organic with inorganic fertilizers in various proportions has also been shown to positively influence crop growth [20,21].
Pakchoi, as a member of the genus Brassica in the Cruciferae family, also referred to as oilseed rape or green vegetable, is favored for its crisp and tender edible stems and leaves [22]. Its widespread appeal is due to its richness in essential minerals and vitamins. The yield of pakchoi is predominantly influenced by water fertilizer management and photosynthesis [23]. The light response curve is an effective assessment tool for delineating the variability in the net photosynthesis rate under different intensities of photosynthetically active radiation [24]. Researchers utilize various light response models (including the rectangular hyperbolic, non-rectangular hyperbolic, exponential, and modified rectangular hyperbolic models) to extract key physiological parameters and, thus, to enhance the understanding of the photosynthetic mechanisms of the crop [25]. Currently, comprehensive insights into the light response curves of pakchoi are essential, as they are intrinsically linked to the plant biological traits and ecological adaptability, offering vital data for plant breeding and genetic advancements.
Scholars globally have extensively studied the light response mechanisms of staple crops such as wheat, corn, and rice [26,27,28]. Nonetheless, studies on the influence of organic fertilizer coupled with irrigation using fresh water and brackish water on the light response traits of pakchoi, as well as the suitability of various light response models, remain sparse. This study hypothesized that organic fertilizer may bolster soil structure and environment conditions, augmenting the plant capacity for water and nutrient uptake, consequently enhancing photosynthesis, yield, and quality. The study aims are (1) to clarify the effects of different organic fertilizer application rates on pakchoi light response; (2) to pinpoint the most fitting light response model and parameters for pakchoi; and (3) to establish the optimal rate of organic fertilizer for pakchoi. The overarching goal of this research is to lessen the dependence on synthetic fertilizers, encourage the employment of organic and biological fertilizers, and boost fertilizer use efficiency, thereby advancing crop photosynthesis, yield, and quality in pursuit of eco-friendly and sustainable agriculture.
2. Materials and Methods
2.1. Experimental Site and Description
The study was conducted at the Bazhou Irrigation Experiment Station in Korla City, Xinjiang, China. The station, located at coordinates 41°45′20.24″ N, 86°8′51.16″ E, is situated at an altitude of 901 m. This locale was emblematic of the warm temperate zone and is distinguished by its continental arid climate. The study was completed in 2022, meticulously considering the unique meteorological patterns of the region. The site boasts a frost-free duration, ranging from 175 to 200 days per annum, and substantial solar exposure, receiving between 1794 and 1847 h of sunlight annually. Table 1 documents the initial soil assessments conducted in preparation for the research, detailing the physical and chemical attributes of the soil. Meteorological data (Figure 1), including daily average temperature, maximum and minimum temperatures, and precipitation levels, were collected using an automated meteorological unit (Davis VantagePro-6152) on-site.
2.2. Experimental Design and Field Management
The non-heading variant of pakchoi, noted for its rapid vegetative growth, brief life cycle, and nutrient density across all seasons, was chosen as the subject of this investigation. The customary irrigation quota, established at approximately 450 m³/ha, was derived from the annual hydration demands for pakchoi cultivation specific to this region. The study employed a water-soluble bio-organic fertilizer (Shidiji biological organic fertilizer, Chengdu Huahong Biotechnology Co., Ltd., Chengdu, China) comprising a minimum of 40% organic matter, 5% N, P2O5, and K2O, 10% amino acids, and 5% fulvic acid. This fertilizer was administered through the irrigation water at eight distinct intervals during the plant growth period. The experimental design incorporated a flood irrigation methodology featuring five levels of bio-organic fertilizer amounts (0, 20, 40, 60, and 80 kg/ha) in conjunction with two water variants, which were fresh water (F) and brackish water (B). The treatments were labeled as follows: F0, F1, F2, F3, and F4 for the F treatments; and B0, B1, B2, B3, and B4 for the B treatments, corresponding to the respective fertilizer increments.
Sowing of the seeds occurred on the 7 May 2022, with the respective harvests taking place on the 30 June. To ensure experimental integrity, each plot was delineated with a high-density, impermeable membrane extending to a depth of 2 m. The fertilizer treatment plots were maintained consistently over a two-year period and were subjected to three replications within a randomized block design framework. Each plot was 3 m2 in area, with a seeding density of 2.5 × 10⁵ plants/ha. Cultivating crops, including removing weeds and implementing measures to control pests and diseases, adhered to the established agricultural protocols specific to the local area.
2.3. Measurements and Calculations
2.3.1. Measurements of Pakchoi Samples
The yield of pakchoi at maturity is quantified based on its fresh weight. Yield calculation, as per Equation (1), involves harvesting and weighing all pakchoi plants from each plot [29]. The soluble sugar (SS, g/kg) and soluble protein (SP, g/kg) content in pakchoi were measured using the anthrone and Coomassie Brilliant Blue UV spectrophotometry methods, respectively (Shimadzu, Kyoto, Japan, UV-1900i) [30,31].
where FWp is the average fresh weight of per plants (kg/plant), P represents the plant density of pakchoi (plants/ha).
To determine the light response parameters of pakchoi, this study selects the most vigorous growth period of pakchoi. Three pakchoi leaves exhibiting robust growth and full expansion at their upper sections are randomly selected between 09:00 and 11:00 on a sunny day. Using a Li-6400 portable photosynthesis system equipped with a red−blue light source, photosynthetically active radiation levels are set at the following 15 gradients: 2500, 2200, 2000, 1800, 1600, 1400, 1200, 1000, 800, 600, 400, 200, 100, 50, and 0 µmol/(m2·s). This setup enables the measurement of the net photosynthesis rate, Pn (µmol/(m2·s)), transpiration rate (Tr, mmol/(m2·s)), stomatal conductance (Gs, mol/(m2·s)), intercellular CO2 concentration (Ci, µmol/mol), and other vital parameters of pakchoi, from which a light response curve is subsequently plotted.
2.3.2. Light Response Curve Model
Net photosynthesis rate (Pn) serves as a crucial metric for assessing plant health and productivity, signifying the plant capacity to synthesize organic compounds from atmospheric CO2, which is essential for growth.
(1) Rectangular hyperbolic model [32]:
where Pn is the net photosynthesis rate, µmol/(m2·s); is the apparent quantum efficiency, also known as the initial quantum efficiency, which is the initial slope of the light response curve (I = 0) and can reflect the ability of crops to absorb, convert, and utilize light energy under low light; Pnmax is the maximum net photosynthesis rate, µmol/(m2·s), which can reflect the maximum photosynthetic capacity of leaves; Rd is the dark respiration rate, µmol/(m2·s), which can reflect the respiration rate of crop leaves under no light conditions; and I was photosynthetically active radiation, µmol/(m2·s).
The light compensation point (Ic, µmol/(m2·s)) is calculated by the following formula. The lower the Ic value, the stronger the ability of crops to utilize low light intensity. The calculation formula is as follows:
Equation (3) is a function without extreme value, which reflects that the right-angle hyperbola is an asymptotic trend line that cannot reach the pole; that is, the light saturation point (Isat, µmol/(m2·s)) cannot be directly calculated by Equation (2). The greater the light saturation point, Isat, the less likely it is to have photoinhibition under the stimulation of strong light in the process of crop growth and development.
The line intersects with the linear equation line under low light (I ≤ 200 µmol/(m2·s)), and the I value corresponding to the x-axis corresponding to the intersection point is the Isat.
(2) Non-rectangular hyperbolic model [32]:
where k is the angle of non-rectangular hyperbolic parameter, 0 < k ≤ 1. If the model fits well, the following formula can be used to calculate the Ic:
(3) Modified rectangular hyperbolic model [33]:
where is the photoinhibition coefficient, and is a coefficient independent of I. Pnmax, Ic and Isat are calculated from Equations (7)–(9).
(4) Exponential model [34]:
When estimating Isat, it is assumed that the light intensity corresponds to Pn of 0.99 × Pnmax and is saturated light intensity. Ic and Isat are calculated from Equations (11) and (12).
2.4. Statistical Analysis
Microsoft Office Excel (2016)(Microsoft Corporation, Redmond, WA, USA) and Origin 2021 (OriginLab, Northampton, MA, USA) were used for data processing and graphical representation, respectively. One-way analysis of variance (ANOVA) was performed using SPSS 25.0 (2017, IBM, Crop., Armonk, NY, USA) with a significance threshold set at p < 0.05 to determine statistically significant differences. The establishment and resolution of the model were accomplished through MATLAB (2014a)(MathWorks Inc., Natick, MA, USA) programming. Concurrently, the determination of correlations employed the coefficient of determination (R2), while the accuracy assessment was conducted using root mean square error (RMSE) and relative error (RE).
3. Results
3.1. Photosynthetic Physiological Characteristics
This study delineates the dynamics of Pn, Tr, Gs, and Ci, as they respond to I under irrigation with both fresh water and brackish water in pakchoi (Figure 2A–H). Notably, Pn exhibits a rapid increase with I values below 400 µmol/(m2·s). However, upon exceeding 1000 µmol/(m2·s), the increase in Pn decelerates, approaching a light saturation point indicative of the peak net photosynthesis rate. Observations within a stable light intensity range reveal a descending order of organic fertilizer application correlating with Pn as follows: 60 kg/ha, 80 kg/ha, 40 kg/ha, 20 kg/ha, and 0 kg/ha.
Figure 2 present the response of Tr and Gs to I under various treatments in pakchoi. Across all treatments, Tr and Gs exhibit a swift increase as I rise. Beyond a I of 400 µmol/(m2·s), the rates of increase for both Tr and Gs decelerate. Similarly, the behavior of Ci with respect to I shifts demonstrates a notable reduction in Ci at low light intensities (I < 400 µmol/(m2·s)). With escalating light intensity (400 µmol/(m2·s) < I < 2500 µmol/(m2·s)), Ci gradually declines across treatments until it reaches a steady state. This trend is likely due to the rapid surge in leaf Pn and subsequent elevated CO2 consumption under initially low light conditions, resulting in a significant drop in Ci. Once I surpass a specific limit, the acceleration of photosynthesis diminishes, leading to more gradual modifications in Ci.
Overall, the effects of fresh water and brackish water irrigation on photosynthetic parameters exhibit similar patterns, indicating that these two irrigation methods have consistent effects on plant photosynthetic characteristics and water use efficiency. However, photosynthetic parameters show a clear advantage under fresh-water irrigation, especially in Pn, Tr and Gs.
3.2. Applicability Evaluation of Light Response Model
This study applied four light response models to characterize the light response curves of pakchoi under both fresh water and brackish water irrigation; these models included the rectangular hyperbola, non-rectangular hyperbola, exponential, and modified rectangular hyperbola models (Figure 3A–H). The first three models failed to effectively capture the variations in Pn past the light saturation point due to their lack of extreme value asymptotes. In contrast, the modified rectangular hyperbola model precisely matched the light response curves, particularly those displaying photoinhibition. Nevertheless, the observed light intensity range in this study did not show a declining Pn trend for pakchoi under any treatment, indicating an absence of photoinhibition. Comparative analysis of the models, as depicted in Figure 3 and Table 2, revealed that the non-rectangular hyperbola model performed the least effectively. The rectangular hyperbola, modified rectangular hyperbola, and exponential models all adequately described the light response of pakchoi leaves. Among them, the modified rectangular hyperbola model demonstrated the closest alignment with the actual data trends, showcasing superior fitting accuracy (R2 ≥ 0.99 and the lowest RMSE and RE) compared to the other models. This finding positions the modified rectangular hyperbola model as the most accurate and optimal choice for depicting the light response curves of pakchoi leaves across different organic fertilizer treatments.
3.3. Change Characteristics of Light Response Model Parameters
To quantitatively assess the impact of various treatments on pakchoi light response, parameters from the modified rectangular hyperbola model, such as , Pnmax, Ic, Isat, and Rd were determined. Plants exhibiting a lower Ic and higher Isat demonstrate superior adaptability to light, efficiently utilizing low light and thriving in intense light conditions. In contrast, plants with a higher Ic and lower Isat show reduced adaptability to light variations. Therefore, the range of usable light intensity for pakchoi leaves is represented by Isat − Ic (∆I, µmol·m−2·s−1) (Table 3).
Distinct differences in , Pnmax, Ic, Isat, and Rd were noted across various organic fertilizer treatments. Specifically, treatments F4 and B4 showed a notably higher value and a lower Ic, indicating enhanced low light utilization and shade tolerance, facilitating normal growth under diminished light intensity. The Isat and ∆I value were considerably higher in treatments F1 and B2, indicating that pakchoi photosynthesis was less susceptible to inhibition by strong light, thus improving its resilience to high light levels and adaptability to light conditions. A higher Rd reflects increased leaf physiological activity and accelerated consumption of organic and nutritional substances within the plant. The lowest Rd observed in treatments F3 and B3 minimized respiratory consumption, allowing for organic accumulation and adaptation to environmental stress. Under fresh-water irrigation, the application of organic fertilizer more effectively improved the Pnmax of pakchoi. The use of organic fertilizer increased the range of light intensity usable by pakchoi under brackish water irrigation, but it also accelerated the consumption of organic matter and nutrients during the growth process of pakchoi. As fertilizer amounts increased, Pnmax initially rose and then fell, reaching its peak under treatments F3 and B3. Under fresh-water irrigation, when the organic fertilizer application rate is 65.77 kg/ha, the Pnmax reaches its peak at 20.71 µmol/(m2·s) (Figure 4A). Under brackish water irrigation, with an organic fertilizer application rate of 69.04 kg/ha, Pnmax attains its maximum value of 13.84 µmol/(m2·s) (Figure 4B).
This analysis suggests that organic fertilizer application can significantly enhance pakchoi photosynthesis, especially under brackish water irrigation. Applying 80 kg/ha of organic fertilizer improves low light utilization, whereas 20–40 kg/ha enhances strong light utilization, albeit with higher Rd values. When the application rate of organic fertilizer is 60 kg/ha, it not only enhances the efficiency of pakchoi in utilizing low light but also facilitates the accumulation of biomass.
3.4. Relationship between Photosynthetic Characteristics and Yield Quality
Figure 5 illustrates the correlations between pakchoi photosynthetic parameters and its yield, SS, and SP levels. There was a significant negative correlation between Pnmax and both the Ic (r = −0.705, p < 0.05) and Rd (r = −0.666, p < 0.05), while a significant positive correlation exists between Pnmax and yield (r = 0.863, p < 0.05). Although not statistically significant, Pnmax positively correlates with both SS and SP, underscoring the influence of photosynthesis on pakchoi quality in production. Importantly, an increase in Rd is negatively correlated with yield, SS, and SP, suggesting that higher Rd levels boost leaf physiological activity and expedite the consumption of organics, leading to a decrease in pakchoi yield and quality.
Figure 6 and Table 4 reveal that pakchoi yield (Figure 6A), SS (Figure 6B) and SP (Figure 6C) initially increase and then decrease as the application of organic fertilizer rises. Under fresh-water irrigation, optimal values for yield, SS, and SP were obtained at organic fertilizer application rates of 74.63, 45.33, and 40.79 kg/ha, reaching peaks of 50,832 kg/ha for yield, 35.63 g/kg for SS, and 6.25 g/kg for SP, respectively. Under brackish water irrigation, optimal values for yield, SS, and SP were obtained at organic fertilizer application rates of 76.18, 56.91, 40.79 kg/ha, reaching peaks of 47,127 kg/ha for yield, 32.97 g/kg for SS, and 4.46 g/kg for SP, respectively. This pattern indicates that achieving optimal yield and quality in brackish water conditions requires a higher application of organic fertilizer [29,31].
4. Discussion
4.1. Effects of Irrigation and Fertilization on Photosynthetic Characteristics and Yield of Pakchoi
This study examines the effects of organic fertilizer on the photosynthetic attributes and yield of pakchoi under the conditions of both fresh water and brackish water irrigation. The Pn serves as a crucial metric for assessing plant health and productivity, signifying the plant capacity to synthesize organic compounds from atmospheric CO2, which is essential for growth. With increasing I, there was an initial rapid increase in the Pn of pakchoi, which then plateaued, demonstrating a pronounced response at low light intensities and a saturation point at higher ones. The Tr similarly rose with increasing I, a trend possibly associated with the elevation in Gs, which facilitates both water transpiration and CO2 absorption [35,36]. Notably, Ci decreased with rising I, particularly at lower light levels, likely due to enhanced photosynthetic activity consuming more CO2 [37]. The enhanced photosynthetic parameters observed with fresh-water irrigation, such as increased Pn, Tr and Gs, may result from the lack of salt stress. Fresh water provides an optimal environment for both photosynthesis and transpiration, as salt stress can inhibit plant water uptake and cause ionic imbalances, thereby reducing photosynthetic characteristics. Although brackish water serves as a viable alternative where fresh water is limited, it is essential to manage its use carefully to prevent adverse salt effects on plant growth.
Differential responses in Pn, Tr, Gs, and Ci across treatments suggest that organic fertilizer influences pakchoi photosynthetic efficiency. Parameters in treatments lacking organic fertilizer were consistently lower compared to those with organic fertilizer, indicating that its application enhances pakchoi photosynthesis and water use efficiency. However, the variance observed amongst fertilization levels implies that an excess of organic fertilizer does not correlate with incremental benefits, as the yield gains from photosynthesis tend to level off beyond a certain fertilization threshold. For example, Pn peaked with moderate organic fertilizer applications and then declined. Specifically, the highest Pn was detected at 60 kg/ha of organic fertilizer, especially under slightly saline irrigation, hinting at an improvement in pakchoi physiological resilience to salinity, potentially due to the presence of nutrients or biostimulants in the organic fertilizer that alleviate the negative impacts of salinity on the photosynthetic mechanism [38]. Similar to the conclusion of the previous study, our study corroborates that organic fertilizers can substantially elevate photosynthesis rates and that the high organic matter content within can improve yield [39,40]. This finding is pivotal given the extensive criticism by researchers of unsustainable agricultural practices that rely heavily on chemical fertilizers for increased yield at the expense of environmental quality and long-term agricultural viability [41,42,43]. However, it is important to note that the promotional effects of organic fertilizer on photosynthesis and yield exhibit a threshold [17].
The study further reveals that pakchoi yield, SS, and SP content initially increase with the addition of organic fertilizer but begin to decrease when application rates exceed a certain limit (Figure 6). This trend is likely due to the amelioration of soil fertility and nutrient availability up to a point, beyond which excess fertilizer may result in nutrient oversupply, negatively impacting plant growth [44,45]. The relationship delineated by fitting curves under different irrigation conditions underscores the nuanced impact of organic fertilizer on crop photosynthesis and yield. For instance, under fresh-water irrigation, the optimum yield was achieved at a fertilizer rate of 74.63 kg/ha, while the best quality of pakchoi necessitated different rates, as depicted in our models. Furthermore, the content variation in SS, a crucial source for energy and carbon skeletons, reflects the efficacy of nutrient uptake and utilization by plants [46]. Notably, under brackish water irrigation conditions, the peak values for SS and SP were attenuated compared to those under fresh water, possibly due to the influence of salinity on photosynthetic, carbohydrate, and nitrogen metabolism [47].
4.2. Characteristics of Light Response Model
The light response curve is a pivotal tool for gauging a plant photosynthetic response to varied light intensities and is integral to assessing photosynthetic capacity [48]. The curve fit varies according to the distinct characteristics of each model [49]. Therefore, model selection for light response analysis should align with the specific environmental conditions in which the crop is cultivated [50,51]. This study employed the following four established models to approximate the light response curve of pakchoi: The rectangular hyperbolic, non-rectangular hyperbolic, exponential, and modified rectangular hyperbolic models. The non-rectangular hyperbolic model demonstrated the least congruence with the empirical data, while the modified rectangular hyperbolic model, providing the most accurate fit, was deemed optimal for representing the light response of organically fertilized pakchoi (Figure 3, Table 2). This result infers that photosynthetic performance may be considerably impacted by non-linear dynamics under specific lighting conditions.
Table 3 reveals the effects of varying organic fertilizer applications on pakchoi photosynthetic parameters as delineated by the modified rectangular hyperbolic model. As fertilizer application increased, both the Pnmax and the ∆I first increase and then decrease, with the optimum Pnmax observed in the F3 treatment and the maximum ∆I in the F1 and B2 treatments. The apexes for Pnmax manifesting at a precise fertilizer threshold (Figure 4), indicate that a judicious quantity of organic fertilizer can considerably enhance photosynthetic capacity. The inverse relationship between the a and Ic implies that organic fertilizer boosts photosynthetic efficiency, particularly under low light. Post-fertilization decreases in the Isat and increases in Ic suggest that excessive light might diminish photosynthetic potential, likely linked to the augmented soil fertility that organic fertilizer provides, which encourages growth in low light conditions [52]. The Rd indicates the utilization of photosynthetic products, with a lower rate signifying enhanced plant adaptability to stress [53,54]. The significant disparities in the Rd across treatments are noteworthy, with F4 and B4 exhibiting heightened Rd, indicative of more vigorous nocturnal respiration and energy usage. Conversely, the F3 treatment lowest Rd intimates a more effective use of organic matter to promote growth. The application of organic fertilizer under fresh-water irrigation substantially increased the Pnmax in pakchoi, indicating that organic fertilizers may supplement essential nutrients to enhance the plant photosynthesis. Conversely, although organic fertilizer expanded the range of light intensities utilizable by pakchoi in brackish water irrigation conditions, it may also have hastened the consumption of organic substances and nutrients. Hence, although organic fertilizer offers direct agronomic advantages, their use in brackish water irrigation could result in a more rapid consumption of vital nutrients, necessitating a balanced approach to maintain long-term crop growth and sustainable resource utilization.
5. Conclusions
This investigation assesses the influence of organic fertilizer on the photosynthetic traits, yield, and quality of pakchoi irrigated with both fresh water and brackish water. The results demonstrate that a judicious application of organic fertilizer can significantly improve the photosynthetic efficiency, yield, and quality of pakchoi. Among various models, the modified rectangular hyperbolic model emerged as the most fitting for characterizing the photosynthetic response of pakchoi to organic fertilization. Key parameters, such as Pnmax, ∆I, yield, SS, and SP, displayed a downward-opening quadratic parabolic trend with increasing levels of organic fertilizer. This study has pinpointed the optimal organic fertilizer rate to achieve the peak of Pnmax, yield, and quality in pakchoi. The interplay between irrigation water quality and fertilizer quantity significantly influences crop yield and quality and must be duly considered in agricultural practices. Future research should delve deeper into the dynamics between water salinity stress and nutrient management, unraveling the intricate relationships between rates of organic fertilizer application and the physiological growth of crops, with the aim of devising more empirically grounded and sustainable approaches to agricultural development.
Author Contributions
S.L.: Data curation, Formal analysis, Investigation, Resources, Writing—original draft; K.W.: Data curation, Formal analysis, Resources, Software; Q.W.: Methodology, Supervision, Visualization, Writing—review and editing; Y.S.: Formal analysis, Methodology, Resources; M.D.: Conceptualization, Methodology, Supervision; W.T.: Resources, Software. All authors have read and agreed to the published version of the manuscript.
Funding
This study was jointly supported by the National Natural Science Foundation of China (52339003, 52179042), the Doctoral Dissertation Innovation Fund of Xi’an University of Technology (252072307), and the Major Science and Technology Projects of the Autonomous Region (2023A02002–3).
Data Availability Statement
Data are contained within the article.
Conflicts of Interest
The authors declare no conflicts of interest.
References
- Leghari, S.J.; Hu, K.; Wei, Y.; Wang, T.; Bhutto, T.A.; Buriro, M. Modelling Water Consumption, N Fates and Maize Yield under Different Water-Saving Management Practices in China and Pakistan. Agric. Water Manag. 2021, 255, 107033. [Google Scholar] [CrossRef]
- Yang, Y.Q.; Guo, Y. Elucidating the Molecular Mechanisms Mediating Plant Salt-Stress Responses. New Phytol. 2018, 217, 523–539. [Google Scholar] [CrossRef] [PubMed]
- Qi, Z.S.; Cui, C.F.; Jiang, Y.T.; Chen, Y.; Ju, J.L.; Guo, N. Changes in the Spatial and Temporal Characteristics of China’s Arid Region in the Background of ENSO. Sci. Rep. 2022, 12, 17826. [Google Scholar] [CrossRef]
- Ren, B.Z.; Yu, W.Z.; Liu, P.; Zhao, B.; Zhang, J.W. Responses of Photosynthetic Characteristics and Leaf Senescence in Summer Maize to Simultaneous Stresses of Waterlogging and Shading. Crop J. 2023, 11, 269–277. [Google Scholar] [CrossRef]
- Du, J.R.; Zhang, X.; Feng, X.; Wu, Y.; Cheng, F.; Ali, M.E.A. Desalination of High Salinity Brackish Water by an NF-RO Hybrid System. Desalination 2020, 491, 114445. [Google Scholar] [CrossRef]
- Zhu, J.J.; Yang, M.; Sun, J.N.; Zhang, Z.H. Response of Water-Salt Migration to Brackish Water Irrigation with Different Irrigation Intervals and Sequences. Water 2019, 11, 2089. [Google Scholar] [CrossRef]
- Wang, Y.Y.; Xiao, Y.; Puig-Bargués, J.; Zhou, B.; Liu, Z.Y.; Muhammad, T.; Liang, H.B.; Maitusong, M.; Wang, Z.H.; Li, Y.K. Assessment of Water Quality Ions in Brackish Water on Drip Irrigation System Performance Applied in Saline Areas. Agric. Water Manag. 2023, 289, 108544. [Google Scholar] [CrossRef]
- Feng, X.L.; Liu, R.; Li, C.J.; Zhang, H.; Slot, M. Contrasting Responses of Two C4 Desert Shrubs to Drought but Consistent Decoupling of Photosynthesis and Stomatal Conductance at High Temperature. Environ. Exp. Bot. 2023, 209, 105295. [Google Scholar] [CrossRef]
- Liu, S.Y.; Zhang, P.Z.; Wang, X.C.; Hakeem, A.; Niu, M.X.; Song, S.Y.; Fang, J.G.; Shangguan, L.F. Comparative Analysis of Different Bio-Organic Fertilizers on Growth and Rhizosphere Environment of Grapevine Seedlings. Sci. Hortic. 2024, 324, 112587. [Google Scholar] [CrossRef]
- Savci, S. An Agricultural Pollutant: Chemical Fertilizer. Int. J. Environ. Sci. Dev. 2012, 3, 73. [Google Scholar] [CrossRef]
- Reardon, C.L.; Klein, A.M.; Melle, C.J.; Hagerty, C.H.; Klarer, E.R.; Machado, S.; Paulitz, T.; Pritchett, L.; Schlatter, D.; Smith, S.F.; et al. Enzyme Activities Distinguish Long-Term Fertilizer Effects under Different Soil Storage Methods. Appl. Soil Ecol. 2022, 177, 104518. [Google Scholar] [CrossRef]
- García-Orenes, F.; Roldán, A.; Mataix-Solera, J.; Cerdà, A.; Campoy, M.; Arcenegui, V.; Caravaca, F. Soil Structural Stability and Erosion Rates Influenced by Agricultural Management Practices in a Semi-Arid Mediterranean Agro-Ecosystem. Soil Use Manag. 2012, 28, 571–579. [Google Scholar] [CrossRef]
- Wang, Y.; Zhu, Y.C.; Zhang, S.X.; Wang, Y.Q. What Could Promote Farmers to Replace Chemical Fertilizers with Organic Fertilizers? J. Clean. Prod. 2018, 199, 882–890. [Google Scholar] [CrossRef]
- Chen, X.J.; Zeng, D.; Xu, Y.; Fan, X.J. Perceptions, Risk Attitude and Organic Fertilizer Investment: Evidence from Rice and Banana Farmers in Guangxi, China. Sustainability 2018, 10, 3715. [Google Scholar] [CrossRef]
- Adekiya, A.O.; Ejue, W.S.; Olayanju, A.; Dunsin, O.; Aboyeji, C.M.; Aremu, C.; Adegbite, K.; Akinpelu, O. Different Organic Manure Sources and NPK Fertilizer on Soil Chemical Properties, Growth, Yield and Quality of Okra. Sci. Rep. 2020, 10, 16083. [Google Scholar] [CrossRef] [PubMed]
- Xu, F.; Sun, G.F.; Du, W.C.; Ai, F.X.; Yin, Y.; Guo, H.Y. Impacts of Chemical and Organic Fertilizers on the Bacterial Communities, Sulfonamides and Sulfonamide Resistance Genes in Paddy Soil Under Rice-Wheat Rotation. Bull. Environ. Contam. Toxicol. 2023, 110, 20. [Google Scholar] [CrossRef]
- Liu, W.B.; Cui, S.Y.; Wu, L.T.; Qi, W.L.; Chen, J.H.; Ye, Z.Q.; Ma, J.W.; Liu, D. Effects of Bio-organic Fertilizer on Soil Fertility, Yield, and Quality of Tea. J. Soil Sci. Plant Nutr. 2023, 23, 5109–5121. [Google Scholar] [CrossRef]
- Gao, F.C.; Li, H.J.; Mu, X.G.; Gao, H.; Zhang, Y.; Li, R.M.; Cao, K.; Ye, L. Effects of Organic Fertilizer Application on Tomato Yield and Quality: A Meta-Analysis. Appl. Sci. 2023, 13, 2184. [Google Scholar] [CrossRef]
- Frąc, M.; Sas-Paszt, L.; Sitarek, M. Changes in the Mineral Content of Soil following the Application of Different Organic Matter Sources. Agriculture 2023, 13, 1120. [Google Scholar] [CrossRef]
- Tomazello, D.A.; Da Fonseca Melo, E.M.; Santos, A.J.M.; Backes, C.; Teodoro, A.G.; Bezerra Fernandes, P.; Rodrigues, L.M.; Da Silva Belizário, D.; Ribon, A.A. Agronomic Performance and Soil Chemical Composition When Using Poultry Litter as Organic Fertilizer in Mombasa Guinea Grass Production. N. Z. J. Agric. Res. 2023. [Google Scholar] [CrossRef]
- Tröster, M.F. Assessing the Value of Organic Fertilizers from the Perspective of EU Farmers. Agriculture 2023, 13, 1057. [Google Scholar] [CrossRef]
- Turner, E.R.; Luo, Y.G.; Buchanan, R.L. Microgreen Nutrition, Food Safety, and Shelf Life: A review. J. Food Sci. 2020, 85, 870–882. [Google Scholar] [CrossRef] [PubMed]
- Sun, Q.H.; Zhang, Y.X.; Ming, C.D.; Wang, J.M.; Zhang, Y. Amended Compost Alleviated the Stress of Heavy Metals to Pakchoi Plants and Affected the Distribution of Heavy Metals in Soil-Plant System. J. Environ. Manag. 2023, 336, 117674. [Google Scholar] [CrossRef] [PubMed]
- Akhkha, A. Modelling Photosynthetic Light-Response Curve in Calotropis Procera Under Salinity or Water Deficit Stress Using Non-Linear Models. J. Taibah Univ. Sci. 2010, 3, 49–57. [Google Scholar] [CrossRef]
- Yao, H.S.; Zhang, Y.L.; Yi, X.P.; Zuo, W.Q.; Lei, Z.Y.; Sui, L.L.; Zhang, W.F. Characters in Light-Response Curves of Canopy Photosynthetic Use Efficiency of Light and N in Responses to Plant Density in Field-Grown Cotton. Field Crop. Res. 2017, 203, 192–200. [Google Scholar] [CrossRef]
- Li, Y.T.; Yang, C.; Zhang, Z.S.; Zhao, S.J.; Gao, H.Y. Photosynthetic Acclimation Strategies in Response to Intermittent Exposure to High Light Intensity in Wheat (Triticum aestivum L.). Environ. Exp. Bot. 2021, 181, 104275. [Google Scholar] [CrossRef]
- Li, Y.; Feng, H.Y.; Xian, S.T.; Wang, J.W.; Zheng, X.B.; Song, X.L. Phytotoxic Effects of Polyethylene Microplastics Combined with Cadmium on the Photosynthetic Performance of Maize (Zea mays L.). Plant Physiol. Biochem. 2023, 203, 108065. [Google Scholar] [CrossRef]
- Zhu, R.; Hu, T.S.; Wu, F.Y.; Liu, Y.; Zhou, S.; Wang, Y.X. Photosynthetic and Hydraulic Changes Caused by Water Deficit and Flooding Stress Increase Rice’s Intrinsic Water-Use Efficiency. Agric. Water Manag. 2023, 289, 108527. [Google Scholar] [CrossRef]
- Lin, S.D.; Wang, C.H.; Lei, Q.Y.; Wei, K.; Wang, Q.J.; Deng, M.J.; Su, L.J.; Liu, S.Y.; Duan, X.X. Effects of Combined Application of Organic Fertilizer on the Growth and Yield of Pakchoi under Different Irrigation Water Types. Agronomy 2023, 13, 2468. [Google Scholar] [CrossRef]
- Wang, X.K. Experimental Principle and Technique for Plant Physiology and Biochemistry; Higher Education Press: Beijing, China, 2006. [Google Scholar]
- Lin, S.D.; Wang, Q.J.; Wei, K.; Sun, Y.; Shao, F.F.; Lei, Q.Y.; Deng, M.J. Enhancing pakchoi (Brassica chinensis L.) agriculture with magnetized-ionized brackish water and organic fertilizers: A sustainable approach to soil quality and crop yield optimization. J. Clean. Prod. 2024, 450, 141935. [Google Scholar] [CrossRef]
- Thornley, J.H.M. Mathematical Models in Plant Physiology; Academic Press: Pittsburgh, PA, USA, 1976. [Google Scholar]
- Ye, Z.P. A New Model for Relationship Between Irradiance and the Rate of Photosynthesis in Oryza Sativa. Photosynthetica 2007, 45, 637–640. [Google Scholar] [CrossRef]
- Prado, C.H.B.A.; De Moraes, J.A.P.V. Photosynthetic Capacity and Specific Leaf Mass in Twenty Woody Species of Cerrado Vegetation under Field Conditions. Photosynthetica 1997, 33, 103–112. [Google Scholar] [CrossRef]
- Cui, B.J.; Liu, J.; Zhang, M.Y.; Wan, H.; Wei, G.Y.; Wei, Z.H.; Liu, F.L. CO2 Elevation Modulates the Growth and Physiological Responses of Soybean (Glycine max L. Merr.) to Progressive Soil Drying. Plant Growth Regul. 2023, 103, 139–150. [Google Scholar] [CrossRef]
- Xu, Z.Z.; Jiang, Y.L.; Jia, B.R.; Zhou, G.S. Elevated-CO2 Response of Stomata and Its Dependence on Environmental Factors. Front. Plant Sci. 2016, 7, 657. [Google Scholar] [CrossRef]
- Tomimatsu, H.; Sakata, T.; Fukayama, H.; Tang, Y.H. Short-term Effects of High CO2 Accelerate Photosynthetic Induction in Populus Koreana x Trichocarpa with Always-open Stomata Regardless of Phenotypic Changes in High CO2 Growth Conditions. Tree Physiol. 2019, 39, 474–483. [Google Scholar] [CrossRef] [PubMed]
- Thompson, M.; Gamage, D.; Hirotsu, N.; Martin, A.; Seneweera, S. Effects of Elevated Carbon Dioxide on Photosynthesis and Carbon Partitioning: A Perspective on Root Sugar Sensing and Hormonal Crosstalk. Front. Physiol. 2017, 8, 578. [Google Scholar] [CrossRef] [PubMed]
- Zhang, M.H.; Sun, D.Y.; Niu, Z.R.; Yan, J.X.; Zhou, X.L.; Kang, X. Effects of Combined Organic/Inorganic Fertilizer Application on Growth, Photosynthetic Characteristics, Yield and Fruit Quality of Actinidia Chinesis cv ‘Hongyang’. Glob. Ecol. Conserv. 2020, 22, e00997. [Google Scholar] [CrossRef]
- Hao, J.H.; Tan, J.Y.; Zhang, Y.; Wang, S.; Zhang, X.K.; Wang, Z.Y.; Li, J. Metabolomics Reveals the Molecular Mechanism of Sewage Sludge-Derived Nutrients and Biostimulants Stimulating Resistance Enhancement and the Redistribution of Carbon and Nitrogen Metabolism in Pakchoi Cabbage. Sci. Total Environ. 2023, 891, 164330. [Google Scholar] [CrossRef] [PubMed]
- Aslam, Z.; Ahmad, A.; Abbas, R.N.; Sarwar, M.; Bashir, S. Morpho-physiological, Biochemical and Yield Responses of Wheat (Triticum aestivum L.) to Vermicompost, Simple Compost and NP Fertilizer Applications. Pak. J. Bot. 2023, 55, 2143–2154. [Google Scholar] [CrossRef]
- Chen, W.; Zhang, J.J.; Deng, X.P. The Spike Weight Contribution of the Photosynthetic Area Above the Upper Internode in A Winter Wheat under Different Nitrogen and Mulching Regimes. Crop J. 2019, 7, 89–100. [Google Scholar] [CrossRef]
- Wang, X.W.; Tan, X.; Dang, C.C.; Lu, Y.; Xie, G.J.; Liu, B.F. Thermophilic Microorganisms Involved in the Nitrogen Cycle in Thermal Environments: Advances and Prospects. Sci. Total Environ. 2023, 896, 165259. [Google Scholar] [CrossRef]
- Lin, S.D.; Wang, Q.J.; Deng, M.J.; Su, L.J.; Wei, K.; Guo, Y.; Zhang, J.H. Assessing the Influence of Water Fertilizer, and Climate Factors on Seed Cotton Yield under Mulched Drip Irrigation in Xinjiang Agricultural Regions. Eur. J. Agron. 2024, 152, 127034. [Google Scholar] [CrossRef]
- Wang, Z.H.; Zhu, Y.K.; Zhang, J.Z.; Li, W.H.; Bian, Q.Y. Effects of Water and Nitrogen Fertilization on Physiological Characteristics and Yield of Cotton under Drip Irrigation in Mildly Salinized Soil. Trans. Chin. Soc. Agric. Mach. 2018, 49, 296–308. [Google Scholar]
- Ding, S.S.; Li, Y.T.; Yuan, L.; Zhao, B.Q.; Lin, Z.A.; Yang, X.D.; Li, J.; Zhang, J.J. Effects of Sugar Alcohols and Amino Acids on Growth, Quality and Calcium Nutrition of Chinese Cabbage. J. Plant Nutr. Fertil. 2016, 22, 744–751. [Google Scholar]
- Pouris, J.; Tampiziva, E.; Rhizopoulou, S. Unraveling Seasonal Allocation of Soluble Sugars, Starch and Proline in Sternbergia lutea. Plants 2023, 12, 3043. [Google Scholar] [CrossRef]
- Li, Y.L.; Liu, X.G.; Hao, K.; Yang, Q.L.; Yang, X.Q.; Zhang, W.H.; Cong, Y. Light-response Curve of Photosynthesis and Model Fitting in Leavesof Mangifera Indica under Different Soil Water Conditions. Photosynthetica 2019, 57, 796–803. [Google Scholar] [CrossRef]
- Guo, Y.; Wang, Q.J.; Wang, K.; Zhang, J.H.; Wei, K.; Liu, Y. Spring Irrigation with Magnetized Water Affects Soil Water-Salt Distribution, Emergence, Growth, and Photosynthetic Characteristics of Cotton Seedlings in Southern Xinjiang, China. BMC Plant Biol. 2023, 23, 174. [Google Scholar]
- Shi, Y.Y.; Guo, E.J.; Cheng, X.; Wang, L.Z.; Jiang, S.K.; Yang, X.L.; Ma, H.Y.; Zhang, T.Y.; Li, T.; Yang, X.G. Effects of Chilling at Different Growth Stages on Rice Photosynthesis, Plant Growth, and Yield. Environ. Exp. Bot. 2022, 203, 105045. [Google Scholar] [CrossRef]
- Borlongan, I.A.; Arita, R.; Nishihara, G.N.; Terada, R. The Effects of Temperature and Irradiance on the Photosynthesis of Two Heteromorphic Life History Stages of Saccharina japonica (Laminariales) from Japan. J. Appl. Phycol. 2020, 32, 4175–4187. [Google Scholar] [CrossRef]
- Manzoor; Ma, L.F.; Ni, K.; Ruan, J.Y. Influence of Organic and Inorganic Fertilizers on Tea Growth and Quality and Soil Properties of Tea Orchards’ Top Rhizosphere Soil. Plants 2024, 13, 207. [Google Scholar] [CrossRef]
- Xu, J.Z.; Lv, Y.P.; Liu, X.Y.; Wei, Q.; Qi, Z.M.; Yang, S.B.; Liao, L.X. A General Non-Rectangular Hyperbola Equation for Photosynthetic Light Response Curve of Rice at Various Leaf Ages. Sci. Rep. 2019, 9, 9909. [Google Scholar] [CrossRef] [PubMed]
- Huang, S.; Zheng, X.; Yao, L.R.; Luo, L.X.; Zuo, T.; Hou, Q.; Ni, W.Z. Glycinebetaine Facilitates the Photosynthesis of Albino Tea under Low Temperature by Regulating Related Gene Methylation. Sci. Hortic. 2022, 303, 111235. [Google Scholar] [CrossRef]
Figure 1.
Temperature and precipitation during the whole growth period of pakchoi.

Figure 2.
Net photosynthesis rate (A,B), transpiration rate (C,D), stomatal conductance (E,F), and intercellular CO2 concentration (G,H) characteristics of pakchoi under fresh water and brackish water irrigation. F0, F1, F2, F3, and F4 denote the application rates of organic fertilizer at 0, 20, 40, 60, and 80 kg/ha, respectively, under fresh-water irrigation. B0, B1, B2, B3, and B4 denote the application rates of organic fertilizer at 0, 20, 40, 60, and 80 kg/ha, respectively, under brackish water irrigation.

Figure 3.
The fitting effect of four models on the light response curve under fresh water and brackish water irrigation. Rectangular hyperbolic model (A,B), Non-rectangular hyperbolic model (C,D), Modified rectangular hyperbolic model (E,F), Exponential model (G,H). F0, F1, F2, F3, and F4 denote the application rates of organic fertilizer at 0, 20, 40, 60, and 80 kg/ha, respectively, under fresh-water irrigation. B0, B1, B2, B3, and B4 denote the application rates of organic fertilizer at 0, 20, 40, 60, and 80 kg/ha, respectively, under brackish water irrigation. Solid points represent measured values and solid lines represent fitted values.

Figure 4.
Relationship between maximum net photosynthesis rate and organic fertilizer under fresh water (A) and brackish water (B) irrigation. Pnmax, maximum net photosynthesis rate.
Figure 4.
Relationship between maximum net photosynthesis rate and organic fertilizer under fresh water (A) and brackish water (B) irrigation. Pnmax, maximum net photosynthesis rate.
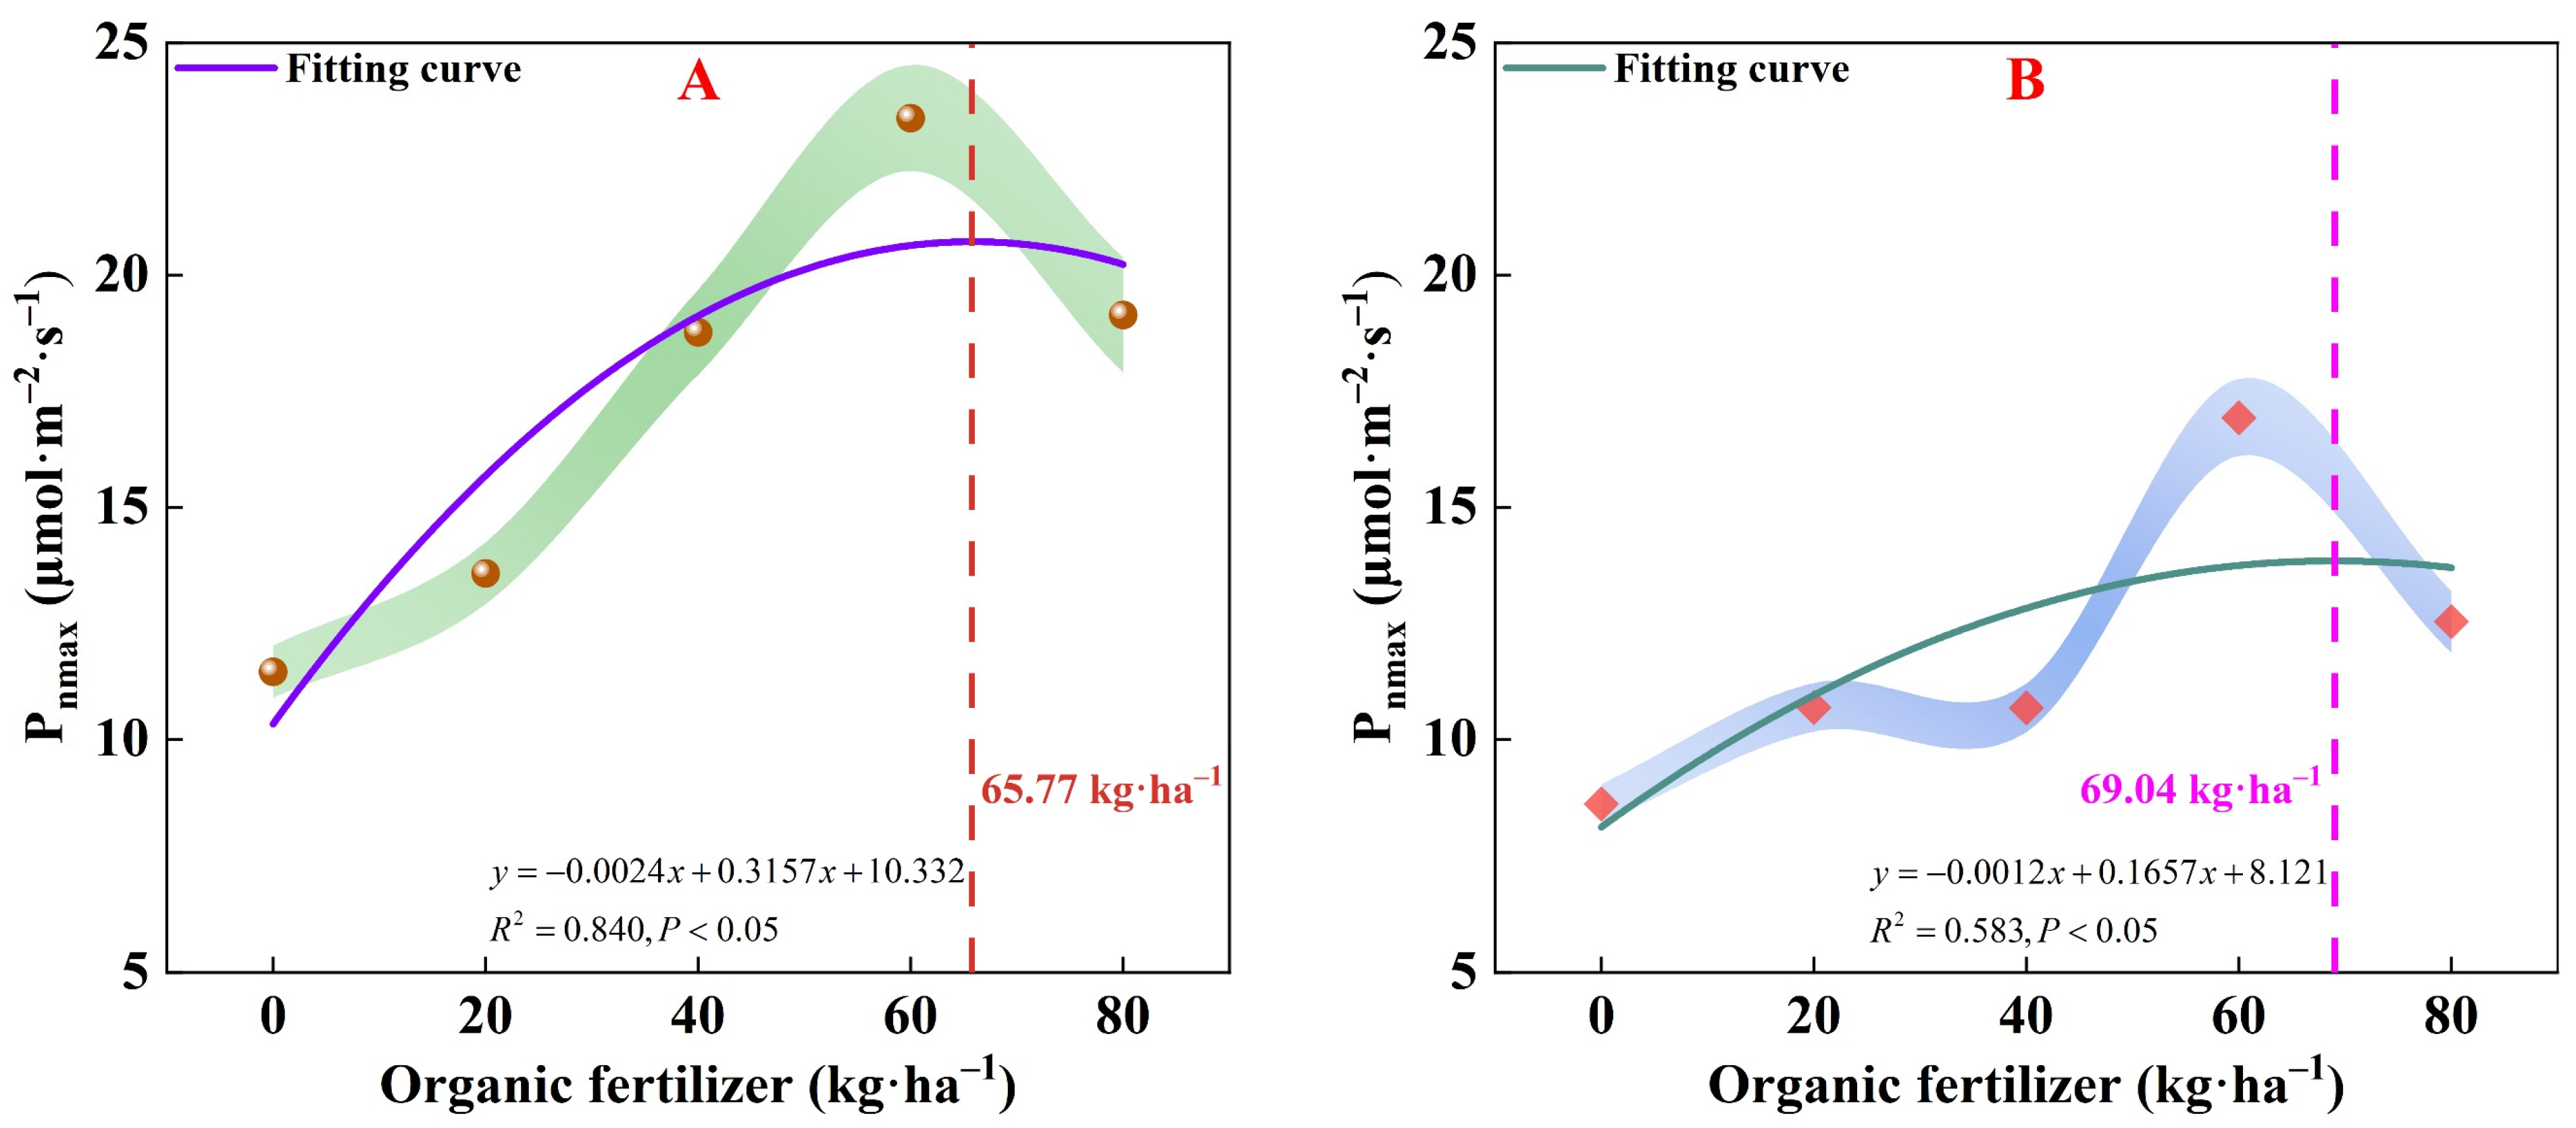
Figure 5.
Correlation between photosynthetic characteristics parameters and yield and quality of pakchoi. * indicates a significant correlation at p < 0.05. Pnmax, maximum net photosynthesis rate; , apparent quantum efficiency; Ic, light compensation point; Isat, light saturation point; Rd, dark respiration rate; SS, soluble sugar; SP, soluble protein.
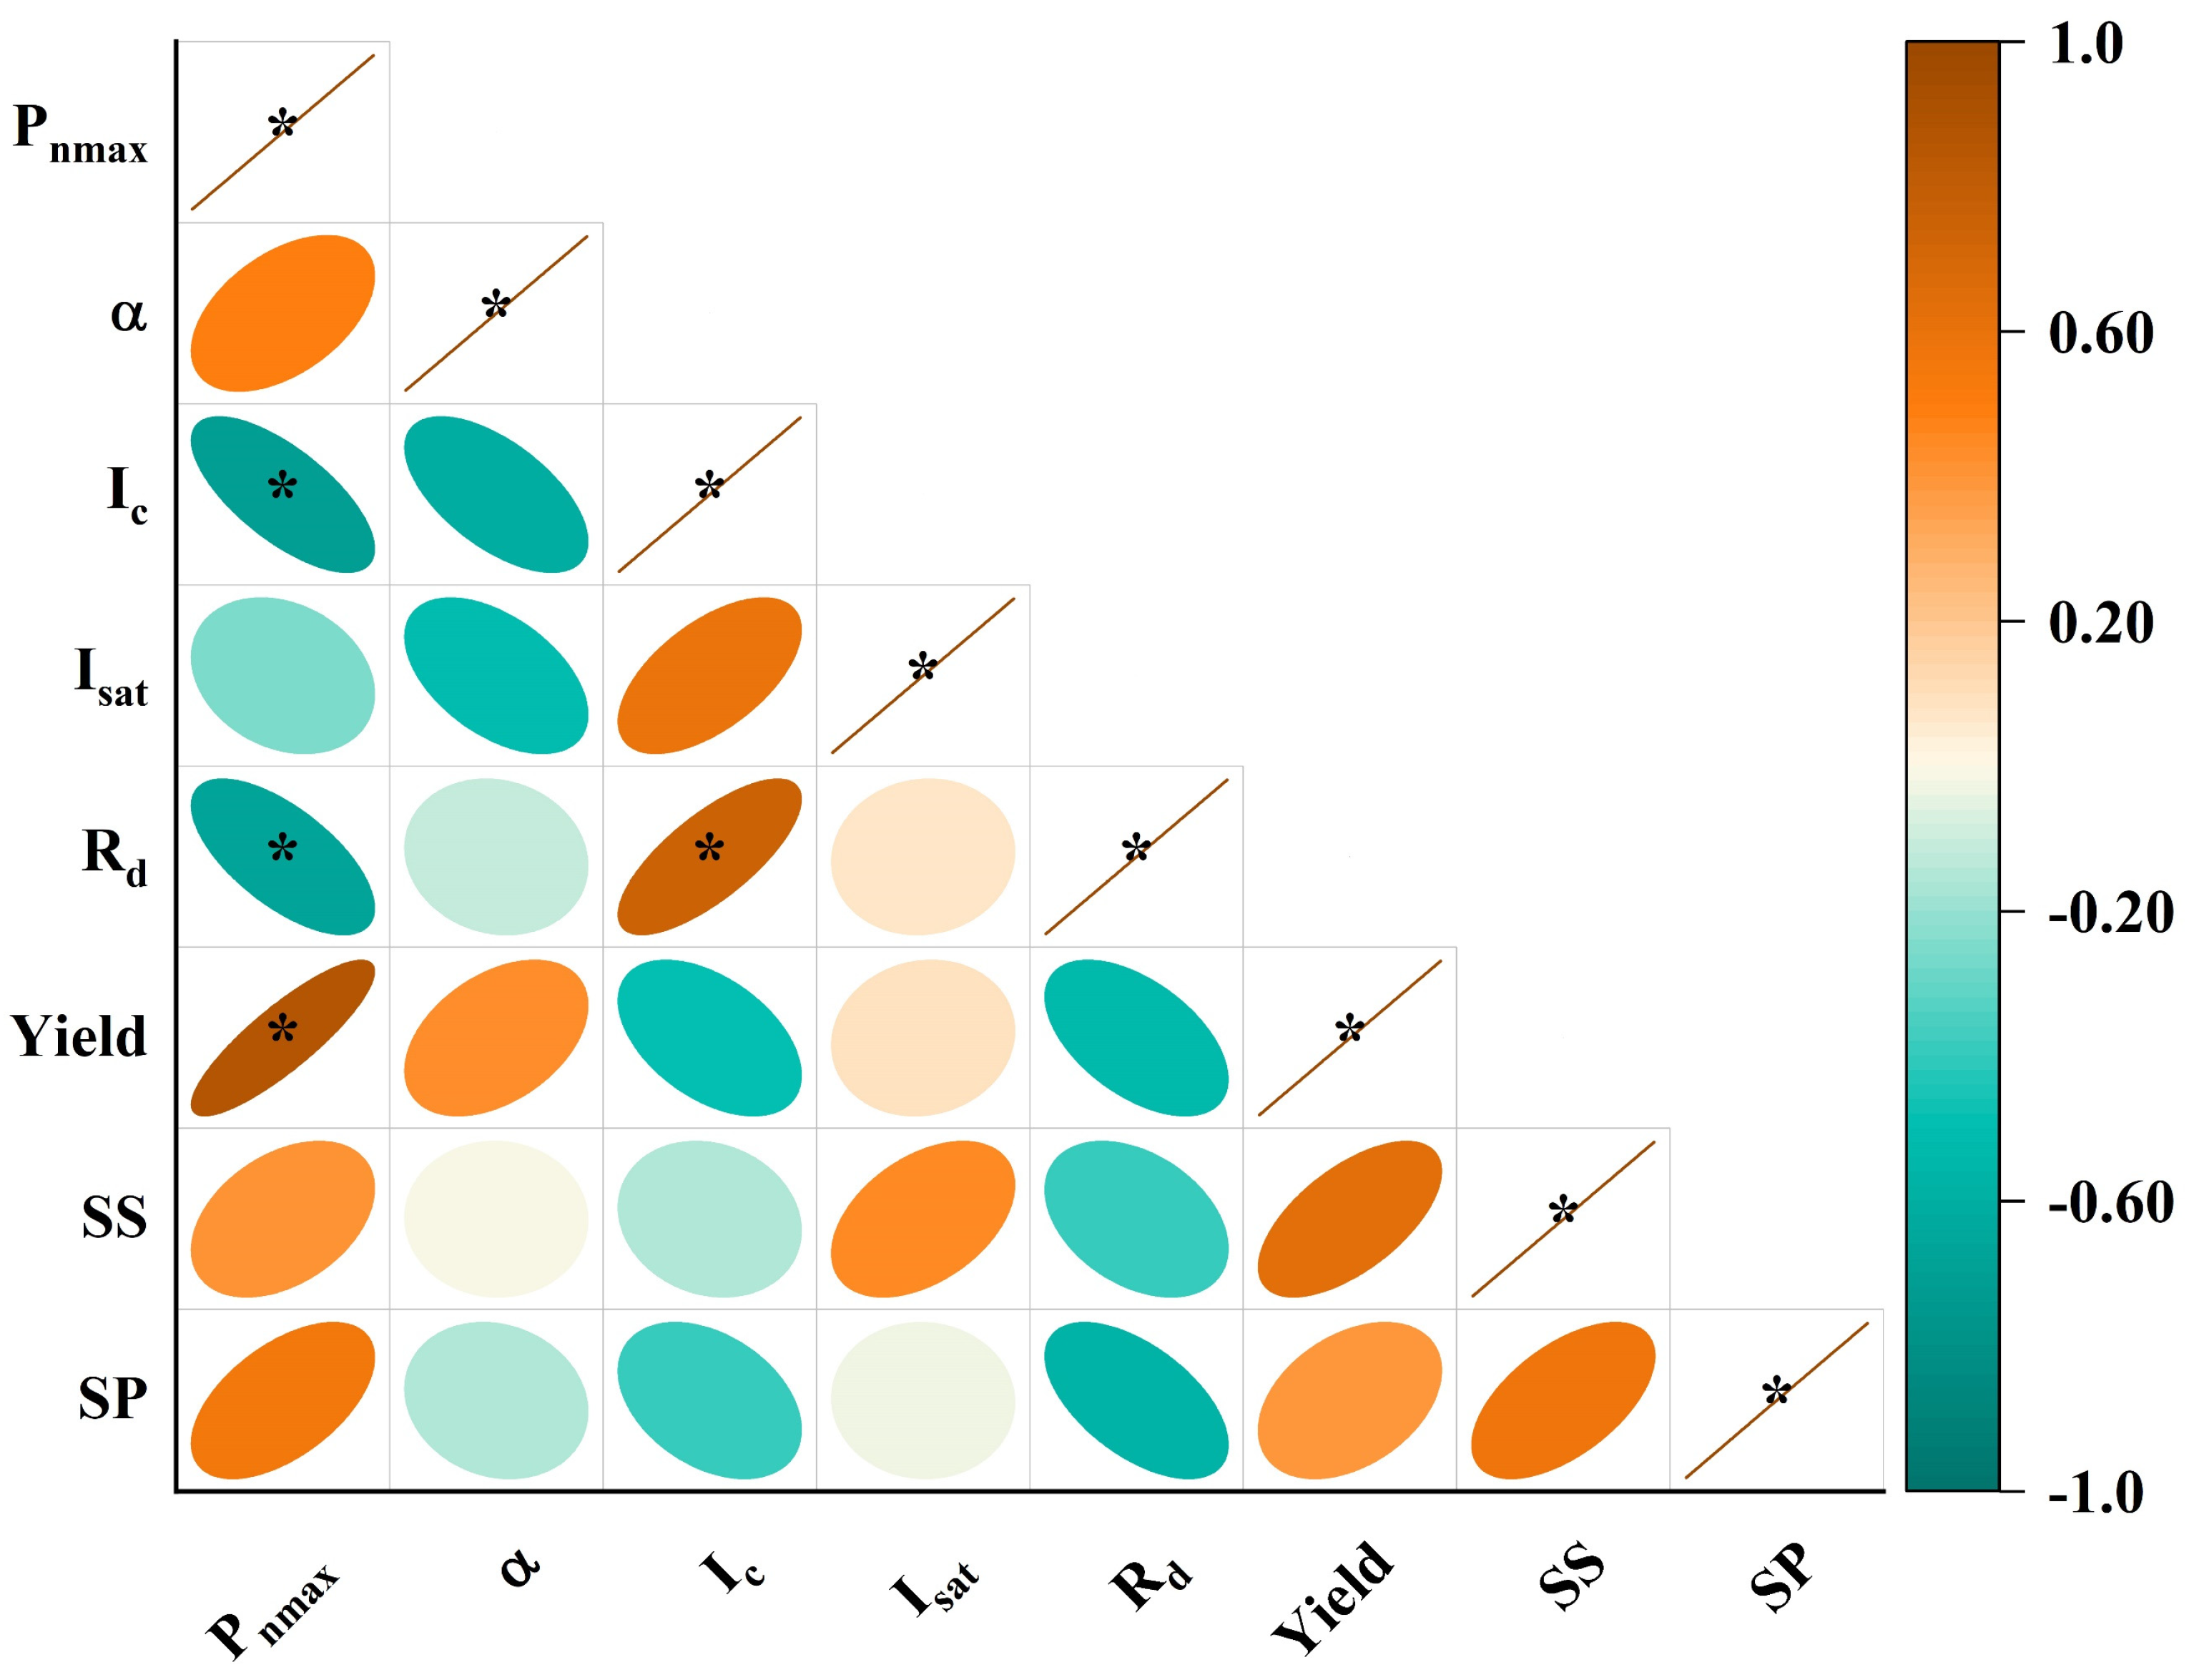
Figure 6.
Relationship between yield (A), soluble sugar (B), soluble protein (C) and organic fertilizer under fresh water and brackish water irrigation.
Figure 6.
Relationship between yield (A), soluble sugar (B), soluble protein (C) and organic fertilizer under fresh water and brackish water irrigation.


Table 1.
Initial physical and chemical properties of soil.
| Depth (cm) | Bulk Density (g·cm−3) | Mechanical Composition (%) | Alkali-Hydrolyzed Nitrogen (mg·kg−1) | Available Phosphorus (mg·kg−1) | Available Potassium (mg·kg−1) | Organic Matter (g·kg−1) | ||
|---|---|---|---|---|---|---|---|---|
| Clay | Silt | Sand | ||||||
| 0–20 | 1.45 | 5.3 | 52.5 | 42.2 | 24.34 | 41.37 | 240 | 8.10 |
| 20–40 | 1.37 | 3.3 | 32.9 | 63.8 | 13.83 | 8.79 | 144 | 5.10 |
Table 2.
Comparison and analysis of the simulation accuracy of the light response curve by four models under different treatments.
Table 2.
Comparison and analysis of the simulation accuracy of the light response curve by four models under different treatments.
| Treatments | Rectangular Hyperbolic Model | Non-Rectangular Hyperbolic Model | Modified Rectangular Hyperbolic Model | Exponential Model | ||||||||
|---|---|---|---|---|---|---|---|---|---|---|---|---|
| R2 | RMSE | RE | R2 | RMSE | RE | R2 | RMSE | RE | R2 | RMSE | RE | |
| F0 | 0.983 | 0.6282 | 0.0044 | 0.999 | 2.4456 | 0.0664 | 0.990 | 0.4770 | 0.0025 | 0.996 | 0.2861 | 0.0009 |
| F1 | 0.987 | 0.5779 | 0.0028 | 0.999 | 2.6259 | 0.0577 | 0.994 | 0.4048 | 0.0014 | 0.997 | 0.2918 | 0.0007 |
| F2 | 0.986 | 0.7995 | 0.0027 | 0.996 | 5.8056 | 0.1417 | 0.994 | 0.5344 | 0.0012 | 0.996 | 0.4148 | 0.0007 |
| F3 | 0.979 | 1.1974 | 0.0039 | 0.999 | 2.4317 | 0.0159 | 0.993 | 0.7774 | 0.0016 | 0.996 | 0.4813 | 0.0006 |
| F4 | 0.992 | 0.6182 | 0.0010 | 0.998 | 9.3961 | 0.2388 | 0.995 | 0.4745 | 0.0006 | 0.995 | 1.8696 | 0.0095 |
| B0 | 0.987 | 0.3915 | 0.0031 | 0.999 | 2.3158 | 0.1073 | 0.994 | 0.2555 | 0.0013 | 0.998 | 0.1385 | 0.0004 |
| B1 | 0.984 | 0.6101 | 0.0049 | 0.999 | 2.3278 | 0.0715 | 0.992 | 0.4467 | 0.0026 | 0.997 | 0.2844 | 0.0011 |
| B2 | 0.993 | 0.4001 | 0.0023 | 0.998 | 5.3386 | 0.4135 | 0.996 | 0.2968 | 0.0013 | 0.997 | 0.2724 | 0.0011 |
| B3 | 0.987 | 0.7684 | 0.0037 | 0.998 | 2.1734 | 0.0292 | 0.994 | 0.5161 | 0.0016 | 0.995 | 0.4974 | 0.0015 |
| B4 | 0.990 | 0.5241 | 0.0022 | 0.995 | 7.3740 | 0.4320 | 0.995 | 0.3769 | 0.0011 | 0.994 | 0.3958 | 0.0012 |
F0, F1, F2, F3, and F4 denote the application rates of organic fertilizer at 0, 20, 40, 60, and 80 kg/ha, respectively, under fresh-water irrigation. B0, B1, B2, B3, and B4 denote the application rates of organic fertilizer at 0, 20, 40, 60, and 80 kg/ha, respectively, under brackish water irrigation.
Table 3.
Parameters of modified rectangular hyperbolic model light response curve of pakchoi under different treatments.
Table 3.
Parameters of modified rectangular hyperbolic model light response curve of pakchoi under different treatments.
| Treatments | Maximum Net Photosynthesis Rate (µmol·m−2·s−1) | Apparent Quantum Efficiency | Light Compensation Point (µmol·m−2·s−1) | Light Saturation Point (µmol·m−2·s−1) | Dark Respiration Rate (µmol·m−2·s−1) | ∆I (µmol·m−2·s−1) | R2 |
|---|---|---|---|---|---|---|---|
| F0 | 11.46 de ± 0.56 | 0.0858 bc ± 0.0042 | 52.63 d ± 0.0066 | 1606 i ± 0.24 | 3.65 ab ± 0.18 | 1553 i ± 0.103 | 0.990 |
| F1 | 13.58 cd ± 0.67 | 0.0493 de ± 0.0024 | 26.59 g ± 0.0007 | 1850 c ± 0.08 | 1.23 ef ± 0.06 | 1824 c ± 0.041 | 0.993 |
| F2 | 18.77 b ± 0.92 | 0.0833 bc ± 0.0041 | 17.80 h ± 0.0001 | 1698 e ± 0.03 | 1.41 def ± 0.07 | 1679 f ± 0.015 | 0.994 |
| F3 | 23.38 a ± 1.15 | 0.0999 bc ± 0.0049 | 10.70 i ± 0.4512 | 1539 j ± 0.05 | 1.03 f ± 0.01 | 1527 j ± 0.018 | 0.992 |
| F4 | 19.14 ab ± 1.09 | 0.1995 a ± 0.0098 | 10.22 j ± 0.3141 | 1690 f ± 0.01 | 1.89 de ± 0.04 | 1686 e ± 0.003 | 0.995 |
| B0 | 8.62 e ± 0.42 | 0.0500 de ± 0.0025 | 45.76 e ± 0.0014 | 1667 h ± 0.01 | 1.96 d ± 0.10 | 1622 g ± 0.002 | 0.994 |
| B1 | 10.69 de ± 0.52 | 0.0687 cd ± 0.0034 | 77.95 b ± 0.0054 | 1685 g ± 0.28 | 4.20 a ± 0.21 | 1608 h ± 0.128 | 0.991 |
| B2 | 10.68 de ± 0.52 | 0.0414 e ± 0.0020 | 89.45 a ± 0.0110 | 2184 a ± 0.13 | 3.10 bc ± 0.15 | 2094 a ± 0.072 | 0.996 |
| B3 | 16.93 bc ± 0.83 | 0.0321 e ± 0.0016 | 60.20 c ± 0.0003 | 2086 b ± 0.01 | 1.83 de ± 0.09 | 2026 b ± 0.005 | 0.994 |
| B4 | 12.54 cde ± 0.66 | 0.0888 bc ± 0.0044 | 35.10 f ± 0.0008 | 1740 d ± 0.02 | 2.70 c ± 0.13 | 1705 d ± 0.009 | 0.995 |
∆I = Isat − Ic, Isat, light saturation point, Ic, light compensation point. F0, F1, F2, F3, and F4 denote the application rates of organic fertilizer at 0, 20, 40, 60, and 80 kg/ha, respectively, under fresh-water irrigation. B0, B1, B2, B3, and B4 denote the application rates of organic fertilizer at 0, 20, 40, 60, and 80 kg/ha, respectively, under brackish water irrigation. Different lowercase letters indicate significant differences at p < 0.05. The value is shown as the means ± SD (n = 3).
Table 4.
Mathematical models of yield, soluble sugar (SS), soluble protein (SP), and organic fertilizer (OF) under fresh water and brackish water irrigation.
Table 4.
Mathematical models of yield, soluble sugar (SS), soluble protein (SP), and organic fertilizer (OF) under fresh water and brackish water irrigation.
| Irrigation Water | Mathematical Model | R2 | p |
|---|---|---|---|
| Fresh water | Yield = −2.7732 × OF + 413.92 × OF + 35387 | 0.950 | <0.05 |
| SS = −0.0059 × OF + 0.5349 × OF + 23.503 | 0.793 | ||
| SP = −0.0014 × OF + 0.1142 × OF + 3.9225 | 0.963 | ||
| Brackish water | Yield = −2.1405 × OF + 326.11 × OF + 34706 | 0.966 | |
| SS = −0.0035 × OF + 0.3984 × OF + 21.632 | 0.585 | ||
| SP = −0.0006 × OF + 0.0466 × OF + 3.5578 | 0.978 |
Disclaimer/Publisher’s Note: The statements, opinions and data contained in all publications are solely those of the individual author(s) and contributor(s) and not of MDPI and/or the editor(s). MDPI and/or the editor(s) disclaim responsibility for any injury to people or property resulting from any ideas, methods, instructions or products referred to in the content. |
© 2024 by the authors. Licensee MDPI, Basel, Switzerland. This article is an open access article distributed under the terms and conditions of the Creative Commons Attribution (CC BY) license (https://creativecommons.org/licenses/by/4.0/).
Share and Cite
MDPI and ACS Style
Lin, S.; Wei, K.; Wang, Q.; Sun, Y.; Deng, M.; Tao, W. Effects of Organic Fertilizer on Photosynthesis, Yield, and Quality of Pakchoi under Different Irrigation Conditions. Plants 2024, 13, 1308. https://doi.org/10.3390/plants13101308
AMA Style
Lin S, Wei K, Wang Q, Sun Y, Deng M, Tao W. Effects of Organic Fertilizer on Photosynthesis, Yield, and Quality of Pakchoi under Different Irrigation Conditions. Plants. 2024; 13(10):1308. https://doi.org/10.3390/plants13101308
Chicago/Turabian StyleLin, Shudong, Kai Wei, Quanjiu Wang, Yan Sun, Mingjiang Deng, and Wanghai Tao. 2024. "Effects of Organic Fertilizer on Photosynthesis, Yield, and Quality of Pakchoi under Different Irrigation Conditions" Plants 13, no. 10: 1308. https://doi.org/10.3390/plants13101308
Note that from the first issue of 2016, this journal uses article numbers instead of page numbers. See further details here.