Article

A Naked-Eye Colorimetric Ratio Method for the Selective and Sensitive Detection of L-Cys Based on a Silver Nanoflakes–Chromium (III) Ion System

1
College of Science, Hebei Agricultural University, Baoding 071001, China
2
Hunan Soil and Fertilizer Institute, Hunan Academy of Agricultural Sciences, Changsha 410125, China
3
Shandong Key Laboratory of Storage and Transportation Technology of Agricultural Products, Jinan 250103, China
4
National Engineering Research Center for Agricultural Products Logistics, Jinan 250103, China
5
State Key Laboratory of Biochemical Engineering, Institute of Process Engineering, Chinese Academy of Sciences, Beijing 100190, China
*
Authors to whom correspondence should be addressed.
Chemosensors 2024, 12(5), 80; https://doi.org/10.3390/chemosensors12050080
Submission received: 8 April 2024 / Revised: 8 May 2024 / Accepted: 9 May 2024 / Published: 11 May 2024

Abstract

:
As a necessary sulfhydryl amino acid, L-cysteine (L-Cys) maintains many physiological functions in the biological system. However, abnormal L-Cys levels can cause a variety of diseases. In our work, a highly sensitive and selective assay has been developed for sensing L-Cys using the morphological transformation of silver-based materials induced by Cr3+. In this sensing system, Cr3+ could etch the silver nanoflakes into silver nanoparticles, accompanied by a change in absorbance, which decreases at 395 nm, creates a new peak at 538 nm, and keeps increasing the absorbance with the addition of Cr3+ concentration. Meanwhile, under the naked eye, the solution color changes from bright yellow to dark purple. Because of the strong affinity between L-Cys and Cr3+, L-Cys could inhibit the induction of Cr3+ on silver-based materials, thereby preventing changes in the configuration, absorption spectrum, and color of silver-based materials. Taking advantage of this point, we can quantitatively detect the concentration of L-Cys. A linear relationship between the absorbance ratio (A538 nm/A395 nm) and L-Cys concentration was found in the range of 0.1–0.9 μM, and the detection limit was 41.2 nM. The strategy was applied to measure L-Cys spiked in beer and urine samples, with recovery from 93.80 to 104.03% and 93.33% to 107.14% and RSD from 0.89 to 2.40% and 1.80% to 6.78%, respectively. This detection strategy demonstrates excellent selectivity and sensitivity, which makes it a practical and effective method for the detection of L-Cys in real samples.

1. Introduction

L-cysteine (L-Cys) is a vital sulfhydryl amino acid of the human body and is involved in many significant physiological processes. When L-Cys is excessive or deficient, it will cause corresponding physiological health problems. For example, lacking L-Cys is one of the central factors in skin lesions [1] and hair discoloration [2]. Excess L-Cys will cause various symptoms, such as liver damage [3], urinary stone formation [4], and Parkinson’s disease [5]. The daily intake of L-Cys ranges from 0.4 to 0.6 g/m2 per day [6]. Therefore, it is important to establish a method that can conveniently, selectively, and sensitively detect L-Cys to ensure the amount of L-Cys intake is at the normal level [7], and provide a basis for disease diagnosis.
At present, there are many ways to test for L-Cys, such as electrochemical analysis [8], high-performance liquid chromatography (HPLC) [9], fluorescence analysis [10,11], and colorimetry [12]. Because of the advantages of its low cost, low detection limit, and simple operation [13], the optical strategy, especially colorimetry, has been extensively applied for testing L-Cys.
Among various colorimetric materials, the research on silver-based nanomaterials has received much attention. Silver-based nanomaterials include silver nanoparticles (AgNPs) [14], silver nanoclusters (AgNCs), silver nanorods (AgNRs), silver nanoflakes, silver nanoprisms (AgNPRs), etc. They have strong surface plasmon resonance (SPR), and their optical properties vary depending on the particles’ size and shape, and the distance between particles and surrounding media [15], resulting in corresponding changes in visible-light wavelengths. In addition, they also have other prominent features, such as large surface coverage [16], high chemical stability , and a low cost [17], which means that they have been widely used for the detection of substances such as dipyridyl acid (DPA) [18], neomycin, and thiamine [19]. Li et al. utilized silver nanoflakes that were modified with citric acid to exhibit high selectivity towards Cr3+ while exhibiting good anti-interference effects against other common metal cations [20]. Based on this, a new method for the highly selective and ultra-sensitive visual detection of trivalent Cr3+ in water was constructed. These results prove that silver nanomaterials have sufficient advantages and considerable sensitivity in the quantitative detection of colorimetric method and are able to quantitatively detect targets.
The indirect interaction between the target and nanoparticles can also be used to design nanoprobes for target detection, which has aroused great interest. According to previous reports on L-Cys detection, the addition of metal ions can change the optical properties of nanomaterials, and the response mechanism of a strong binding strength between L-Cys and metal ions (such as Hg2+, Cu2+, and Ag+) can reduce the optical impact of metal ions on nanomaterials, thereby quantitatively detecting L-Cys [21]. For example, Gu et al. prepared a specific nanoprobe for detecting L-Cys based on the electron transfer-induced fluorescence-quenching mechanism of nitrogen-rich quantum dots [22]. This work mainly utilized the selective complexation of Cu2+ and L-Cys to inhibit the influence of Cu2+ on the optical properties of nanomaterials and established a curve relationship between the spectra of nanomaterials and the concentration of L-Cys, which could quantitatively detect L-Cys. In addition, similar response mechanisms were used to develop logic gate nanoprobes based on multimode optical signals for measurements of Cu2+ and L-Cys [23]. These probes can quantitatively detect target analytes with high selectivity based on simple principles. However, research on the strong interaction between Cr3+ and L-Cys is still rare.
In our work, we designed a colorimetric sensor for detecting L-Cys by utilizing the strong chelating ability of L-Cys to Cr3+, which can weaken the morphological transformation of silver-based materials under the stimulation of Cr3+. Cr3+ can etch silver nanoflakes into silver nanoparticles, causing the solution to change from bright yellow to deep purple. The UV visible absorption shows a trend of absorption peak changes with a decrease at 395 nm and an increase at 538 nm. After the addition of L-Cys, the strong complexation between L-Cys and Cr3+ blocks the transition from silver nanoflakes to silver nanoparticles. Therefore, when the concentration of Cr3+ is fixed, a linear relationship can be established between the ratio of two absorption peaks (A538 nm/A395 nm) and L-Cys. Also, the probe color change that occurs after adding L-Cys can be used as the basis for the visual detection of L-Cys. Our research strategy has a simple design principle, mild reaction conditions, high selectivity, and high sensitivity, with a detection limit of 41.2 nM. In addition, the approximate concentration of L-Cys per liter of micromolar level can be easily determined through visual detection, and can be applied to the crude and fine detection of L-Cys in various foods, as well as to detect L-Cys to provide an early warning of disease. Finally, the developed cascade colorimetric sensor is applied to L-Cys detection in beers and urine.

2. Results and Discussion

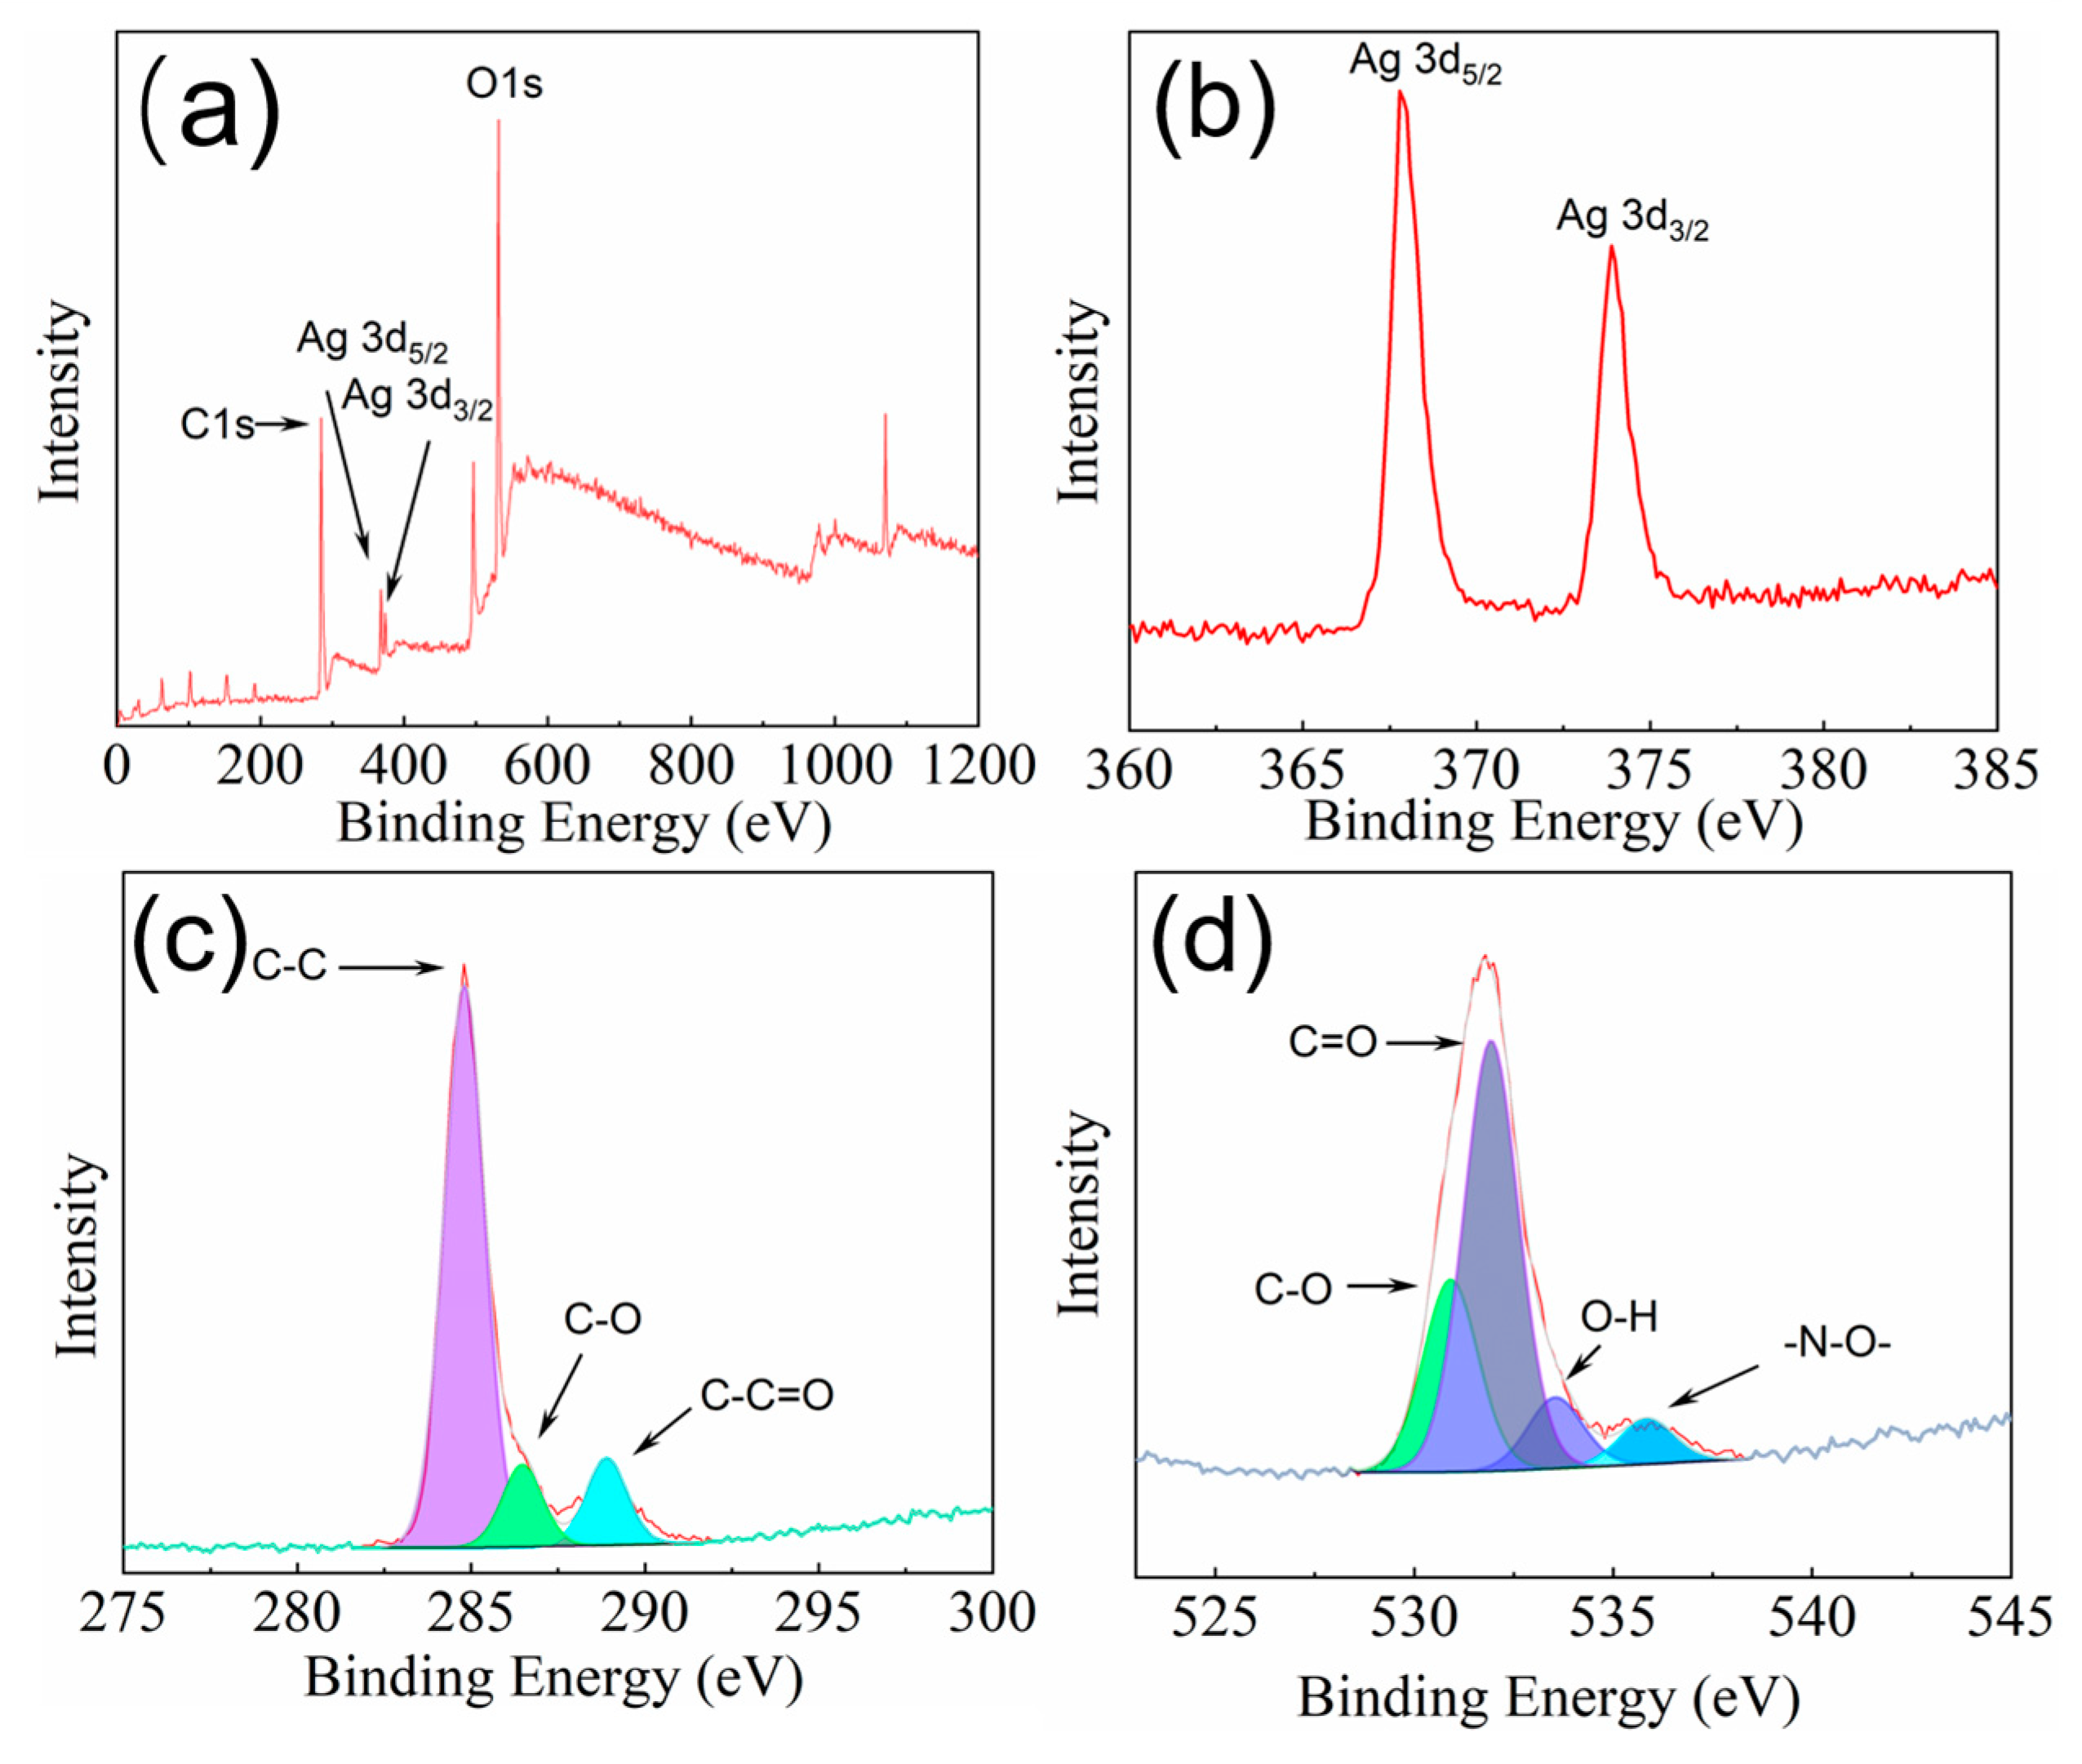
2.1. Preparation and Characterization of Silver Nanoflakes

In this study, citrate-stabilized silver nanoflakes were synthesized using NaBH4 as a reducing agent and used for the detection of L-Cys. The detection method is shown in Scheme 1. Cr3+ could stimulate the transformation of silver nanoflakes into silver nanoparticles. However, when adding the mixture of L-Cys and Cr3+, Cr3+ would be complexed with L-Cys, thus blocking the morphological transformation of silver nanomaterials. As shown in Figure 1a (A), the silver nanoflakes had a strong absorption peak at 395 nm, and the colloid solution color was bright yellow. When Cr3+ was added, the absorption peak at 395 nm became weaker, and a new absorption peak appeared and was redshifted with Cr3+ concentration, with the solution color changing from bright yellow to dark purple (Figure 1a (C)). Compared to the addition of Cr3+ alone, when adding the mixture of L-Cys and Cr3+, the absorption peak of silver nanoflakes at 395 nm decreased less, and the absorption peak at 538 nm also increased less, indicating that after L-Cys was complexed with Cr3+, the etching effect of Cr3+ on silver nanoflakes was blocked (Figure 1a (D)).
The morphological characteristics of silver-based materials in TEM images are shown in Figure 2. The prepared silver nanoflakes have a large size and layered structure (Figure 2a). After adding 12.5 μM of Cr3+ to the silver nanoflakes, the morphology of silver-based materials changed from silver nanoflakes to spherical silver nanoparticles (Figure 2c), with a significantly smaller size than that of silver nanoflakes. This proves that Cr3+ can destroy the structure of silver nanoflakes to transform them into silver nanoparticles, change the size of silver nanomaterials, and lead to a change in solution color. When adding a complexation of 12.5 μM Cr3+ and 1.5 μM L-Cys, the silver nanoflakes also become spherical silver nanoparticles (Figure 2b), but the size of the silver nanoparticles in Figure 2b is significantly larger than that in Figure 2c, because the presence of L-Cys can effectively chelate Cr3+, thereby weakening the etching effect of Cr3+ on the silver nanoflakes, and thus retaining a slightly larger size of the silver nanoparticles. Except for this aspect, the particle size of the silver-based material was tested by DLS analysis. The average size of the silver nanoflakes was 447.09 nm (Figure 2d), and the size changed to 1.95 nm when 12.5 μM Cr3+ was added (Figure 2f). In the presence of the complexation of 12.5 μM Cr3+ and 1.5 μM L-Cys, the size of silver nanoflakes changed to 185.73 nm (Figure 2e). The results were consistent with TEM, which also proved that the complexation reaction between L-Cys and Cr3+ would block the etching effect of Cr3+ on silver nanoflakes and affect the change in the size of silver nanoflakes, which might be the reason for the change in the color of silver nanoflakes.
To determine the successful synthesis and element distribution of silver nanoflakes, XPS characterizations are shown in Figure 3. As shown in Figure 3a, the silver nanoflakes contain three elements: C, O, and Ag. The C1s peaks at 284.8 eV, 286.5 eV, and 288.9 eV in Figure 3c belong to C-C, C-O, and C-C=O, respectively [24]. The 367.8 eV in Figure 3b belongs to Ag3d5/2; 373.9 eV belongs to Ag3d3/2 [25]. The 530.9 eV, 531.8 eV, 533.2 eV, and 535.7 eV presented in Figure 3d belong to the C-O, C=O, O-H, and-N-O- of the O1s peak, respectively [26]. The results prove that the silver nanoflakes contain both Ag, C, and O, and gain carboxyl groups from citrate. The EDS test is shown in Figure S1; the silver nanomaterials are composed of Ag, C, and O, in line with the predicted elements of silver nanoflakes, proving the successful synthesis of silver nanoflakes. By comparing the elements of the EDS picture, the percentage of Ag decreases after the addition of Cr3+ (Figure S1b). This may be attributed to the etching of the silver nanoflakes by Cr3+, which causes some silver elements to become silver ions and disperse into the solution. The results of EDS are consistent with the results of the analysis of XPS elements, which proves the successful synthesis of silver nanoflakes.
The XRD results are compared with the standard card in Figure S1c; the diffraction peaks at 2θ = 38.1°, 44.3°, 64.5°, 77.6°, and 81.4° correspond to the five-phase peaks of (111), (200), (220), (311) and (222), and these are consistent with the standard card, which proves the existence of silver [27]. There are no other diffraction peaks in the spectra of silver nanoflakes, indicating their phase purity as well as their crystallinity.

2.2. The Detection Mechanism of L-Cys

The response mechanism based on a strong linkage between L-Cys and metal ions has aroused great interest in devising a variety of nanoprobes for L-Cys detection [28]. It may be that the strong affinity between Cr3+ and the sulfhydryl group of L-Cys produces the complexes and results in a reduction in the amount of Cr3+ that reacts with the silver nanoflakes [29]. In short, the more L-Cys is added, the less Cr3+ is reacted, and the color of silver nanoflakes also changes from dark purple to bright yellow, which can be used as the basis for the naked-eye detection of L-Cys. At the same time, the change in absorbance can also quantify the concentration of L-Cys.
In Figure 1, it can be seen that L-Cys alone does not affect the absorbance of silver nanoflakes (Figure 1a (A)). Compared to the absorbance of a silver nanoflakes solution with Cr3+ alone (Figure 1a (C)), the absorbance of silver nanoflakes after incubation with L-Cys (Figure 1a (D)) undergoes a smaller change. It can be seen that the interaction between L-Cys and Cr3+ reduces the actual amount of reacted Cr3+. Since L-Cys has a simple structure and the sulfhydryl group shows a high chelating performance, it is speculated that the chelating of the sulfhydryl group and Cr3+ leads to a decrease in the quantity of free Cr3+, which leads to a change in absorbance.
By comparing the FTIR spectroscopy of each group in Figure S2a, we can provide a possible corollary between trisodium-citrate-coated silver nanoflakes and Cr3+. The peaks at 3266 and 3455 cm−1 should be the hydroxy group, which most likely belongs to the citrate, and the synthesis of silver nanoflakes significantly changes the peak at 3266 cm−1. The peaks at 1152 and 1073 cm−1 are most likely geared to the stretching vibration of the C−O bond. The peaks at 1603 and 1393 cm−1 may come from the symmetric vibration and asymmetric vibration of carboxylate (COO). In addition, it can be seen from Figure S2a (B) that the peak of 1393 cm−1 strength decreases after synthesizing silver nanoflakes compared with Figure S2a (A), while in Figure S2a (B), the peak intensity becomes significantly lower, reaching 1603 cm−1 in Figure S2a (C), possibly due to the interaction between Cr3+ and COO [20]. Because metal ions can be complexed with citrate on the surface of silver nanomaterials [30], Cr3+ may undergo a strong interaction with the carboxyl of citric acid [31]. As shown in Figure S2b, the sulfhydryl group stretching vibration of L-Cys is around 2550 cm−1, and no relevant infrared peak of the sulfhydryl group is found in the silver nanoflakes. The probable cause is L-Cys coordination with Cr3+.

2.3. Optimum Conditions for the Silver Nanoflakes–Chromium (III) Ion System

To make the detection results more stable, we optimized the reaction conditions. Firstly, the amount of Cr3+ was screened using the absorption peak and the color of the silver nanoflakes. As depicted in Figure 1b, with the increase in the concentration of Cr3+, the absorbance decreases and increases at 395 nm and 538 nm, respectively. Response time also often affects the stability of parallel experimental results. The test showed that the reaction between L-Cys and Cr3+ was completed instantaneously (Figure S3a). After 1 min, the absorbance ratio (A538 nm/A395 nm) remained unchanged and could be maintained for more than 20 min, so we chose 1 min as the optimal action time. The incubation of the L-Cys and Cr3+ mixture with silver nanoflakes leveled off after 5 min and was maintained for more than 7 min (Figure S3b), so 5 min was presumed to be the best incubation time. As shown in Figure S3c. At each pH, we conducted three parallel sets of experiments and took A538 nm/A395 nm as the vertical coordinate. The lower the ratio, the better the effect of inhibiting Cr3+ etching at the same L-Cys concentration. As can be seen from the graph, pH = 6 is the lowest point, so we chose pH = 6 as the final pH for our in vitro experiment. Furthermore, the reaction conditions of the sensor are relatively mild, and the results obtained are robust. The following tests were completed under such conditions.

2.4. Sensitivity of the Novel Sensor for L-Cys

As depicted in Figure 4, under optimized conditions, the absorbance of silver nanoflakes changes regularly along with the constant increase in L-Cys concentration. The ratio of absorbance (A538 nm/A395 nm) decreased and had a linear relationship with the concentration of L-Cys in the range of 0.1–0.9 μM. The curved equation is y = 0.864 – 3.62341x, R2 = 0.997, and the detection limit is 41.2 nm (3σ rule). The strategies presented in Table 1 are compared with other L-Cys assay methods. By comparison, this detection method showed high sensitivity. To decrease background interference, improve the sensitivity of the measurement method, and optimize the detection results, a dual-signal sensor is shown to be better than a single-signal sensor. In addition, the colorimetric method adopted in this study underwent relatively broad color changes, which could be directly observed by the naked eye for semi-quantitative analyses of L-Cys at concentrations above 0.5 μM, providing a more convenient strategy for detecting L-Cys.

2.5. Selectivity Test for L-Cys

To evaluate the specificity of the sensing system for L-Cys detection, we chose other amino acids and small biological molecules to replace L-Cys or mix them with L-Cys before detection [39]. These included Glu, Met, Lys, Phe, Thr, Ile, Gly, His, Tyr, Ser, Arg, GLU, and GSH. The same concentration of GSH and L-Cys was used; other concentrations were all three times that of L-Cys, and other detection conditions were identical. The results are shown in Figure 5. A538 nm/A395 nm decreased more than other substances under the action of L-Cys. The visualization is shown in the inset (Figure 5a). It can be seen that the nanoprobe has specificity for the detection of L-Cys. Due to its sulfhydryl group and similar structure, GSH also has a certain reaction capacity, but this is far less than that of L-Cys (Figure 5a shows that the influence of GSH is less than one-fifth that of L-Cys). The detection effect of GSH is not as good as that of L-Cys, which may be because GSH is more complex and shows some steric hindrance. At the same time, in the actual sample detection, GSH and L-Cys do not often coexist, even if there is a concentration difference, and because the probe is more sensitive to L-Cys, the detection range of L-Cys in the actual sample is wider. The above results show that the nanoprobe has excellent selectivity. As shown in Figure 5b, the experimental results indicated that, in the presence of multiple interfering agents, the absorption ratio was almost similar to those in the presence of L-Cys alone. Therefore, this method has a good anti-interference ability.
A variety of adsorption data, including the binding site, binding strength, and binding energy for L-Cys and GSH, were analyzed utilizing DFT. This approach was employed to forecast and explore the potential adsorption mechanism between L-Cys, GSH, and the target Cr3+ in Figure S4a. The calculation results are EL-Cys-Cr = −136.43 kcal/mol, and EGSH-Cr = −111.86 kcal/mol, which can prove that the binding force of L-Cys with Cr3+ is stronger than that of GSH with Cr3+. Therefore, L-Cys is prone to preferentially binding with Cr3+.
To further investigate the mechanism of the selectivity, the EHOMO, ELUMO, and Fukui indices, and other parameters characterizing the molecular activity of the adsorbents, were calculated using the DFT method, as shown in Table S3. Due to the typically nucleophilic nature of the HOMO of the sulfur atom in the molecule of L-Cys, and the typically electrophilic nature of Cr3+, the sulfur atom in L-Cys molecules often tends to preferentially form coordination complexes with Cr3+. This coordination interaction can be explained through the HOMO–LUMO interaction, where the interaction between the HOMO of L-Cys and the LUMO of Cr3+ is crucial for the coordination reaction to occur. Through global reactivity calculations, we obtained EL-Cys = LUMO–HUMO = 3.9 eV and EGSH = LUMO–HUMO = 4.1 eV, indicating that, compared to GSH, L-Cys is more prone to binding with Cr3+.
Through Fukui function analysis, it is evident that the sulfur atoms in both GSH and L-Cys possess the highest numerical values, making them the most susceptible to nucleophilic attack. This leads to the formation of coordination complexes with chromium ions and the establishment of a tighter bond with L-Cys, as shown in Figure S4b.

2.6. Practical Application in a Real Sample

Since L-Cys, as an additive, is an important component affecting the taste of beer, in addition, due to the existence of L-Cys in beer, excessive drinking will inevitably lead to an increase in the human intake of L-Cys. Therefore, it is necessary to test the content of L-Cys in beer to control this. The content of L-Cys in urine can directly predict the occurrence of disease. A colorimetric determination of L-Cys in beer and urine was carried out to evaluate the feasibility of using the new colorimetric nanosensor for the determination of L-Cys in practical applications. After adding different concentrations of L-Cys to the treated beer and urine, the detection was carried out under optimal conditions. Tables S1 and S2 summarize the concentration of L-Cys in the real sample and the corresponding results. For the real sample of beer, the recovery of L-Cys ranged from 93.80% to 104.03% and RSD ranged from 0.89% to 2.40%, and for urine, the recovery ranged from 93.33% to 107.14% and the RSD date ranged from 1.80% to 6.78%. The results clearly show that the new nanosensor can easily measure L-Cys in real samples, and our study provides a novel feasible method to test L-Cys.

3. Experimental Section

3.1. Chemicals and Materials

L-Cys and Histidine (His) were purchased from Biotopped (Beijing, China). Tyrosine (Tyr), Glutathione (GSH), Threonine (Thr), Glycine (Gly), Arginine (Arg), Lysine (Lys), Isoleucine (Ile), Phenylalanine (Phe), Glucose (GLU), Methionine (Met), Serine (Ser), silver nitrate, and Glutamate (Glu) were obtained from Solarbio (Shanghai, China). Cadmium nitrate and trisodium citrate were purchased from Fuchen Chemistry (Tianjin, China). All other reagents and materials were purchased from Sinopharm Chemical Reagent Co. Ltd. (Shanghai, China). All solutions are deionized water configurations.

3.2. Characterization Techniques for Silver Nanoflakes

UV–Vis 1780 spectrophotometer (Shimadzu, Kyoto, Japan) recorded UV–Vis absorption spectra. Fourier transform infrared (FTIR) spectra (4000–400 cm−1) in KBr were recorded on a NEXUS-470 FTIR spectrometer (Nicolet, MA, USA). The morphology of silver nanoflakes was recorded on a transmission electron microscopy (TEM, Tokyo, Japan, JEOL JEM 2800), and the dynamic light scattering (DLS) experiments were observed at a Malvern Zetasizer Nano ZS ZEN3600 (Malvern, England). The energy-dispersive spectrometer (EDS) and the X-ray photoelectron spectroscopy (XPS) were recorded by TESCAN MIRA LMS and Shimadzu/Kratos AXIS Ultra DLD (Kyoto, Japan), respectively. Rigaku-2038 was used to gain XRD data in the scanning range 2θ = 5–90° and the scanning speed was 10°/min.

3.3. Computational Method

The lowest energy geometries were optimized under the Density Functional Theory (DFT) approach using the DMol3 suite of programs in Materials Studio. The generalized gradient approximation with the Perdew–Burke–Ernzerhof functional (GGA-PBE) was applied to describe the exchange-correlation function [40]. Energy cutoff was 400 eV. All structures were optimized until the energy converged to 2.0 × 10⁻⁵ Ha and the force converged to 0.004 Ha/Å.
Subsequently, the binding energy (Ebind) of the complex was defined as follows [41]:
E b i n d = E L C y s @ C r E L C y s + E C r
The global reactivity of the complex was defined as follows [42]:
E = L U M O H U M O
where EL-Cys@Cr, EL-Cys, and ECr represent the energies of L-Cys and Cr3+ and the total energy of L-Cys-Cr, respectively. HUMO and LUMO stand for Highest Occupied Molecular Orbital and Lowest Unoccupied Molecular Orbital, respectively. A more negative Ebind value indicates greater adsorption strength.
The detection limit was calculated as 3S/k (n = 11), where S represents the standard deviation of 11 blank samples and k is the slope of the standard curve. The recovery rate was calculated by dividing the amount found by the probe in the real sample by the amount theoretically present after the calibration, and the RSD under each group was obtained in three parallel experiments.

3.4. Synthesis of Silver Nanoflakes

According to the general method, we adjusted the ratio of sodium citrate, silver nitrate, and sodium borohydride to prepare silver nanoflakes. Among them, sodium citrate was used as a stabilizer of silver nitrate and NaBH4 was used as a reducing agent. Specific steps are as follows. All glassware was treated with aqua regia and then thoroughly cleaned with deionized water. Briefly, 1 mL (35 mM) of trisodium citrate and 1 mL (35 mM) of silver nitrate solid were dissolved in 197 mL of deionized water and stirred vigorously. Then, 1 mL (0.4 M) of NaBH4 was added to the above aqueous solution drop by drop. With the addition of sodium borohydride solution, the solution changed from colorless and transparent to black, then to bright yellow. Stirring continued at room temperature for 4 h, until the bright yellow color became slightly darker. The obtained product was stored for one day as a colorimetric stock solution in a dark container to provide a standby.

3.5. Detection of L-Cys by Silver Nanoflakes–Chromium (III) Ion System

The L-Cys detection system was established at room temperature. A Cr3+ solution was prepared with a concentration of 12.5 μM, 400 μL of L-Cys solutions was added at different concentrations (0, 50 nM, 250 nM, 500 nM, 750 nM, 1 μM, 1.25 μM, 1.5 μM, 1.75 μM, 2 μM, 2.25 μM, 2.5 μM) to 400 μL of the above Cr3+ solution, and a 200 μL buffer solution with pH = 6 was mixed evenly through vortices. Then, 1 ml of the prepared silver nanoflakes solution was added and incubated for 5 min, before immediately measuring the absorbance at 538 nm and 395 nm.

3.6. Determination of L-Cys in Real Sample

Beer samples obtained from a local supermarket (Baoding China) and urine samples were provided by local volunteers (Baoding, China). These actual samples were used to evaluate the sensor’s performance in detecting L-Cys. In light of the previously reported literature, beer was directly filtered with filter paper, and then the filtrates were diluted 100 times for recovery analysis. Different final concentrations (0, 100, 200, 300, 400, 500 nM) of L-Cys (200 μL) were added to the 200 μL beer sample. Following this, 200 μL pH = 6 buffer solution was added, then 400 μL (12.5 μM) Cr3+ was added. Finally, 1 mL of the prepared silver nanoflakes was added. The absorbance ratio (A538 nm/A395 nm) was recorded and the theoretical concentration was calculated based on the standard curve. Normally, the amount of L-Cys in a human urine sample is 16.5–33.0 μM [43]. For accurate measurement, urine sample stock solution 8000 r was centrifuged for 30 min to remove large particles and the supernatant was passed through a 0.22 μm filter membrane to obtain the filtrate of the stock solution and diluted 100 times compared to the real sample solution. Concentrations of 0, 0.25, 0.5, 0.75 μM L-Cys standard solution were added to the real sample solution, respectively. Actual L-Cys content was detected using the ratio sensor described above.

4. Conclusions

In this study, the L-Cys content in urine and beer was successfully detected utilizing strong force using a silver nanoflakes-Cr3+ system. This method is easy to operate, has good detection sensitivity and selectivity, and the color change in the sensor is easy to capture using the naked eye, meaning that it can be quickly applied in the detection of L-Cys. This study provides a new method and a new idea for the detection of L-Cys in vitro.

Supplementary Materials

The following supporting information can be downloaded at: https://www.mdpi.com/article/10.3390/chemosensors12050080/s1, Figure S1: The picture describes the EDS result of (a) silver nanoflakes and (b) the silver nanoflakes added Cr3+, the inset is the corresponding weight fraction and atomic fraction. (c) The results of XRD analysis are compared with the standard chart of silver. Figure S2: (a) FTIR spectra of (A) trisodium citrate, (B) silver nanoflakes, (C) silver nanoflakes with the Cr3+ (b) FTIR spectra of L-Cys, and silver nanoflakes with Cr3+ and L-Cys. Figure S3: The picture describes (a) the reaction time of L-Cys with Cr3+, and (b) the reaction time with silver nanoflakes after their interaction. (c) The ratio of absorbance for different pH (pH = 4, 5, 6, 7, 7.4). Figure S4: (a) Construction of binding energy models of L-Cys and SH with Cr3+ respectively. (b) Calculation model and data of Fukui function. Table S1: Determination of L-Cys in beer by the proposed method (n = 3). Table S2: Determination of L-Cys in urine by the proposed method (n = 3). Table S3: Parameters characterizing molecular activity.

Author Contributions

X.Z. validation, formal analysis, investigation, data curation, writing—original draft, Y.Z. methodology, formal analysis; Y.G. data curation, investigation; J.Z. data curation, investigation, M.L. conceptualization, methodology, resources; J.Q. conceptualization, methodology, writing—reviewing and editing. All authors have read and agreed to the published version of the manuscript.

Funding

This research received no external funding.

Institutional Review Board Statement

Not applicable.

Informed Consent Statement

Not applicable.

Data Availability Statement

Data are contained within the article and Supplementary Materials.

Acknowledgments

The authors would like to thank Shiyanjia lab for the support of TEM testing.

Conflicts of Interest

There are no conflicts of interest to declare.

References

  1. Han, S.; Zhang, H.; Yue, X.; Wang, J.; Yang, L.; Wang, B.; Song, X. A Ratiometric, Fast-Responsive, and Single-Wavelength Excited Fluorescent Probe for the Discrimination of Cys and Hcy. Anal. Chem. 2021, 93, 10934–10939. [Google Scholar] [CrossRef] [PubMed]
  2. Chen, S.; Chi, M.; Zhu, Y.; Gao, M.; Wang, C.; Lu, X. A Facile synthesis of superparamagnetic Fe3O4 nanofibers with superior peroxidase-like catalytic activity for sensitive colorimetric detection of L-cysteine. Appl. Surf. Sci. 2018, 440, 237–244. [Google Scholar] [CrossRef]
  3. Du, Z.; Zhang, R.; Song, B.; Zhang, W.; Wang, Y.L.; Liu, J.; Liu, C.; Xu, Z.P.; Yuan, J. Iridium(III) Complex-Based Activatable Probe for Phosphorescent/Time-Gated Luminescent Sensing and Imaging of Cysteine in Mitochondria of Live Cells and Animals. Chemistry 2019, 25, 1498–1506. [Google Scholar] [CrossRef]
  4. Maiti, P.; Singha, T.; Chakraborty, U.; Roy, S.D.; Paul, P.K. Selective and sensitive detection of L-Cysteine via fluorometric assay using gold nanoparticles and Rhodamine B in aqueous medium. Mater. Chem. Phys. 2019, 234, 158–167. [Google Scholar] [CrossRef]
  5. Mohandoss, S.; Palanisamy, S.; Priya, V.V.; Mohan, S.K.; Shim, J.J.; Yelithao, K.; You, S.; Lee, Y.R. Excitation-dependent multiple luminescence emission of nitrogen and sulfur co-doped carbon dots for cysteine sensing, bioimaging, and photoluminescent ink applications. Microchem. J. 2021, 167, 106280. [Google Scholar] [CrossRef]
  6. Mercy, J.S.I.; Maruthupandi, M.; Mamat, M.H.B.; Vasimalai, N. Facile In-Situ Synthesis of Biopolymer Capped Nano Sized Silver Particles: Smartphone Aided Paper-Based Selective Detection of CYS and TC Drugs in Biological and Drug Samples. J. Cluster Sci. 2021, 33, 1055–1067. [Google Scholar] [CrossRef]
  7. Xu, Z.; Qin, T.; Zhou, X.; Wang, L.; Liu, B. Fluorescent probes with multiple channels for simultaneous detection of Cys, Hcy, GSH, and H2S. TrAC Trends Anal. Chem. 2019, 121, 115672. [Google Scholar] [CrossRef]
  8. Xu, N.; Li, X.; Luan, F.; Tian, C.; Zhang, Z.; Chen, L.; Zhuang, X. Ratiometric fluorescent and electrochemiluminescent dual modal assay for detection of 2, 6-pyridinedicarboxylic acid as an anthrax biomarker. Anal. Chim. Acta 2024, 1288, 342181. [Google Scholar] [CrossRef]
  9. Xiao, Q.; Gao, H.; Yuan, Q.; Lu, C.; Lin, J.M. High-performance liquid chromatography assay of cysteine and homocysteine using fluorosurfactant-functionalized gold nanoparticles as postcolumn resonance light scattering reagents. J. Chromatogr. A 2013, 1274, 145–150. [Google Scholar] [CrossRef]
  10. Lin, X.; Wu, H.; Zeng, S. A self-designed device integrated with a fermat spiral microfluidic chip for ratiometric and automated point-of-care testing of anthrax biomarker in real samples. Biosens. Bioelectron. 2023, 230, 115283. [Google Scholar] [CrossRef]
  11. Zhang, P.P.; Ni, A.Y.; Zhang, J.J.; Zhang, B.L.; Zhou, H.A.; Zhao, H.; Duan, C. Tb-MOF-based luminescent recovery probe for rapid and facile detection of an anthrax biomarker. Sens. Actuators B Chem. 2023, 384, 133624. [Google Scholar] [CrossRef]
  12. Hai, X.; Lin, X.; Chen, X.; Wang, J. Highly selective and sensitive detection of cysteine with a graphene quantum dots-gold nanoparticles based core-shell nanosensor. Sens. Actuators B Chem. 2018, 257, 228–236. [Google Scholar] [CrossRef]
  13. Cai, Y.; Fang, J.; Zhu, H.; Qin, W.; Cao, Y.; Yu, H.; Shao, G.; Liu, Y.; Liu, W. A Rapid “off-on” copper-induced AIE active sensor for fluorimetric detection of cysteine. Sens. Actuators B Chem. 2020, 303, 127214. [Google Scholar] [CrossRef]
  14. Babu, S.; Claville, M.O.; Ghebreyessus, K. Rapid synthesis of highly stable silver nanoparticles and its application for colourimetric sensing of cysteine. J. Exp. Nanosci. 2015, 10, 1242–1255. [Google Scholar] [CrossRef]
  15. Amirjani, A.; Haghshenas, D.F. Ag nanostructures as the surface plasmon resonance (SPR)˗based sensors: A mechanistic study with an emphasis on heavy metallic ions detection. Sens. Actuators B Chem. 2018, 273, 1768–1779. [Google Scholar] [CrossRef]
  16. Gokul Eswaran, S.; Ashkar, M.A.; Mamat, M.H.; Sahila, S.; Mahalingam, V.; Koppisetti, H.V.S.R.M.; Vasimalai, N. Preparation of a portable calorimetry kit and one-step spectrophotometric nanomolar level detection of l-Histidine in serum and urine samples using sebacic acid capped silver nanoparticles. J. Sci. Adv. Mater. Dev. 2021, 6, 100–107. [Google Scholar] [CrossRef]
  17. Chanajaree, R.; Ratanatawanate, C.; Ruangchaithaweesuk, S.; Lee, V.S.; Wittayanarakul, K. Colorimetric detection of Pb2+ ions using curcumin silver nanoparticles. J. Mol. Liq. 2021, 343, 117629. [Google Scholar] [CrossRef]
  18. Yin, S.; Tong, C. Europium(III)-Modified Silver Nanoparticles as Ratiometric Colorimetric and Fluorescent Dual-Mode Probes for Selective Detection of Dipicolinic Acid in Bacterial Spores and Lake Waters. ACS Appl. Nano Mater. 2021, 4, 5469–5477. [Google Scholar] [CrossRef]
  19. UshaVipinachandran, V.; Rajendran, S.; Ali, H.; Ashokan, I.; Bhunia, S.K. Citrate capped silver nanoparticles as an instantaneous colorimetric selective sensor for neomycin and thiamine in wastewater. New J. Chem. 2022, 46, 14081–14090. [Google Scholar] [CrossRef]
  20. Li, X.; Zhang, S.; Dang, Y.; Liu, Z.; Zhang, Z.; Shan, D.; Zhang, X.; Wang, T.; Lu, X. Ultratrace Naked-eye Colorimetric Ratio Assay of Chromium (III) Ion in Aqueous Solution via Stimuli-Responsive Morphology Transformation of Silver Nano Flakes. Anal. Chem. 2019, 91, 4031–4038. [Google Scholar] [CrossRef]
  21. Zhang, R.; Yong, J.; Yuan, J.; Ping Xu, Z. Recent advances in the development of responsive probes for selective detection of cysteine. Coord. Chem. Rev. 2020, 408, 213182. [Google Scholar] [CrossRef]
  22. Gu, T.; Zou, W.; Gong, F.; Xia, J.; Chen, C.; Chen, X. A specific nanoprobe for cysteine based on nitrogen-rich fluorescent quantum dots combined with Cu2+. Biosens. Bioelectron. 2018, 100, 79–84. [Google Scholar] [CrossRef] [PubMed]
  23. Liu, X.; Zhang, S.; Xu, H.; Wang, R.; Aldalbahi, A. Nitrogen-Doped Carbon Quantum Dots from Poly(ethyleneimine) for Optical Dual-Mode Determination of Cu2+ and l-Cysteine and Their Logic Gate Operation. ACS Appl. Mater. Interfaces 2020, 12, 47245–47255. [Google Scholar] [CrossRef] [PubMed]
  24. Wu, X.; Meng, X.; Hou, B.; Sun, Z.; Zhang, Y.; Li, M. Rapid fluorescent color analysis of copper ions on a smart phone via ratiometric fluorescence sensor. Mikrochim. Acta 2022, 189, 67. [Google Scholar] [CrossRef] [PubMed]
  25. Monisha; Shrivas, K.; Kant, T.; Patel, S.; Devi, R.; Dahariya, N.S.; Pervez, S.; Deb, M.K.; Rai, M.K.; Rai, J. Inkjet-printed paper-based colorimetric sensor coupled with smartphone for determination of mercury Hg2+. J. Hazard. Mater. 2021, 414, 125440. [Google Scholar] [CrossRef] [PubMed]
  26. Sun, L.; Zhang, H.; Wang, Y.; Xiong, Z.; Zhao, X.; Xia, Y. Chitosan-derived N-doped carbon dots for fluorescent determination of nitrite and bacteria imaging. Spectrochim. Acta A Mol. Biomol. Spectrosc. 2021, 251, 119468. [Google Scholar] [CrossRef]
  27. Chen, S.; Zheng, Y.; Gong, J.; Mo, S.; Ren, Y.; Xu, J.; Lu, M. Core-shell structured lignin-stabilized silver nanoprisms for colorimetric detection of sulfur ions. Int. J. Biol. Macromol. 2024, 260, 129626. [Google Scholar] [CrossRef] [PubMed]
  28. Rejeeth, C.; Sharma, A.; Nipun Babu, V.; Gautam, R. Label-free colorimetric detection of serum cysteine using Ag-NP probes in the presence of Be2+ ions. New J. Chem. 2020, 44, 9018–9024. [Google Scholar] [CrossRef]
  29. Zhang, H.; Wu, S.; Li, Y.; Tao, B.; Wu, N.; Wang, H.B.; Fang, L. Etching triangular silver nanoparticles to initiate the fluorescent response of Ru@SiO2 for sensitive detection of glutathione. Colloids Surf. A Physicochem. Eng. Asp. 2023, 671, 131686. [Google Scholar] [CrossRef]
  30. Tamilselvan, S.; Soniya, R.M.; Vasantharaja, R.; Kannan, M.; Supriya, S.; Dass Batvari, B.P.; Ramesh, T.; Govindaraju, K. Silver nanoparticles based spectroscopic sensing of eight metal ions in aqueous solutions. Environ. Res. 2022, 212, 113585. [Google Scholar] [CrossRef]
  31. Song, X.; Chen, X.; Liang, Z.; Xu, D.; Liang, Y. A colorimetric sensing probe for chromium (III) ion based on domino like reaction. Colloids Surf. B Biointerfaces 2022, 215, 112494. [Google Scholar] [CrossRef]
  32. Wei, Y.; Jiang, H.; Deng, P. Direct quantification of cysteine and glutathione by 1H NMR based on β-cyclodextrin modified silver nanoparticles. Microchem. J. 2021, 168, 106471. [Google Scholar] [CrossRef]
  33. Matsunaga, T.; Kondo, T.; Shitanda, I.; Hoshi, Y.; Itagaki, M.; Tojo, T.; Yuasa, M. Sensitive electrochemical detection of l-Cysteine at a screen-printed diamond electrode. Carbon 2021, 173, 395–402. [Google Scholar] [CrossRef]
  34. Long, L.; Yuan, F.; Yang, X.; Chen, X.; Li, L.; Wang, K. On-site discrimination of biothiols in biological fluids by a novel fluorescent probe and a portable fluorescence detection device. Sens. Actuators B Chem. 2022, 369, 132211. [Google Scholar] [CrossRef]
  35. Si, L.; Fu, Q.; Shi, Z.; Zhang, T.; Hou, Q.; Xu, Z.; Ai, S. The fluorescent detection of biothiols and antimicrobial study based on copper (I) iodide coordination polymer. Dyes Pigm. 2023, 215, 111228. [Google Scholar] [CrossRef]
  36. Zhang, W.; Wu, B.; Liang, M.; Zhang, M.; Hu, Y.; Huang, Z.S.; Ye, X.; Du, B.; Quan, Y.Y.; Jiang, Y. A lysosome-targeted fluorescent probe based on a BODIPY structure for Cys/Hcy detection. Anal. Methods 2024, 16, 686–694. [Google Scholar] [CrossRef] [PubMed]
  37. Ai, Y.; Ding, H.; Fan, C.; Liu, G.; Pu, S. Time-dependent NIR fluorescent probe with large Stokes-shift for detecting Cys/Hcy and cell imaging. Dyes Pigm. 2022, 203, 110320. [Google Scholar] [CrossRef]
  38. Gong, S.; Qin, A.; Zhang, Y.; Li, M.; Chen, X.; Liang, Y.; Xu, X.; Wang, Z.; Wang, S. A new ratiometric AIE fluorescent probe for detecting cysteine in food samples and imaging in the biological system. Food Chem. 2023, 400, 134108. [Google Scholar] [CrossRef]
  39. Chen, X.G.; Mei, Y.; Song, Q.H. A 3-(2′-nitro vinyl)-4-phenylselenyl coumarin as a fluorescent probe for distinguishing detection of Cys/Hcy and GSH. Dyes Pigm. 2022, 203, 110312. [Google Scholar] [CrossRef]
  40. Lee, J.-T.; Mathur, S.; Shen, S.; Wu, J.M.; Chen, J. MoSe2 Nanoflowers for Highly Efficient Industrial Wastewater Treatment with Zero Discharge. Adv. Sci. 2021, 8, 2102857. [Google Scholar] [CrossRef]
  41. Wu, J.; Wang, Z.; Zhang, S.; Yang, Q.; Li, Z.; Zang, X.; Zhao, X.; Shang, N.; Khaorapapong, N.; Xu, X.; et al. Inorganic-Organic Nanoarchitectonics: MXene/Covalent Organic Framework Heterostructure for Superior Microextraction. Small 2023, 91, 2305730. [Google Scholar] [CrossRef] [PubMed]
  42. Ye, Z.; Xie, S.; Cao, Z.; Wang, L.; Xu, D.; Zhang, H.; Matz, J.; Dong, P.; Fang, H.; Shen, J.; et al. High-rate aqueous zinc-organic battery achieved by lowering HOMO/LUMO of organic cathode. Energy Storage Mater. 2021, 37, 378–386. [Google Scholar] [CrossRef]
  43. Li, H.; Fan, J.; Wang, J.; Tian, M.; Du, J.; Sun, S.; Peng, X. A fluorescent chemodosimeter specific for cysteine: Effective discrimination of cysteine from homocysteine. Chem. Commun. 2009, 39, 5904–5906. [Google Scholar] [CrossRef] [PubMed]
Scheme 1. Illustration of the preparation process and detection policy of the colorimetric ratio sensor.
Chemosensors 12 00080 sch001
Figure 1. (a) Measurements of (A) absorbance silver nanoflakes, (B) silver nanoflakes with L-Cys, (C) silver nanoflakes with 12.5 μM Cr3+, and (D) silver nanoflakes with 12.5 μM Cr3+ and 2.5 μM L-Cys mixture. The inset shows the corresponding solution color of silver nanoflakes. (b) The absorbance and color change of silver nanoflakes with different concentrations of Cr3+; the inset is the corresponding solution color.
Chemosensors 12 00080 g001
Figure 2. TEM image of (a) the formed silver nanoflakes without Cr3+, (b) after the addition of the mixture of Cr3+ and L-Cys, and (c) after the addition of the equivalent concentration of Cr3+. (d) DLS characterization of silver nanoflakes, (e) silver nanoflakes with the addition of Cr3+ and L-Cys, and (f) silver nanoflakes with the addition of the equivalent concentration of Cr3+.
Chemosensors 12 00080 g002
Figure 3. The picture describes the XPS survey scan of silver nanoflakes (a); scanning spectra show major peaks of Ag (b), C (c), and O (d).
Chemosensors 12 00080 g003
Figure 4. Detection of L-Cys in deionized water. (a) There are absorbance changes and (b) color changes when using different concentrations of L-Cys. The linear relationship after adding the L-Cys concentrations of (c) 0–2.5 μM and (d) 0–900 nM.
Chemosensors 12 00080 g004
Figure 5. (a) Absorbance ratios of the silver nanoflakes–chromium (III) ion system in the presence of other amino acids and small biological molecules, and corresponding images (inset); (b) the corresponding anti-interference experiment, where the concentration of L-cys and anti-interferences was 1.6 μM.
Chemosensors 12 00080 g005
Table 1. Comparison of the proposed strategy with other methods for L-Cys determination.
StrategySampleLODRecovery (%)Ref.
β-CD AgNPsHuman urine40 μM95.0–110.0[32]
Screen-printed diamond electrodeBovine plasma0.62 nM86.0–104.0[33]
YFHuman urine59 nM-[34]
CPHuman urine1.10 μM94.3–102.2[35]
NBD-BTCell97.6 nM-[36]
DTRNCell0.09 μM-[37]
NFAFood0.21 μM96.7–101.6[38]
Silver nanoflakes-Cr3+Beer41.2 nM93.8–104.0This work
Silver nanoflakes-Cr3+Human urine41.2 nM93.3–107.1This work
Disclaimer/Publisher’s Note: The statements, opinions and data contained in all publications are solely those of the individual author(s) and contributor(s) and not of MDPI and/or the editor(s). MDPI and/or the editor(s) disclaim responsibility for any injury to people or property resulting from any ideas, methods, instructions or products referred to in the content.

