

Water Use Efficiency in a Deficit-Irrigated Orange Orchard


1
Centro di Ricerca Olivicoltura, Frutticoltura e Agrumicoltura, CREA—Consiglio per la Ricerca in Agricoltura e L’analisi Dell’economia Agraria, Corso Savoia190, 95024 Acireale, CT, Italy
2
Centro di Ricerca Ingegneria e Trasformazioni Agroalimentari, CREA—Consiglio per la Ricerca in Agricoltura e L’analisi Dell’economia Agraria, Via Milano 43, 24047 Treviglio, BG, Italy
3
Centro di Ricerca Ingegneria e Trasformazioni Agroalimentari, CREA—Consiglio per la Ricerca in Agricoltura e L’analisi Dell’economia Agraria, Via Della Pascolare 16, 00015 Monterotondo, RM, Italy
*
Authors to whom correspondence should be addressed.
Horticulturae 2024, 10(5), 498; https://doi.org/10.3390/horticulturae10050498
Submission received: 21 March 2024
/
Revised: 5 May 2024
/
Accepted: 9 May 2024
/
Published: 11 May 2024
(This article belongs to the Special Issue Advancements in Enhancing Water Use Efficiency for Horticultural Crops)
Abstract
:Citrus is a subtropical fruit tree with high water requirements. This study aimed to determine the effects of water deficit on an orange orchard subjected to different water-saving strategies. The study was realised in an orange orchard in a semiarid area by adopting four different water management techniques: 100% crop evapotranspiration (control); SSDI—subsurface sustained deficit irrigation; RDI—regulated deficit irrigation; PRD—partial rootzone drying treatment during five growing seasons. The experimental design foresaw a randomised block design with six replicates per treatment (24 index plants). The results of the study showed that the water-saving strategies reduced irrigation water consumption by 25% (SSDI), 33% (RDI), and 49% (PRD) compared to the fully irrigated treatment without yield reduction, thus increasing water use efficiency. Mineral nutrition of the trees was slightly affected by irrigation treatments; element concentration in leaves was generally in the optimal range; only potassium showed values below the recommended leaf concentrations. Regarding fruit quality parameters, the vitamin C concentration in RDI showed significant differences with a value of 62.7 mg 100 mL−1 compared to 58.5 mg 100 mL−1 in the control. Plants subjected to SSDI and PRD strategies showed increased levels of pulp colour index with significant values of 10 and 9.90, respectively, compared to the control (8.44). By implementing targeted water management, citrus growers could save water and increase the ascorbic acid and sugar concentration in the fruits; anthocyanins also increased but not significantly. These findings open new market opportunities for citrus growers in marginal areas, where they cannot rely solely on producing citrus fruits to remain competitive.
1. Introduction
Citrus is a worldwide-grown fruit tree group of species cultivated in tropical and subtropical areas with proper climate, suitable soil, and sufficient water availability. Italy is one of the leading citrus producers in the Mediterranean area after Spain and Egypt [1]. Farmers in semiarid climate conditions are increasingly interested in enhancing the sustainability of citrus production: the high crop water requirements, particularly during summer [2,3], and the sensitivity of flowering and fruit-set to water stress [4] may affect fruit characteristics (e.g., size, taste and colour), making them unsuitable for consumer acceptance [5].
Water and nitrogen (N) supply are the two main factors limiting the productivity of crops [6], particularly in arid and semiarid regions. Water and N interact strongly in most agricultural conditions, with reductions in water use efficiency (WUE) caused by N deficits and a reciprocal limitation in N use efficiency (NUE) under water deficits [6,7,8].
Therefore, designing an optimal irrigation management plan based on state-of-the-art measuring and modelling tools can effectively contribute to water-saving efforts and potentially address the water scarcity issue in these regions [9].
Sustained deficit irrigation is a watering strategy proposed to improve water productivity and reduce irrigation application [10]. It is a common practice in many areas of the world, especially in dry regions, where maximising crop water productivity is crucial in reducing crop water requirements.
Crop management techniques such as partial rootzone drying (PRD) and regulated deficit irrigation (RDI) aim to enhance water use efficiency in field and fruit crops [11,12,13,14,15,16,17]. PRD involves alternately drying out one part of the root system while keeping the other part moist and then switching the irrigation between these root portions after a set interval [18]. This method can significantly decrease water use, foster crop vigour, and sustain yields in comparison to traditional irrigation methods [19]. When using PRD, the roots exposed to dry soil produce the root chemical signal of drying (abscisic acid—ABA), while the other part of the roots in wet soil maintain the water supply so that leaves are kept hydrated [20]. The impact of PRD has been extensively investigated in grapevine crops [21,22] and, to a lesser extent, in other woody crops. Concerning citrus, the limited available data on PRD effects focus more on the water volume reduction than the PRD effect on yield and fruit size [23,24,25]. RDI applies water stress to control plant growth and the competition between vegetative growth and fruit production within the plant system [26]. Plants’ responses to water stress vary at different growth stages; less irrigation applied to the crop at noncritical stages does not affect normal plant production. However, during critical periods of the growth cycle, irrigation provides the total water required by the crop to ensure that the yield and fruit quality are not adversely affected [27].
Subsurface drip irrigation is a water-saving method that enhances the efficiency of orchard systems. This technology involves applying water directly to the root zone below the soil surface. By doing so, evaporation is minimized, and water is saved, resulting in higher water application efficiency. [28,29,30,31]. This irrigation strategy may also supply reduced water amounts: in this study, such a water-saving technique is hereafter referred to as subsurface sustained deficit irrigation (SSDI). Observations on tree adaptability to subsurface drip irrigation demonstrate that water restrictions do not affect physiologic indicators, yield, or fruit quality [30].
The ability of crop plants to survive and maintain productivity under environmental stress largely depends on their adaptive mechanisms in avoiding or tolerating stress. Research has shown that the mineral nutritional status of plants plays a significant role in their ability to adapt to adverse environmental conditions [32].
Water-saving techniques do not impair soil conditions; meanwhile, they increase soil microorganisms and make more nitrogen available for plants [33]. Thus, water-saving irrigation strategies are promising field management practices for improving water use efficiency (WUE) and nutrient use efficiency (NUE) in water-limiting environments [34,35,36,37]. Furthermore, PRD significantly increases the soil inorganic N available for plant growth in a low-input organic farming system, where slow N supply from the decomposition of organic manure is often a significant constraint for crop yield [33]. Implementing PRD may stimulate organic N mineralisation, thus improving crop N nutrition and yield [38].
Many studies have shown that using deficit irrigation methods for growing citrus, nut trees, and vines [17,19,39,40,41,42] can lead to better water utilization and the improved maintenance of adequate crop yield [43,44]; however, to the best of our knowledge, there is a need for studies with a focus on how these techniques affect the quality of the fruits.
This study investigates the impacts of different deficit irrigation (DI) treatments (i.e., SSDI, RDI, and PRD) on an orange orchard in a semiarid region. The objective is to find ways to conserve water and enhance fruit yield and quality. The study focuses on the connection between nutraceutical compounds and water use efficiency. Additionally, it assesses the effects of DI treatments on the nutritional status of plants.
2. Materials and Methods
2.1. Site Description and Climatic Data
The experiment lasted five consecutive growing seasons (2013–2018) in an orange orchard of the Council for Agricultural Research and Economics, Research Center Olive, Fruit and Citrus Crops (CREA-OFA), located in Lentini (SR, Italy; 37°20′ N, 14°53′ E, 54 m above sea level). The orange trees [Citrus sinensis (L.) Osbeck] cv ‘Tarocco Sciara C1882′ grafted on Carrizo citrange rootstock [Poncirus trifoliata (L.) Raf. × C. sinensis (L.) Osbeck] were planted in 2010 with a 6 m × 4 m tree spacing. The region has a typically hot Mediterranean summer climate, classified as Csa in the updated Köppen–Geiger climate classification [45]. Summers are warm and dry. An automatic weather station installed in the experimental orchard (Vantage Pro 2, Davis Instruments Corporation, Hayward, CA, USA) logged hourly the climatic parameters, including global radiation, relative humidity, wind speed and direction, and air temperature. Between 2013 and 2017, the maximum air temperature reached 41 °C, while the average relative humidity was 90%. During this period, the cumulative reference evapotranspiration (ET0) measured 4512.2 mm, the crop evapotranspiration (ETc) was 2827.4 mm, and the rainfall was 777.4 mm (Figure 1).
2.2. Experimental Design
The experimental design consisted of three DI treatments compared to a fully irrigated control in a randomised block (about 600 m2 each) design with three replicates: each plot consisted of three rows of 8 trees per row for a whole of 24 plants. In each elemental plot, two trees were monitored over time (index trees) for plant physiology, nutrition, production, and fruit quality parameters.
The four irrigation treatments were: (T1) control irrigation, delivering 100% of crop evapotranspiration (ETc); (T2) subsurface sustained deficit irrigation treatment (SSDI), delivering about 75% of T1; (T3) regulated deficit irrigation (RDI), delivering on different phenological stages; (T4) partial rootzone drying (PRD), delivering about 50% of T1. In RDI trees, the irrigation amount was at 50% ETc from mid-July till the end of August; during the remainder of the year, RDI provided water at 100% ETc. In PRD trees, the wet and dry sides of the rootzone were switched every 2 weeks.
Trees from T1, T3, and T4 were drip-irrigated using two surface lateral pipes per tree row, with six 4 L h−1 emitters (spaced 0.6 m) per tree; those in the T2 treatment had two subsurface lateral pipes (buried 0.35 m from the soil surface), emitting a total of 6 L h−1. The self-compensating drips were mounted in a 16 mm section pipe with a thickness of 0.9 mm. The drips spaced 0.6 m at 4 L h−1 allowed the linear flow of 6.4 L m h−1, commonly used in orange orchards. Lateral pipes in T1, T3, and T4 were located 0.50 m apart from the trunk. This irrigation system allowed operating at low pressures with significant energy savings [46].
The weather conditions at the experimental site (global radiation, relative humidity, wind speed and direction, air temperature) were logged hourly using an automatic weather station installed 40 m from the experimental orchard and surrounded by grass. The data were used to calculate daily reference evapotranspiration (ET0) through the Penman–Monteith equation [47]. During June–October of 2013, irrigation was scheduled weekly, and water was applied twice weekly in the early morning. In the consecutive years, the irrigation frequency was increased to three times per week to contain the negative values of stem water potential registered in the previous year of trial (i.e., −2.6 MPa). The amounts of water provided (Table 1) were measured with in-line water meters; manometers also checked the water pressure regime. The soil of the experimental plot was Typic Haplustept [48,49] with a sandy–loam texture (69.7% sand, 10.5% clay, 19.8% silt), a total organic carbon of 1.25%, a sub-alkaline pH value (7.8), and a high cation exchange capacity (65 meq 100 g dry soil). The average field capacity and the soil wilting point were 0.39 m3 m−3 and 0.24 m3 m−3, respectively. Agronomic practices included weed control by herbicides within the tree rows and weed mowing between them. Irrigation water had an electrical conductivity of 2.02 dS m−1 (at 25 °C) and a pH of 7.30. The fertiliser inputs were uniform in all plots and carried out according to best practices; they ranged over the years by 120 kg ha−1 of N, 50 kg ha−1 of P2O5, and 100 kg ha−1 of K2O, with one half applied in early spring; the rest was fractioned into three fertigation applications during the irrigation season. The comparison of each water treatment (T2–T4) with the reference (T1) resulted in the calculation of the percentage water savings (WS) according to Equation (1):
where i = 2, 3, 4.
2.3. Tree Monitoring
Stem water potential (SWP) was measured every two weeks during the irrigation season at solar midday with a pressure chamber (SKPM 1405/40, Skye Instruments, Llandrindod Wells, UK). Measurements were carried out on three leaves per treatment, enclosed in plastic bags covered with silver foil for at least 1 h before the measurements.
The leaf area index (LAI) (m2 m−2) was measured with a ceptometer (AccuPAR LP-80, Decagon Devices Inc., Pullman, WA, USA), and the stomatal conductance (gs, mmol m−2 s−1) was measured with a leaf porometer (Leaf Porometer, Decagon Devices Inc., Pullman, WA, USA). All porometry measurements were conducted between 11:00 and 13:00 a.m. on six fully exposed leaves per tree, two trees per plot.
2.4. Mineral Concentration Determination
In the experiment, twenty-four trees were selected for plant nutrient status detection by foliar analysis (performed on 15 leaves per tree). During October of each year, 5–7-month-old leaves of the spring flush were collected from non-fruiting twigs on the external side of the tree canopy, as outlined by Embleton et al. [50], and adapted to Italian conditions by Intrigliolo et al. [51]. Indirect chlorophyll concentration measurements were performed with a SPAD-502 (Konica Minolta, Milan, Italy). Chemical analyses were carried out on the same leaves to detect the following elements: nitrogen (N), phosphorous (P), potassium (K), calcium (Ca), magnesium (Mg), iron (Fe), zinc (Zn), and manganese (Mn). Leaves were (i) washed in tap water by rubbing both sides using cheesecloth, (ii) rinsed in de-ionised water, (iii) oven-dried at 65 °C for 72 h, (iv) ground, and (v) dried at 105 °C for 4 h. The concentration of N was determined on 1 g of dried leaf tissue using the micro-Kjeldahl method (Distillation Unit K370, Büchi Analytical Inc., Flawil, St. Gallen, Switzerland). Another 1 g of sample leaf tissue was reduced to ashes in a muffle furnace at 550 °C for 12 h. After incineration and extraction with nitric acid (1% v/v), P, K, Ca, Mg, Fe, Zn, Mn, and Cu were determined using inductive coupled plasma–optical emission spectrometry (ICP-OES; OPTIMA 2000DV, Perkin–Elmer, Milano, Italy).
2.5. Yield and Fruit Quality Determination
The yield and number of fruits per tree were determined at the time of commercial harvest, and ten fruits per tree (treatment × replication) were analysed to assess the quality of the fruits. The equatorial and polar sections of the fruits were measured using caliper tape. Fruit firmness, weight, peel thickness, titratable acidity, and total soluble solids were also determined.
The fruit quality analyses followed the standard procedures described by Kimball [52]. The fruits were weighed, squeezed using a juice machine, and the juice was filtered. Afterwards, a temperature-compensated digital refractometer (Atago RX5000, ATAGO Co. Ltd, Tokyo, Japan) was used to determine the juice’s total soluble solids content (TSS). The juice’s titratable acidity (TA) was measured through titration with 0.1 N NaOH. The maturity index (MI; dimensionless—dmnl) was calculated as the ratio of TSS (° Brix) and TA (% citric acid). Anthocyanin determination occurred per the pH differential method [53] and was expressed as cyanidin 3-glucoside equivalents (mg L−1).
Fruit colour analyses were carried out on skin and fruit pulp with a portable spectrophotometer (CM-2550d, Konica Minolta Italia). The external colour index (CI) was determined as follows:
where a* is for green–red (a* = red; −a* = green); L is the lightness (L = 0, black; L = 100, white); b* is for the blue–yellow chromaticity coordinates (b* = yellow; −b* = blue). WUE was calculated as the total yield produced per unit of irrigation applied plus effective rainfall (kgfresh weight m−3), and the total of bioactive compounds (TSS, TA, anthocyanin) produced per unit of water used by the plant (g m−3).
2.6. Statistical Analysis
Data underwent statistical processing using the Jamovi, version 2.2 software [54], based on the “R” statistical suite of codes [55]. Data processing foresaw the calculation of the descriptive statistics for each treatment (mean ± standard deviation) and, to evaluate the statistically significant differences among the treatments, data underwent analysis of variance (ANOVA) followed by post hoc multiple comparisons (Tuckey HSD test—p < 0.05) using the general linear model procedure [56] considering the irrigation treatments and the years of monitoring as fixed factors; meanwhile, the LAI, the mineral contents of the leaves, the yield, and the quality parameters of fruits served as dependent variables in the study.
3. Results and Discussion
3.1. Applied Water for Irrigation Treatments
Table 1 reports the irrigation water amounts provided to plants. On average, the provided amounts were 258.4, 194.1, 170.2, and 131.5 mm in T1, T2, T3, and T4, with remarkable differences among the treatments compared to T1, which was considered the control (Table 1).
The DI treatments allowed for achieving water savings of 25, 33, and 49%, respectively, on average compared to the control treatments. Among the T2, T3, and T4 treatments, the PRD treatment resulted in the highest water savings (49% on average for the five seasons). On average, the DI strategy promoted significant increases in irrigation water productivity. However, severe and prolonged plant water stress might impair tree performance, reducing the economic return.

Table 1.
Amounts of irrigation water provided for each treatment (mm) and the related percentage of water savings (WS).
Table 1.
Amounts of irrigation water provided for each treatment (mm) and the related percentage of water savings (WS).
| Years | T1 | T2 | WS2 | T3 | WS3 | T4 | WS4 |
|---|---|---|---|---|---|---|---|
| 2013–2014 | 259 | 191 | 26.5 | 159 | 38.8 | 109 | 57.9 |
| 2014–2015 | 266 | 195 | 26.8 | 157 | 41.0 | 111 | 58.5 |
| 2015–2016 | 279 | 204 | 26.8 | 174 | 37.6 | 158 | 43.4 |
| 2016–2017 | 279 | 213 | 23.7 | 198 | 29.0 | 155 | 44.5 |
| 2017–2018 | 209 | 168 | 19.5 | 163 | 21.9 | 126 | 39.9 |
| Average | 258 | 194 | 24.6 | 170 | 33.6 | 131 | 48.8 |
3.2. Stem Water Potential and Stomatal Conductance
Figure 2 reports the midday stem water potential (Ψstem) and the stomatal conductance (gs) for various days of the year (DOYs) during the trial. The minimum Ψstem of −2.56 MPa occurred in the PRD treatment (T4) measured on the 221st DOY, 2013 (Figure 2a), in a period when the soil water content reached the maximum depletion from the field capacity condition (Figure 2b). In the same trial timeframe, even the control treatment (T1) resulted in a similar Ψstem value; this indicates the existence of factual water limitation as well, even though T1 underwent maximum rate irrigation. Such a drop of Ψstem might result from the adopted irrigation timing (i.e., two irrigations per week) during the hottest months of 2013, which did not allow plants to rehydrate. Since 2014, supplying water three days a week made it possible to maintain the stem potential at optimal levels in all treatments and reduce water stress.
The values of Ψstem obtained in 2015 in RDI treatments ranged from −2.0 to −2.6 MPa (Figure 2e). The Ψstem measurements encompass the severity of the water stress that the trees experienced and the duration of such a stressful situation. In all the treatments, the stomatal conductance values, gs, of fully sunny leaves ranged between mild stress and stressed conditions (Figure 2b for 2013 and Figure 2d for 2014), which is typical for orange trees. In most cases, the lowest gs values match the minimum Ψstem values [2].
Many environmental factors influencing stomatal conductance are well described in citrus. In this work, gs values were similar to those of other crops and citrus trees, meaning that low stomatal conductance restricts water use [2]. Following the summer rains, the observed gs values rise around DOY 230 in 2015, 2016, and 2017 (Figure 2f,h,j). In citrus, other authors observed fluctuations in gs and Ψstem in response to water restrictions [37,43,44]. The evolution of these two variables responds to the time and intensity of water shortage at different phenological periods. The results demonstrate that both Ψstem and gs serve as indicators of the cumulative effects of water stress [27].
3.3. Leaf Area Index
Table 3 reports the LAI averages (m2 m−2) recorded in each year of the trial. There is no treatment effect for LAI, only a difference in the 2017 irrigation period. The 2017–2018 season is the only one in which the LAI value differs significantly (p < 0.05); this is, on average, lower than the others by 27.6 ± 5.6%.
LAI is an indispensable parameter in radiative transfer canopy models and is essential for accurately predicting photosynthetic productivity by crop growth models. LAI is used for monitoring change detection in canopy structure due to biotic or abiotic stresses [61]. Consequently, in intensive orchard systems, accurate LAI estimates contribute to better management of pruning and precision farming [62].
3.4. Mineral Concentration of Leaves
3.4.1. Nitrogen
Leaf N concentration ranged between 25.88 ± 2.16 and 27.56 ± 3.37 g kg−1d.w. Trees with the SSDI and RDI protocols resulted in the lowest and the highest foliar nitrogen concentrations that did not differ significantly from the control and PRD ones (Table 4). The N concentration differed significantly between 2013–2014 and 2014–2015, but in the following years, no significant differences were noticed (Table 4).
The measured concentrations are in line with the 2–6% dry weight ranges found by Jones [63] and Munson [64] and with the 25–27 g kg−1d.w. optimum range [65] that Alva et al. [66,67] reported for similar N and K fertilisation rates administered to ‘Hamlin’ orange trees. Such concentrations usually correlate with photosynthetic capacity and yield [68]; however, the treatments that plants underwent did not have any effect on the SPAD readings that were almost constant, being 77.9 ± 4.41 and 77.6 ± 4.13 SPAD units for T2 and T3.
3.4.2. Phosphorus
Irrigation and the year of monitoring did not significantly affect the leaf phosphorus concentration. The values in Table 5 are in line with the reported 0.10–0.15% dry matter range of P in citrus leaves [65]. Commonly, phosphorus deficiency occurs if leaf P is less than 0.09 percent. Appropriate P management is important not only for higher crop yield but also for environmental protection. Baral [69] reported values of foliar P in the 0.19–0.22% range for healthy mandarin trees compared to higher values occurring in unhealthy plants. Based on the observed leaf P concentration, varying the irrigation did not induce any stress in the studied plants for the considered years. In ordinary conditions, soil properties (soil organic matter content, clay content, and cations exchange capacity) affect the quantity and the distribution of plant-available P in the orchard soils.
3.4.3. Potassium
Potassium is ubiquitous in the soil–plant system and is unique among the essential plant nutrients in its multifunctional contribution to plant metabolic processes. Moreover, it also regulates the water economy of the trees and greatly increases citrus yield, not in number but in fruit size [70,71]. The extreme mobility of potassium within the plant system is mainly responsible for the failure to associate it with specific functions.
The observed K concentration values in the foliar tissue ranged between 2.36 and 9.38 g kg−1d.w. (Figure 3). The significant interaction of irrigation treatments and the year significantly affected the concentrations of this element, making it impossible to assess specifically the effect of the irrigation treatments. The lowest K foliar concentration was 3.95 ± 0.46 g kg−1d.w. (T3, Year 2016–2017), while the highest K concentration (7.15 ± 1.55 g kg−1d.w.) occurred for T1 during 2014–2015. However, considering the sole effect of the treatment on this element, T1 showed the highest average concentration (5.89 ± 1.70 g kg−1d.w.), while plants subjected to T3 had the lowest potassium concentrations (4.44 ± 0.86 g kg−1d.w.). Such values are below the recommended K leaf concentrations in the 1.0–1.55% dry matter range [71] and even lower than the more comprehensive ranges recommended by Srivastava (0.99–2.59%) [72] and Intrigliolo et al. (0.7–1.1%) [51]. Different parameters, including soil properties, plant variety, maximum production, and climate, can affect the amounts of K necessary for fruit production [73].
3.4.4. Calcium and Magnesium
Ca concentration ranged from 48.2 ± 4.29 g kg−1d.w. to 56.5 ± 2.41 g kg−1d.w. Year and treatment did not significantly affect calcium concentration inside the plants, which is in line with its scarce mobility in the plant–soil system. However, magnesium was significantly affected by the year and the treatment. T4 resulted in the highest Mg concentration, 11.1 ± 1.0% higher than the other three. The effect of the year, albeit significant, showed the highest significant Mg concentration in the year 2016–2017 (5.30 ± 0.80), while the year 2013–2014 recorded the lowest (4.29 ± 0.39) (Figure 4).
3.4.5. Iron, Zinc, Manganese, and Copper
Iron and zinc concentrations in plant leaves were not affected by the treatments. However, the year resulted in having a significant effect on their concentrations in plant tissues: the year 2013–2014 had the highest iron concentration (133.8 ± 13.1 mg kg−1d.w.), while the year 2016–2017 was the one where the zinc concentration in leaves was the highest (65.9 ± 10.3 mg kg−1d.w.).
Manganese and copper concentrations were affected significantly by the irrigation treatments. Mn resulted significantly higher in T2 and T3 (Table 6), while plants subjected to T1 and T4 resulted in higher copper concentrations (Table 7).
Irrigation treatments induced some statistical differences in the mineral nutrition of the trees. Nitrogen concentration in leaves was optimal for all treatments, even though SSDI treatment showed a significantly higher value than RDI. Phosphorus, calcium, iron, and zinc concentrations in leaves were not affected by irrigation treatments and were all in line with optimal reference values. Potassium concentrations in leaf tissues were consistently below the optimal level or at its lower range [50], as found in commercial citrus orchards in Israel [74], with a significant reduction in the RDI treatment. Accordingly, magnesium leaf concentration was higher in RDI-treated trees than in other irrigation treatments. Mn leaf concentration was higher in SSDI and RDI compared to control and PRD treatments; the opposite trend was noticed for copper leaf concentrations.
3.5. Yield and Fruit Quality
The PRD treatment significantly affected the weight per fruit: full irrigation (T1) trees showed fruits weighing 277.3 ± 34 g on average, significantly more than fruits from plants subjected to partial rootzone drying treatment (249.9 ± 33.6 g). However, the treatments did not affect plant production (t ha−1) (Figure 5). This result agrees with other studies on citrus trees in which water savings did not affect yield [75,76].
As recorded for the yield (t ha−1), the irrigation treatment did not significantly affect plant vigour, canopy volume, trunk diameter, or circumference (data not reported).
T3 and T4 showed a significant increase in the TSS (about +6.0%) compared to T1 and T2 (Table 8). The same trend was observed for total acidity. T2 fruits had the lowest juice yield, while T3 showed the highest C vitamin concentration in fruits.
The pulp colour index was significantly higher in trees subjected to T2 and T4 treatments (about +13%), while T1 fruits had a higher equatorial diameter than T3 and T4 (Table 8). Pulp colour is correlated with the carotenoid composition of the fruit [77]: increments in the pulp colour index and fruit size are external quality attributes that positively affect fruit quality, influencing consumer perception [78,79].
The maturity index (MI) values in the RDI and PRD treatments were similar to that of the full-irrigated control. This can be considered to be a positive outcome, since a delay in fruit ripening has the commercial advantage of increased market price following the late picking up in the season. Previous studies on citrus have also reported this drop in the MI in deficit-irrigated trees [43,80].
However, regarding water use efficiency, some quality parameters highlighted the increase in the production efficiency that citrus plants experienced, as follows.
The treatment and year affected the TA content related to the amount of administered water (g m−3) (Figure 6). The highest significant efficiency belonged to the T4 treatment (122.0 ± 51.9 g m−3); T3 differed significantly from T4 and T1, while T2 was not significantly different from T3 and T1, which had the lowest significant efficiency (50.1 ± 23.5 g m−3). The effect of the year resulted in a significant difference between 2013 and 2014; however, such an effect did not mask the effect of the treatment.
The total soluble solids (TSSs) yield showed a similar trend. They were significantly affected by both the treatment and the year. Again, T4 was the watering procedure with the highest efficiency (957.2 ± 341.1 g m−3), followed by T3; T1 and T2 were those with the lowest efficiency (Figure 7).
Anthocyanins’ content related to the amount of water administered was not affected by the treatment, the year, or the interaction among them. Despite this, our results indicate an increase in the anthocyanin content for all the DI treatments, which was 1.4 to 1.9 times higher than the control (Table 8). The related water use efficiency increased by 2.4 to 4.5 times compared to the control (Figure 8).
For vitamin C (Figure 9), treatment and year had separate significant effects. The chart shows that T4 recorded the highest significant efficiency (49.2 ± 15.0 g m−3), followed by T3. T1 and T2 did not differ between them. The year 2017–2018 recorded the highest efficiency, while the lowest belonged to fruits collected in 2013–2014.
4. Conclusions
Precise monitoring of meteorological data and Ψstem (related to plant physiology) make it possible to reduce irrigation water amounts significantly. This allowed for an increase in the water use efficiency of fruit yield, TSS, TA, and vitamin C. SSDI and RDI showed a remarkable water-saving effect during the citrus irrigation season compared to the control. PRD proved to be a remarkable water-saving technique with improved quality and quantity of fruits, even with a significant reduction in fruit size (−9.9%), significantly increasing Mg leaf concentration (+11.5%). Irrigation treatments induced some statistical differences in the mineral nutrition of the trees without apparent agronomic effects. The targeted water resource management also increased concentrations of specific nutraceutical compounds (anthocyanins, ascorbic acid, sugars) in the fruits. Therefore, besides the savings resulting from the reduced use of water, DI may be beneficial for the economy of Mediterranean citrus farmers due to the increased levels of vitamin C, anthocyanin, and TSS that could leverage new market possibilities, thus enabling plots located in marginal areas to become competitive on the market.
However, future site-specific studies are required to assess the optimal duration of DI strategies to achieve the best economic results for citrus growers facing the current change in climatic conditions and the evolution of the citrus industry.
Author Contributions
Conceptualisation, F.S., M.B., A.A. and G.R.; methodology, F.S. and G.R.; formal analysis and data processing, M.B.; investigation, F.S. and G.R.; resources, M.B., A.A. and G.R.; data curation, F.S. and M.B.; writing—original draft preparation, F.S.; writing—review and editing, F.S., M.B. and G.R.; supervision, G.R.; funding acquisition, A.A. and G.R. All authors have read and agreed to the published version of the manuscript.
Funding
This research received no external funding. The APC was funded by the BIOFOSF-CUBE Project (MiPAAF PQAI 01 grant N 0153234 of 04/04/2022).
Data Availability Statement
Data are contained within the article.
Acknowledgments
Authors acknowledge Biagio Torrisi and Maria Allegra for technical support in field and lab work.
Conflicts of Interest
The authors declare no conflicts of interest.
References
- USDA. Citrus: World Markets and Trade; USDA: Washington, DC, USA, 2023. [Google Scholar]
- Carr, M.K.V. The Water Relations and Irrigation Requirements of Citrus (Citrus Spp.): A Review. Exp. Agric. 2012, 48, 347–377. [Google Scholar] [CrossRef]
- Kourgialas, N.N.; Karatzas, G.P. A Modeling Approach for Agricultural Water Management in Citrus Orchards: Cost-Effective Irrigation Scheduling and Agrochemical Transport Simulation. Environ. Monit. Assess. 2015, 187, 462. [Google Scholar] [CrossRef]
- Ginestar, C.; Castel, J.R. Responses of Young Clementine Citrus Trees to Water Stress during Different Phenological Periods. J. Hortic. Sci. 1996, 71, 551–559. [Google Scholar] [CrossRef]
- Giménez-Sanchis, A.; Zhong, K.; Pintor, A.; Farina, V.; Besada, C. Understanding Blood versus Blond Orange Consumption: A Cross-Cultural Study in Four Countries. Foods 2022, 11, 2686. [Google Scholar] [CrossRef]
- Sinclair, T.R.; Rufty, T.W. Nitrogen and Water Resources Commonly Limit Crop Yield Increases, Not Necessarily Plant Genetics. Glob. Food Sec. 2012, 1, 94–98. [Google Scholar] [CrossRef]
- Gonzalez-Dugo, V.; Durand, J.-L.; Gastal, F. Water Deficit and Nitrogen Nutrition of Crops. A Review. Agron. Sustain. Dev. 2010, 30, 529–544. [Google Scholar] [CrossRef]
- Sadras, V.O.; Hayman, P.T.; Rodriguez, D.; Monjardino, M.; Bielich, M.; Unkovich, M.; Mudge, B.; Wang, E. Interactions between Water and Nitrogen in Australian Cropping Systems: Physiological, Agronomic, Economic, Breeding and Modelling Perspectives. Crop Pasture Sci. 2016, 67, 1019–1053. [Google Scholar] [CrossRef]
- Kourgialas, N.N.; Koubouris, G.C.; Dokou, Z. Optimal Irrigation Planning for Addressing Current or Future Water Scarcity in Mediterranean Tree Crops. Sci. Total Environ. 2019, 654, 616–632. [Google Scholar] [CrossRef] [PubMed]
- English, M.; Raja, S.N. Perspectives on Deficit Irrigation. Agric. Water Manag. 1996, 32, 1–14. [Google Scholar] [CrossRef]
- Lez-Altozano, P.G.; Castel, J.R. Regulated Deficit Irrigation in ‘Clementina de Nules’ Citrus Trees. I. Yield and Fruit Quality Effects. J. Hortic. Sci. Biotechnol. 1999, 74, 706–713. [Google Scholar] [CrossRef]
- Intrigliolo, D.S.; Bonet, L.; Nortes, P.A.; Puerto, H.; Nicolas, E.; Bartual, J. Pomegranate Trees Performance under Sustained and Regulated Deficit Irrigation. Irrig. Sci. 2013, 31, 959–970. [Google Scholar] [CrossRef]
- Boland, A.M.; Jerie, P.H.; Mitchell, P.D.; Goodwin, I.; Connor, D.J. Long-Term Effects of Restricted Root Volume and Regulated Deficit Irrigation on Peach: II. Productivity and Water Use. J. Am. Soc. Hortic. Sci. 2000, 125, 143–148. [Google Scholar] [CrossRef]
- Kang, S.; Liang, Z.; Hu, W.; Zhang, J. Water Use Efficiency of Controlled Alternate Irrigation on Root-Divided Maize Plants. Agric. Water Manag. 1998, 38, 69–76. [Google Scholar] [CrossRef]
- Orgaz, F.; Testi, L.; Villalobos, F.J.; Fereres, E. Water Requirements of Olive Orchards–II: Determination of Crop Coefficients for Irrigation Scheduling. Irrig. Sci. 2006, 24, 77–84. [Google Scholar] [CrossRef]
- Stagno, F.; Intrigliolo, F.; Consoli, S.; Continella, A.; Roccuzzo, G. Response of Orange Trees to Deficit Irrigation Strategies: Effects on Plant Nutrition, Yield, and Fruit Quality. J. Irrig. Drain. Eng. 2015, 141, 04015014. [Google Scholar] [CrossRef]
- Fereres, E.; Soriano, M.A. Deficit Irrigation for Reducing Agricultural Water Use. J. Exp. Bot. 2006, 58, 147–159. [Google Scholar] [CrossRef] [PubMed]
- Kriedemann, P.E.; Goodwin, I. National Program for Sustainable Irrigation (Australia). In Regulated Deficit Irrigation and Partial Rootzone Drying: An Overview of Principles and Applications; Land & Water Australia: Canberra, Australia, 2003; ISBN 0642760896. [Google Scholar]
- Kang, S.; Zhang, J. Controlled Alternate Partial Root-Zone Irrigation: Its Physiological Consequences and Impact on Water Use Efficiency. J. Exp. Bot. 2004, 55, 2437–2446. [Google Scholar] [CrossRef] [PubMed]
- Martin-Vertedor, A.I.; Dodd, I.C. Root-to-Shoot Signalling When Soil Moisture Is Heterogeneous: Increasing the Proportion of Root Biomass in Drying Soil Inhibits Leaf Growth and Increases Leaf Abscisic Acid Concentration. Plant Cell Environ. 2011, 34, 1164–1175. [Google Scholar] [CrossRef] [PubMed]
- Dry, P.R.; Loveys, B.R.; Düring, H. Partial Drying of the Rootzone of Grape. II. Changes in the Pattern of Root Development. Vitis 2000, 39, 9–12. [Google Scholar]
- Stoll, M.; Loveys, B.; Dry, P. Hormonal Changes Induced by Partial Rootzone Drying of Irrigated Grapevine. J. Exp. Bot. 2000, 51, 1627–1634. [Google Scholar] [CrossRef]
- Eliades, G.; Georgiu, A.; Papadopoulos, I. Effect of Conventional Irrigation and Alternate Rootzone Drying with Sufficient or Deficient Irrigation Water on the Production of Marsh Seedless Grapefruit. Agric. Mediterr. 2004, 134, 178–184. [Google Scholar]
- Treeby, M.T.; Henriod, R.E.; Bevington, K.B.; Milne, D.J.; Storey, R. Irrigation Management and Rootstock Effects on Navel Orange [Citrus sinensis (L.) Osbeck] Fruit Quality. Agric. Water Manag. 2007, 91, 24–32. [Google Scholar] [CrossRef]
- Consoli, S.; Stagno, F.; Vanella, D.; Boaga, J.; Cassiani, G.; Roccuzzo, G. Partial Root-Zone Drying Irrigation in Orange Orchards: Effects on Water Use and Crop Production Characteristics. Eur. J. Agron. 2017, 82, 190–202. [Google Scholar] [CrossRef]
- Behboudian, M.H.; Mills, T.M. Deficit Irrigation in Deciduous Orchards. In Horticultural Reviews; Janick, J., Ed.; John Wiley & Sons, Inc.: Oxford, UK, 2010; pp. 105–131. [Google Scholar]
- García-Tejero, I.; Romero-Vicente, R.; Jiménez-Bocanegra, J.A.; Martínez-García, G.; Durán-Zuazo, V.H.; Muriel-Fernández, J.L. Response of Citrus Trees to Deficit Irrigation during Different Phenological Periods in Relation to Yield, Fruit Quality, and Water Productivity. Agric. Water Manag. 2010, 97, 689–699. [Google Scholar] [CrossRef]
- Camp, C.R. Subsurface Drip Irrigation: A Review. Trans. ASAE 1998, 41, 1353–1367. [Google Scholar] [CrossRef]
- Phene, C.J. Subsurface Drip Irrigation Increased Yield, Quality and Water Use Efficiency of Alfalfa. Available online: https://sswm.info/sites/default/files/reference_attachments/PHENE%202004%20Subsurface%20Irrigation.pdf (accessed on 25 May 2023).
- Romero, P.; Botia, P.; Garcia, F. Effects of Regulated Deficit Irrigation under Subsurface Drip Irrigation Conditions on Vegetative Development and Yield of Mature Almond Trees. Plant Soil 2004, 260, 169–181. [Google Scholar] [CrossRef]
- Consoli, S.; Stagno, F.; Roccuzzo, G.; Cirelli, G.L.; Intrigliolo, F. Sustainable Management of Limited Water Resources in a Young Orange Orchard. Agric. Water Manag. 2014, 132, 60–68. [Google Scholar] [CrossRef]
- Bhattacharya, A. Mineral Nutrition of Plants Under Soil Water Deficit Condition: A Review. In Soil Water Deficit and Physiological Issues in Plants; Springer: Singapore, 2021; pp. 287–391. [Google Scholar]
- Chen, Y.; Zhang, J.-H.; Chen, M.-X.; Zhu, F.-Y.; Song, T. Optimizing Water Conservation and Utilization with a Regulated Deficit Irrigation Strategy in Woody Crops: A Review. Agric. Water Manag. 2023, 289, 108523. [Google Scholar] [CrossRef]
- Lynch, J. The Role of Nutrient-Efficient Crops in Modern Agriculture. J. Crop Prod. 1998, 1, 241–264. [Google Scholar] [CrossRef]
- Alva, A.K.; Mattos, D.; Quaggio, J.A. Advances in Nitrogen Fertigation of Citrus. J. Crop Improv. 2008, 22, 121–146. [Google Scholar] [CrossRef]
- Steduto, P.; Hsiao, T.C.; Fereres, E.; Raes, D. FAO Irrigation and Drainage Paper 66, Crop Yield Response to Water; FAO: Rome, Italy, 2012. [Google Scholar]
- Puig-Sirera, A.; Provenzano, G.; González-Altozano, P.; Intrigliolo, D.S.; Rallo, G. Irrigation Water Saving Strategies in Citrus Orchards: Analysis of the Combined Effects of Timing and Severity of Soil Water Deficit. Agric. Water Manag. 2021, 248, 106773. [Google Scholar] [CrossRef]
- Wang, Y.; Liu, F.; Andersen, M.N.; Jensen, C.R. Improved Plant Nitrogen Nutrition Contributes to Higher Water Use Efficiency in Tomatoes under Alternate Partial Root-Zone Irrigation. Funct. Plant Biol. 2010, 37, 175–182. [Google Scholar] [CrossRef]
- Fereres, E.; Goldhamer, D.A.; Parsons, L.R. Irrigation Water Management of Horticultural Crops. HortScience 2003, 38, 1036–1042. [Google Scholar] [CrossRef]
- Naor, A. Irrigation Scheduling and Evaluation of Tree Water Status in Deciduous Orchards. In Horticultural Reviews; Janick, J., Ed.; John Wiley & Sons, Inc.: Oxford, UK, 2006; pp. 111–165. [Google Scholar]
- Stagno, F.; Giuffrida, A.; Intrigliolo, F.; Germanà, C.; Continella, A. Prediction of Water Status by Means of an Empirical Model in Orange Bearing Trees. Acta Hortic. 2011, 889, 339–345. [Google Scholar] [CrossRef]
- Ruiz-Canales, A.; Melián-Navarro, A.; Sacristán-Beltrí, E.; Puerto-Molina, H.; Molina-Martínez, J.M. Irrigation Scheduling Systems Based on Water Content Gauges for Citrus Trees-Some Data of Several Case Studies in the Southeast of Spain. Acta Hortic. 2011, 889, 537–541. [Google Scholar] [CrossRef]
- Ballester, C.; Castel, J.; Intrigliolo, D.S.; Castel, J.R. Response of Navel Lane Late Citrus Trees to Regulated Deficit Irrigation: Yield Components and Fruit Composition. Irrig. Sci. 2013, 31, 333–341. [Google Scholar] [CrossRef]
- Gonzalez-Altozano, P.; Castel, J.L. Effects of Regulated Deficit Irrigation on ‘Clementina de Nules’ Citrus Trees Growth, Yield and Fruit Quality. Acta Hortic. 2000, 537, 749–758. [Google Scholar] [CrossRef]
- Peel, M.C.; Finlayson, B.L.; Mcmahon, T.A. Updated World Map of the Köppen-Geiger Climate Classification. Hydrol. Earth Syst. Sci. 2007, 11, 1633–1644. [Google Scholar] [CrossRef]
- Carroquino, J.; Dufo-López, R.; Bernal-Agustín, J.L. Sizing of Off-Grid Renewable Energy Systems for Drip Irrigation in Mediterranean Crops. Renew. Energy 2015, 76, 566–574. [Google Scholar] [CrossRef]
- Allen, R.G.; Pereira, L.S.; Raes, D.; Smith, M. Crop Evapotranspiration: Guidelines for Computing Crop Requirements; FAO: Rome, Italy, 1998. [Google Scholar]
- Palazzolo, E.; Laudicina, V.A.; Roccuzzo, G.; Allegra, M.; Torrisi, B.; Micalizzi, A.; Badalucco, L. Bioindicators and Nutrient Availability through Whole Soil Profile under Orange Groves after Long-Term Different Organic Fertilizations. SN Appl. Sci. 2019, 1, 468. [Google Scholar] [CrossRef]
- Soil Survey Staff. Ustepts Great Groups. In Illustrated Guide to Soil Taxonomy, Version 2; U.S. Department of Agriculture, Natural Resources Conservation Service, National Soil Survey Center: Lincoln, NE, USA, 2015; pp. 435–442. [Google Scholar]
- Embleton, T.W.; Jones, W.W.; Labanauskas, C.K.; Reuther, W. Leaf Analysis as a Diagnostic Tool and Guide to Fertilization. Citrus Ind. 1973, 3, 183–210. [Google Scholar]
- Intrigliolo, F.; Roccuzzo, G. Evaluation of Different Fertilization Strategies on Orange. In Improved Crop Quality by Nutrient Management; Anac, D., Martin-Prével, P., Eds.; Springer: Dordrecht, The Netherlands, 1999; pp. 23–26. [Google Scholar]
- Kimball, D.A. Citrus Processing; Springer: Boston, MA, USA, 1999; ISBN 978-0-8342-1258-9. [Google Scholar]
- Rapisarda, P.; Fanella, F.; Maccarone, E. Reliability of Analytical Methods for Determining Anthocyanins in Blood Orange Juices. J. Agric. Food Chem. 2000, 48, 2249–2252. [Google Scholar] [CrossRef] [PubMed]
- The Jamovi Project (Version 2.2) Jamovi 2022 [Computer Software]. Available online: https://www.jamovi.org (accessed on 24 May 2023).
- R Core Team. R: A Language and Environment for Statistical Computing, Version 4.1; R Foundation for Statistical Computing: Vienna, Austria, 2021. [Google Scholar]
- The Jamovi Project GAMLj: General Analyses for the Linear Model in Jamovi. Available online: https://gamlj.github.io/ (accessed on 24 May 2023).
- Castel, J.R.; Buj, A. Response of Salustiana Oranges to High Frequency Deficit Irrigation. Irrig. Sci. 1990, 11, 121–127. [Google Scholar] [CrossRef]
- Ballester, C.; Castel, J.; Intrigliolo, D.S.; Castel, J.R. Response of Clementina de Nules Citrus Trees to Summer Deficit Irrigation. Yield Components and Fruit Composition. Agric. Water Manag. 2011, 98, 1027–1032. [Google Scholar] [CrossRef]
- Adu, M.O.; Yawson, D.O.; Armah, F.A.; Asare, P.A.; Frimpong, K.A. Meta-Analysis of Crop Yields of Full, Deficit, and Partial Root-Zone Drying Irrigation. Agric. Water Manag. 2018, 197, 79–90. [Google Scholar] [CrossRef]
- Roccuzzo, G.; Villalobos, F.J.; Testi, L.; Fereres, E. Effects of Water Deficits on Whole Tree Water Use Efficiency of Orange. Agric. Water Manag. 2014, 140, 61–68. [Google Scholar] [CrossRef]
- Coppin, P.; Jonckheere, I.; Nackaerts, K.; Muys, B.; Lambin, E. Digital Change Detection Methods in Ecosystem Monitoring: A Review. Int. J. Remote Sens. 2004, 25, 1565–1596. [Google Scholar] [CrossRef]
- Delalieux, S.; Somers, B.; Hereijgers, S.; Verstraeten, W.W.; Keulemans, W.; Coppin, P. A Near-Infrared Narrow-Waveband Ratio to Determine Leaf Area Index in Orchards. Remote Sens. Environ. 2008, 112, 3762–3772. [Google Scholar] [CrossRef]
- Benton Jones, J. Plant Nutrition Manual; CRC Press: Boca Raton, FL, USA, 1998. [Google Scholar]
- Munson, R.D. Principles of Plant Analysis. In Handbook of Reference Methods for Plant Analysis; Kalra, Y.P., Ed.; CRC Press: Boca Raton, FL, USA, 1998; pp. 1–25. [Google Scholar]
- Morgan, K.T.; Obreza, T.A. Irrigation Management to Improve Nutrient Uptake. In Nutrition of Florida Citrus Trees (SL253); Obreza, T.A., Morgan, K.T., Eds.; University of Florida, IIFAS Extension: Lake Alfred, FL, USA, 2011; pp. 60–61. [Google Scholar]
- Alva, A.K.; Paramasivam, S.; Graham, W.D.; Wheaton, T.A. Best Nitrogen and Irrigation Management Practices for Citrus Production in Sandy Soils. Water Air Soil Pollut. 2003, 143, 139–154. [Google Scholar] [CrossRef]
- Alva, A.K.; Paramasivam, S.; Obreza, T.A.; Schumann, A.W. Nitrogen Best Management Practice for Citrus Trees. Sci. Hortic. 2006, 107, 233–244. [Google Scholar] [CrossRef]
- Evans, J.R. Photosynthesis and Nitrogen Relationships in Leaves of C3 Plants. Oecologia 1989, 78, 9–19. [Google Scholar] [CrossRef]
- Baral, D.R. Performance of Mandarin Trees (Citrus Reticulata Blanco.) at Different Altitudes and Nutrient Management in Mid-Hills of Nepal. Ph.D. Thesis, Tribhuvan University, Katmandu, Nepal, 2008. [Google Scholar]
- Srivastava, A.K.; Singh, S. Potassium Nutrition in Citrus; National Research Centre for Citrus: Nagpur, India, 1999. [Google Scholar]
- Obreza, T.A.; Zekri, M.; Futch, S.H. General Soil Fertility and Citrus Tree Nutrition. In Nutrition of Florida Citrus Trees, 3rd ed.; Morgan, K.T., Kadyampakeni, D.M., Eds.; University of Florida, Institute of Food and Agricultural Sciences: Gainesville, FL, USA, 2020; Volume 2020, pp. 13–19. [Google Scholar]
- Srivastava, A.K. Site Specific Potassium Management for Quality Production of Citrus. Karnataka J. Agric. Sci. 2011, 24, 60–66. [Google Scholar]
- Ernani, P.R.; Dias, J.; Flore, J.A. Annual Additions of Potassium to the Soil Increased Apple Yield in Brazil. Commun. Soil Sci. Plant Anal. 2002, 33, 1291–1304. [Google Scholar] [CrossRef]
- Raveh, E. Citrus Leaf Nutrient Status: A Critical Evaluation of Guidelines for Optimal Yield in Israel. J. Plant Nutr. Soil Sci. 2013, 176, 420–428. [Google Scholar] [CrossRef]
- Robles, J.M.; Botía, P.; Pérez-Pérez, J.G. Subsurface Drip Irrigation Affects Trunk Diameter Fluctuations in Lemon Trees, in Comparison with Surface Drip Irrigation. Agric. Water Manag. 2016, 165, 11–21. [Google Scholar] [CrossRef]
- Martínez-Gimeno, M.A.; Bonet, L.; Provenzano, G.; Badal, E.; Intrigliolo, D.S.; Ballester, C. Assessment of Yield and Water Productivity of Clementine Trees under Surface and Subsurface Drip Irrigation. Agric. Water Manag. 2018, 206, 209–216. [Google Scholar] [CrossRef]
- Cebadera-Miranda, L.; Domínguez, L.; Dias, M.I.; Barros, L.; Ferreira, I.C.F.R.; Igual, M.; Martínez-Navarrete, N.; Fernández-Ruiz, V.; Morales, P.; Cámara, M. Sanguinello and Tarocco (Citrus sinensis [L.] Osbeck): Bioactive Compounds and Colour Appearance of Blood Oranges. Food Chem. 2019, 270, 395–402. [Google Scholar] [CrossRef]
- Francis, F.J. Quality as Influenced by Color. Food Qual. Prefer. 1995, 6, 149–155. [Google Scholar] [CrossRef]
- Heiman, A.; Karo, T.; Goldschmidt, E.E.; Neale, R.; Bustan, A. Fruit Quality Perception by Growers, Retailers and Consumers: The Case of Oranges. Acta Hortic. 2002, 584, 177–184. [Google Scholar] [CrossRef]
- Navarro, J.M.; Gomez-Gomez, A.G.; Perez-Perez, J.G.; Porras, I.; Botia, P. Effects of Differing Deficit Irrigation Treatments on Fruit Quality of Citrus Reticulata Blanco. In Proceedings of the International Society of Citriculture, Wuhan, China, 26–30 October 2008; pp. 701–706. [Google Scholar]
Figure 1.
Average air temperature, humidity, and rainfall during the experiment in the 2013–2018 period.
Figure 1.
Average air temperature, humidity, and rainfall during the experiment in the 2013–2018 period.

Figure 2.
Stem water potential (Ψstem) and the stomatal conductance (gs) for various days of the year (DOYs) in the years 2013 (a,b), 2014 (c,d), 2015 (e,f), 2016 (g,h), and 2017 (i,j). Error bars represent the standard deviation from the mean (n = 6).
Figure 2.
Stem water potential (Ψstem) and the stomatal conductance (gs) for various days of the year (DOYs) in the years 2013 (a,b), 2014 (c,d), 2015 (e,f), 2016 (g,h), and 2017 (i,j). Error bars represent the standard deviation from the mean (n = 6).


Figure 3.
Average potassium leaf concentration and standard deviation (g kg−1d.w.) in each treatment and per year of the trial. Error bars represent the standard deviation from the mean (n = 6).
Figure 3.
Average potassium leaf concentration and standard deviation (g kg−1d.w.) in each treatment and per year of the trial. Error bars represent the standard deviation from the mean (n = 6).

Figure 4.
Average magnesium concentration and standard deviation in plants’ leaves (g kg−1d.w.): (a) depending on treatments; (b) depending on year. Averages not sharing a letter are significantly different (p < 0.05 at post hoc Tukey HSD test). Error bars represent the standard deviation from the mean (n = 30 for the treatments and 24 for the years).

Figure 5.
Average weight per fruit and standard deviation (gf.w.) and yield of the orchard (t ha−1). Fruit weight averages that do not share a letter are significantly different (p < 0.05 at post hoc Tukey HSD test). Error bars represent the standard deviation from the mean (n = 30).
Figure 5.
Average weight per fruit and standard deviation (gf.w.) and yield of the orchard (t ha−1). Fruit weight averages that do not share a letter are significantly different (p < 0.05 at post hoc Tukey HSD test). Error bars represent the standard deviation from the mean (n = 30).

Figure 6.
Average WUE of total acids yield and standard deviation (g m−3) according to treatment (on the left) and year (on the right). Averages that do not share a letter are significantly different (Tukey HSD post hoc test, p < 0.05). Error bars represent the standard deviation from the mean (n = 30 for the treatments and 24 for the years).

Figure 7.
Average WUE of total soluble solids yield and standard deviation (g m−3) according to treatment (on the left) and year (on the right). Averages that do not share a letter are significantly different (Tukey HSD post hoc test, p < 0.05). Error bars represent the standard deviation from the mean (n = 30 for the treatments and 24 for the years).

Figure 8.
Average WUE of anthocyanins yield and standard deviation (g m−3) according to treatment (on the left) and year (on the right). Error bars represent the standard deviation from the mean (n = 30 for the treatments and 24 for the years).
Figure 8.
Average WUE of anthocyanins yield and standard deviation (g m−3) according to treatment (on the left) and year (on the right). Error bars represent the standard deviation from the mean (n = 30 for the treatments and 24 for the years).
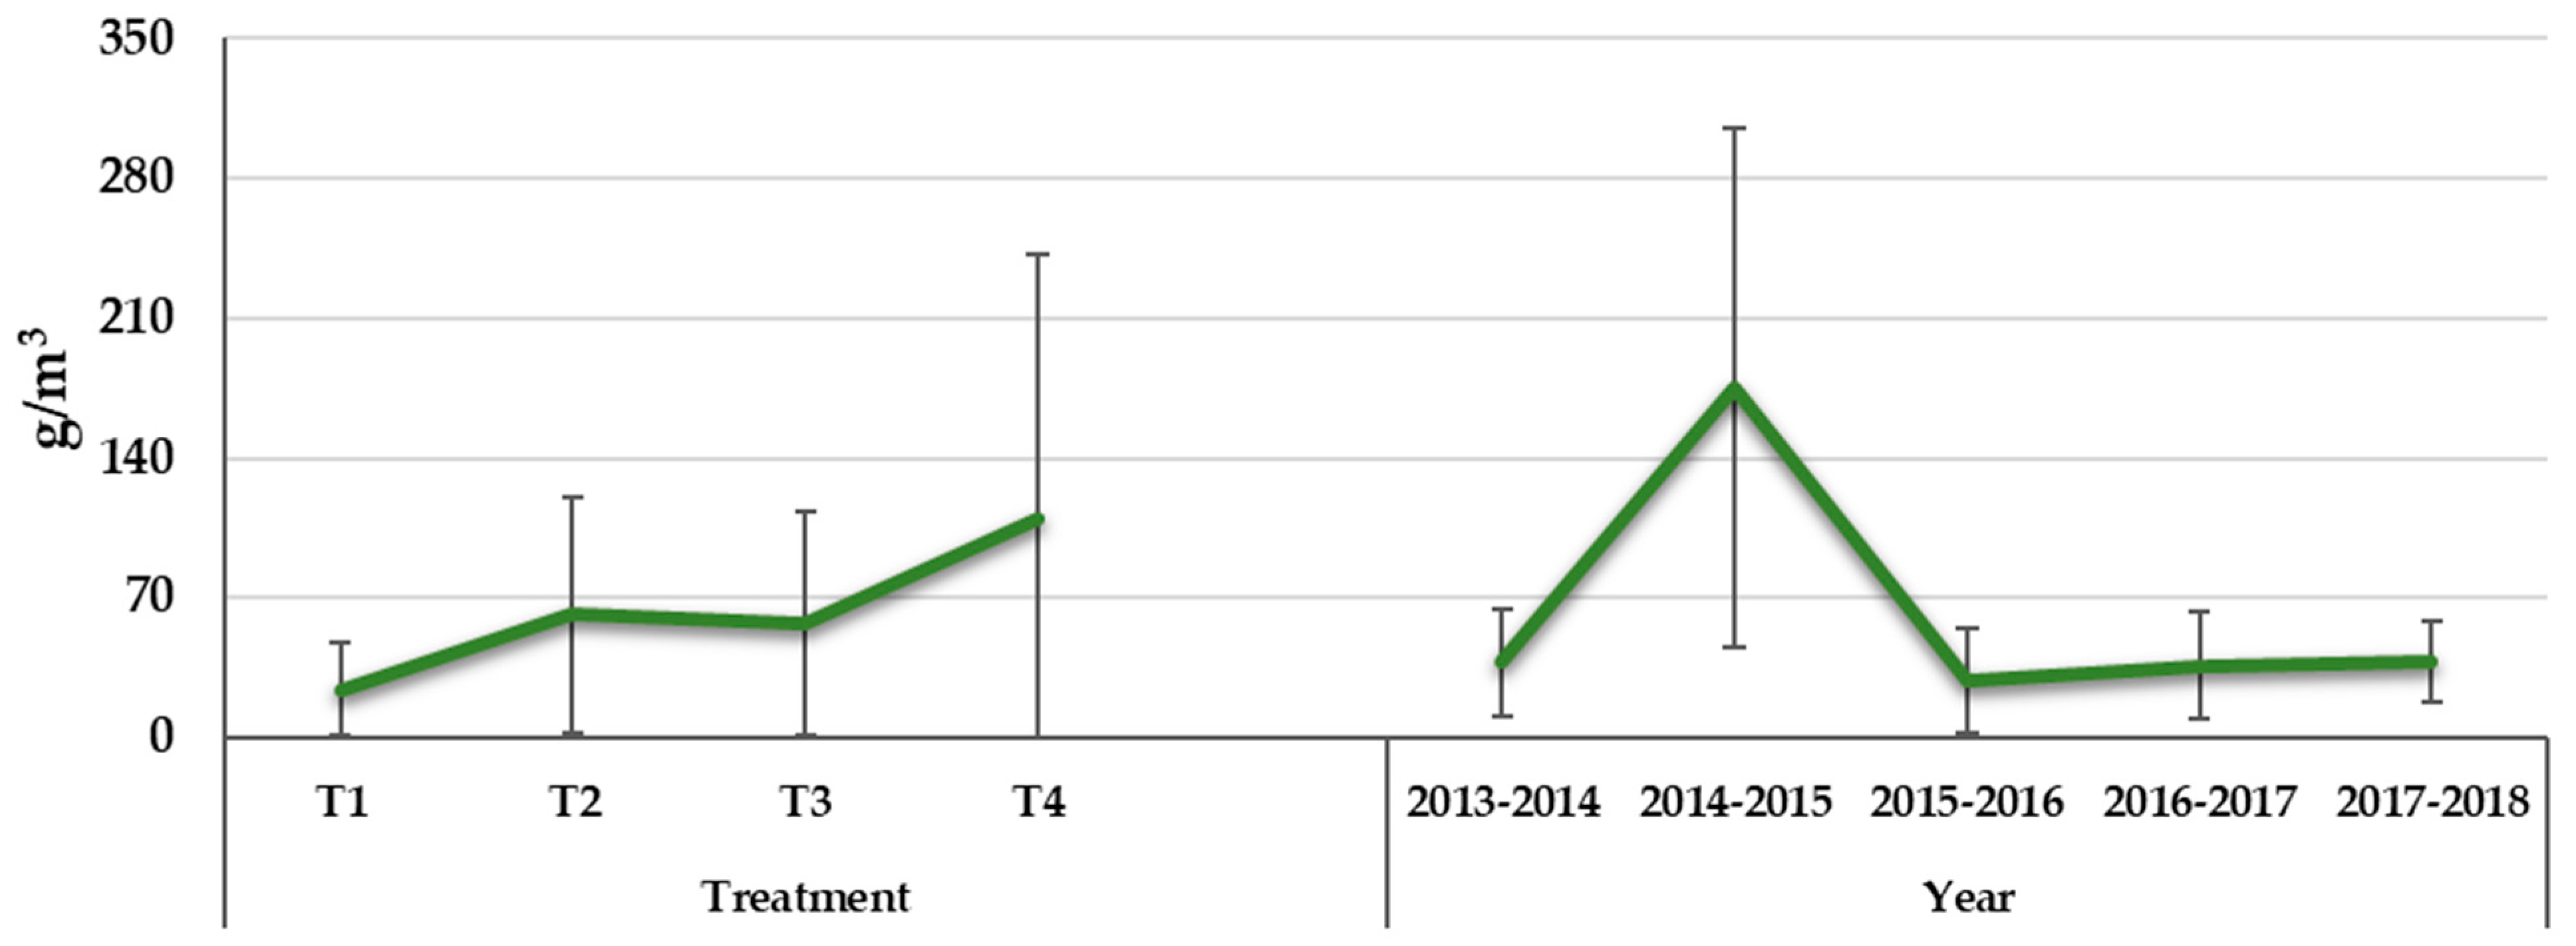
Figure 9.
Average WUE of vitamin C yield and standard deviation (g m−3) according to treatment (on the left) and year (on the right). Averages that do not share a letter are significantly different (Tukey HSD post hoc test, p < 0.05). Error bars represent the standard deviation from the mean (n = 30 for the treatments and 24 for the years).

Table 2.
Water use efficiency (WUE).
| Water Treatment | WUE (kgfresh weight m−3) | Grouping * |
|---|---|---|
| Control—T1 | 7.31 ± 3.02 | c |
| SSDI—T2 | 9.71 ± 2.00 | b |
| RDI—T3 | 11.32 ± 3.37 | b |
| PRD—T4 | 15.85 ± 3.95 | a |
* Averages that do not share a letter are significantly different (Tukey HSD post hoc test, p < 0.05).
Table 3.
Average LAI of the trees recorded during the trial.
| Years | Average LAI | Grouping * |
|---|---|---|
| 2013–2014 | 4.52 ± 0.65 | a |
| 2014–2015 | 4.16 ± 0.84 | a |
| 2015–2016 | 3.90 ± 0.94 | a |
| 2016–2017 | 4.40 ± 0.77 | a |
| 2017–2018 | 3.14 ± 0.80 | b |
* Different letters indicate significant differences among values belonging to years—p < 0.05 at post hoc Tukey HSD test.
Table 4.
Average nitrogen leaf concentration ± standard deviation (g kg−1d.w.) recorded for each irrigation treatment and for each year of trial.
Table 4.
Average nitrogen leaf concentration ± standard deviation (g kg−1d.w.) recorded for each irrigation treatment and for each year of trial.
| Treatment | Average N | Grouping * |
|---|---|---|
| Control—T1 | 26.99 ± 1.39 | ab |
| SSDI—T2 | 27.56 ± 3.37 | a |
| RDI—T3 | 25.88 ± 2.16 | b |
| PRD—T4 | 26.50 ± 1.29 | ab |
| Years | Average N | Grouping * |
| 2013–2014 | 28.20 ± 4.01 | a |
| 2014–2015 | 25.77 ± 0.87 | b |
| 2015–2016 | 26.98 ± 1.96 | ab |
| 2016–2017 | 26.34 ± 1.18 | ab |
| 2017–2018 | 26.38 ± 1.07 | ab |
* Different letters indicate significant differences among values belonging to treatments/years—p < 0.05 at post hoc Tukey HSD test.
Table 5.
Average phosphorus leaf concentrations and standard deviation (g kg−1d.w.) recorded for each irrigation treatment and for each year of trial.
Table 5.
Average phosphorus leaf concentrations and standard deviation (g kg−1d.w.) recorded for each irrigation treatment and for each year of trial.
| Treatment | Average P | Grouping * |
|---|---|---|
| Control—T1 | 1.55 ± 0.16 | n.s. |
| SSDI—T2 | 1.50 ± 0.08 | n.s. |
| RDI—T3 | 1.72 ± 0.12 | n.s. |
| PRD—T4 | 1.62 ± 0.11 | n.s. |
| Years | Average P | Grouping * |
| 2013–2014 | 1.61 ± 0.09 | n.s. |
| 2014–2015 | 1.59 ± 0.10 | n.s. |
| 2015–2016 | 1.62 ± 0.14 | n.s. |
| 2016–2017 | 1.56 ± 0.13 | n.s. |
| 2017–2018 | 1.63 ± 0.17 | n.s. |
* n.s. = not significant at post hoc Tukey HSD test.
Table 6.
Average Mn concentrations and standard deviation (mg kg−1d.w.) across treatments. Averages that do not share a letter are significantly different.
Table 6.
Average Mn concentrations and standard deviation (mg kg−1d.w.) across treatments. Averages that do not share a letter are significantly different.
| Water Treatment | Average Concentration | Grouping * |
|---|---|---|
| Control—T1 | 45.0 ± 11.0 | b |
| SSDI—T2 | 50.9 ± 14.1 | a |
| RDI—T3 | 51.0 ± 16.2 | a |
| PRD—T4 | 45.2 ± 11.2 | b |
* Different letters indicate significant differences among values belonging to treatments/years—p < 0.05 at post hoc Tukey HSD test.
Table 7.
Average Cu concentrations and standard deviation (mg kg−1d.w.) across treatments. Averages that do not share a letter are significantly different.
Table 7.
Average Cu concentrations and standard deviation (mg kg−1d.w.) across treatments. Averages that do not share a letter are significantly different.
| Water Treatment | Average Concentration | Grouping * |
|---|---|---|
| Control—T1 | 24.1 ± 4.56 | a |
| SSDI—T2 | 14.3 ± 4.58 | b |
| RDI—T3 | 20.9 ± 4.58 | ab |
| PRD—T4 | 26.0 ± 4.56 | a |
* Different letters indicate significant differences among values belonging to treatments/years—p < 0.05 at post hoc Tukey HSD test.
Table 8.
Effect of deficit irrigation on fruit quality parameters at harvest.
| Control T1 | SSDI T2 | RDI T3 | PRD T4 | |
|---|---|---|---|---|
| Total soluble solids—TSS (°Brix) | 10.8 ± 0.64 b | 10.9 ± 0.66 b | 11.6 ± 0.87 a | 11.4 ± 0.74 a |
| Titratable acidity—TA (%) | 1.36 ± 0.18 b | 1.36 ± 0.28 b | 1.44 ± 0.31 a,b | 1.46 ± 0.26 a |
| Maturity Index—MI (dmnl) | 8.07 ± 1.04 | 8.38 ± 1.38 | 8.23 ± 1.57 | 8.01 ± 1.28 |
| Juice yield (%) | 51.3 ± 5.27 a,b | 48.9 ± 8.89 b | 53.5 ± 5.93 a | 52.4 ± 4.56 a,b |
| Anthocyanin (mg L−1) | 6.49 ± 4.30 | 12.3 ± 8.90 | 9.25 ± 6.94 | 11.5 ± 10.2 |
| Vit C (mg 100 mL−1) | 58.5 ± 8.15 b | 60.5 ± 9.38 a,b | 62.7 ± 6.71 a | 60.0 ± 6.23 a,b |
| Pulp colour index—CI | 8.44 ± 2.33 b | 10.01 ± 2.33 a | 9.07 ± 1.83 a,b | 9.90 ± 3.06 a |
| Equatorial Diameter (mm) | 81.1 ± 4.20 a | 79.7 ± 4.78 a,b | 78.6 ± 4.06 b | 78.6 ± 3.64 b |
| Longitudinal Diameter (mm) | 88.5 ± 4.66 | 87.0 ± 6.98 | 86.1 ± 6.77 | 85.5 ± 5.21 |
Averages that do not share a letter are significantly different (Tukey HSD post hoc test, p < 0.05).
Disclaimer/Publisher’s Note: The statements, opinions and data contained in all publications are solely those of the individual author(s) and contributor(s) and not of MDPI and/or the editor(s). MDPI and/or the editor(s) disclaim responsibility for any injury to people or property resulting from any ideas, methods, instructions or products referred to in the content. |
© 2024 by the authors. Licensee MDPI, Basel, Switzerland. This article is an open access article distributed under the terms and conditions of the Creative Commons Attribution (CC BY) license (https://creativecommons.org/licenses/by/4.0/).
Share and Cite
MDPI and ACS Style
Stagno, F.; Brambilla, M.; Roccuzzo, G.; Assirelli, A. Water Use Efficiency in a Deficit-Irrigated Orange Orchard. Horticulturae 2024, 10, 498. https://doi.org/10.3390/horticulturae10050498
AMA Style
Stagno F, Brambilla M, Roccuzzo G, Assirelli A. Water Use Efficiency in a Deficit-Irrigated Orange Orchard. Horticulturae. 2024; 10(5):498. https://doi.org/10.3390/horticulturae10050498
Chicago/Turabian StyleStagno, Fiorella, Massimo Brambilla, Giancarlo Roccuzzo, and Alberto Assirelli. 2024. "Water Use Efficiency in a Deficit-Irrigated Orange Orchard" Horticulturae 10, no. 5: 498. https://doi.org/10.3390/horticulturae10050498
Note that from the first issue of 2016, this journal uses article numbers instead of page numbers. See further details here.