Article

Fractal Evolution Characteristics on the Three-Dimensional Fractures in Coal Induced by CO2 Phase Transition Fracturing

1
School of Resources & Environment, Henan Polytechnic University, Jiaozuo 454003, China
2
WA School of Mines: Minerals, Energy and Chemical Engineering, Curtin University, Kalgoorlie, WA 6430, Australia
*
Authors to whom correspondence should be addressed.
Fractal Fract. 2024, 8(5), 273; https://doi.org/10.3390/fractalfract8050273
Submission received: 10 April 2024 / Revised: 30 April 2024 / Accepted: 1 May 2024 / Published: 4 May 2024
(This article belongs to the Special Issue Fractal Analysis and Its Applications in Rock Engineering)

Abstract

:
To analyze the transformed effect of three-dimensional (3D) fracture in coal by CO2 phase transition fracturing (CO2-PTF), the CO2-PTF experiment under a fracturing pressure of 185 MPa was carried out. Computed Tomography (CT) scanning and fractal theory were used to analyze the 3D fracture structure parameters. The fractal evolution characteristics of the 3D fractures in coal induced by CO2-PTF were analyzed. The results indicate that the CO2 phase transition fracturing coal has the fracture generation effect and fracture expansion-transformation effect, causing the maximum fracture length, fracture number, fracture volume and fracture surface area to be increased by 71.25%, 161.94%, 3970.88% and 1330.03%. The fractal dimension (DN) for fracture number increases from 2.3523 to 2.3668, and the fractal dimension (DV) for fracture volume increases from 2.8440 to 2.9040. The early dynamic high-pressure gas jet stage of CO2-PTF coal influences the fracture generation effect and promotes the generation of 3D fractures with a length greater than 140 μm. The subsequent quasi-static high-pressure gas stage influences the fracture expansion-transformation effect, which promotes the expansion transformation of 3D fractures with a length of less than 140 μm. The 140 μm is the critical value for the fracture expansion-transformation effect and fracture generation effect. Five indicators are proposed to evaluate the 3D fracture evolution in coal caused by CO2-PTF, which can provide theoretical and methodological references for the study of fracture evolution characteristics of other unconventional natural gas reservoirs and their reservoir stimulation.

1. Introduction

As an important unconventional natural gas energy, the efficient development and utilization of coalbed methane (CBM) cannot only provide clean fuel, but also help reduce coal and gas outburst disasters, and alleviate the greenhouse effect [1,2,3]. However, low permeability is one of the key factors restricting the efficient development of CBM [4,5,6]. Therefore, a variety of technologies that enhance gas drainage and eliminate coal and gas outbursts have been developed, but different technologies are suitable for coal seams and mining areas with different gas geological conditions [7,8]. The research and development of safe, effective, economical and highly applicable permeability-enhanced technology is one of the main research contents and major needs in the field of coal and gas co-mining research.
CO2 phase transition fracturing (CO2-PTF) technology originated from the CARDOX technology invented in the United States in 1914 [9]. The CO2-PTF technology or CARDOX technology is a non-explosive physical blasting technology that uses the high-pressure gas expansion energy generated by the heating and expansion of liquid CO2 to act on the coal or rock, causing the coal or rock to fracture [10]. The energy analysis indicates that CO2 undergoes a transformation from the liquid to the supercritical and gaseous state, 1 kg of liquid CO2 undergoes phase change and the produced energy is equivalent to 397 g of TNT explosive [11]. The field applications in coalmines show that CO2-PTF is a new reservoir stimulation method for enhancing permeability and eliminating gas outbursts, which has unique technical advantages, such as high safety performance and avoiding the negative effects of hydraulic measures [12,13,14].
Coal is a multi-scale pore–fracture media, and its pore–fracture structure characteristics and connectivity directly control the CBM desorption, diffusion and seepage [15,16,17]. In recent years, the transformation effect of CO2-PTF on the pore–fracture structure (gas migration channel) of coal has attracted the attention of scholars. In terms of pore transformation by CO2-PTF, Bai et al. found that the coal pore volume with pore diameter greater than 1 μm increases after CO2-PTF [18]. The study by Xia et al. showed that the pore volume and average pore diameter of coal increased, and the pore fractal dimension decreased after CO2-PTF [19]. Recent studies have indicated that CO2-PTF mainly affects pores with pore diameters larger than 2 nm, and the mesopore fractal dimension is reduced [20]. In terms of fracture transformation by CO2-PTF, Cao et al. found that the macroscopic fractures with a length of 1–3 m were produced by on-site monitoring after CO2-PTF [21], and the fractured coal sample by CO2-PTF is further observed by Scanning Electron Microscope (SEM), which found a large number of tri-radial wing micro-fractures and damage marks [22]. Liu and Liao et al. used the fracture fractal theory to calculate the fractal dimension of the two-dimensional (2D) fracture observed by SEM after CO2-PTF, and the fractal dimension for 2D fracture increased [23,24].
In summary, at this stage, the pore structure scale of coal transformed by CO2-PTF has been revealed, and the fractal theory is widely used to characterize the complexity of the pore–fracture structure in coal. However, the related research on the fracture structure induced by CO2 phase transition fracturing coal (CO2-PTF coal) mainly focuses on the 2D fracture by macroscopic monitoring and SEM observation. The distribution of fractures in coal has obvious three-dimensional (3D) structural characteristics of length, aperture and height, and fracture volume comprehensively reflects fracture length, aperture and height [25,26,27]. The fracture surface area is the total area of the internal surface of the 3D fractures in coal [28,29]. Therefore, the number, length, volume and surface area of fractures are key parameters that reflect the 3D fractures [29,30,31]. The current research on the 2D fracture structure of CO2-PTF coal is not enough to fully reveal the 3D fracture evolution characteristics of CO2-PTF coal. CT scanning is a non-destructive technology, and can accurately characterize 3D fracture in coal [32,33], which provides technical support for analyzing the 3D fracture evolution of CO2-PTF coal.
Therefore, this paper carried out the CO2-PTF coal experiment, the CT scanning and fractal theory were applied to research the 3D fracture evolution characteristics of CO2-PTF coal, and the transformation effect of CO2-PTF on the 3D fracture was analyzed. This study further reveals the mechanism of coal seam transformation caused by CO2-PTF, provides new evaluation and analysis methods for studying the effect of CO2-PTF, and is conducive to further improving the reservoir stimulation theory of CO2-PTF coal.

2. Sample and Experimental

2.1. Samples

The experimental samples are collected from the Ji15 coal seam in Pingdingshan No. 8 Coalmine, Henan province. The coal sample is bright, showing layered and massive structures, the original band structure is well preserved and the bedding is visible. The dry ash-free volatile content of the sample is 24.91%, and the maximum vitrinite reflectance is 1.22%. After the coal samples are collected, they are sealed, packaged and transported to the laboratory, where a linear cutting machine is used to prepare the coal pillar with a diameter (Φ) of 50 mm and length of 75 mm for the CO2-PTF experiment.

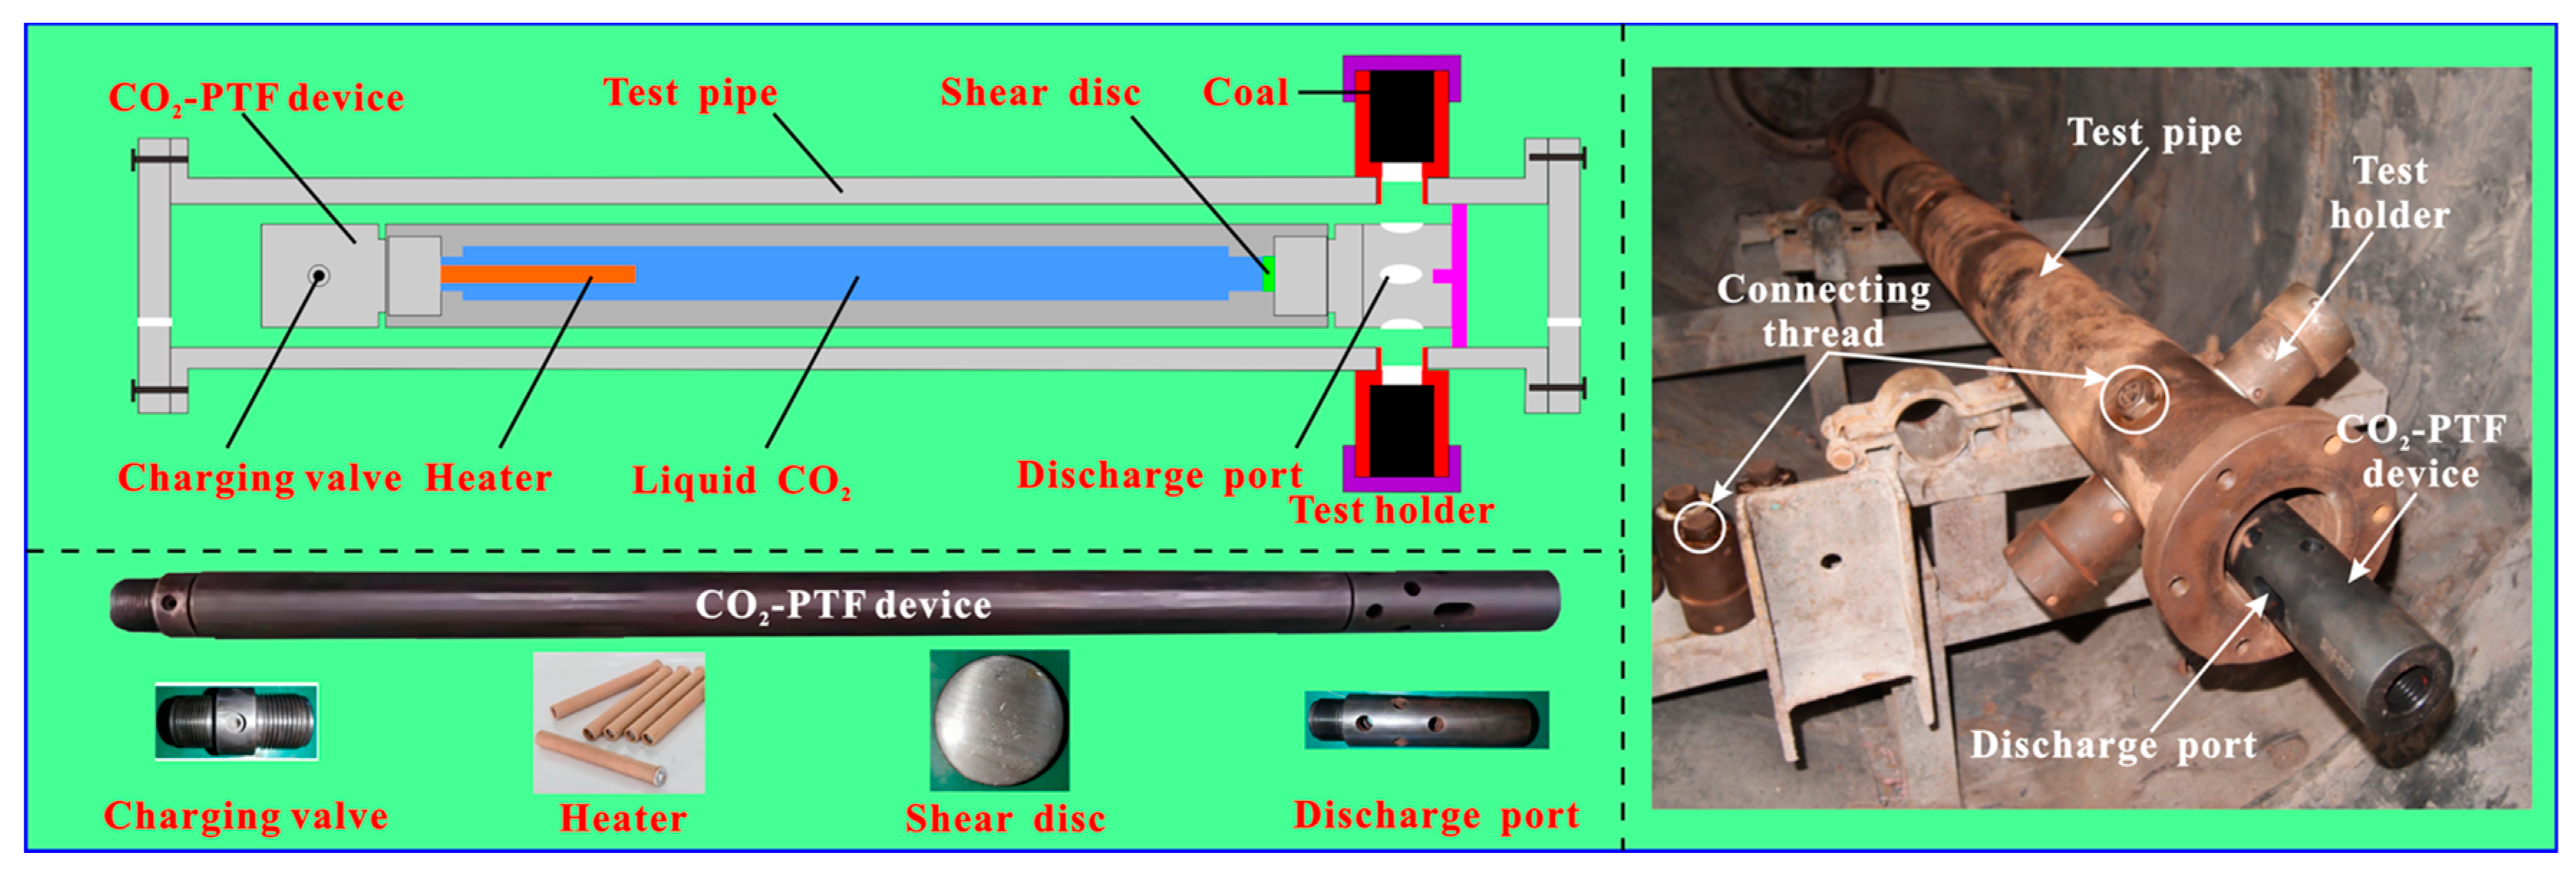
2.2. CO2 Phase Change Fracturing Experiment

The experimental system for CO2-PTF coal is shown in Figure 1. The experimental system mainly includes the CO2-PTF device composed of liquid CO2, a heater, a pressure-controlled bursting disc, an external test pipe of the CO2-PTF device and a test holder (the test holder is facing the discharge port of the CO2-PTF). The main experiment process of the CO2-PTF coal is as follows: (1) select the pressure-controlled bursting disc of 185 MPa, assemble the CO2-PTF device and fill it with liquid CO2; (2) fix the external test pipe of the CO2-PTF device on the bracket in safety experimental chamber; (3) put the CO2-PTF device into the external test pipe, adjust the discharge port of the CO2-PTF so that it faces the test holder; (4) connect the wire of CO2-PTF device, close the external test pipe, close the safety experimental chamber, start the heater and then conduct CO2-PTF coal experiment; and (5) remove the test holder and take out the coal sample. The coal is labeled PR before CO2-PTF, and the coal is labeled PF after CO2-PTF.

2.3. CT Scanning Measurement

CT scanning technology can obtain the internal structure information of coal or rock without damaging the internal structure. The instrument used in this CT scan is GE’s Phoenix v|tome|xs, and the coal sample CT scanning process is shown in Figure 2. The main parameters of CT scanning are a resolution of 30.4 μm, scanning voltage of 200 kV, scanning current of 170 μA, and exposure time of 500 ms, and 2467 slices of 1611 × 1611 pixels are obtained for each scanning.
Here, to facilitate our analysis of the 3D fracture evolution characteristics of coal induced by CO2-PTF. Before CO2-PTF, CT scanning was performed on the coal sample used for the CO2-PTF experiment to obtain the original fracture structure. After CO2-PTF, the CT scanning was performed on the coal sample again to obtain the internal fracture structure.

3. Fractal Dimension Calculation for 3D Fracture

The fractal dimension is usually used to quantitatively describe the complexity of complex and irregular structures [34,35,36]. The fractal dimension DN for 3D fracture number and fractal dimension DV for 3D fracture volume in this research are applied to characterize the fracture complexity of CO2-PTF coal.

3.1. Fractal Dimension Calculation for 3D Fracture Number

The calculation principle of the fractal dimension DN for 3D fracture number is as follows: The number of fractures of the fracture length greater than Li is recorded as N(Li), the fractal scaling relationship between N(Li) and Li satisfies the Equation (1) [37,38]. Taking the logarithm of N(Li) and Li and drawing the relation between logN(Li) and logLi, we obtain the absolute value of the slope of the line by the linear regression analysis, which is the fractal dimension DN for 3D fracture number, as shown the Equation (2).
N L i L i D N
log N L i = D N log L i + C 1
where Li is the fracture length; N(Li) is the number of fractures with the fracture length greater than Li; DN is the fractal dimension for the fracture number; C1 is a fitting constant.

3.2. Fractal Dimension Calculation for 3D Fracture Volume

The fracture volume V and surface area A are obtained based on CT scanning, and they satisfy the fractal scaling relationship of Equation (3) [39]. Taking the logarithm of both sides of Equation (3), the fractal dimension DV for 3D fracture volume can be calculated by Equation (4).
A 1 / D V V 1 / 3
log A = D V / 3 log V + C 2
where A is the surface area of the fracture; V is the volume of the fracture; DV is the fractal dimension for the 3D fracture volume; C2 is a fitting constant.

4. Results

4.1. 2D Fractures

Figure 3 indicates the fractures in the 2D slice before and after CO2-PTF coal. Before CO2-PTF, there are no obvious large fractures inside the coal sample PR. The aperture of some original fractures is small and the connectivity of the fractures is poor (Figure 3a,b). After CO2-PTF, the obvious fracture network is generated in the coal sample PF, and the connectivity between fractures is enhanced. Furthermore, there are some new fracture structures formed from CO2-PTF coal. Large damage marks (DM) are formed and the four-radial-wing (FRW) fractures extending in four directions is generated around the large damage marks in the middle of the coal sample PF (Figure 3c,d). Some small damage marks and radial fractures are also formed in the coal sample PF (Figure 3c,d). Cao et al. also found that CO2-PTF promotes the formation of damage marks and tri-radial-wing (TRW) fractures (the three single fractures initiated from one point) by SEM observations [22]. In this study, the radial fractures formed by CO2-PTF include not only tri-radial-wing (TRW) fractures, but also four-radial-wing (FRW) fractures (the four single fractures initiated from one point) (Figure 3c,d).
Figure 3 further shows that the 2D fractures on different slices of the same sample are obviously different. Therefore, the 2D fracture can only reflect the local fracture evolution. The fractures in coal have obvious 3D characteristics [40,41,42]. To further truly reflect the fracture evolution of CO2-PTF coal, it is necessary to perform 3D reconstruction of the 2D slices.

4.2. 3D Reconstruction of Fractures

The 2D slices obtained from the CT scanning were filtered and denoised, and subjected to threshold segmentation. The VG Studio MAX 3.0 image processing software from the Volume Graphics company (Heidelberg, Germany) was used to visualize the 3D reconstruction of the processed 2D slices of coal samples. The pore/inclusion analysis module was used to extract and analyze the defects or fractures in coal samples. The detected fractures were color-coded and visualized, and the fracture structural parameters were calculated, mainly including fracture number, length, volume and surface area.
Figure 4 shows the 3D fracture of the coal sample from 3D reconstruction before and after CO2-PTF. Before CO2-PTF, the fracture rendering color inside the coal sample PR is mainly green and blue (Figure 4a,b), the fracture volume is small and the connectivity between fractures is poor. After CO2-PTF, the complex fracture network is formed inside the coal sample PF, and the fracture rendering color is mainly red (Figure 4c,d). The fracture volume increases, and the connectivity between the fractures is enhanced. Furthermore, compared with the 3D fracture in coal sample PR, the 3D fractures in coal sample PF after CO2-PTF have obvious longitudinal continuity. This is mainly due to the high-pressure CO2 flow generated by CO2-PTF that acts on the top of the coal sample, prompting the fractures in the coal sample to expand longitudinally, forming the complex fracture network.

4.3. Fractal Dimension for 3D Fracture

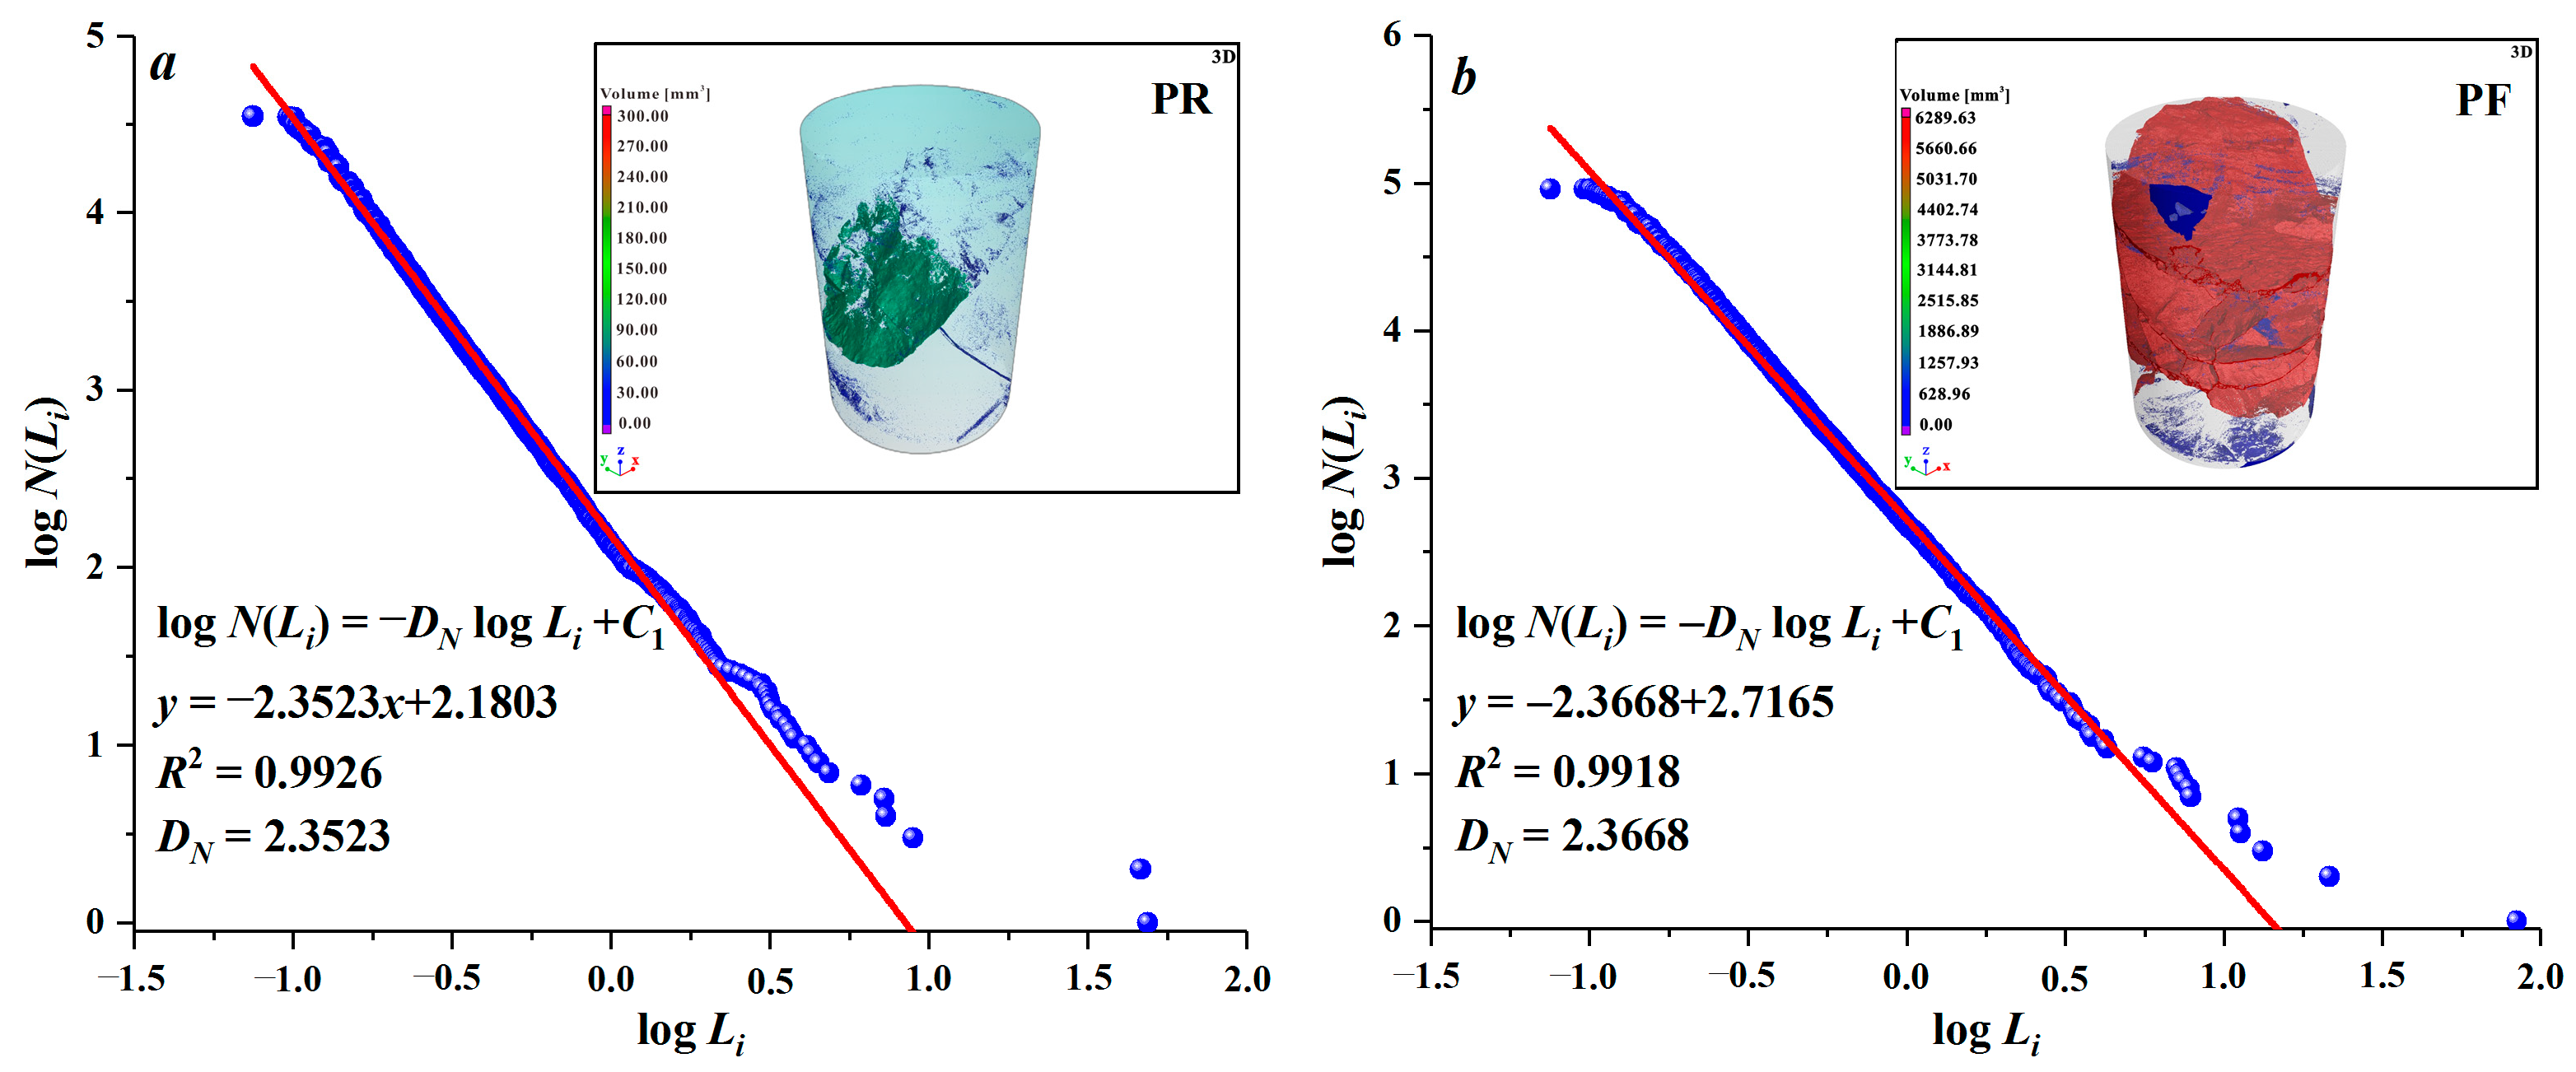
4.3.1. Estimation of the Fractal Dimension DN for 3D Fracture Number

Figure 5 shows that logN(Li) and logLi have an obvious linear relationship, and the correlation coefficient R2 is greater than 0.99, indicating that the number distribution of the 3D fractures inside the coal sample has obvious fractal characteristics. Before CO2-PTF, the fractal dimension DN for 3D fracture number is 2.3523. After CO2-PTF, the fractal dimension DN for the 3D fracture number is 2.3668.

4.3.2. Estimation of the Fractal Dimension DV for 3D Fracture Volume

The fracture surface area A and volume V are fitted by Equation (4) to obtain the fractal dimension DV for 3D fracture volume. Figure 6 shows that logA and logV have an obvious linear relationship, and the correlation coefficient R2 is greater than 0.98, reflecting that 3D fracture volume distribution inside the coal sample has obvious fractal characteristics. After CO2-PTF, the fractal dimension DV increases from 2.8440 to 2.9040.

4.4. 3D Fracture Structure Variation Induced by CO2-PTF Coal

According to the 3D fracture reconstruction from CT scanning in Section 4.2, the 3D fracture structure parameters before and after CO2-PTF are shown in Figure 7. After CO2-PTF, the maximum fracture length in the coal sample increases from 48.90 mm to 83.74 mm, with an increased rate of 71.25% (Figure 7a). The fracture number increases from 35,183 to 92,159, with an increased rate of 161.94% (Figure 7b). The fracture volume V increases from 158.12 mm3 to 6436.87 mm3, with an increased rate of 3970.88% (Figure 7c). The fracture surface area A increases from 7733.05 mm2 to 110,585.06 mm2, an increase of 1330.03% (Figure 7d).

5. Discussion

5.1. 3D Fracture Evolution Characteristics of Coal Induced by CO2-PTF

Figure 8 shows that after CO2-PTF, the fracture volume and surface area with a fracture length less than 0.14 mm decreased, and the fracture volume and surface area with a length greater than 0.14 mm increased. Figure 9 further indicates that after CO2-PTF, the fracture volume with a fracture length less than 0.14 mm decreases from 5.78 mm3 to 5.13 mm3, a decrease of 11.24% (Figure 9a). The fracture volume with a fracture length greater than 0.14 mm increases from 152.34 mm3 to 6431.74 mm3, an increase of 4121.96% (Figure 9b). After CO2-PTF, the fracture surface area with a fracture length of less than 0.14 mm decreases from 650.29 mm2 to 593.06 mm2, a decrease of 8.80% (Figure 9c). The fracture surface area with a fracture length greater than 0.14 mm increases from 7082.76 mm2 to 109,992.00 mm3, an increase of 1452.95% (Figure 9d).
The above fracture structure variation indicates that CO2-PTF promotes the expansion transformation of fractures with a length less than 0.14 mm into fractures with a length greater than 0.14 mm. In addition to the expansion transformation from the fractures with a length less than 0.14 mm, it is mainly due to the CO2-PTF generating a large number of new fractures with a length greater than 0.14 mm in coal. Therefore, the fracture evolution caused by CO2-PTF coal has dual effects, which are the fracture generation effect and fracture expansion-transformation effect, and the boundary between the dual effects of CO2-PTF coal under the fracturing pressure of 185 MPa is 0.14 mm (140 μm).
The fracture structure evolution induced by CO2-PTF coal is closely related to the process of CO2-PTF coal (Figure 10). The process of CO2-PTF coal is mainly divided into two stages: the early dynamic high-pressure gas jet stage and the subsequent quasi-static high-pressure gas stage [43,44,45]. In the early dynamic high-pressure gas jet stage, the high-pressure CO2 gas jet is ejected from the discharge port and acts on the surrounding coal, forming a large number of new fractures. This stage corresponds to the fracture generation effect.
The high-pressure CO2 gas jet migrates along the fracture in coal and the CO2 gas pressure decays, entering the subsequent quasi-static high-pressure gas stage. The CO2 gas pressure is generally 5–8 MPa, which is much greater than the tensile strength of coal (0.5–1.5 MPa) [46], the “gas wedge effect” of high-pressure CO2 gas will cause micro-fracture to expand and transform [47,48], resulting in the fracture expansion-transformation effect.
The fracture dual evolution effect (the fracture generation effect and fracture expansion-transformation effect) induced by CO2-PTF coal, especially the fracture generation effect, promotes a significant increase in the fracture number, volume and surface area, which causes the enhanced connectivity between fractures, and the increase in fractal dimensions for the fracture number and volume. In summary, CO2-PTF coal enhances the connectivity between fractures and provides an effective channel for gas seepage, which is conceived in the CBM drainage.

5.2. Potential Application in Evaluating the Effect of CO2-PTF Coal

According to this study, combining the fractal dimension DV for fracture volume with the fractal dimension DN for fracture number can more comprehensively reflect the connectivity evolution characteristics for the fracture structure of CO2-PTF coal. Therefore, we propose evaluation indicators to evaluate the 3D fracture evolution in coal caused by CO2-PTF from the perspectives of Euclidean geometry and fractal geometry, which mainly includes the maximum fracture length (Lmax), fracture volume (V), the fracture number (N), the fractal dimension (DV) for fracture volume and the fractal dimension (DN) for fracture number.
The fracture length reflects the fracture expansion range, so the larger the maximum fracture length (Lmax), the larger the fracture expansion range. The fracture volume (V), fracture number (N), fractal dimension (DV) for fracture volume and fractal dimension (DN) for fracture number can represent the fracture connectivity [39,49,50,51,52]. The larger these values, the better the connectivity between fractures. The comprehensive evaluation diagram of five indicators for evaluating the 3D fracture evolution of CO2-PTF coal is shown in Figure 11.
This research further reveals the fracture evolution mechanism by CO2-PTF coal and provides a new evaluation and analysis indicators for the effect of CO2-PTF. In addition, the above research method can provide theoretical and methodological references for the study of fracture evolution characteristics of other unconventional natural gas reservoirs and their reservoir stimulation.

6. Conclusions

According to the CT scanning technology and fractal theory, the variations in the length, number, volume and surface area of the 3D fractures in coal before and after CO2-PTF under the fracturing pressure of 185 MPa are analyzed. The fractal dimension (DN) for fracture number and fractal dimension (DV) for fracture volume before and after CO2-PTF are calculated. The fractal evolution characteristics of the 3D fracture structure of coal induced by CO2-PTF are revealed. The main conclusions are as follows:
CO2 phase transition fracturing coal has the fracture generation effect and fracture expansion-transformation effect, causing the maximum fracture length to increase from 48.90 mm to 83.74 mm, the fracture number to increase from 35,183 to 92,159, the fracture volume to increase from 158.12 mm3 to 6436.87 mm3, and the fracture surface area to increases from 7733.05 mm2 to 110,585.06 mm2.
After CO2-PTF, the fractal dimension for fracture number increases from 2.3523 to 2.3668, and the fractal dimension for fracture volume increases from 2.8440 to 2.9040, which reflects the increased connectivity between three-dimensional fractures.
The volume and surface area of fractures with a length of less than 140 μm are reduced under the influence of the fracture expansion-transformation effect. The fracture expansion-transformation effect and fracture generation effect jointly promote a significant increase in the volume and surface area of fractures with a length greater than 140 μm. The 140 μm is the critical value for the fracture expansion-transformation effect and fracture generation effect.
The early dynamic high-pressure gas jet stage of CO2-PTF coal promotes the generation of 3D fractures, and the subsequent quasi-static high-pressure gas stage promotes the expansion transformation of 3D fractures.
We proposed the five indicators to evaluate the 3D fracture evolution characteristics in coal caused by CO2-PTF, which can provide theoretical and methodological references for researching the fracture evolution characteristics of other unconventional natural gas reservoirs and their reservoir stimulation.

Author Contributions

Conceptualization, G.L. and P.C.; Data Curation, Z.Z., J.L. and G.B.; Formal Analysis, Z.Z., J.L. and G.B.; Funding Acquisition, G.L.; Methodology, Z.Z., J.L., G.B. and P.C.; Supervision, G.L. and P.C.; Visualization, Z.Z.; Writing—Original Draft, Z.Z. and G.L.; Writing—Review and Editing, G.L. and P.C. All authors have read and agreed to the published version of the manuscript.

Funding

This research was supported by the National Natural Science Foundation of China (No. 42230814 and No. 42372204), the China Scholarship Council (No. 202308410549), the Henan Province International Science and Technology Cooperation Project (No. 242102520034), the Henan Province Science and Technology Research Project (No. 242102320365) and the Key Research Projects of Higher Education Institutions in Henan Province (No. 24B170005).

Data Availability Statement

The data presented in this study are available from the corresponding author upon request.

Conflicts of Interest

The authors declare no conflicts of interest.

Abbreviations

CO2-PTFCO2 phase transition fracturing
CTComputed Tomography
CO2-PTF coalCO2 phase transition fracturing coal
CBMcoalbed methane
SEMScanning Electron Microscope
2Dtwo-dimensional
3Dthree-dimensional
DMdamage mark
FRWfour-radial-wing fractures
TRWtri-radial-wing fractures
Φcoal pillar diameter
Lifracture length
N(Li)the number of fractures with a fracture length greater than Li
C1fitting constant
DNfractal dimension for fracture number
Athe surface area of the fracture
Vthe volume of the fracture
DVfractal dimension for the 3D fracture volume
C2fitting constant
Nfracture number
Lmaxthe maximum fracture length

References

  1. Lu, Y.; Zhang, H.; Zhou, Z.; Ge, Z.; Chen, C.; Hou, Y.; Ye, M. Current status and effective suggestions for efficient exploitation of coalbed methane in China: A review. Energy Fuels 2021, 35, 9102–9123. [Google Scholar] [CrossRef]
  2. Wang, X.; Zhou, F.; Ling, Y.; Xiao, Y.; Ma, B.; Ma, X.; Yu, S.; Liu, H.; Wei, K.; Kang, J. Overview and outlook on utilization technologies of low-concentration coal mine methane. Energy Fuels 2021, 35, 15398–15423. [Google Scholar] [CrossRef]
  3. Allen, D.T.; Chen, Q.; Dunn, J.B. Consistent metrics needed for quantifying methane emissions from upstream oil and gas operations. Environ. Sci. Technol. Lett. 2021, 8, 345–349. [Google Scholar] [CrossRef]
  4. Cheng, Y.; Pan, Z. Reservoir properties of Chinese tectonic coal: A review. Fuel 2020, 260, 116350. [Google Scholar] [CrossRef]
  5. Liu, G.; Liu, H.; Xian, B.; Gao, D.; Wang, X.; Zhang, Z. Fuzzy pattern recognition model of geological sweetspot for coalbed methane development. Pet. Explor. Dev. 2023, 50, 924–933. [Google Scholar] [CrossRef]
  6. Sampath, K.; Perera, M.; Ranjith, P.; Matthai, S.; Rathnaweera, T.; Zhang, G.; Tao, X. CH4-CO2 gas exchange and supercritical CO2 based hydraulic fracturing as CBM production-accelerating techniques: A review. J. CO2 Util. 2017, 22, 212–230. [Google Scholar] [CrossRef]
  7. Yuan, L. Control of coal and gas outbursts in Huainan mines in China: A review. J. Rock Mech. Geotech. Eng. 2016, 8, 559–567. [Google Scholar] [CrossRef]
  8. Zhou, F.; Xia, T.; Wang, X.; Zhang, Y.; Sun, Y.; Liu, J. Recent developments in coal mine methane extraction and utilization in China: A review. J. Nat. Gas Sci. Eng. 2016, 31, 437–458. [Google Scholar] [CrossRef]
  9. Weir, P.; Edwards, J. Mechanical loading and Cardox revolutionize an old mine. Coal Age 1928, 33, 288–290. [Google Scholar]
  10. Singh, S. Non-explosive applications of the PCF concept for underground excavation. Tunn. Undergr. Space Technol. 1998, 13, 305–311. [Google Scholar] [CrossRef]
  11. Dong, Q.; Wang, Z.; Han, Y.; Sun, X. Research on TNT equivalent of liquid CO2 phase-transition fracturing. China Saf. Sci. J. 2014, 24, 84–88. [Google Scholar]
  12. Lu, T.; Wang, Z.; Yang, H.; Yuan, P.; Han, Y.; Sun, X. Improvement of coal seam gas drainage by under-panel cross-strata stimulation using highly pressurized gas. Int. J. Rock Mech. Min. Sci. 2015, 77, 300–312. [Google Scholar] [CrossRef]
  13. Chen, H.; Wang, Z.; Chen, X.; Chen, X.; Wang, L. Increasing permeability of coal seams using the phase energy of liquid carbon dioxide. J. CO2 Util. 2017, 19, 112–119. [Google Scholar] [CrossRef]
  14. Mojid, M.R.; Negash, B.M.; Abdulelah, H.; Jufar, S.R.; Adewumi, B.K. A state–of–art review on waterless gas shale fracturing technologies. J. Pet. Sci. Eng. 2021, 196, 108048. [Google Scholar] [CrossRef]
  15. Cai, Y.; Liu, D.; Pan, Z.; Yao, Y.; Li, J.; Qiu, Y. Pore structure and its impact on CH4 adsorption capacity and flow capability of bituminous and subbituminous coals from Northeast China. Fuel 2013, 103, 258–268. [Google Scholar] [CrossRef]
  16. Moore, T.A. Coalbed methane: A review. Int. J. Coal Geol. 2012, 101, 36–81. [Google Scholar] [CrossRef]
  17. Mohanty, M.M.; Pal, B.K. Sorption behavior of coal for implication in coal bed methane an overview. Int. J. Min. Sci. Technol. 2017, 27, 307–314. [Google Scholar] [CrossRef]
  18. Bai, X.; Zhang, D.; Zeng, S.; Zhang, S.; Wang, D.; Wang, F. An enhanced coalbed methane recovery technique based on CO2 phase transition jet coal-breaking behavior. Fuel 2020, 265, 116912. [Google Scholar] [CrossRef]
  19. Xia, B.; Liu, X.; Song, D.; He, X.; Yang, T.; Wang, L. Evaluation of liquid CO2 phase change fracturing effect on coal using fractal theory. Fuel 2021, 287, 119569. [Google Scholar] [CrossRef]
  20. Liu, H.; Liu, G.; Zhang, Z.; Li, B.; Si, N.; Guan, W.; Lin, J. Effects of Liquid CO2 Phase Transition Fracturing on Mesopores and Micropores in Coal. Energy Fuels 2022, 36, 10016–10025. [Google Scholar] [CrossRef]
  21. Cao, Y.; Zhang, J.; Zhai, H.; Fu, G.; Tian, L.; Liu, S. CO2 gas fracturing: A novel reservoir stimulation technology in low permeability gassy coal seams. Fuel 2017, 203, 197–207. [Google Scholar] [CrossRef]
  22. Cao, Y.; Zhang, J.; Zhang, X.; Liu, S.; Elsworth, D. Micro-fractures in coal induced by high pressure CO2 gas fracturing. Fuel 2022, 311, 122148. [Google Scholar] [CrossRef]
  23. Liu, X.; Wang, Z.; Song, D.; He, X.; Yang, T. Variations in surface fractal characteristics of coal subjected to liquid CO2 phase change fracturing. Int. J. Energy Res. 2020, 44, 8740–8753. [Google Scholar] [CrossRef]
  24. Liao, Z.; Liu, X.; Song, D.; He, X.; Nie, B.; Yang, T.; Wang, L. Micro-structural damage to coal induced by liquid CO2 phase change fracturing. Nat. Resour. Res. 2021, 30, 1613–1627. [Google Scholar] [CrossRef]
  25. Laubach, S.; Marrett, R.; Olson, J.; Scott, A. Characteristics and origins of coal cleat: A review. Int. J. Coal Geol. 1998, 35, 175–207. [Google Scholar] [CrossRef]
  26. Wang, Z.; Pan, J.; Hou, Q.; Yu, B.; Li, M.; Niu, Q. Anisotropic characteristics of low-rank coal fractures in the Fukang mining area, China. Fuel 2018, 211, 182–193. [Google Scholar] [CrossRef]
  27. Huy, P.Q.; Sasaki, K.; Sugai, Y.; Ichikawa, S. Carbon dioxide gas permeability of coal core samples and estimation of fracture aperture width. Int. J. Coal Geol. 2010, 83, 1–10. [Google Scholar] [CrossRef]
  28. Liu, P.; Nie, B.; Zhao, Z.; Zhao, Y.; Li, Q. Characterization of ultrasonic induced damage on multi-scale pore/fracture in coal using gas sorption and μ-CT 3D reconstruction. Fuel 2023, 332, 126178. [Google Scholar] [CrossRef]
  29. Wang, X.; Pan, J.; Wang, K.; Mou, P.; Li, J. Fracture variation in high-rank coal induced by hydraulic fracturing using X-ray computer tomography and digital volume correlation. Int. J. Coal Geol. 2022, 252, 103942. [Google Scholar] [CrossRef]
  30. Liu, G.; Zhang, Z.; Cao, Y.; Wang, X.; Liu, H.; Li, B.; Si, N.; Guan, W. An Analogical Method on Fractal Dimension for Three-Dimensional Fracture Tortuosity in Coal Based on Ct Scanning. Fractals 2023, 31, 2350072. [Google Scholar] [CrossRef]
  31. Mazumder, S.; Wolf, K.-H.; Elewaut, K.; Ephraim, R. Application of X-ray computed tomography for analyzing cleat spacing and cleat aperture in coal samples. Int. J. Coal Geol. 2006, 68, 205–222. [Google Scholar] [CrossRef]
  32. Mathews, J.P.; Campbell, Q.P.; Xu, H.; Halleck, P. A review of the application of X-ray computed tomography to the study of coal. Fuel 2017, 209, 10–24. [Google Scholar] [CrossRef]
  33. Karacan, C.; Okandan, E. Adsorption and gas transport in coal microstructure: Investigation and evaluation by quantitative X-ray CT imaging. Fuel 2001, 80, 509–520. [Google Scholar] [CrossRef]
  34. Zhang, Z.; Liu, G.; Chang, P.; Wang, X.; Lin, J. Fractal characteristics for coal chemical structure: Principle, methodology and implication. Chaos Solitons Fractals 2023, 173, 113699. [Google Scholar] [CrossRef]
  35. Yu, B. Analysis of flow in fractal porous media. Appl. Mech. Rev. 2008, 61, 050801. [Google Scholar] [CrossRef]
  36. Zhang, Z.; Liu, G.; Wang, X.; Lv, R.; Liu, H.; Lin, J.; Barakos, G.; Chang, P. A fractal Langmuir adsorption equation on coal: Principle, methodology and implication. Chem. Eng. J. 2024, 488, 150869. [Google Scholar] [CrossRef]
  37. Fu, Y.; Chen, X.; Feng, Z. Characteristics of coal-rock fractures based on CT scanning and its influence on failure modes. J. China Coal Soc. 2020, 45, 568–578. [Google Scholar]
  38. Roy, A.; Perfect, E.; Dunne, W.M.; McKay, L.D. Fractal characterization of fracture networks: An improved box-counting technique. J. Geophys. Res. Solid Earth 2007, 112, B12201. [Google Scholar] [CrossRef]
  39. Zhang, Z.; Liu, G.; Wang, X.; Li, B.; Liu, H. Fractal Characterization On Fracture Volume In Coal Based On Ct Scanning: Principle, Methodology, And Implication. Fractals 2022, 30, 2250124. [Google Scholar] [CrossRef]
  40. Du, F.; Wang, K.; Zhang, G.; Zhang, Y.; Zhang, G.; Wang, G. Damage characteristics of coal under different loading modes based on CT three-dimensional reconstruction. Fuel 2022, 310, 122304. [Google Scholar] [CrossRef]
  41. Sun, L.; Zhang, C.; Wang, G.; Huang, Q.; Shi, Q. Research on the evolution of pore and fracture structures during spontaneous combustion of coal based on CT 3D reconstruction. Energy 2022, 260, 125033. [Google Scholar] [CrossRef]
  42. Zhang, K.; Wang, S.; Wang, L.; Cheng, Y.; Li, W.; Han, X.; Liu, C.; Su, H. 3D visualization of tectonic coal microstructure and quantitative characterization on topological connectivity of pore-fracture networks by Micro-CT. J. Pet. Sci. Eng. 2022, 208, 109675. [Google Scholar] [CrossRef]
  43. Shang, Z.; Wang, H.; Li, B.; Cheng, Y.; Zhang, X.; Wang, Z.; Geng, S.; Wang, Z.; Chen, P.; Lv, P. The effect of leakage characteristics of liquid CO2 phase transition on fracturing coal seam: Applications for enhancing coalbed methane recovery. Fuel 2022, 308, 122044. [Google Scholar] [CrossRef]
  44. Zhang, Y.; Deng, H.; Ke, B.; Gao, F. Research on the explosion effects and fracturing mechanism of liquid carbon dioxide blasting. Min. Metall. Explor. 2022, 39, 521–530. [Google Scholar] [CrossRef]
  45. Shang, Z.; Wang, H.; Li, B.; Cheng, Y.; Zhang, X.; Zhao, F.; Zhang, X.; Hao, C.; Wang, Z. Fracture processes in coal measures strata under liquid CO2 phase transition blasting. Eng. Fract. Mech. 2021, 254, 107902. [Google Scholar] [CrossRef]
  46. Cao, Y.; Zhang, J.; Tian, L.; Zhai, H.; Fu, G.; Tang, J. Research and application of CO2 gas fracturing for gas control in low permeability coal seams. J. China Coal Soc. 2017, 42, 2631–2641. [Google Scholar]
  47. Yang, R.; Ding, C.; Yang, L.; Lei, Z.; Zhang, Z.; Wang, Y. Visualizing the blast-induced stress wave and blasting gas action effects using digital image correlation. Int. J. Rock Mech. Min. Sci. 2018, 112, 47–54. [Google Scholar] [CrossRef]
  48. Li, Y.; Ji, H.; Li, G.; Hu, S.; Liu, X. Effect of supercritical CO2 transient high-pressure fracturing on bituminous coal microstructure. Energy 2023, 282, 128975. [Google Scholar] [CrossRef]
  49. Wang, D.; Zeng, F.; Wei, J.; Zhang, H.; Wu, Y.; Wei, Q. Quantitative analysis of fracture dynamic evolution in coal subjected to uniaxial and triaxial compression loads based on industrial CT and fractal theory. J. Pet. Sci. Eng. 2021, 196, 108051. [Google Scholar] [CrossRef]
  50. Karra, S.; O’Malley, D.; Hyman, J.; Viswanathan, H.S.; Srinivasan, G. Modeling flow and transport in fracture networks using graphs. Phys. Rev. E 2018, 97, 033304. [Google Scholar] [CrossRef]
  51. Jafari, A.; Babadagli, T. Estimation of equivalent fracture network permeability using fractal and statistical network properties. J. Pet. Sci. Eng. 2012, 92, 110–123. [Google Scholar] [CrossRef]
  52. Miao, T.J.; Yu, B.M.; Duan, Y.G.; Fang, Q.T. A fractal analysis of permeability for fractured rocks. Int. J. Heat Mass Transf. 2015, 81, 75–80. [Google Scholar] [CrossRef]
Figure 1. Experimental system of CO2 phase transition fracturing.
Fractalfract 08 00273 g001
Figure 2. CT scanning of samples.
Fractalfract 08 00273 g002
Figure 3. 2D Fractures induced by CO2-PTF coal: (a,b) are the 2D fractures of coal PR, (c,d) are the 2D fractures of coal PF.
Fractalfract 08 00273 g003
Figure 4. 3D Fracture in coal before and after CO2-PTF: (a,b) are the 3D fractures of coal PR, (c,d) are the 3D fractures of coal PF.
Fractalfract 08 00273 g004
Figure 5. Fractal dimension DN for 3D fracture number: (a) PR, (b) PF.
Fractalfract 08 00273 g005
Figure 6. Fractal dimension DV for 3D fracture volume: (a) PR, (b) PF.
Fractalfract 08 00273 g006
Figure 7. Variation of the 3D fracture structure parameters before and after CO2-PTF: (a) maximum fracture length, (b) fracture number, (c) fracture volume, (d) fracture surface area.
Fractalfract 08 00273 g007
Figure 8. Evolution of 3D fracture volume and surface area: (a) cumulative volume of fracture, (b) cumulative surface area of fracture.
Fractalfract 08 00273 g008
Figure 9. Comparison of fracture volume and surface area with the fracture length 0.14mm as the boundary: (a) fracture volume with fracture length less than 0.14 mm, (b) fracture volume with fracture length greater than 0.14 mm, (c) fracture surface area with fracture length less than 0.14 mm, (d) fracture surface area with fracture length greater than 0.14 mm.
Fractalfract 08 00273 g009
Figure 10. 3D fracture evolution of CO2-PTF coal.
Fractalfract 08 00273 g010
Figure 11. Five indicators for evaluating the 3D fracture evolution of CO2-PTF coal.
Fractalfract 08 00273 g011
Disclaimer/Publisher’s Note: The statements, opinions and data contained in all publications are solely those of the individual author(s) and contributor(s) and not of MDPI and/or the editor(s). MDPI and/or the editor(s) disclaim responsibility for any injury to people or property resulting from any ideas, methods, instructions or products referred to in the content.

