
Study on the Effect of Pore Evolution on the Coal Spontaneous Combustion Characteristics in Goaf
1
Yazhou Bay Innovation Institute, Hainan Tropical Ocean University, Sanya 572024, China
2
International Navigation College, Hainan Tropical Ocean University, Sanya 572022, China
3
College of Safety and Environmental Engineering, Shandong University of Science and Technology, Qingdao 266590, China
4
School of Resource, Environment and Safety Engineering, Hunan University of Science and Technology, Xiangtan 411201, China
*
Author to whom correspondence should be addressed.
Fire 2024, 7(5), 164; https://doi.org/10.3390/fire7050164
Submission received: 27 March 2024
/
Revised: 4 May 2024
/
Accepted: 5 May 2024
/
Published: 8 May 2024
(This article belongs to the Special Issue Mechanism of Coal Spontaneous Combustion in Goaf and Mine Fire Prevention)
Abstract
:Understanding the characteristics of coal spontaneous combustion (CSC) in goaf under different porosities is crucial for comprehending the mechanism of CSC and its prevention and control. In this paper, a multi-field coupled model of CSC in the goaf, considering porosity variation, is developed to investigate the effect of porosity on the CSC characteristics in the goaf. The results indicate that, as the goaf depth increases, both porosity and permeability decrease. When the highest goaf porosity is 25%, the average airflow velocity is between 0.00134 and 0.00139 m/s. In contrast, the average airflow velocity in the goaf with a porosity of 40% is approximately six times greater than that of the goaf with a porosity of 25%. As the goaf porosity increases, the overall oxygen concentration, temperature, and oxidized zone area also rise. Moreover, the oxidation zone area can be quantified and visualized, thereby enabling more effective prediction of the CSC risk in the goaf. The findings of the study have a positive significance in guiding the prevention and control of coal fires.
1. Introduction
Due to the gradual depletion of shallow coal resources, coal mining in China has reached depths of 1000–2000 m, entering the stage of deep mining. The high ground pressure and temperature in deep mines increase the likelihood of spontaneous combustion in coal seams, which can result in mine fires, gas explosions, dust explosions, and other secondary accidents [1]. The goaf is a region where coal spontaneous combustion (CSC) occurs frequently, and its interior is a nonlinear flow field that includes turbulence, laminar flow, and transitional flow. CSC is the consequence of the paradoxical development between heat production via coal oxidation and heat dissipation to the environment, and associated factors can affect the process [2,3], such as coal rank, rock composition, sulfur content, water content, pore structure, and gas content. During coal self-heating, heat collects in the coal body, leading to thermal expansion of the matrix, evaporation of water and precipitation of volatiles. As the self-heating reaction progresses, thermal damage occurs to the coal body structure, resulting in alterations to the permeability of the coal body. Concurrently, the heat accumulated on the coal surface heats the coal body once more, causing further thermal damage. Following the volatiles’ combustion, the newly formed coal body structure provides an optimal conduit for fresh external air, facilitating further combustion of the coal body [4]. When a fire occurs in goaf, the surrounding coal seams are heated and damaged, especially the protective coal pillars between the working faces [5]. If the coal pillar is not wide enough, a large amount of fissure-porosity space can be created between the fire zone and the adjacent mining area or ventilation roadway. By the action of hot wind pressure, a large amount of fresh air from outside will flow into the fire central area through these fissure-porosity channels, intensifying the development of the coal fire. The goaf is a porous medium composed of residual coal and fractured rock, which together influence the size and spatial distribution of porosity and permeability [6,7]. During the initial stage of CSC, the low oxygen content inside the goaf hinders the CSC. However, when the pore structure of the goaf changed, air leakage provided sufficient oxygen to the goaf, thereby promoting the CSC. In this process, air leakage from goaf, spontaneous combustion of the coal body, and energy exchange between the coal and gas all affect the distribution of the flow field in goaf. Furthermore, the oxygen consumed by goaf combustion alters the flow field distribution, which is a multi-field coupling process. Consequently, it is essential to investigate the impact of pore alterations on the characteristics of goaf CSC, which is of practical significance for fire prevention and suppression in goaf.
An accurate prediction of the CSC process is crucial for fire prevention and suppression in the goaf, and appropriate mathematical descriptions can help to further understand the CSC mechanism [8,9]. Many extensive mathematical models are currently available for the prediction of the CSC process, including analyses in different dimensions, steady state and unsteady state [10]. However, existing models have mainly focused on coal piles and coal seams [11], with less attention paid to the CSC process in the goaf. Furthermore, in previous studies of goaf CSC, the actual state parameters of the goaf, such as coal physical parameters, ventilation parameters, and the spatial evolution of porosity and permeability, have not been adequately considered. Through CFD modeling, Tutak [12] investigated the effect of rock compressive strength on the CSC characteristics in Y-ventilated goaf, and used the oxygen concentration as the basis for delineating the three zones of CSC in the goaf, but did not take into account the spatial distribution of the oxidation zone. Taraba [13] developed a three-dimensional single-phase model to characterize the coal oxidation process in the goaf, but has not yet considered the nonequilibrium heat transfer between the gas-solid phases. Zhang [14] developed a model of goaf CSC with dynamic change of porosity using a combination of discrete and finite elements to obtain the airflow distribution and risk zones in the goaf. However, the model is considered as an isothermal process and does not take into account heat transfer or heat release from coal reactions. Lei [15] developed a model for goaf CSC during working face advancement and investigated the effect of advancement speed on the flow and temperature fields in the goaf, but did not consider the evolution of the CSC risk in the goaf. With COMSOL 5.5 software, Wang [16] simulated the dynamic evolution of the high-temperature zone during CSC, but did not consider the dynamic evolution of porosity and permeability in the goaf. Based on the above brief review, previous studies have approached the prediction of the process of goaf CSC from different perspectives but have not yet addressed the complete interaction between non-Darcy flow and heat transport of gases in the gas–solid phase in the goaf under in situ conditions. The collective effect of these interactions on the characteristics of goaf CSC is unclear, and this knowledge gap defines the goal of this study.
Therefore, on the basis of the original study, a multi-field coupled model of CSC in the goaf was established, which takes into account the mutual and complex interactions between porosity change, gas component transportation and energy transfer in the goaf. Additionally, the area distribution of the oxidation zone was quantified and visualized, which enabled the accurate characterization of the CSC risk under the change of pore space in the goaf. This study effectively predicts the development process of coal seam collapse (CSC) in the goaf due to conditions such as high geo-stress or mining. The use of the oxidized zone area as an important indicator of the CSC risk in the goaf improves the efficiency of fire prevention and control.
2. Governing Equations for Goaf CSC
2.1. Momentum Conservation Equation
Due to the non-uniform distribution of the rocks in goaf, the gas exhibits different movement trends in different regions. The coal and rock on the near working face of the goaf are loose, and the wind flow is turbulent due to the large void space between them. The coal and rock in the deep part of the goaf are compacted, resulting in laminar wind flow due to the small gap space between them. The coal and rock in the region between the loose and compacted zones are in a transitional state, and the wind flow in this region is transitioning from turbulent to laminar flow [17,18]. The conventional Darcy’s law only applies to laminar movement in the central and deeper parts of goaf, where wind movement is dominated by gas viscous forces [19,20]. However, the turbulence state in the loose zone is more complicated and, in addition to the gas viscous force, the movement of the wind flow in this region is also affected by the medium resistance of the coal and rock, the pressure difference, the gas density and other factors. The conventional Darcy’s law is no longer able to describe the movement state of the turbulent flow, while this region is the important region for the goaf CSC. Therefore, based on the properties of the porous medium and the complex fluid movement state inside the goaf, the momentum conservation equation is as follows [20]:
where is the kinetic viscosity coefficient of goaf gas, kg/(m·s); is the Forchheimer coefficient, kg/m4; F is the volumetric force, N/m3; and is the velocity modulus of the gas transport in goaf, m/s. Mainly related to the structure of porous medium and the properties of fluid [21]:
where is the density of the goaf gas, kg/m3; and is the friction coefficient of the goaf gas, .
2.2. Mass Conservation Equation
The mass conservation equation for any gas component inside goaf is satisfied as follows [11]:
where represents the each gas component in goaf, such as CH4, O2, CO and CO2, etc.; is the concentration, mol/m3; W is the source term, mol/(m3·s); c is the concentration of the mixed gas components in goaf, mol/m3, c = p/RTg; R is the universal gas constant, J/(mol·K); vg is the velocity vector, m/s; Tg is the gas temperature, K; t is the time, s; is the diffusion coefficient tensor, m2/s, which can be expressed as [22]:
where is the Kronecker symbol; vgx and vgy are the gas flow velocity components in the x and y directions, m/s, respectively; and are the longitudinal and transverse dispersion of the gas, m, respectively; is the tortuosity of the porous medium, dimensionless; and is the molecular diffusion coefficient, m2/s. The chemical composition of coal exhibits considerable variation with respect to its rank and source. It is challenging to ascertain the precise correlation between the rate of gas production and oxygen consumption. During the initial stages of coal oxidation, the chemical reaction equation can be expressed as follows:
The oxygen transport in goaf is affected by CSC, and the source term of the gas component equation is the oxidative oxygen consumption of the coal body in goaf, which can be obtained by the Arrhenius equation [23]:
where n is the porosity; A is the finger forward factor for gangue oxidation, 1/s; Ea is the activation energy, kJ/mol; Ts is the solid temperature, K; and is the oxygen concentration, mol/m3.
2.3. Energy Conservation Equation
The temperature variation in goaf mainly originates from the exothermic effect of the coal–oxygen reaction, and the heat accumulation causes the heat exchange between the wind flow and the coal body. According to the principle of energy conservation, the heat transfer between the coal body and the multiple gases in goaf can be expressed as [24]:
where the subscripts s and g represent the solid and gas phases of goaf, respectively; cp is the specific heat capacity, J/(kg·K); k is the thermal conductivity, J/(m·s·K); T is the temperature, K; QT is the heat source term in goaf, J/(m3·s); asg is the specific surface area of the porous medium in goaf, m−1; and hsg is the heat transfer coefficient at the gas–solid interface, J/(m2·s·K).
The QT is mainly the result of the combined effect of the heat released from the oxidation of the coal body and the heat exchange of the top and bottom plates, thus the heat accumulated in goaf can be expressed as [11,22]:
where Q is the reaction heat of coal oxidation, J/mol; and Tw is the temperature of the top or bottom plate, K.
2.4. Cross-Coupling Relationship
Equation (1) can describe the non-Darcy seepage process in goaf, Equation (3) can describe the gas transport process in goaf, and the coupling Equations (6) and (7) are used to describe the gas–solid energy transport in goaf. The coupling between them is achieved by modelling the evolution of goaf porosity, as shown in Figure 1.
3. Model Construction and Validation
3.1. Engineering Overview
The Yunhe Coal Mine is a production mine owned by the Jining Mining Group Co. (Xiamen, China). It is located in Jining City, Shandong Province, China. The 1302 working face is the 4th working face in the first mining area of Yunhe Coal Mine, with the 1301 and 1303 comprehensive mining areas above and below it, respectively. The #3 coal seam, which has an average thickness of about 9 m and ranges between 6.3 m and 9.3 m, is mined at the working face. The working face has a strike length of 1110 m and an inclined length of 140 m. The mine is a storm and low-gas mine, with a coal dust explosion index of 34%, an absolute gas outflow of 0.66 m3/min from the working face, and the natural ignition period of the coal seam is from March to June [26]. During mining, an open fire was discovered in the upper corner of the working face. This was mainly caused by the spontaneous combustion of a large amount of residual coal inside the goaf, which then spread to the working face. Air leakage is a significant factor in the development of goaf CSC, and porosity plays a crucial role in air leakage in goaf [27]. Consequently, we conducted an investigation into the impact of porosity on the characteristics of the goaf CSC, with a focus on the change in porosity resulting from the CSC.
3.2. Assumptions and Physical Modelling
To simplify the problem of goaf CSC and reduce calculation time, the following assumptions are made:
- (1)
- The gas movement in goaf conforms to the non-Darcy Forchheimer’s law, and the oxygen consumption for coal oxidation is determined using the Arrhenius equation.
- (2)
- The gas in the goaf is considered an ideal gas, and the impact of temperature on its kinetic viscosity is disregarded.
- (3)
- Disregarding the gas outflow from the goaf and other gases (CO, CO2, CH4, SO2 and NOX, etc.) produced during CSC, the gases in the goaf are mainly air.
- (4)
- The goaf is simplified to a two-dimensional non-homogeneous porous medium flow field.
- (5)
- Using the 1302 working face as an example, a physical model was established, as shown in Figure 2. The inlet and return airway measure 4 m in width and 8 m in length, the working face measures 7 m in width and 132 m in length, and the goaf measures 140 m in width and 150 m in length. The simulation boundaries and parameters for goaf CSC are shown in Table 1 and Table 2.
3.3. Permeability Evolution of Goaf
Affected by factors such as mining, crustal stress, and CSC, the coal rock in goaf undergoes compression deformation and fracture, forming a caving zone, fracture zones, and curved subsidence zones in the vertical direction of the goaf [28,29]. The irregular arrangement of collapsed coal rocks and residual coal in the caving zone creates a specific void space under the influence of geology, mining, and coal rock properties. The densification of coal rock increases over time, reducing void space and the rock expansion coefficient in the caving zone, accompanied by the reduction of goaf permeability. We use the “O” ring theory of caving zone, and the expansion coefficient of the fallout coal rock is [22,30]:
where KP(x,y) is the expansion coefficient, dimensionless; is the initial value of the KP(x,y), dimensionless; is the compaction expansion coefficient, dimensionless; a is the decay rate of expansion coefficient, m−1; d is the distance from any point to a specific location in goaf, m; and is the adjustment factor for the “O” ring shape.
Assuming that the permeability within the extraction zone is homogeneous and isotropic, the relationship between permeability (k) and n in the goaf can be expressed by the Blake-Kozeny equation [32]:
where dp is the particle diameter of the porous medium in the goaf, m.
Setting a0 = 0.0368, a1 = 0.268, and dp = 0.04 m, the spatial distribution of the expansion coefficient, porosity and permeability of the goaf is obtained, as shown in Figure 3.
3.4. Parameter Setting
Combined with the results of previous studies [33,34,35,36], we established a multi-field coupled model of CSC in conformity with the 1302 working face. The activation energy of the CSC reaction was taken from the thermodynamic parameters of the Sample S1 in the literature [36], and its approximate analysis is shown in Table 1 and used to determine the activation energy of the CSC reaction. The solid- and gas-phase parameters from the literature [35] were used to determine the physicochemical parameters of the solids and gases. The initial boundary conditions and numerical simulation parameters are shown in Table 2 and Table 3, and the model grid is shown in Figure 2. For the numerical calculations, 5014 grid cells were set up and the grid was analyzed for skewness, where the closer the skewness to 1 represented the higher quality of the grid. As shown in Figure 2, the minimum mass of the grid cell is 0.5662 and the average mass is 0.913, so the grid quality of the model is relatively good. The calculation step was set to 2.4 h, and the simulated CSC time was 240 h, taking into account the calculation accuracy and computing cost.
3.5. Model Validation
The distribution of airflow velocity, streamlines, and oxygen concentration in the goaf is presented in Figure 4. The results show that: (1) the wind flow enters into the goaf from the down corner of the working face, and then flows out from the upper corner near the working face; the airflow velocity at the down corner is about 1 m/s, and the airflow velocity at the upper corner is about 2 m/s. (2) The oxygen concentration is asymmetrically distributed inside the goaf, which is similar to the measured results. (3) According to the oxygen concentration, there is a clear distribution of “three zones” in the goaf, which is also similar to the field observations at the Yunhe Mine.
To further verify the accuracy of the numerical model, the distribution of oxygen concentration in goaf obtained from the simulation was compared with the measured data from the Yunhe Coal Mine, as shown in Figure 5. The gas collection is carried out through the pre-buried pipeline method in the Yunhe coal mine’s goaf, and the AD509 temperature measurement system and the beam pipe monitoring system are used as the means of on-site measurement and adopting the measurement method of distributing the points along the whole line of the tendency of the working face. Three sampling points were arranged, which were 35 m, 70 m and 105 m away from the down corner of the working face respectively. It can be seen that the simulation results are in good agreement with the measured results. Therefore, the numerical model can characterize the goaf CSC.
4. Results and Discussion
4.1. Spatial Distribution of Porosity and Permeability
The impact of pore evolution on CSC characteristics in the goaf was studied by altering the pore distribution, with the maximum porosity set at 25%, 30%, 35%, and 40%. Taking the centerline of the goaf as the reference (75 m from the down corner), the distribution of the porosity and permeability of the cavitation zone with the depth of the goaf under different porosity is shown in Figure 6. For instance, the extraction zone’s maximum porosity is 25%, which gradually decreases to 8.27% with depth. The distribution of goaf pore with different porosity has a similar trend, and the lowest porosities corresponding to the highest porosities in the goaf of 30%, 35%, and 40% are 9.93%, 11.58%, and 13.24%, respectively. The permeability of the goaf is distributed spatially in a manner similar to the distribution of porosity. When the highest porosity is 25%, the permeability is highest near the working face side (5.48 × 10⁻⁷ m2/s), and then it decreases with increasing goaf depth, reaching a minimum of 1.33 × 10⁻⁸ m2/s. The goaf highest permeability corresponding to the highest porosity of 30%, 35%, and 40% is 1.09 × 10⁻⁶ m2/s, 2.00 × 10⁻⁶ m2/s, and 5.48 × 10⁻⁷ m2/s, respectively, and the corresponding lowest permeability is 2.38 × 10⁻⁸ m2/s, 3.95 × 10⁻⁸ m2/s, and 6.08 × 10⁻⁶ m2/s, respectively. In addition, the goaf permeability at different porosity varies near the working face (<60 m), indicating that the wind flow variations are more significant in this region.
Overall, porosity and permeability of the goaf decrease with increasing goaf depth. The overall porosity of the goaf increases more steadily as the porosity increases, the higher the goaf porosity, the higher its overall permeability.
4.2. Spatial Distribution of Oxygen Concentration and Airflow Velocity
Figure 7 shows the spatial distribution of oxygen concentration with time in the goaf with different porosity. It can be seen that the wind flow leaks into the goaf through the down corner of working face and spreads to the return side of the goaf. Theoretically, in the absence of goaf CSC, the fresh airflow from the leakage will gradually spread oxygen throughout the goaf. When CSC occurs, a large amount of oxygen will begin to be consumed near the CSC region and, as the coal–oxygen reaction intensifies, more oxygen is devoted to the CSC. Therefore, with the advancement of CSC, the oxygen concentration in the goaf will show a trend of “increasing and then decreasing” over time. Due to the effects of oxygen consumption by CSC and goaf permeability, oxygen does not eventually diffuse throughout the goaf, but instead appears in some regions with poor oxygen. At a porosity of 25%, the overall oxygen concentration in the goaf increased with time before the 7th day, after which the oxygen concentration decreased. This is because, before the 4th day, the air leakage brought fresh airflow to the goaf, resulting in a significant increase in oxygen concentration. From the 4th to the 7th day, the CSC consumed a large amount of oxygen, leading to a decrease in the oxygen concentration in the goaf. After the 7th day, the coal−oxygen reaction intensifies and consumes more oxygen, leading to a significant drop in oxygen concentration. The trend in oxygen concentration in the goaf with different porosity was similar, and the oxygen concentration showed an increase and then a decrease with time. The trend of oxygen concentration variation in goaf with different porosity is similar, with oxygen concentration first increasing and then decreasing over time. The higher the goaf porosity, the higher its overall oxygen concentration.
The variation of the average flow rate with goaf porosity is shown in Figure 8a. It can be seen that the average flow rate in the extraction zone remains stable with time. As the goaf porosity increases, the overall average flow rate changes significantly. When the highest goaf porosity is 25%, the average flow rate is between 0.00134 and 0.00139 m/s. The average flow rate with a goaf porosity of 30% is twice as high as that in the goaf porosity of 25%. Meanwhile, the increase in the average flow rate is more significant with further increase in goaf porosity; the average flow rate at the highest goaf porosity of 40% can reach up to 0.00806 m/s. It is evident that porosity greatly affects the airflow movement in goaf. Figure 8b shows the evolution of the average oxygen concentration with time e with different goaf porosity. The average oxygen concentration is strongly influenced by goaf porosity; the higher the goaf porosity, the higher the average oxygen concentration. The average oxygen concentration ranged from only 4.16% to 7.61% at 25% goaf porosity and from 11.04% to 15.62% at 40% goaf porosity. This is because, when the goaf porosity is low, the lower average flow rate makes the wind pressure difference inside smaller, resulting in insufficient oxygen that diffuses into the deeper part of the goaf. In addition, lower airflow velocities bring less oxygen to the goaf, which is not enough to sustain the CSC process. When the goaf porosity increases, the airflow velocity and oxygen concentration increase significantly, which promotes the CSC reaction. Overall, the increased goaf porosity results in a significant increase in flow rate and oxygen concentration, while the oxygen consumed by CSC is much lower than that produced by air leakage. Therefore, the higher the goaf porosity, the higher the average flow rate and average oxygen concentration.
4.3. Spatial Distribution of Temperature
Figure 9 shows the spatial distribution of temperature with time with different goaf porosity. It can be seen that variations in porosity can directly affect the CSC process. When the goaf porosity is low, less oxygen leaks into the mining area and is transported more slowly, and most of the oxygen mainly accumulates on the side of the mining region near the working face. Over passes, the coal rock near the working face reacts with oxygen, causing a rapidly increased temperature in the region. The temperature then gradually decreases along the deeper part of the goaf. As the goaf porosity increases, it provides sufficient oxygen for CSC. When the oxygen consumption of CSC is saturated, the coal rock near the high-temperature region will also heat up rapidly and spontaneously combust, thus there is a phenomenon in which the high-temperature region migrates to the deeper part of the goaf. When the porosity is 25%, the overall goaf temperature slightly increases with time before the 7th day, and then the temperature increases significantly. This is due to the fact that, during the 1st to 4th day, the leakage brought fresh airflow to the goaf, and the coal rock gradually stored heat and the overall temperature increased slightly. Over time, heat storage in the coal rock intensified and CSC began to occur on the near-leakage side, thus increasing the temperature substantially. The trend in temperature variations with different goaf porosity is similar, and the range of the high-temperature region gradually increases along the goaf depth as the porosity increases. Consequently, the higher the goaf porosity, the higher its overall temperature.
Figure 10 displays the relationship between average temperature and goaf porosity over time. The data indicates that, as goaf porosity increases, so does the average temperature. The goaf average temperature was 26.85–36.83 °C at 25% porosity and 26.85–42.465 °C at 40% porosity. When the goaf porosity is 25%, the average temperature is 26.85–36.83 °C, and, when the porosity is 40%, the average temperature of the goaf is 26.85–42.465 °C. This is because the increase in goaf porosity allows a significant increase in the oxygen concentration, which accelerates the CSC process. It follows that the higher the goaf porosity, the higher the average temperature.
4.4. Spatial Distribution of CSC Three Zones
Air leakage is a crucial factor that affects the goaf CSC. It provides oxygen for CSC and also takes away the goaf heat [37]. The concentration of oxygen is frequently utilized to classify the three zones of goaf CSC. The radiator zone corresponds to the region with an oxygen concentration greater than 18%, the oxidation zone corresponds to the region with an oxygen concentration between 10% and 18%, and the asphyxiation zone corresponds to the region with an oxygen concentration of less than 10% [38]. In this paper, oxygen concentration is used as an indicator for the delineation of the three zones.
Figure 11 shows the spatial variation of CSC three zone with time for different goaf porosity. When the goaf porosity is low, oxygen mainly accumulates on the side near the working face, and the CSC reaction consumes a large amount of oxygen, leading to the reduction in overall oxygen concentration, thus the range of radiator zone and asphyxiation zone decreases with time. With the rise in goaf porosity, the overall oxygen concentration increases, and the oxygen consumption rate by CSC is smaller than the amount of oxygen from air leakage; over time, even though the oxygen concentration decreases, it can still be maintained at a high level. As a result, the high porosity goaf has significantly higher regions of radiator and oxidation zones than the low porosity goaf. At a goaf porosity of 25%, the range of both the radiator and oxidation zones decreases with time, while the asphyxiation zone increases. The variation trend in the three zones with different goaf porosity are similar, with the three zones ranges showing a trend of low radiator and oxidation zones and higher asphyxiation zone over time. The higher the goaf porosity, the greater the range of the three zones.
The calculation of the CSC three zones’ area can be performed through the integration method, as shown in Figure 12. It is evident that the porosity has a significant impact on the area of the three zones. For instance, when the goaf porosity is 25%, the radiator and oxidation zones’ area decrease with time from 4105.75 m2 and 3928.24 m2 to 1200.41 m2 and 1951.11 m2, respectively. In contrast, the asphyxiation zone’s area increases with time from 12,951.10 m2 to 17,817.64 m2. The oxidation zone is the region where CSC occurs frequently and is the focus of much scholarly attention. When the goaf porosity is 25%, the variation in the oxidation zone area with time ranges from 1951.11 m2 to 3928.24 m2 only, whereas when the goaf porosity is 40%, the variation in the oxidation zone area with time ranges from 3699.07 m2 to 6156.88 m2. It can be seen that the higher the goaf porosity, the higher the oxidation zone area and the higher the CSC risk.
5. Conclusions
In this paper, a multi-field coupled model of goaf CSC is established to study the CSC characteristics under goaf pore space variation, which can quantitatively analyze the evolution of permeability, oxygen concentration, temperature, and the CSC’s three zones in goaf under the pore space variations. The results were well validated with the measured data. The main conclusions are as follows:
- (1)
- Both porosity and permeability decrease with increasing goaf depth. The goaf porosity is positively correlated with the permeability. When the goaf maximum porosity was increased from 25 to 40%, the average flow velocity increased by about 6 times. This demonstrates that porosity has a significant impact on air leakage in the goaf.
- (2)
- The oxygen concentration in the extraction zone increases as the porosity increases and exhibits a trend of initially increasing and then decreasing over time. Similarly, the temperature trend varies with different goaf porosities, increasing over time. As porosity increases, the high temperature zone gradually expands along the goaf depth.
- (3)
- Over time, the CSC three zones in the goaf exhibit a tendency to decrease in the radiator and oxidation zones, while increasing in the asphyxiation zone. The range of the CSC three zones is positively correlated with the goaf porosity. Specifically, the higher the goaf porosity, the greater the area of the oxidation zone and, consequently, the higher the CSC risk.
Author Contributions
Conceptualization, J.L.; methodology, J.L. and H.X.; software, J.L. and G.W.; validation, J.L., H.X. and G.W.; formal analysis, J.L.; investigation, H.X. and G.W.; data curation, G.W.; writing—original draft preparation, J.L.; writing—review and editing, J.L. and H.X.; supervision, J.L.; project administration, J.L.; funding acquisition, J.L. All authors have read and agreed to the published version of the manuscript.
Funding
This research was Supported by the Major Science and Technology Program of Yazhou Bay Innovation Institute of Hainan Tropical Ocean University (No. 2023CXYZD001), and the Research Project of Hainan Tropical Ocean University (RHDRC202330).
Institutional Review Board Statement
Not applicable.
Informed Consent Statement
Not applicable.
Data Availability Statement
Data is contained within the article.
Conflicts of Interest
The authors declare no conflicts of interest.
References
- Zhou, F. Study on the coexistence of gas and coal spontaneous combustion(Ⅰ):disaster mechanism. J. China Coal Soc. 2012, 37, 843–849. [Google Scholar]
- Pi, Z.; Li, R.; Guo, W.; Liu, X.; Zhang, Z.; Wang, Y.; Zhang, Y.; Yin, G.; Li, X. Experimental Study on the Influence of Pore Structure and Group Evolution on Spontaneous Combustion Characteristics of Coal Samples of Different Sizes During Immersion. ACS Omega 2023, 8, 22453–22465. [Google Scholar] [CrossRef] [PubMed]
- Said, K.O.; Onifade, M.; Genc, B.; Lawal, A.I.; Abdulsalam, J.; Githiria, J.M.; Bada, S. On the dependence of predictive models on experimental dataset: A spontaneous combustion studies scenario. Int. J. Min. Reclam. Environ. 2021, 35, 506–522. [Google Scholar] [CrossRef]
- Wu, G.; Yu, W.; Guo, H.; Pan, B.; Liu, X. Investigation on water inrush fracture mechanics model based on fracture mechanics and microseismic monitoring. Ain. Shams Eng. J. 2024, 15, 102587. [Google Scholar] [CrossRef]
- Yang, Y.; Zheng, K.; Li, Z.; Li, Z.; Si, L.; Hou, S.; Duan, Y. Experimental study on pore-fracture evolution law in the thermal damage process of coal. Int J Rock Mech Min 2019, 116, 13–24. [Google Scholar] [CrossRef]
- Gao, A.; Qin, B.; Zhang, L.; Ma, D.; Li, L. Experimental Study on Gas Migration Laws at Return Air Side of Goaf under High-Temperature Conditions. Combust. Sci. Technol. 2021, 195, 1930–1944. [Google Scholar] [CrossRef]
- Shi, G.-Q.; Liu, M.-x.; Wang, Y.-M.; Wang, W.-Z.; Wang, D.-M. Computational Fluid Dynamics Simulation of Oxygen Seepage in Coal Mine Goaf with Gas Drainage. Math. Probl. Eng. 2015, 2015, 723764. [Google Scholar] [CrossRef]
- Niu, H.; Liu, Y.; Wu, K.; Wu, J.; Li, S.; Wang, H. Study on Pore Structure Change Characteristics of Water-Immersed and Air-Dried Coal Based on SEM-BET. Combust. Sci. Technol. 2022, 195, 3994–4016. [Google Scholar] [CrossRef]
- Niu, H.; Yang, Y.; Li, S. Effects of pre-oxidized temperature and pre-oxidized oxygen concentration on burning characteristics of pre-oxidized coal. Fuel 2023, 332, 125723. [Google Scholar] [CrossRef]
- Balusu, R.; Belle, B.; Tanguturi, K. Development of Goaf Gas Drainage and Inertisation Strategies in 1.0-km- and 3.0-km-Long Panels. Min. Metall. Explor. 2019, 36, 1127–1136. [Google Scholar] [CrossRef]
- Xia, T.; Wang, X.; Zhou, F.; Kang, J.; Liu, J.; Gao, F. Evolution of coal self-heating processes in longwall gob areas. Int. J. Heat Mass Transfer 2015, 86, 861–868. [Google Scholar] [CrossRef]
- Tutak, M.; Brodny, J. The Impact of the Strength of Roof Rocks on the Extent of the Zone with a High Risk of Spontaneous Coal Combustion for Fully Powered Longwalls Ventilated with the Y-Type System—A Case Study. Appl. Sci. 2019, 9, 5315. [Google Scholar] [CrossRef]
- Taraba, B.; Michalec, Z.K. Effect of longwall face advance rate on spontaneous heating process in the gob area—CFD modelling. Fuel 2011, 8, 90. [Google Scholar] [CrossRef]
- Zhang, Y.; Niu, K.; Du, W.; Zhang, J.; Wang, H.; Zhang, J. A method to identify coal spontaneous combustion-prone regions based on goaf flow field under dynamic porosity. Fuel 2021, 288, 119690. [Google Scholar] [CrossRef]
- Lei, C.; Jiang, L.; Bao, R.; Deng, C.; Wang, C. Study on Multifield Migration and Evolution Law of the Oxidation Heating Process of Coal Spontaneous Combustion in Dynamic Goaf. ACS Omega 2023, 8, 14197–14207. [Google Scholar] [CrossRef] [PubMed]
- Wang, C.; Chen, L.; Bai, Z.; Deng, J.; Liu, L.; Xiao, Y. Study on the dynamic evolution law of spontaneous coal combustion in high-temperature regions. Fuel 2022, 314, 123036. [Google Scholar] [CrossRef]
- Ao, X.; Wang, X.; Zhu, X.; Zhou, Z.; Zhang, X. Grouting Simulation and Stability Analysis of Coal Mine Goaf Considering Hydromechanical Coupling. J. Comput. Civil. Eng. 2017, 31, 04016069. [Google Scholar] [CrossRef]
- Niu, X.; Feng, G.; Liu, Q.; Han, Y.; Qian, R. Numerical investigation on mechanism and fluid flow behavior of goaf water inrush: A case study of Dongyu coal mine. Nat. Hazards 2022, 113, 1783–1802. [Google Scholar] [CrossRef]
- Gui, X.; Xue, H.; Zhan, X.; Hu, Z.; Song, X. Measurement and Numerical Simulation of Coal Spontaneous Combustion in Goaf under Y-type Ventilation Mode. ACS Omega 2022, 7, 9406–9421. [Google Scholar] [CrossRef]
- Zheng, Y.; Li, Q.; Zhu, P.; Li, X.; Zhang, G.; Ma, X.; Zhao, Y. Study on Multi-field Evolution and Influencing Factors of Coal Spontaneous Combustion in Goaf. Combust. Sci. Technol. 2021, 195, 247–264. [Google Scholar] [CrossRef]
- Sidiropoulou, M.G.; Moutsopoulos, K.N.; Tsihrintzis, V.A. Determination of Forchheimer equation coefficients a and b. Hydrol. Process. 2007, 21, 534–554. [Google Scholar] [CrossRef]
- Li, Z.; Yi, G.; Wu, J.; Guo, D.; Zhao, C. Study on spontaneous combustion distribution of goaf based on the “O” type risked falling and non-uniform oxygen. J. China Coal Soc. 2012, 37, 484–489. [Google Scholar]
- Yuan, L.; Smith, A.C. CFD modeling of spontaneous heating in a large-scale coal chamber. J. Loss Prev. Process Ind. 2009, 22, 426–433. [Google Scholar] [CrossRef]
- Ejlali, A.; Mee, D.J.; Hooman, K.; Beamish, B.B. Numerical modelling of the self-heating process of a wet porous medium. Int. J. Heat Mass Transfer 2011, 54, 5200–5206. [Google Scholar] [CrossRef]
- Alazmi, B.; Vafai, K. Analysis of Variants Within the Porous Media Transport Models. J Heat Trans-T Asme 2000, 122, 303–326. [Google Scholar] [CrossRef]
- Qin, Q. The determination of the “three zones” in the goaf of the 1302 isolated island fully mechanized caving face of Yunhe Coal Mine. Saf. Coal Mines 2010, 41, 53–55. [Google Scholar]
- Li, T.; Wu, B.; Lei, B.; Huang, Q. Study on air leakage and gas distribution in goaf of Y-type ventilation system. Energy Sources Part A 2020, 45, 2788–2810. [Google Scholar] [CrossRef]
- Chen, X.; Li, L.; Guo, Z.; Chang, T. Evolution characteristics of spontaneous combustion in three zones of the goaf when using the cutting roof and release pressure technique. Energy Sci. Eng. 2019, 7, 710–720. [Google Scholar] [CrossRef]
- Chai, J. Investigation of Spontaneous Combustion Zones and Index Gas Prediction System in Goaf of “Isolated Island” Working Face. Fire 2022, 5, 67. [Google Scholar] [CrossRef]
- Yang, S.; Xu, N.; Liu, H.; Zhang, X.; Mei, S. Research and application of ‘three zones’ range within overlying strata in goaf of steep coal seam. Front. Energy Res. 2024, 12, 1333016. [Google Scholar] [CrossRef]
- Li, z.; Wu, Q.; Wang, Z. Distribution characteristic of remaining coal oxygen consumption and spontaneous combustion heating-up in goaf. J. China Coal Soc. 2009, 34, 667–672. [Google Scholar]
- Li, J.; Niu, H.; Lu, Y.; Li, S.; Zhao, L.; Nie, Q. Study on effect of wind speed to air leakage and spontaneous combustion in goaf of contiguous seams. Coal Sci. Technol. 2019, 47, 156–162. [Google Scholar]
- Wang, H.; Li, J.; Dong, Z.; Fan, C.; Zhang, Y.; Chen, X. Effect of thermal damage on the pore–fracture system during coal spontaneous combustion. Fuel 2023, 339, 127439. [Google Scholar] [CrossRef]
- Wang, H.; Li, J.; Zhang, Y.; Wu, Y.; Wang, Z. Study on the evolution of the pore structure of low rank coal during spontaneous combustion. Environ. Sci. Pollut. Res. 2023, 30, 39932–39945. [Google Scholar] [CrossRef] [PubMed]
- Wang, H.; Li, J.; Fan, C.; Wang, L.; Chen, X. Thermal Kinetics of Coal Spontaneous Combustion Based on Multiphase Fully Coupled Fluid–Mechanical Porous Media Model. Nat. Resour. Res. 2022, 31, 2819–2837. [Google Scholar] [CrossRef]
- Wang, H.; Li, J.; Chen, X.; Fan, C.; Wang, P.; Hu, L. Thermodynamic Characteristics of Oxidation and Combustion of Coal under Lean-Oxygen Conditions. ACS Omega 2021, 6, 17255–17266. [Google Scholar] [CrossRef] [PubMed]
- Zhang, J.; An, J.; Wen, Z.; Zhang, K.; Pan, R.; Akter Al Mamun, N. Numerical investigation of coal self-heating in longwall goaf considering airflow leakage from mining induced crack. Process Saf. Environ. Prot. 2020, 134, 353–370. [Google Scholar] [CrossRef]
- Pamucar, D.; Qi, Y.; Wang, W.; Qi, Q.; Ning, Z.; Yao, Y. Distribution of spontaneous combustion three zones and optimization of nitrogen injection location in the goaf of a fully mechanized top coal caving face. PLoS ONE 2021, 16, e0256911. [Google Scholar]
Figure 1.
Coupling relationship of numerical model.

Figure 2.
Physical model and meshing.

Figure 3.
Expansion coefficient, porosity and permeability of collapsed rock in the goaf.

Figure 4.
Distribution of airflow velocity, streamlines, and oxygen concentration in the goaf.

Figure 5.
Comparison of simulated and measured data.

Figure 6.
Spatial distribution of porosity and permeability in goaf with different porosity.
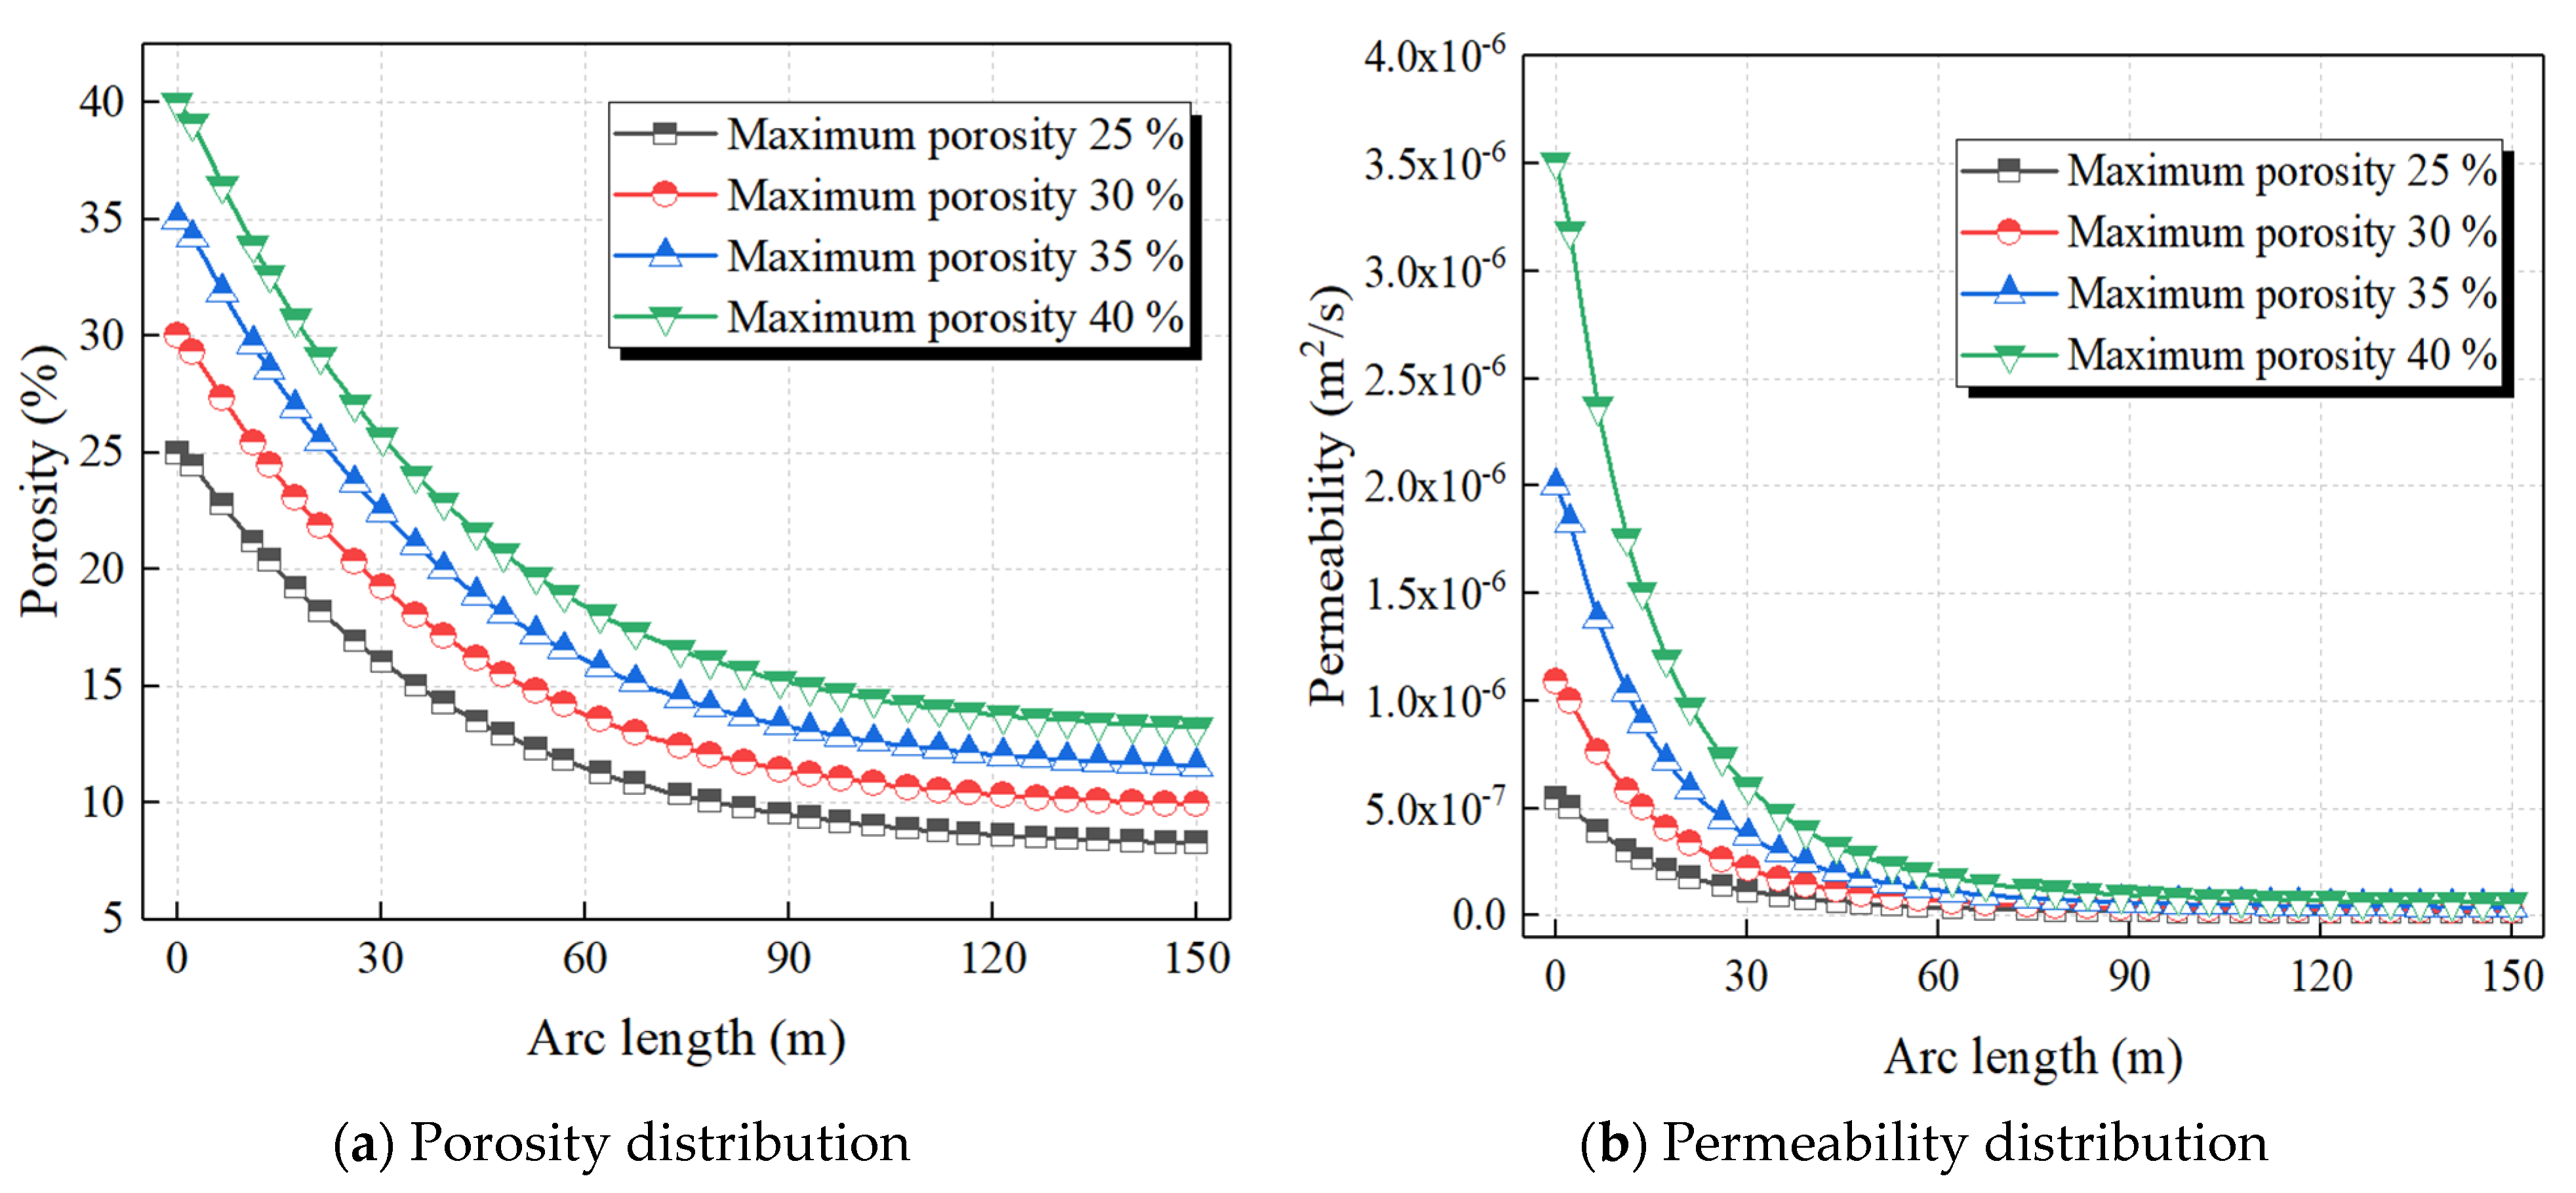
Figure 7.
Spatial distribution of oxygen concentration with time for different goaf porosity.

Figure 8.
Variations of average flow rate and average oxygen concentration with different goaf porosity.
Figure 8.
Variations of average flow rate and average oxygen concentration with different goaf porosity.
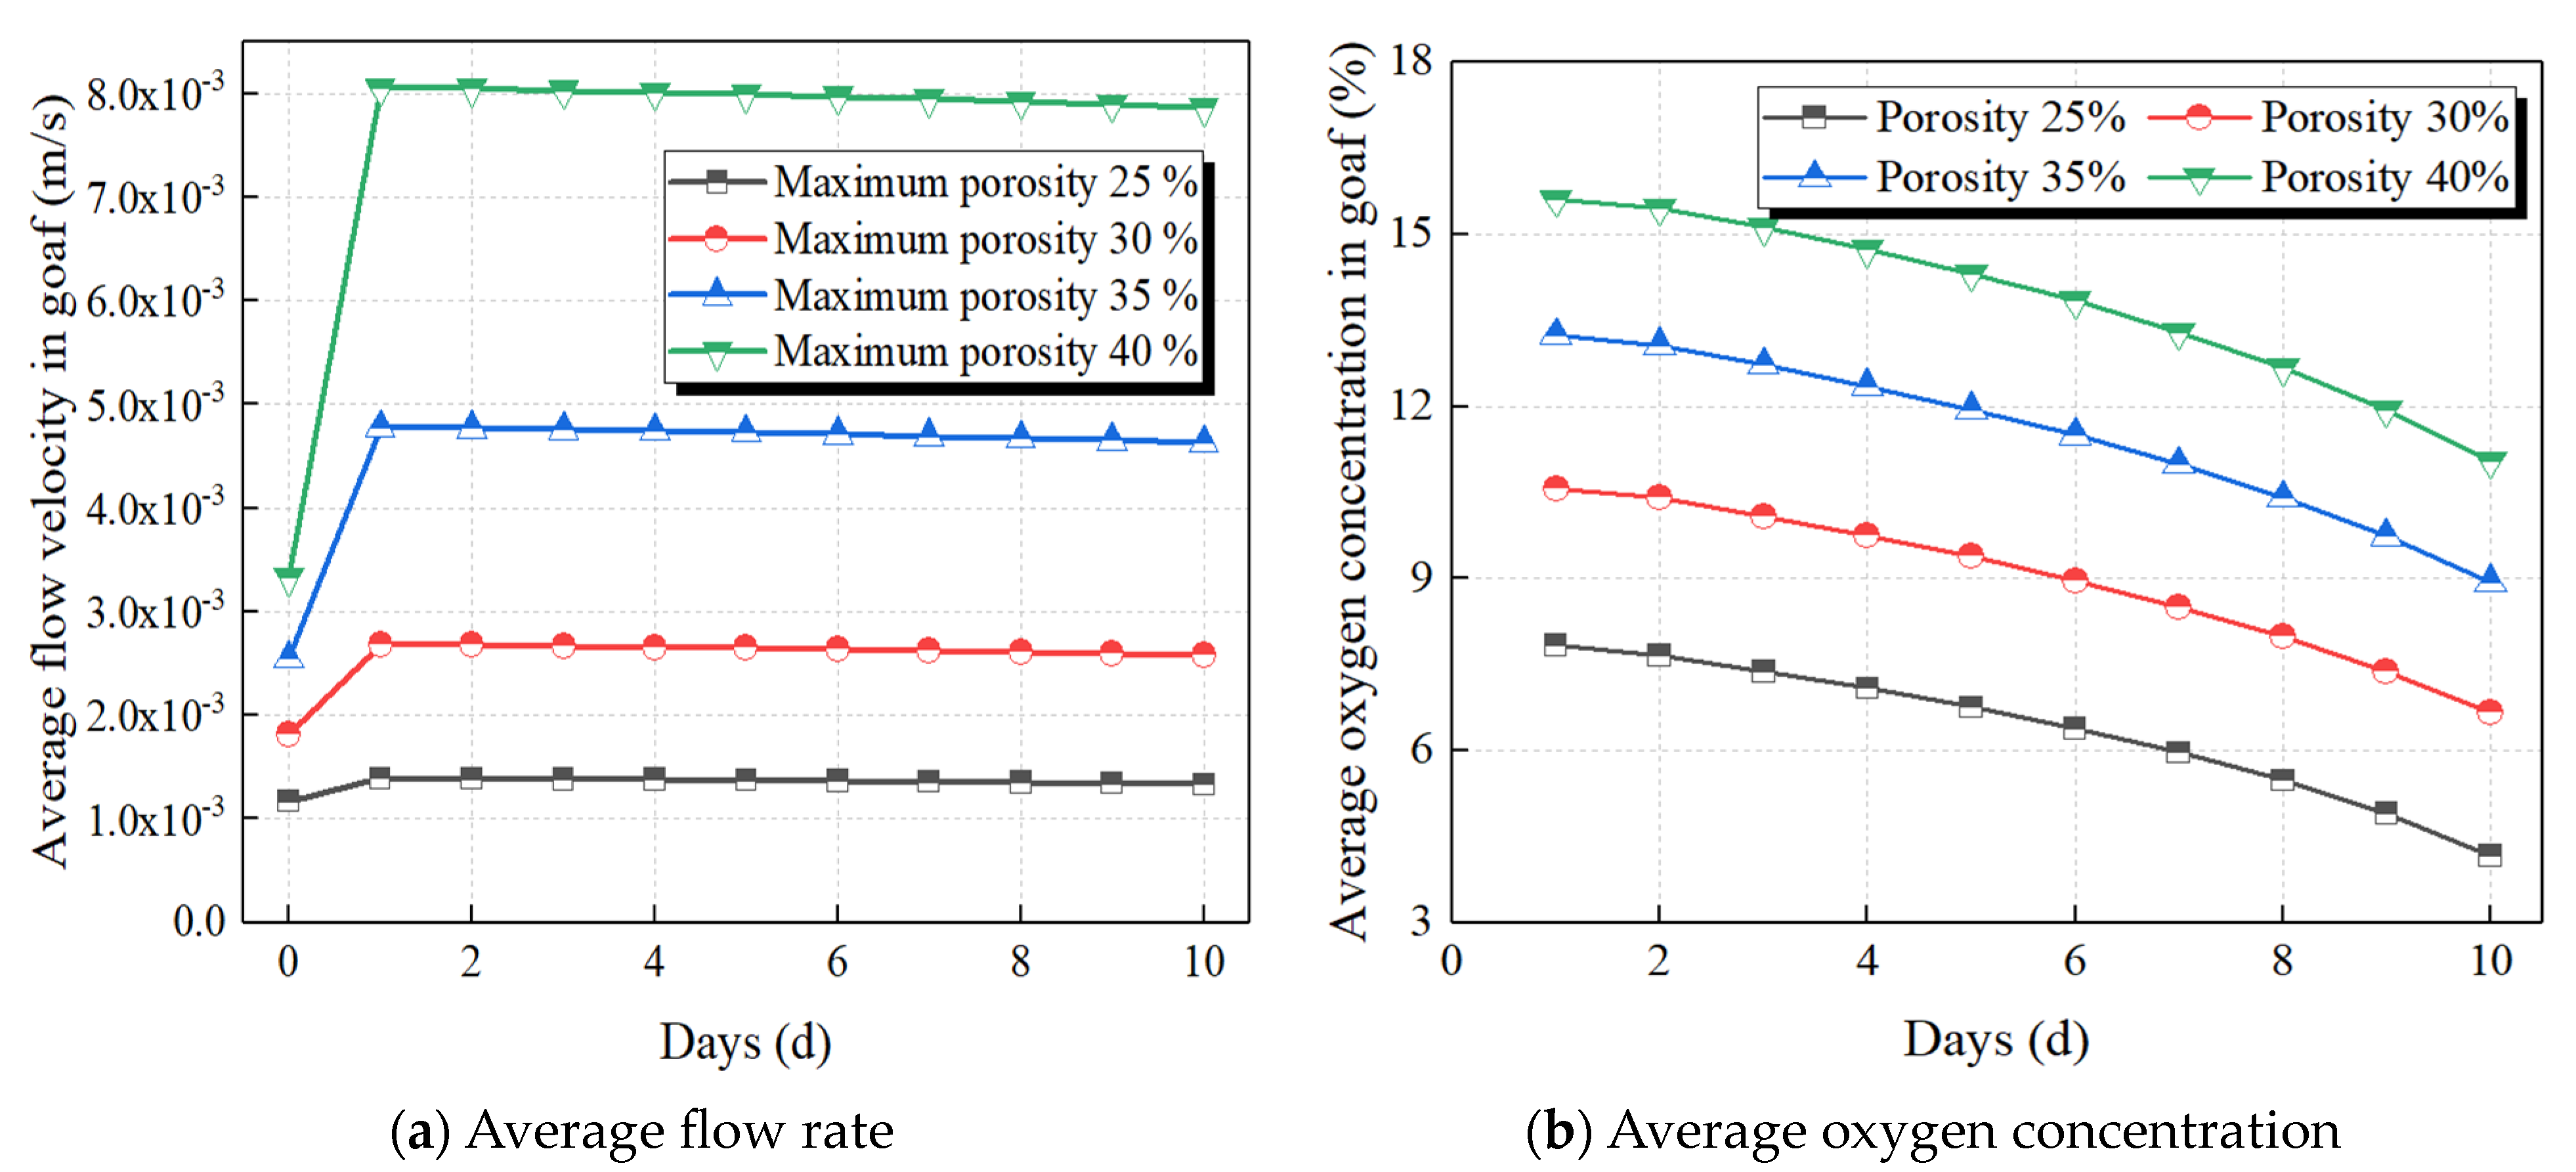
Figure 9.
Spatial distribution of temperature distribution with time with different goaf porosity.

Figure 10.
Variation in average temperature with time for different goaf porosity.
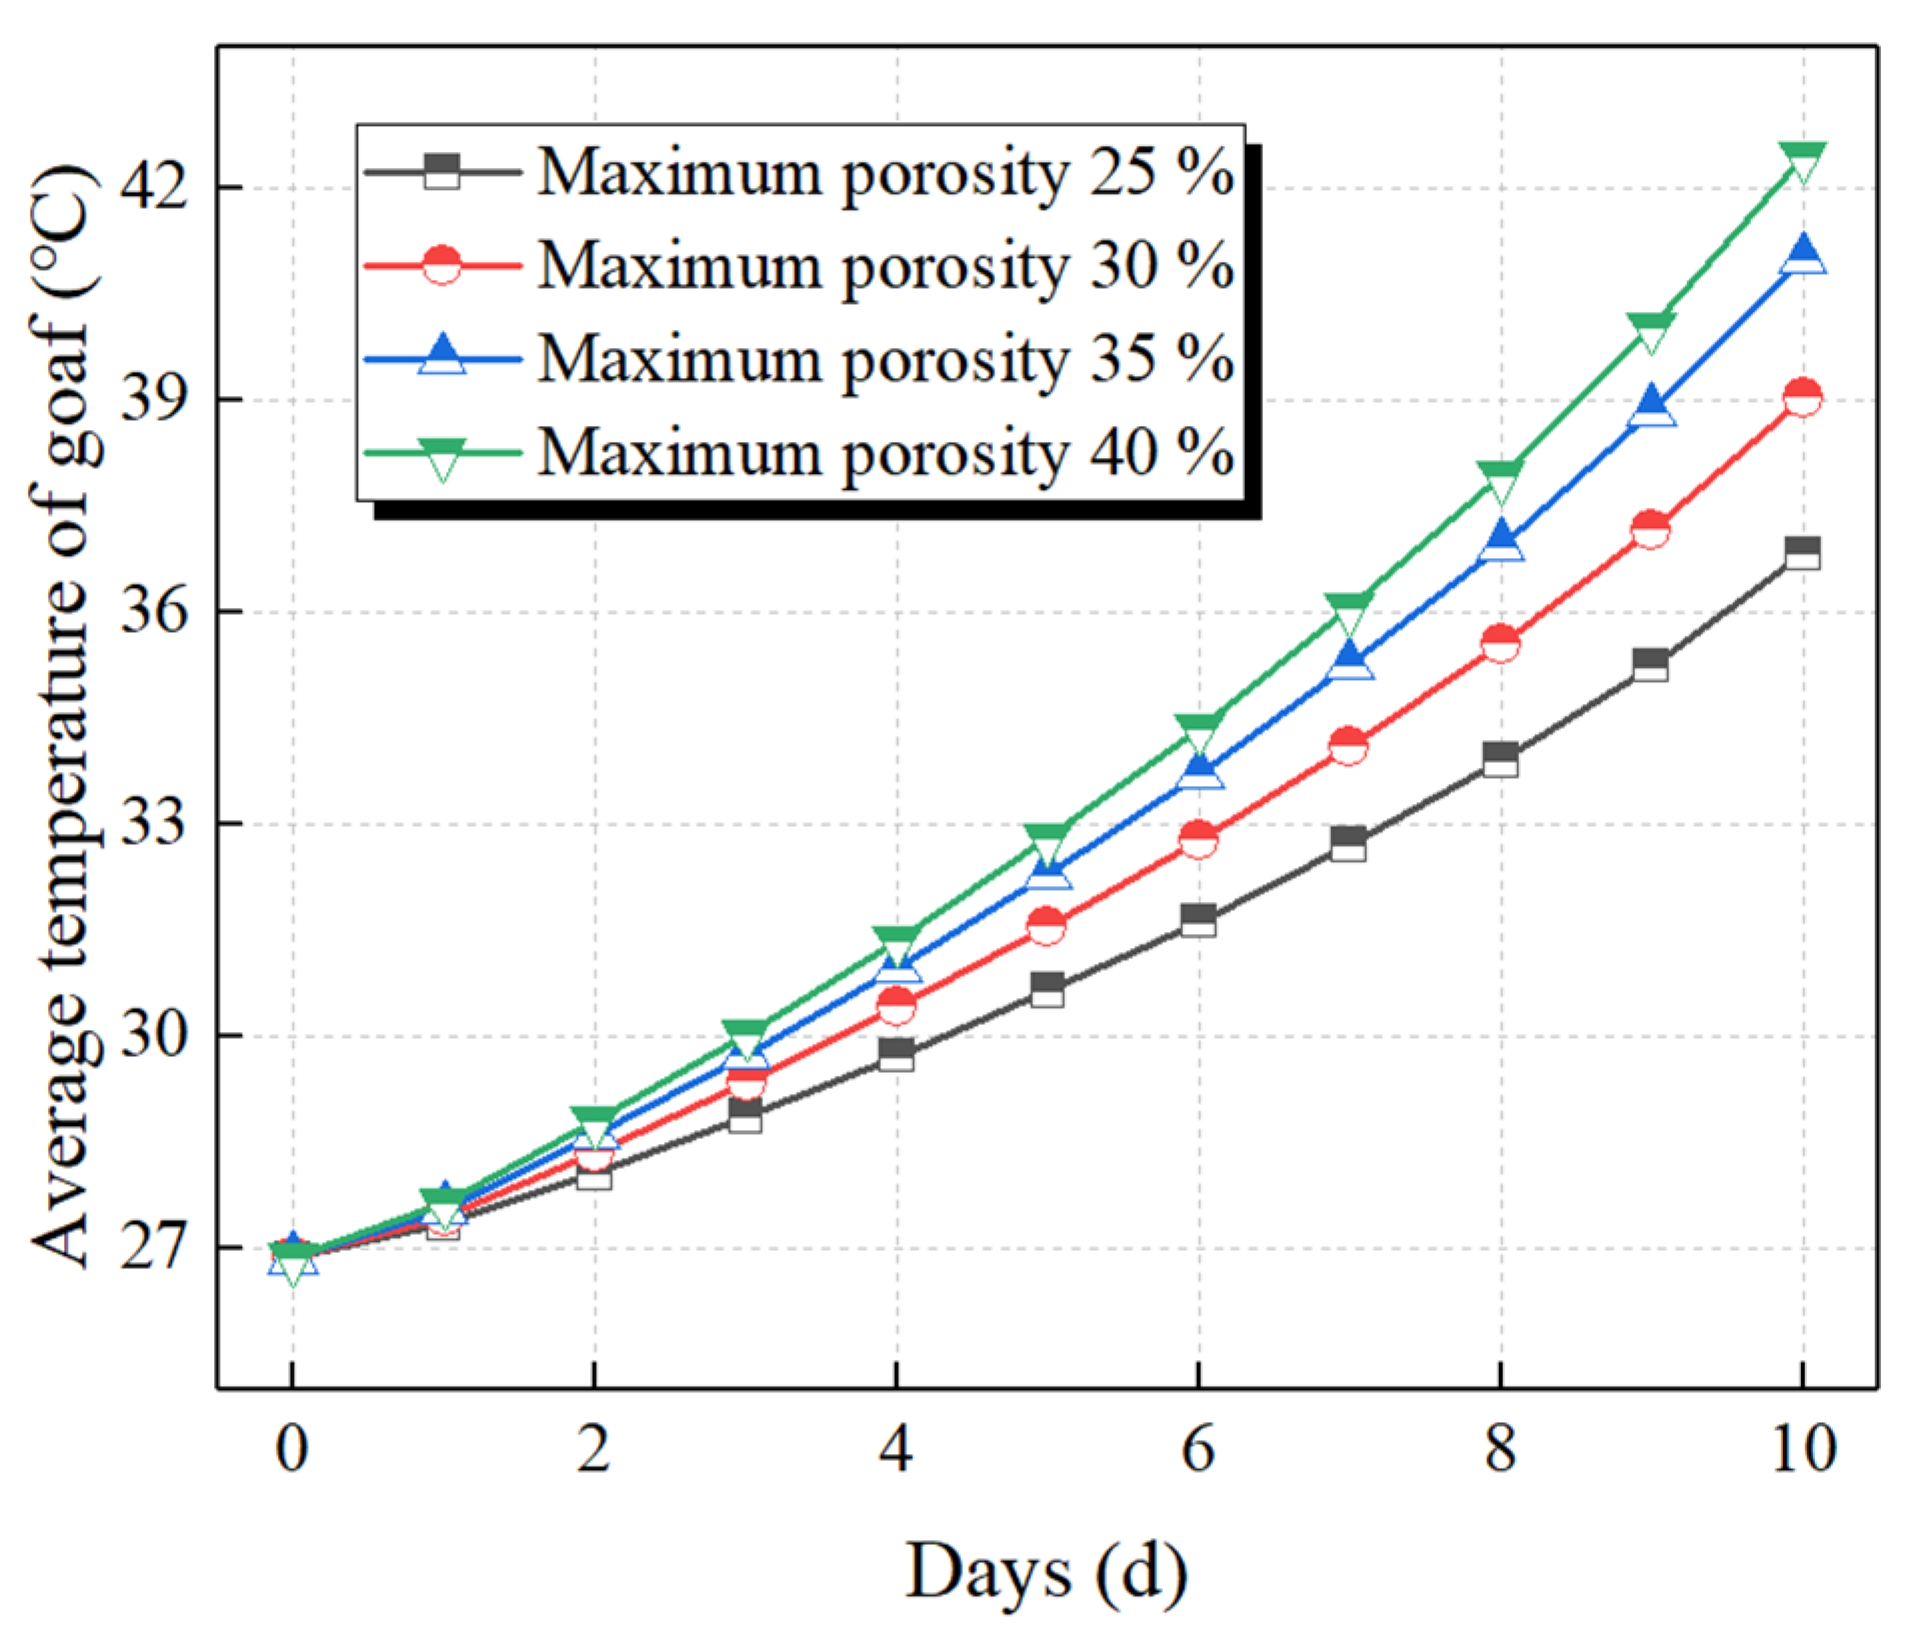
Figure 11.
Spatial variation of CSC three zone with time for different goaf porosity.

Figure 12.
Evolution law of CSC three zones with different goaf porosity.


Table 1.
Proximate Analyses of Sample S1.
| Coal Sample | Number | Mad (%) | Vad (%) | FCd (%) | Ad (%) |
|---|---|---|---|---|---|
| Lignite coal | S1 | 16 | 33.5 | 31.7 | 34.8 |
Table 2.
Initial Boundary Conditions.
| Boundary | Pressure | Concentration | Temperature |
|---|---|---|---|
| AD | p = p0 + R·Q2·(L − y) | T = T0 | |
| AB/BC/CD |
Table 3.
Numerical simulation parameters.
| Parameters | Value | Unit | Parameters | Value | Unit |
|---|---|---|---|---|---|
| Initial expansion coefficient, | 1.5 | - | particle diameter, dp | 0.04 | m |
| Compaction expansion coefficient, | 1.12 | - | Initial pressure, p0 | 1 | atm |
| Attenuation rate, a0 | 0.0368 | - | Adjustable parameters, | 0.233 | - |
| Attenuation rate, a1 | 0.0268 | - | Initial O2 concentration, | 9.375 | mol/m3 |
| Initial temperature, T0 | 27 | °C | solid density, | 1250 | Kg/m3 |
| Activation energy, Ea | 45.5 | KJ/mol | Gas density, | 1.1 | Kg/m3 |
| Indexing factor, A | 180 | 1/s | Solid specific heat capacity, Cps | 1200 | J/(kg·K) |
| Ideal gas constant, R | 8.314 | J/(mol·K) | Gases specific heat capacity, Cpg | 1012 | J/(kg·K) |
Disclaimer/Publisher’s Note: The statements, opinions and data contained in all publications are solely those of the individual author(s) and contributor(s) and not of MDPI and/or the editor(s). MDPI and/or the editor(s) disclaim responsibility for any injury to people or property resulting from any ideas, methods, instructions or products referred to in the content. |
© 2024 by the authors. Licensee MDPI, Basel, Switzerland. This article is an open access article distributed under the terms and conditions of the Creative Commons Attribution (CC BY) license (https://creativecommons.org/licenses/by/4.0/).
Share and Cite
MDPI and ACS Style
Li, J.; Xu, H.; Wu, G. Study on the Effect of Pore Evolution on the Coal Spontaneous Combustion Characteristics in Goaf. Fire 2024, 7, 164. https://doi.org/10.3390/fire7050164
AMA Style
Li J, Xu H, Wu G. Study on the Effect of Pore Evolution on the Coal Spontaneous Combustion Characteristics in Goaf. Fire. 2024; 7(5):164. https://doi.org/10.3390/fire7050164
Chicago/Turabian StyleLi, Jinglei, Hao Xu, and Genshui Wu. 2024. "Study on the Effect of Pore Evolution on the Coal Spontaneous Combustion Characteristics in Goaf" Fire 7, no. 5: 164. https://doi.org/10.3390/fire7050164