Article

Evaluation of the Feasibility of the Prediction of the Surface Morphologiesof AWJ-Milled Pockets by Statistical Methods Based on Multiple Roughness Indicators

by
Nikolaos E. Karkalos
1,
Muthuramalingam Thangaraj
1,2 and
Panagiotis Karmiris-Obratański
1,*
1
Advanced Manufacturing Laboratory, Department of Manufacturing Systems, Faculty of Mechanical Engineering and Robotics, AGH University of Krakow, 30-059 Kraków, Poland
2
Department of Mechatronics Engineering, College of Engineering and Technology, SRM Institute of Science and Technology, Kattankulathur 603203, India
*
Author to whom correspondence should be addressed.
Surfaces 2024, 7(2), 340-357; https://doi.org/10.3390/surfaces7020021
Submission received: 22 January 2024 / Revised: 3 April 2024 / Accepted: 9 April 2024 / Published: 10 May 2024

Abstract

:
Improvement of the surface quality of machined parts is essential in order to avoid excessive and costly post-processing. Although non-conventional processes can efficiently carry out the machining of difficult-to-cut materials with high productivity, they may also, for various reasons, be related to increased surface roughness. In order to optimize the surface quality of generated surfaces in a reliable way, surface profiles obtained during these processes must be adequately modeled. However, given that most studies have focused on Ra or Rz indicators or are based on the assumption of a normal distribution for the profile heights, relevant models cannot accurately represent the surface characteristics that exist in a real machined surface with a high degree of accuracy. Thus, in the present study, a new modeling approach based on the use of a statistical probability distribution for the surface profile height is proposed. After six different distributions were evaluated on the basis of a three-stage procedure involving different roughness indicators pertaining to the abrasive waterjet (AWJ) milling of pockets, it was found that, although it is not possible to model the nominal values of every roughness parameter simultaneously, in several cases, it is possible to approximate the values of critical indicators such as Ra, Rz, Rsk, Rku and Rp/Rv ratio by Weibull distribution with a sufficient degree of accuracy.

1. Introduction

Surface quality plays a fundamental role in the contemporary manufacturing industry due to the profound impact of texture parameters, not only on the dimensional accuracy of precision machined parts but also on the tribological and wear properties of the surface [1,2], which in turn can directly regulate the service life of produced components [3]. Thoughmany researchers usually characterize surface quality based on the most fundamental 2D or 3D roughness parameters, e.g., Ra, Rz or Sa and Sz, surface profiles are toocomplex to be sufficiently described by only a small numberof such parameters [4,5]. Thus, it is recommended that multiple parameters of the surface roughness of machined surfaces should be studied in order to gain a deep insight intothe implications of machining parameters on surface quality [6]. In some cases, special techniques must beemployed in order to obtain a more accurate estimation of the roughness parameters’ values [7], especially online, which is a challenging task [8,9,10].
Beyond the conventional machining and abrasive processes, a wide variety of non-conventional methods also exist, and theseare highly recommended when one isseeking to alter the surface topography of mechanical parts bearing in mind cost management and flexibility, as some of the non-conventional processes can definitely provide more possibilities for the achievement ofa favorable surface texture at an affordable cost and without reducing productivity. Among these processes, AWJ has proven to be efficient in many demanding cases, given that, through AWJ, almost every material type can be machined with high productivity and minimalenvironmental impact. However, special conditions must be selected during AWJ machining in order to achieve an adequate level of roughness which usually, due to the use of the numerous irregularly shaped particles which can be embedded on aworkpiece’s surface, poseconsiderable challenges to the manufacturers.
In order to be able to adopt effective strategies for the control and reduction of surface roughness, it is essential to both take into consideration the specific characteristics of the process or processes selected for the manufacturing of mechanical parts and the correlation of process parameters with the surface quality of the produced surfaces, based on reliable models. For that purpose, a wide variety of models has been proposed in the scientific field of machining processes, ranging from models that simply predict the values of fundamental surface roughness indicators to models that can realistically predict the anticipated surface topography after one or multiple operations have been carried out [11]. For example, in the case of established, conventional machining processes, apart from the models based on artificial intelligence (AI) methods thatusually serve to predictspecific surface roughness indicators, a considerable amount of work has been dedicated to the development of more advanced predictive models, based on the exact shape of the cutting tool and the selected tool path and while taking into consideration possible non-ideal features such as tool runout [12,13]. In most of these cases, the predicted surface topography is appropriately determined by considering the interaction between the cutting edge or edges and the workpiece material on a given toolpath, with the surface topography estimated by the material remaining after the action of the cutting tool [14,15]. As the final topography also incorporates the effect of other phenomena occurring during machining processes, such as chattering or tool wear, in some cases information from vibration measurements or worn tool geometry is taken into consideration in order to improve the accuracy of prediction and attempts to quantify other stochastic elements are also made [16,17,18,19]. However, in the case of processes with a higher influence of stochastic elements andwhere it is not possible to directly quantify the action of each particle, such as abrasive processes, the efficiency of these models is limited. This isdespite efforts aimed atpredicting final topographies that arebased on the detailed modeling of numerous deterministic and stochastic features of these processes [20].
Nowadays, the considerable advances in measurement systems as well as image analysis [21] have led to the development of a promising category of methods for the prediction of surface topography regardless of the kinematics and other stochastic elements of processes when high resolution images or laser scans of the machined workpiece are available [22]. Zhang et al. [23] have developed a fuzzy clustering model for online roughness measurement by obtained images using an advanced clustering algorithm. Patel and Kiran [24] have proposed an image-based technique for surface roughness estimation by correlating roughness parameters with image characteristics. Shi et al. [25] have used a shading-based surface reconstruction technique and surface gradient model, especially for the simulation of machined surface topography. Dhanasekar and Ramamoorthy [26] have developed surface quality enhancement algorithms in order to evaluate the surface topography from images and compared the results withexperimental data.
Based on either laser scans or conventionally measured profiles, an alternative option is to use fractal-based methods to reconstruct surfaces created by machining processes. For instance, Thielen, Magyar and Piros [27] used fractal functions to create realistic shaft surfaces produced by turning. Compared with themeasured profiles of these surfaces, the proposed model showed a high level of accuracy. Wang et al. [28] developed an approach for the prediction of surface roughness evaluation during an EDM process based on fractal theory and measurements of the actual surface. Rafols and Almqvist [29] created self-affine fractal surfaces with a non-Gaussian distribution in order to study contact mechanics problems. Zhao et al. [30] simulated the topography of real surfaces based on fractal functions in order to study their lubrication characteristics. Beyond these studies, FE models were also developed based on an explicit representation of surface morphology by fractal functions, especially regarding contact problems, between a smooth and a rough surface [31] or even between two rough surfaces [32], as well as in forming processes [33].
Beyond the models that predict values of roughness, there is a lack of models representing the surface at microscopic levels, a lack that is conspicuous given that even the most detailed simulation models for surface topography, including analytical, empirical, FE, or even stochastic, capture machined surfacesatmore macroscopic levels. Only in specific cases are there relevant models, similar to those used for shot peening or problems regarding asperities and contact between rough surfaces [34]. For example, Gao et al. [35] presented an FE model for the simulation of scratches on rough surfaces based on images of real topography. Megalingam and Mayuram [36] created gaussian random surfaces for FE modeling of the contact between surfaces with asperities. Kartini et al. [37] also generated gaussian random surfaces in order to study the contact between a smooth and a rough surface. Wang et al. [38] created a model regarding shot peening by taking into account the impact of multiple particles on the surface and compared the resulting surface topography with the experimentally developed one, achieving better accuracy compared withthe analytical models.
Withspecial regard towaterjet peening, Xie and Rittel [39] developed a rough surface model based on single droplet impact FE analysis with droplets of different diameter and speed. They later improved thisby considering the effects of multiple particles impacting on the workpiece surface for different initial average surface roughness values [40]. In subsequent works, this scientific team [41,42] created FE models of the same process by taking into account the initial surface heights. After the analysis of the deformation of the surface, the obtained profile was compared with the simulated ones under different conditions. He et al. [43] simulated abrasive waterjet peening with a view to predicting surface topography and residual stresses. In this model the effect of consecutive shots on the workpiece surface was taken into account and was compared with the results of a theoretical model.Finally, in the case of ultra-high precision grinding, molecular dynamics models were adopted in order to study the surface alterations [44].
However, given that the use of models incorporating information from multiple roughness indicators in the case of AWJ milling is still lacking and that existing studies on similar processes focus either on uniformly distributed or Gaussian random surfaces—despite the experimental evidence that real surfaces are usually non-Gaussian—it was considered important to carry out a comprehensive study regarding anevaluation of the applicability of various statistical distributions for the modeling of roughness profile height distribution of a surface treated by AWJ milling using the values of multiple roughness indicators, excluding Ra. Thismethod involves the use of a statistical distribution for the heights of the surface profile, one which will be able to simulate the real surface based on information about average roughness (Ra), maximum roughness (Rz), peak and valley dimensions (Rp, Rv), as well as skewness (Rsk) and kurtosis (Rku). The selection of the appropriate statistical distribution will be performed in threedistinct steps e.g., evaluation of distributions which can simulate the experimentally measured skewness and kurtosis values, evaluation of distribution which can simulate the Ra and Rz values and, finally, the accuracy whenpredicting Rp and Rv.

2. Materials and Methods

2.1. Scope of the Present Work

This study aims at the evaluation of the applicability of different probability distributions for the prediction of a surface profile based on surface roughness indicator values. For that reason, data from experiments of the AWJ milling of rectangular shaped blind pockets will be used. As several works have focused on Gaussian random surfaces, e.g., adopting the normal distribution for the description of height distribution for the machined surfaces, one of the tested distributions will be the normal distribution. However, the research will also include other distributions which could potentially model the height distribution, such as the Rayleigh, gamma, asymmetric generalized normal and skew normal distributions, as well as the Weibull distribution, which is more versatile than the others and can be more directly regulated to reproduce different types of rough surfaces which are usually non-Gaussian in the case of machined profiles [45]. Thus, motivated by the lack of studies related to surface roughness modeling based on multiple roughness indicators and the lack of realistic descriptions of rough surfaces, occurring after non-conventional machining or similar treatments, the objectives of this work are the following:
(1)
Determination of the feasibility of employing a statistical distribution as an alternative means of reliably simulating several characteristics of the surface roughness profile during AWJ pocket milling through modeling of its height distribution. In this case, a basic requirement is that the statistical distribution can accurately simulate fundamental indicators, such as Rsk and Rku or the Rp/Rv ratio, beyond the usual height parameters, such as Ra or Rz.
(2)
Determination of the most promising statistical distribution forrepresenting the surface roughness profile in the case of AWJ pocket milling by modeling its height distribution. In this case, a basic requirement is that the statistical distribution should not be very complicated in order for its implementation to be feasible without the need of highly specialized knowledge. The representation of the surface roughness profile should be based on multiple indicators, such as Ra, Rz, Rp, Rv, Rsk and Rku.
Based on the detailed description of the objectives of this work and in terms of the comprehensive evaluation of the machined surface topography, it becomes evident that this work intends neither to substitute the modeling approach of several researchers based on the particular characteristics of the AWJ pocket milling process, such as its physics and kinematics, nor to disregard or neglect the importance of other surface roughness indicators, such as the functional parameters related to the material ratio curve. On the contrary, it aims to determine the possibility of using an alternative approach based on the modeling of the surface height distribution after AWJ pocket milling in order to describe some of its fundamental characteristics based on a set of indicators which can be directly determined even by portable devices.
Regarding the evaluation procedure for the probability distributions, it is worth noting that every probability distribution which will be tested will belong to the category of continuous and univariate probability distributions. Moreover, complex or hybrid probability distributions will also notbe considered in order to avoid further and more increaseddifficulty in the implementation of the proposed method and the consequently reduced practicality.
The evaluation will be carried out in three stages, as will be discussed later and in more detail. At first, the applicability of the selected probability distributions regarding modeling of surface profile after AWJ milling will be evaluated based on Rsk and Rku indicators. These two indicators determine the morphology of the height distribution to a large extent; thus, they should be more accurately predicted in order to ensure that the simulated profile exhibits the same tribological or wear properties as the real one. Ba et al. [46] selected Rsk and Rku as important roughness parameters along with functional parameters such as Rk, Rpk and Rvk, mentioning that thesehave a more direct relation to the tribological properties of surfaces than height parameters such as Ra, Rz or Rt. Dzierwa [47] noted that roughness plays a significant role on friction levels but that theparameters usually employed by designers cannot describe contact surfaces appropriately, whereas parameters such as Rsk, Rku can be correlated with a friction coefficient, as well as with more advanced parameters such as average slope of the profile Δa οr core roughness depth Rk. In this work, the author attempted to correlate roughness parameters with friction and wear parameters, deducing that kurtosis is correlated with wear volume and friction force, whereas skewness in some cases can alsobe related to wear volume. Sedlaček, Podgornik and Vižintin [48] performed grinding and polishing experiments in order to produce specimens with similar Ra but different Rsk and Rku values. Based on the analysis of their experiments, they were able to observe that higher Rku and negative values of Rsk lead to a decrease in friction. Ba et al. [49] also underlined the necessity to use parameters other than Ra or Rq, such as Rsk and Rku, in order to characterize the surface quality more comprehensively, especially regarding tribological parameters. In their work, they showed that, although both Rsk and Rku are related theoretically to the tribological characteristics of surfaces, given that most authors regard surfaces with negative Rsk and Rku > 3 as ideal, Rsk can be used todistinguish surfaces with similar Ra but that are produced by different processes e.g., turning or milling, as it has also been previously shown that different processes can be distinguished based on more advanced roughness indicators [50].
Then, the ability of these probability distributions toalso model Ra and Rz values, based on the experimental measurements, will also be assessed, as it is not possible to regulate Rsk, Rku, Ra and Rz simultaneously with every type of probability distribution, at least without a significant deviation from the experimental values. Finally, given that the magnitude of peaks and valleys in the roughness profile (characterizing the existence and specific volume of material and voids on the surface, respectively [51]), as well as their ratio, mentioned also as a solidity factor parameter [52] and regarded as an alternative to the emptiness coefficient Rp/Rz [48], is also important from a tribological point of view [52,53,54,55], the accuracy of predicting Rp and Rv will be assessed. Given that the ratio of these values has a close relation to the values of Rsk, it is anticipated that a successful modeling of Rsk will ensure an appropriate representation of Rp and Rv and also the accurate prediction of Rz will probably impact the prediction of Rp and Rv favorably.
The present work aims to determine a suitable alternative methodology for creating reliable simulated profiles based on multiple roughness indicators beyond Ra and Rz. In fact, while conventional height parameters such as Ra or Rz are commonly employed in order to surface roughness of workpieces, their value in product design can be limited. Given that these parameters only provide information about the amplitude of the roughness but not regarding its complexity or anisotropy, such as parameters related to direction or orientation of surface roughness, the effect of a machining process on the functionality of a surface cannot be totally explained by the height parameters [56]. For that reason, advanced methods for surface roughness profile analysis, such as fractal analysis, can provide a deeper insight into the nature of the surfaces under different conditions and also lead to the establishment of correlations between them and friction and wear properties [57,58]. For example, the analysis of the fractal characteristics of surfaces can provide details about the lubrication characteristics [59], such as the resistance to the flow or lubrication film thickness [30].
However, although these analyses are considered beyond the scope of the present work, which is mainly focused on the determination of the capability of statistical distributions to accurately model different height parameters, the inclusion of Rsk and Rku parameters, which can provide more complex details about the surface characteristics compared withsimple height parameters, such as Ra and Rz, can render this work sufficiently comprehensive.

2.2. Description of Research Methodology

In the first stage of the present work, a selection of different continuous univariate probability distributions will be conducted in order for them to be used tomodel the height distribution of roughness profiles under different conditions. Some of these functions arealso being used for modeling other quantities relevant to machining processes, e.g., tool wear progression, but have not yet beenused for the proposed task. Obviously, non-continuous or multivariate distributions or distributions which cannot provide realistic value for the different surface roughness indicators, as described in detail below, were ruled out from the investigations. Furthermore, complicated probability distributions, requiring higher computational burden, will also be avoided in order to retain the practical nature of the proposed approach.
More specifically, the first stage of the evaluation will be focused on the skewness (Rsk) and kurtosis (Rku) parameters. Both parameters are crucial for the characterization of surfaces, as they determine their functionality and can be regarded as distinct features related to a specific process. If Rsk and Rku parameters are plotted in a common graph, the values of (Rsk, Rku) pairs can be related to different processes according to their position on the graph, based on experimental evidence, and as shown in the relevant literature [55].
Given that each statistical probability distribution is related to different skewness and kurtosis values, which may be either constant or variable, the accuracy of predicting the experimental roughness indicators will be different for each distribution. Thus, it is important to evaluate the deviation of the Rsk and Rku values of the generated rough surfaces fromthose of thereal rough surfaces. The most suitable parameter values of the distributions will be selected for the second stage. It is to be noted that the optimum parameter values for the statistical distribution, determined by an optimization approach based on the achievable convergence for the defined objectives (Rsk, Rku–Ra, Rz–Rp, Rv), may not yield the exact desired value, as an analytic solution, but the error is negligible and does not affect the conclusions.
More specifically, during the first stage of investigations the following probability distributions will be used: Gaussian (normal) distribution, Rayleigh distribution, gamma distribution, asymmetric generalized normal distribution, skew normal distribution and Weibull distribution.In each case, the probability density function (PDF) is described by Equations (1)–(6), respectively [60,61]:
f ( x ) = 1 σ 2 π e 1 2 ( x μ σ ) 2
f ( x ) = x σ 2 e x 2 σ 2 2
f ( x ) = θ k Γ ( k ) x k 1 e θ x
f ( x ) = φ ( y ) a κ ( x ξ )
f ( x ) = 2 ω 2 π e ( x ξ ) 2 2 ω 2 α ( x ξ ω ) 1 2 π e t 2 2 d t
f ( x ) = k λ ( x λ ) k 1 e ( x / λ ) k
In Equation (1), μ represents the mean value and σthe standard deviation; in Equation (3), Γ represents the gamma function, k is a shape parameter and θ a scale parameter; in Equation (4), ξ is a location parameter, α a scaling parameter and κ a shape parameter, in Equation (5) ξ is a location parameter, ω a scale parameter and α a shape parameter; and in Equation (6), k is a shape parameter and λ is a scale parameter. In Equation (4), φ represents the standard normal PDF and y is given by:
y = 1 κ l o g 1 κ ( x ξ ) α ,     i f   κ 0 x ξ α ,         i f   κ = 0
As a second stage, the capabilities of the probability distributions regarding the modeling of other roughness indicators, such as Ra and Rz, will alsobe investigated. Finally, the different distributions will be evaluated based on their overall accuracy during the third stages, which will also involve Rp and Rv indicators. In Figure 1, a schematic relevant to the proposed methodology is presented. It is to be noted that the question marks (“?”) in Figure 1 indicate each of the three stages of the evaluation of the different probability distributions.
In conclusion, the proposed investigation aims to highlight the strengths and limitations of different probability distributions regarding the modeling of rough surfaces produced during AWJ milling, based on a set of indicators which are more advanced than Ra and Rz, but which can be determined even by simple devices, such as portable stylus-type roughness measurement devices, without the need tousea more expensive 3D profilometer. Moreover, the use of more advanced parameters, such as those pertinent to the material ratio curve or parameters related to exact recording roughness profile will be avoided. This approach is rather low cost as it does not involve a complicated framework of statistical tools that are difficult to be implemented by non-experts, andneitherwill it require very specialized software.
The derived curves which can predict the characteristic properties of a surface with high accuracy can provide useful insight about potential tribological behavior, wear and also lubrication etc. and may be used in simulations to achieve a more realistic result.

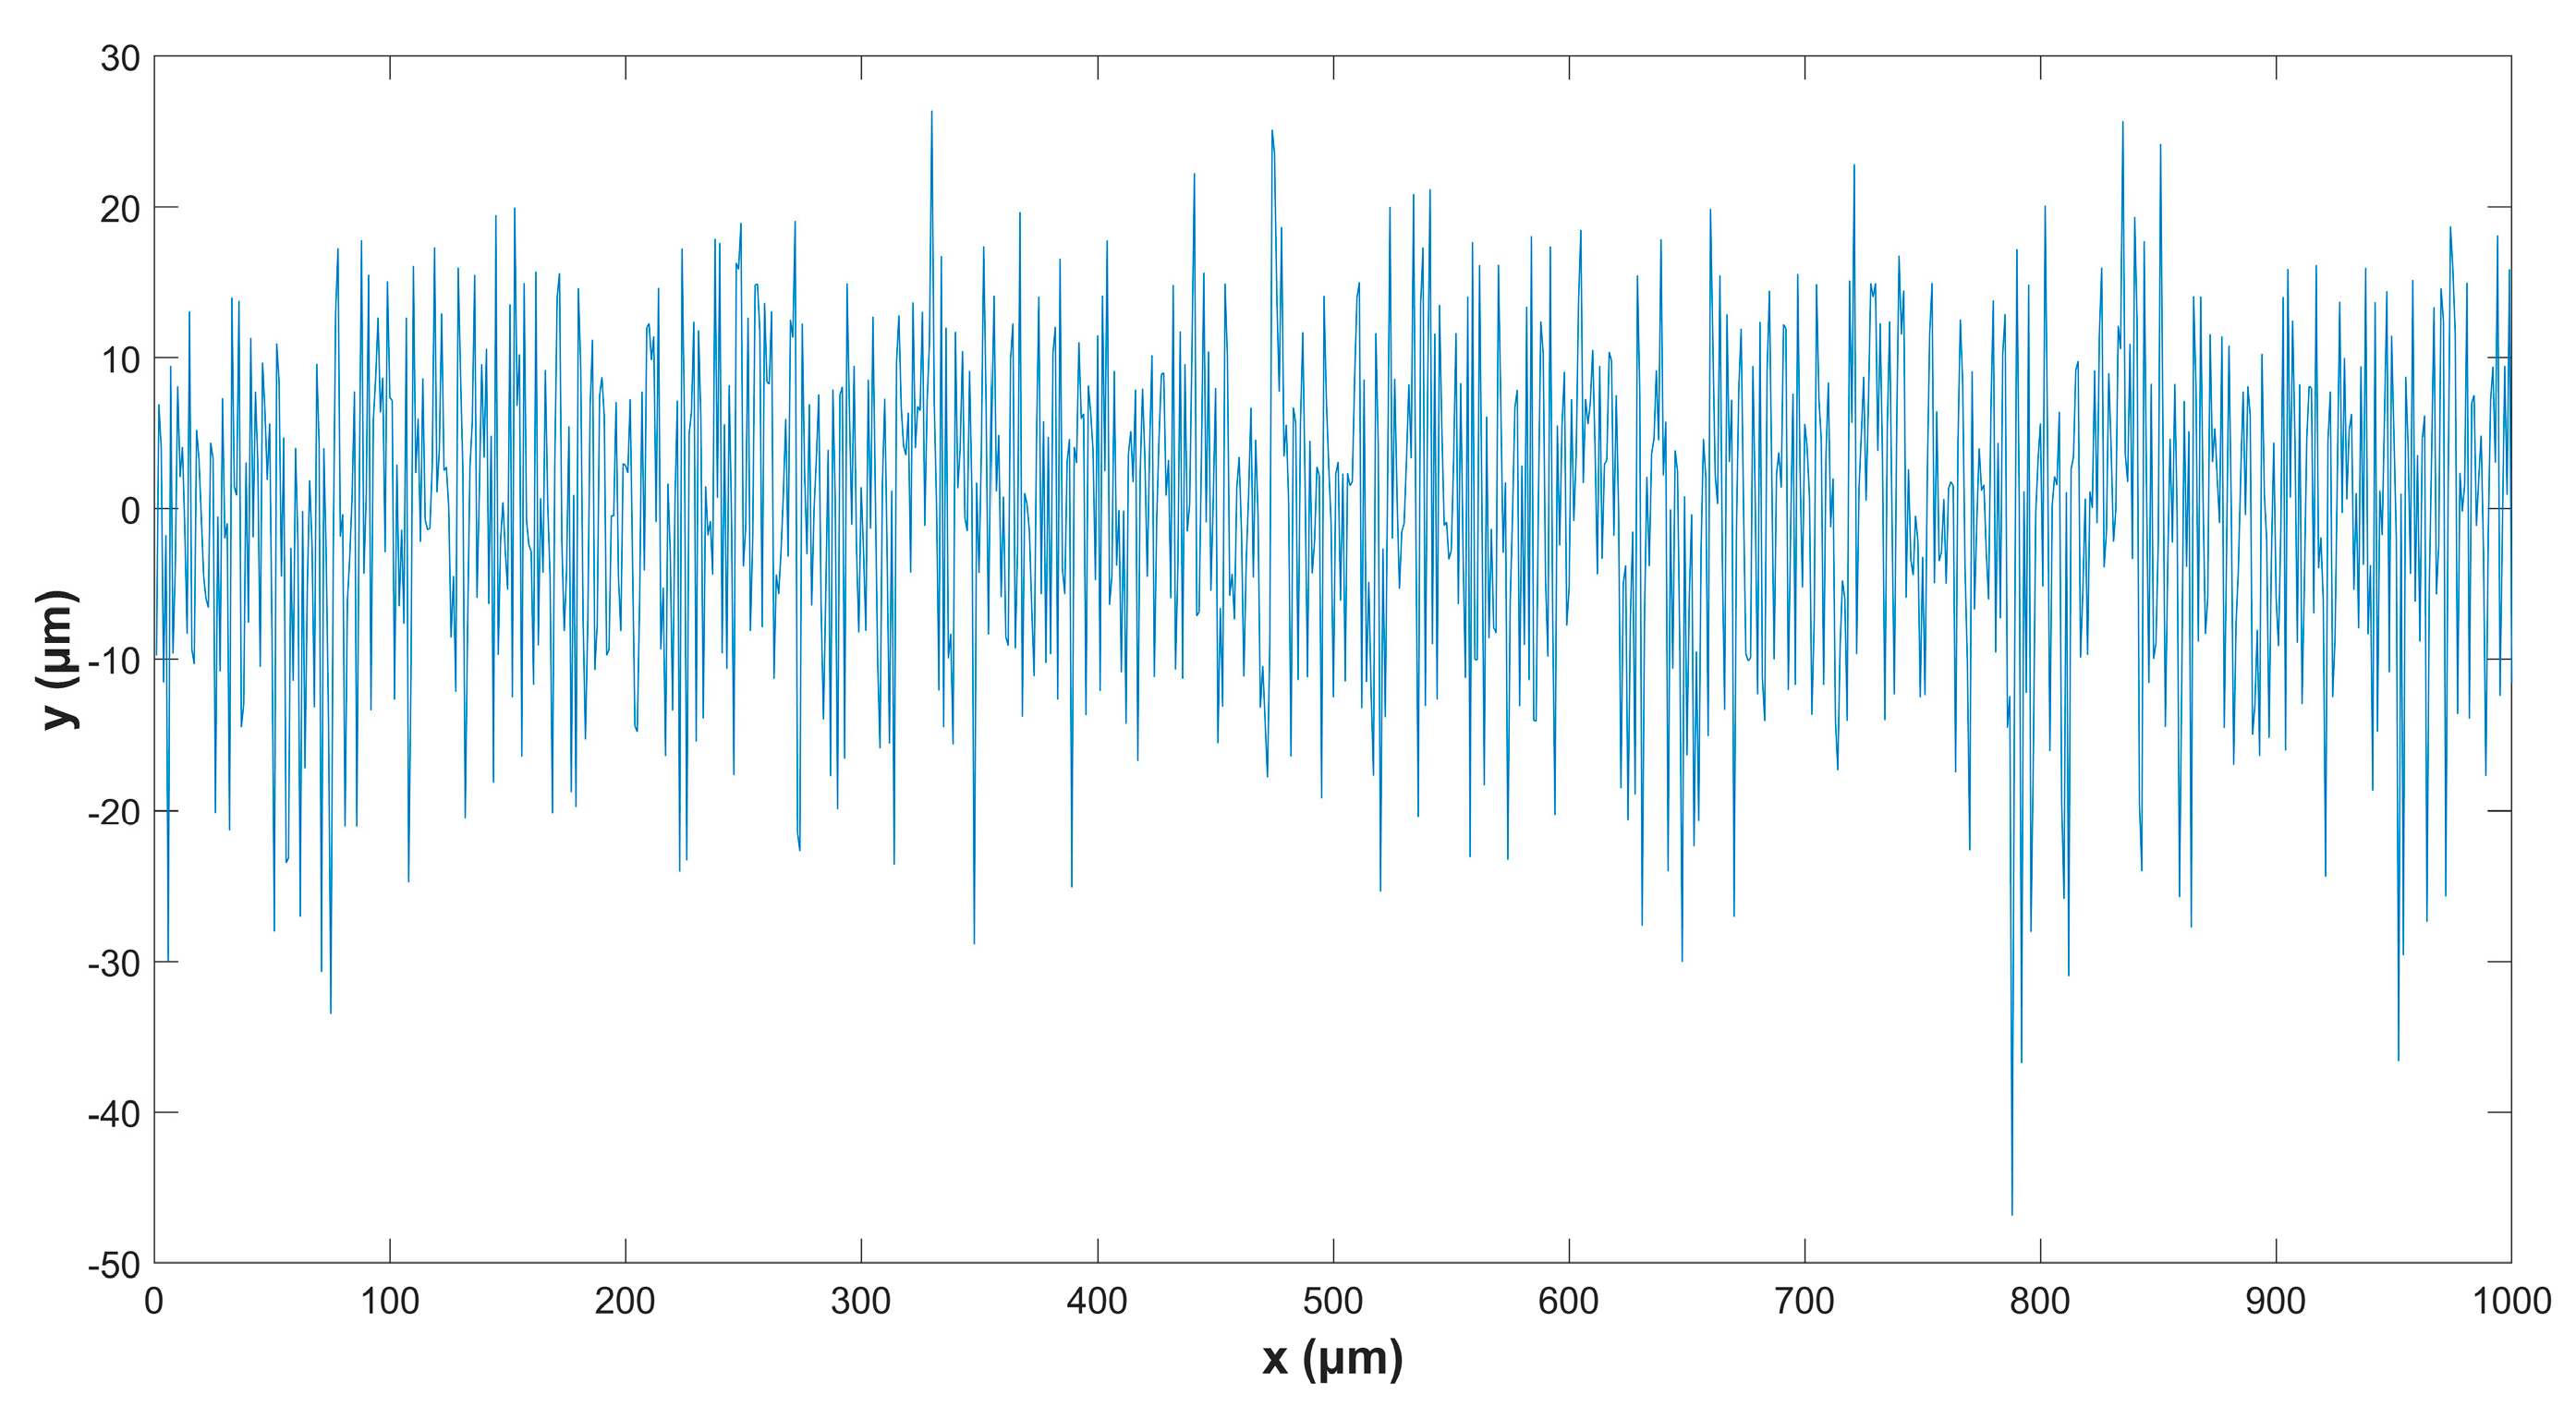
2.3. Experimental Details

For the development of the aforementioned statistical probability distribution models, experimental data from an actual experiment on the AWJ machining of pockets using an eco-friendly abrasive, namely walnut shell, will be used. Using aTaguchi L9 orthogonal array, experiments under different jet pressures, abrasive mass flow rates and standoff distance values were carried out at three levels each, as can be seen in Table 1. The experiments were performed in an HWE-1520 H.G. RIDDER Automatisierungs GmbH machine (H.G. RIDDER H., Hamm, Germany). Rectangular pockets were created on a titanium grade 2 (commercially pure titanium) workpiece with eco-friendly walnut shell abrasives (HERUBIN, Dobra, Poland) by adopting a zig-zag strategy, e.g., straight paths with alternating velocity. The factors which were kept constant during the experiments include the traverse feed rate (100 mm/min), the jet impingement angle (90°) and the stepover value (0.6 mm). The nominal size of the rectangular pockets was 30 mm × 9.6 mm. After the experiments were conducted, surface roughness indicators were measured using VHX-7000 ultra-deep-field microscope (KEYENCE, Mechelen, Belgium). The cutoff (denoted as λc) used for the filtering of roughness profile was chosen based on ISO 4288-1996 standard [62], given the magnitude of the Ra values. As the Ra values were between 2 and 10 μm in cases 1, 2 and 6, λc was selected as 2.5 mm and the evaluation length 12.5 mm, whereas for the other cases, λc was selected as 8 mm and the evaluation length 40 mm.In total, the values of six different indicators, including Ra, Rz, Rp, Rv, Rsk and Rku, were measured and will be used for the development of the roughness models. More specifically, Ra is an indicator which represents the average surface roughness calculated as the arithmetic average of height deviations from the mean line, Rz is an indicator which is defined as the maximum peak-to-valley height of the roughness profile, and the Rp and Rv indicators represent the maximum peak height above the mean line and maximum valley depth below the mean line, respectively. Additionally, Rsk represents the third standardized moment of height profile, namely skewness, which is related to the degree of asymmetry of the profile about the mean line. Finally, the Rku indicator represents the fourth standardized moment of height profile, which is related to the intensity of features of the roughness profile about the mean line.

3. Results

3.1. Evaluation of Rsk and Rku Prediction Based on Different Probability Distributions

The first stage of investigations will involve the evaluation of the applicability of different probability distributions in the case of surface roughness during AWJ milling of blind pockets, witha focus on skewness and kurtosis. As has been previously explained, it is assumed that the height distribution of the roughness profile can be modeled by each of the different probability distributions, with probability density functions described by Equations (1)–(5). In the case of normal or Gaussian distribution, the skewness and kurtosis values are fixed and independent from the values of mean and standard deviation of the distribution, as can be seen from Equation (1), given that there are no additional parameters to alter the scaling or shape of this distribution. Thus, in every case, the adoption of a Gaussian distribution for the modeling of the surface roughness profiles can lead to the generation of surfaces with skewness equal to 0 and kurtosis equal to 3. Thus, the height of the profile will be symmetrically distributed around the mean value, implying that neither the peaks nor the valleys of the surface will be dominant nor that the surface will exhibit considerably sharp peaks. Although this assumption may seem unrealistic, it can be seen from the results of Table 1 that, in some of the cases e.g., 1 or 6, skewness values are very close to 0 and also that kurtosis is close to 3.0 in several cases, such as 5, 7, 8, 9. More specifically, for kurtosis values between 2.7 and 3.3, the percentage error in comparison withthe kurtosis of the normal distribution is, at most, 10%, which is often regarded as an acceptable limit for prediction. As a result, the surface profile could be modeled by the normal distribution in some cases, but it is not possible to achieve both accurate values for Rsk and Rku. In Figure 2, an indicative surface roughness profile generated by random samples from a normal distribution is depicted and, in Figure 3, its corresponding height distribution is plotted in order to verify the validity of the aforementioned statements. From Figure 2 and Figure 3, it can be directly observed that the anticipated characteristics based on the constant skewness and kurtosis values are evident as both peaks and valleys occur in the profile and the distribution of height is mainly symmetrical around the mean line. Finally, in Table 2 the suitability of the normal distribution for predicting skewness and kurtosis values is evaluated by calculating the errors between Rsk and Rku values from the experimental cases and theoretical Rsk and Rku. In the last two columns of Table 2, for the sake of clarity, a qualitative evaluation of the accuracy of the predicted Rsk and Rku values is depicted, with the abbreviation A indicating predicted values with an acceptable value of error (defined as error<10%), MA indicating predicted values with a marginally acceptable value of error (defined as 10% < error < 20%) and U indicating predicted values with an unacceptable value of error (defined as error > 20%). Furthermore, it has to be noted that, based on the conventional percentage error definition, the error of Rsk is 100% for each case as the theoretical Rsk is zero, thus this error cannot directly reflect the difference between theoretical and experimental values andnot applicable (N/A) is mentioned in Table 2 instead. The results of Table 2 suggest that, though the kurtosis of normal distribution is constant, it can still provide surfaces with almost acceptable values of error in some cases but, given that skewness cannot be altered, the use of normal distribution cannot be recommended when seeking to model the roughness profile of pockets produced by AWJM process.
In the case of Rayleigh distribution, as can be seen from Equation (2), there are no parameters available for the regulation of scaling or shape of this distribution. In every case, the fixed values of skewness and kurtosis are 0.631 and 3.245, respectively. As a result, they exhibit higher variation from the experimentally obtained values and will not be selected for further investigation as they cannot be applied tocases in whichthe skewness values can also be negative. In the case of gamma distribution, the skewness and kurtosis values are not constant but depend on a single parameter, as can be seen from Equation (3), namely the shape factor, which can regulate both values based on a specific function. When the shape factor k increases, Rsk and Rku, beginning from relatively large positive values, will asymptotically reach the values of skewness and kurtosis obtained by the normal distribution (0 and 3, respectively) for high values of k; however, it seems that this distribution is more convenient when used tomodel surfaces with high kurtosis and highly positive skewness (e.g., higher than 1), thus it will also not be considered for further investigation.
Other types of distribution which can exhibit improved results compared withthe normal distribution, such as variable skewness with both negative and positive values and variable kurtosis, include modified terms in order to account for height distributions with different skewness and kurtosis values. Two relevant distributions are the asymmetric generalized normal distribution and the skew normal distribution, which aredescribed by Equations (4) and (5).
In the case of asymmetric generalized normal distribution, the predicted values for Rsk and Rku are depicted in Table 3 in comparison withthe experimental values. Although this distribution, mainly by regulating the shape parameter κ andas presented in Equation (4), can provide the exact values for Rsk, its predictive ability regarding Rku is rather limited. This is because the values of Rku are higher than 3.0, meaning that kurtosis is overestimated in every case, mostly above the acceptable limits. Thus, although this distribution offers higher flexibility when modeling surfaces with both negatively and positively skewed height distributions, its inability to accurately depict surfaces with Rku < 3 is a significantreason tonot select this distribution as a potentially useful one for modeling the surface roughness profile of pockets created by AWJM.
In the case of the skew normal distribution, the predicted values for Rsk and Rku are depicted in Table 4 in comparison with the experimental values. It can be seen that the results are mostly similar to the results of Table 3, indicating a close resemblance to the results of asymmetric generalized normal distribution. The predicted Rsk and Rku values for this distribution can be regulated by changing the values of shape parameter α from Equation (5) in order to create profiles as close as possible to the experimental ones. The results of Table 4 suggest that, although skew normal distribution can also predict Rsk with high accuracy, it tends to overestimate Rku in most cases, above the acceptable limits. Although this distribution is also more flexible than the normal distribution and can model both negatively and positively skewed surfaces, it cannot be used for creating highly accurate surface profiles for pockets machined by AWJ.
Another option which will be considered is the use of the Weibull distribution. The Weibull distribution, as can be seen in Equation (6), has additional parameters, like the gamma, asymmetric generalized normal and skew normal distributions, but it can achieve more favorable values regarding the modeling of the skewness and kurtosis of height distribution in the present case, not only for surfaces with height distribution close to the Gaussian distribution. Moreover, it is important to note that, in contrast withnormal, Rayleigh and gamma distributions, the Weibull distribution can generate surfaces with both negative and positive skewness by simply varying the shape parameter. It is also important to note that the variation of kurtosis is not monotonic, allowing for more complex combinations to be achieved [63,64]. However, it is still not possible to alter the skewness and kurtosis independently. In Table 5, results regarding the Rsk and Rku values which can be obtained through Weibull distribution are compared withthe experimental ones. As the achievement of a more exact value for Rsk is considered more important, the determination of these values was based mostly on the Rsk value. Thus, given that Rku cannot be regulated independently, the error values for Rku are anticipated to be higher. In the last two columns, a qualitative evaluation is carried out regarding the degree of error in every case, as was conducted previously. In Table 5, it can be seen that it is possible to create a Weibull distribution for surface profile height with the same value of Rsk but that the Rku values vary in each case. For example, for the results of the experimental cases 2, 5, 8 and 9, the error of Rku values is below 10%, indicating that in these cases the surface characteristics described by the Rsk and Rku indicators can be sufficiently modeled using the Weibull distribution. These cases correspond withexperimental conditions, such as moderate-to-high jet pressure and abrasive mass flow rate. The results of Table 5 suggest that, though the kurtosis values exhibit increased error values in some cases, in more than half of the studied cases, surfaces with both skewness and kurtosis values close to the experimental ones can be created by the proposed approach, so that the use of the Weibull distribution can be recommended when modeling the roughness profile of pockets produced by the AWJM process under various conditions.
Thus, it can be concluded that the comparison of predicted and experimental results shows rather promising indications, as the modeling of height distribution for surfaces without symmetric height distribution by the Weibull distribution can be successful in several cases and with high precision. This is especially so when compared withthe normal distribution, which is often used for modeling rough surfaces after machining, in which case itcan clearlyprovide more realistic surfaces.
In Figure 4 an indicative surface roughness profile generated by random samples from a Weibull distribution is depicted and in Figure 5 the respective height distribution is plotted in order to verify that the profile using the Weibull distribution is clearly skewed. From Figure 4, it can be directly observed that the anticipated characteristics based on the given skewness and kurtosis values are evident as the valleys are more dominant in the profile of the negatively skewed surface. In Figure 6, the suitability of the Weibull distribution for each experimental point is directly depicted in the Rsk–Rku graph when compared withthe experimental data.

3.2. Evaluation of Ra and Rz Prediction Based on Different Probability Distributions

For the second stage of the evaluation of the probability distributions, only the best performing of these, namely the Weibull distribution, will be investigated, along with normal distribution, which will serve as reference for the comparison. During this investigation, it will be assumed that the average roughness, Ra, corresponds witha modified expected value of each statistical distribution, given that it does not represent the average value of the height distribution but the average of its deviations from the mean line.Additionally, the Rz value corresponds withthe 95% confidence interval for the statistical distributions and can be estimated by the cumulative density function (CDF) [65]. Thus, the respective Ra and Rz values will be determined in each case, taking into consideration the parameter values used toobtain the Rsk and Rku values during the previous step as well.
In the case of the Weibull distribution, given the optimum values of the shape parameter, determined during the previous step of the investigation, it is possible to directly determine a suitable value of the scale parameter in order for the Ra values to be equal to those of the experiments. In the case of Rz values, as can be seen in Table 6, the predicted values also exhibit quite high accuracy, especially in cases 1, 2, 4, 5, 6 and 7, meaning that, in various cases, the surface roughness profiles related to AWJ milling, regarding both the average value and range, can be adequately predicted using an appropriate Weibull distribution.
On the other hand, the normal distribution has a clear advantage towards the prediction of the exact values for Ra and Rz, given that the mean and variance of the probability distribution can be independently altered. This result implies that, in the case with low skewness and kurtosis close to 3.0, the normal distribution can simulate the machined surface with a high accuracy based on the values of four different surface roughness indicators.

3.3. Evaluation of Rp and Rv Prediction Based on Different Probability Distributions

Finally, the capabilities of different probability distributions will be compared regarding the values of Rp and Rv. Based on the results of the previous subsection, one can see that, although the Weibull distribution cannot achieve theprediction of the exact experimental values for both Ra and Rz simultaneously, it is possible that a good approximation of Rz can be provided. Thus, based on the fact that the Weibull distribution can also predict Rsk accurately, it may be able to predict the Rp and Rv values. On the other hand, the normal distribution can predict the exact Rz value, but, due to its zero skewness, assumes that Rp = Rv, something that is not correct in most experimental cases. The results produced by the Weibull distribution are presented in Table 7, indicating the anticipated limitations of the probability distributions to match the Rp and Rv values. In fact, regarding the Rp values, acceptable accuracy was observed only in cases 1, 4 and 7, indicating that the peak height is relatively difficult to predict with a high degree of accuracy. On the other hand, the degree of accuracy for the prediction of Rv is fairlyhigh, with error values below 10% for cases 1, 3–7.
However, the results should alsobe evaluated from another perspective, that of practical application. For many applications, only Ra is taken into account as a consideration and most authors have identified the importance of Rsk and Rku regarding the friction and wear properties of the surface. Similarly, regarding Rp and Rv andbased on the relevant literature [52,53,54,55], it has been pointed out that the ratio of these two indicators is more important than their nominal values, given that the ratio Rp/Rv characterizes the volume of material and voids on the profile.
In Table 8, the values of the ratio Rp/Rv from the experiments and the respective values resultingfrom the Weibull distribution are depicted. As can be seen, in most cases, such as 1, 2, 4, 7, 8, and 9, the values are below or close to 10%.As a set of parameters, including Rsk, Rku and Rp/Rv, is often considered during the evaluation of critical components, such as implants [52,66,67], the ability to capture their values by the proposed methodology isimportant. Finally, these results indicate that, although in some cases the exact prediction of nominal values of individual roughness indicators cannot be realized, the modeling of roughness profiles using statistical probability distributions, such as the Weibull distribution, can essentially provide a higher degree of realism thanGaussian surfaces, and without involving a high computational cost or complex calculations.

4. Conclusions

In this work, an evaluation of the possibility of the use of various statistical probability distributions for the purpose of modeling surface roughness profiles during AWJ pocket milling is carried out. A three-stage evaluation procedure was carried out in order to determine whether the six selected probability distributions were able to be used to predict the values of different surface roughness indicators. After the investigations were carried out, several important conclusions were able to be drawn.
Regarding both the Rsk and Rku values, which are important for the characterization of the tribological and lubrication properties of the surfaces, the Weibull distribution exhibited the highest potential, as it can directly approximate Rsk and can also predict Rku inseveral cases, based on appropriate values of the shape parameter. On the other hand, distributions lacking a special shape parameter, such as the normal distribution, are not ableto approximate the values of these parameters, apart from in specific cases.
Average surface roughness Ra can be easily approximated by every distribution, due to their mean or scale-related terms. The Weibull distribution can lead to high levels of accuracy in several cases for fixed Rsk, Rku and Ra values compared withthe experimentally derived value of Rz, whereas the normal distribution can directly predict both Ra and Rz, due to its terms which can be independently related to the mean and the variance of the height distribution.
Although the nominal values of the Rp and Rv indicators cannot be directly andsimultaneously predicted for every case, either by the Weibull distributionor the normal distribution, given that it predicts zero skewness values, it has beenshown that their ratio, which has a significant practical importance regarding friction and wear properties, can be approximated with acceptable error levels in most cases by the Weibull distribution.
In conclusion, thisthorough three-stage investigation has revealed that, although it is not possible to simultaneously predict the values of every roughness indicator in the case of the AWJ milling of pockets, the proposed methodology successfully leads to the modeling of the height distribution of the surface profile, leading to the approximation of crucial indicators of practical significance, such as Ra, Rz, Rsk, Rku and Rp/Rv, and with adequate precision in several cases. Based on this methodology, it is possible to generate more realistic rough surfaces than those usually used under the assumptions of normally distributed height or that rely only on Ra and Rz, without high computational cost.

Author Contributions

Conceptualization, N.E.K. and P.K.-O.; methodology, N.E.K. and P.K.-O.; software, N.E.K.; validation, N.E.K.; formal analysis, N.E.K., P.K.-O. and M.T.; investigation, N.E.K.; resources, P.K.-O. and M.T.; data curation, N.E.K.; writing—original draft preparation, N.E.K., P.K.-O. and M.T.; writing—review and editing, N.E.K.; visualization, N.E.K.; supervision, N.E.K., P.K.-O. and M.T.; project administration, N.E.K., P.K.-O. and M.T.; funding acquisition, N.E.K. All authors have read and agreed to the published version of the manuscript.

Funding

This research was supported by Polish National Agency for Academic Exchange (NAWA, Agreement No.BPN/ULM/2022/1/00129/U/00001).

Institutional Review Board Statement

Not applicable.

Informed Consent Statement

Not applicable.

Data Availability Statement

Data are contained within the article.

Conflicts of Interest

The authors declare no conflicts of interest.The funders had no role in the design of the study; in the collection, analyses, or interpretation of data; in the writing of the manuscript; or in the decision to publish the results.

References

  1. Pawlus, P.; Reizer, R.; Krolczyk, G.M. Modelling and prediction of surface textures after abrasive machining processes: A review. Measurement 2023, 220, 113337. [Google Scholar] [CrossRef]
  2. Qu, S.; Yao, P.; Gong, Y.; Chu, D.; Yang, Y.; Li, C.; Wang, Z.; Zhang, X.; Hou, Y. Environmentally friendly grinding of C/SiCs using carbon nanofluid minimum quantity lubrication technology. J. Clean Prod. 2022, 366, 132898. [Google Scholar] [CrossRef]
  3. Zeng, Q.; Qin, Y.; Chang, W.; Luo, X. Correlating and evaluating the functionality-related properties with surface texture parameters and specific characteristics of machined components. Int. J. Mech. Sci. 2018, 149, 62–72. [Google Scholar] [CrossRef]
  4. Molnar, V.; Sztankovics, I. Analysis of Roughness Parameters Determining Tribological Properties in Hard Turned Surfaces. Hung. J. Ind. Chem. 2021, 49, 77–84. [Google Scholar] [CrossRef]
  5. Molnar, V.; Szabo, G. Designation of minimum measurement area for the evaluation of 3D surface texture. J. Manuf. Process. 2022, 83, 40–48. [Google Scholar] [CrossRef]
  6. Molnar, V. Influence of Cutting Parameters and Tool Geometry on Topography of Hard Turned Surfaces. Machines 2023, 11, 665. [Google Scholar] [CrossRef]
  7. Nowicki, B. Surface roughness and measurement with new contact methods. Int. J. Mach. Tool Des. Res. 1996, 26, 61–68. [Google Scholar] [CrossRef]
  8. Nowicki, B.; Jarkiewicz, A. The in-process surface roughness measurement using fringe field capacitive (FFC) method. Int. J. Mach. Tools Manuf. 1998, 38, 725–732. [Google Scholar] [CrossRef]
  9. Goch, G.; Peters, J.; Lehmann, P.; Liu, H. Requirements for the application of speckle correlation techniques to on-line inspection of surface roughness. CIRP Ann. 1999, 48, 467–470. [Google Scholar] [CrossRef]
  10. Peters, J.; Lehmann, P.; Schoene, A. Measuring roughness with dichromatic speckle correlation. In Proceedings of the Optical Inspection and Micromeasurements, Besancon, France, 10–14 June 1996; Volume 2782. [Google Scholar]
  11. Pawlus, P.; Reizer, R.; Zelasko, W. Two-process random textures: Measurement, characterization, modeling and tribological impact: A review. Materials 2022, 15, 268. [Google Scholar] [CrossRef]
  12. Felhő, C.; Karpuschewski, B.; Kundrák, J. Surface roughness modelling in face milling. Procedia CIRP 2015, 31, 136–141. [Google Scholar] [CrossRef]
  13. Felhő, C.; Kundrák, J. A method for the determination of theoretical roughness in face milling considering the run-out of the inserts. Solid State Phenom. 2017, 261, 251–268. [Google Scholar] [CrossRef]
  14. Felhő, C.; Kundrák, J. 3D roughness parameters of surfaces face milled by special tools. Manuf. Technol. 2016, 16, 532–538. [Google Scholar]
  15. Kundrák, J.; Felhő, C. Topography of the machined surface in high performance face milling. Procedia CIRP 2018, 77, 340–343. [Google Scholar] [CrossRef]
  16. Felhő, C.; Varga, G. Theoretical roughness modeling of hard turned surfaces considering tool wear. Machines 2022, 10, 188. [Google Scholar] [CrossRef]
  17. Liu, C.; Gao, L.; Wang, G.; Xu, W.; Jiang, X.; Yang, T. Online reconstruction of surface topography along the entire cutting path in peripheral milling. Int. J. Mech. Sci. 2020, 185, 105885. [Google Scholar] [CrossRef]
  18. Cai, C.; An, Q.; Ming, W.; Chen, M. Modelling of machined surface topography and anisotropic texture direction considering stochastic tool grinding error and wear in peripheral milling. J. Mater. Process. Tech. 2021, 292, 117065. [Google Scholar] [CrossRef]
  19. Denkena, B.; Kruger, M.; Bachrathy, D.; Stepan, G. Model based reconstruction of milled surface topography from measured cutting forces. Int. J. Mach. Tools Manuf. 2012, 54–55, 25–33. [Google Scholar] [CrossRef]
  20. Gu, Q.; Deng, Z.; Lv, L.; Liu, T.; Teng, H.; Wang, D.; Yuan, J. Prediction research for surface topography of internal grinding based on mechanism and data model. Int. J. Adv. Manuf. Technol. 2021, 113, 821–836. [Google Scholar] [CrossRef]
  21. Kumar, H.; Ramkumar, J.; Venkatesh, K.S. Surface texture evaluation using 3D reconstruction from images by parametric anisotropic BRDF. Measurement 2018, 125, 612–633. [Google Scholar] [CrossRef]
  22. Gu, R.; Wang, Z.; Ma, L.; Nie, J. Calibration method of laser scanning measurement system for large-scale component using a free-form surface reconstruction model. Measurement 2023, 210, 112511. [Google Scholar] [CrossRef]
  23. Zhang, H.; Liu, J.; Zou, D.; Chen, N. Knowledge-based transfer fuzzy clustering with non-local spatial information for surface roughness measurement. Measurement 2021, 174, 109076. [Google Scholar] [CrossRef]
  24. Patel, D.R.; Kiran, M.B. A non-contact approach for surface roughness prediction in CNC turning using a linear regression model. Mater. Today Proc. 2020, 26, 350–355. [Google Scholar] [CrossRef]
  25. Shi, W.C.; Zheng, J.M.; Li, Y.; Li, X.B. Three-Dimensional Reconstruction Method for Machined Surface Topography Based on Gray Gradient Constraints. Appl. Sci. 2019, 9, 591. [Google Scholar] [CrossRef]
  26. Dhanasekar, B.; Ramamoorthy, B. Assessment of surface roughness based on super resolution reconstruction algorithm. Int. J. Adv. Manuf. Technol. 2008, 35, 1191–1205. [Google Scholar] [CrossRef]
  27. Thielen, S.; Magyar, B.; Piros, A. Reconstruction of three-dimensional turned shaft surfaces with fractal functions. Trib. Int. 2016, 95, 349–357. [Google Scholar] [CrossRef]
  28. Wang, H.; Chi, G.; Jia, Y.; Ge, C.; Yu, F.; Wang, Z.; Wang, Y. Surface roughness evaluation and morphology reconstruction of electrical discharge machining by frequency spectal analysis. Measurement 2021, 172, 108879. [Google Scholar] [CrossRef]
  29. Perez-Rafols, F.; Almqvist, A. On the stiffness of surfaces with non-Gaussian height distribution. Sci. Rep. 2021, 11, 1863. [Google Scholar] [CrossRef]
  30. Zhao, J.; Wang, Z.; Li, Z.; Zhu, R. Fractal simulation of surface topography and prediction of its lubrication characteristics. Surf. Topogr. Metrol. Prop. 2021, 9, 045038. [Google Scholar] [CrossRef]
  31. Pei, L.; Hyun, S.; Molinari, J.F.; Robbins, M.O. Finite element modeling of elasto-plastic contact between rough surfaces. J. Mech. Phys. Solid 2005, 53, 2385–2409. [Google Scholar] [CrossRef]
  32. Li, L.; Li, G.; Wang, J.; Fan, C.; Cai, A. Fretting wear mechanical analysis of double rough surfaces based on energy method. Proc. IMechE Part J J. Eng. Trib. 2023, 237, 356–368. [Google Scholar] [CrossRef]
  33. Han, J.; Zheng, W.; Chen, Q.; Sun, J.; Xu, S. Study on size effect of surface roughness based on the 3D Voronoi model and establishement of roughness prediction model in micro-metal forming. Coatings 2022, 12, 1659. [Google Scholar] [CrossRef]
  34. Bonari, J.; Paggi, M.; Dini, D. A new finite element paradigm to solve contact problems with roughness. Int. J. Solid Struct. 2022, 253, 111643. [Google Scholar] [CrossRef]
  35. Gao, W.; Wang, L.; Coffey, J.K.; Wu, H.; Daver, F. An attempt to simulate structure and realistic images of scratches on rough polymeric surfaces. J. Polym. Sci. 2020, 58, 3209–3218. [Google Scholar] [CrossRef]
  36. Megalingam, A.; Mayuram, M.M. Effect of surface parameters on finite element method based deterministic Gaussian rough surface contact model. Proc. IMechE Part J J. Eng. Trib. 2014, 228, 1358–1373. [Google Scholar] [CrossRef]
  37. Kartini; Saputra, E.; Ismail, R.; Jamari, J.; Bayuseno, A.P. Analysis of the contact area of smooth and rough surfaces in contact with sphere indenter using finite element method. MATEC Web Conf. 2016, 58, 04007. [Google Scholar] [CrossRef]
  38. Wang, B.B.; Chen, H.K.; Xu, G.T.; Zhang, J.W.; Zhao, M.H. A theoretical model for predicting the surface topography of inhomogeneous materials after shot peening. Int. J. Adv. Manuf. Technol. 2022, 119, 7533–7541. [Google Scholar] [CrossRef]
  39. Xie, J.; Rittel, D. Three-dimensional stochastic modeling of metallic surface roughness resulting from pure waterjet peening. Int. J. Eng. Sci. 2017, 120, 241–253. [Google Scholar] [CrossRef]
  40. Xie, J.; Rittel, D.; Chen, P. Modeling the topographic evolution of a rough metallic surface resulting from impact of water droplets. Int. J. Eng. Sci. 2019, 144, 103142. [Google Scholar] [CrossRef]
  41. Xie, J.; Rittel, D. The effects of waterjet peening on a random-topography metallic implant surface. Eur. J. Mech. A/Solids 2018, 71, 235–244. [Google Scholar] [CrossRef]
  42. Xie, J.; Chen, P.; Rittel, D. Finite element modeling of multiple water droplets impact onto a rough surface: Re-assessing Sa and surface wavelength. J. Mech. Behav. Biom. Mater. 2020, 110, 103816. [Google Scholar] [CrossRef] [PubMed]
  43. He, Z.; Cui, B.; Zhao, S.; Liu, Z.; Yu, J.; Li, C.; Yu, H.; Lei, C. Numerical simulation of surface topography and residual stress after abrasive water jet sequential peening. Proc. IMechE Part L J. Mat. Des. Appl. 2021, 235, 774–795. [Google Scholar] [CrossRef]
  44. Li, C.; Piao, Y.; Meng, B.; Hu, Y.; Li, L. Phase transition and plastic deformation mechanisms induced by self-rotating grinding of GaN single crystals. Int. J. Mach. Tools Manuf. 2022, 172, 103827. [Google Scholar] [CrossRef]
  45. Molnar, V. Asymmetric height distribution of surfaces machined by hard turning and grinding. Symmetry 2022, 14, 1591. [Google Scholar] [CrossRef]
  46. Ba, E.C.T.; Martins, P.S.; Dumont, M.R. Statistical study of surface texture and chip formation during turning of AISI 1020 steel: Emphasis on parameters Rsk, Rku, and Rk family and on the chip thickness ratio. Int. J. Adv. Manuf. Technol. 2022, 121, 8257–8283. [Google Scholar]
  47. Dzierwa, A. Influence of surface preparation on surface topography and tribological behaviours. Arch. Civil Mech. Eng. 2017, 17, 502–510. [Google Scholar] [CrossRef]
  48. Sedlaček, M.; Podgornik, B.; Vižintin, J. Modeling of surface topography for reduced friction. In Proceedings of the 9th Biennial ASME Conference on Engineering Systems Design and Analysis ESDA 08, Haifa, Israel, 7–9 July 2008. [Google Scholar]
  49. Ba, E.C.T.; Dumont, M.R.; Martins, P.S.; Drumond, R.M.; da Cruz, M.P.M.; Vieira, V.F. Investigation of the effects of skewness Rsk and kurtosis Rku on tribological behavior in a pin-on-disc test of surfaces machined by conventional milling and turning processes. Mater. Res. 2021, 24, e20200435. [Google Scholar] [CrossRef]
  50. Peters, J.; Bryan, J.B.; Estler, W.T.; Evans, C.; Kunzmann, H.; Lucca, D.A.; Sartori, S.; Sato, H.; Thwaite, E.G.; Vanherck, P.; et al. Contribution of CIRP to the development of metrology and surface quality evaluation during the last fifty years. CIPR Ann. 2001, 50, 471–488. [Google Scholar] [CrossRef]
  51. Pawlus, P.; Reizer, R.; Wieczorowski, M.; Krolczyk, G. Material ratio curve as information on the state of surface topography—A review. Precis. Eng. 2020, 65, 240–258. [Google Scholar] [CrossRef]
  52. Mehl, A.C.S.B.; Benegra, M.; Pintaude, G. Surface characterization of the seating platform of titanium implant processed with different textures. J. Brazil Soc. Mech. Sci. Eng. 2021, 43, 130. [Google Scholar] [CrossRef]
  53. Pawlus, P.; Reizer, R.; Wieczorowski, M. Characterization of the shape of height distribution of two-process profile. Measurement 2020, 153, 107387. [Google Scholar] [CrossRef]
  54. Grzesik, W.; Wanat, T. Comparative assessment of surface roughness produced by hard machining with mixed ceramic tools including 2D and 3D analysis. J. Mater. Process. Technol. 2005, 169, 364–371. [Google Scholar] [CrossRef]
  55. Horváth, R.; Drégelyi-Kiss, Á.; Mátyási, G. The examination of surface roughness parameters in the fine turning of hypereutectic aluminium alloys. UPB Sci. Bull. Ser. D Mech. Eng. 2015, 77, 205–216. [Google Scholar]
  56. Nowicki, B. Multiparameter representation of surface roughness. Wear 1985, 102, 161–176. [Google Scholar] [CrossRef]
  57. Lăpuşteanu, A.; Agop, M.; Paleu, V. Fractal dimension in tribology—An overview. IOP Conf. Ser. Mat. Sci. Eng. 2022, 1262, 012009. [Google Scholar] [CrossRef]
  58. Kang, M.C.; Kim, J.S.; Kim, K.H. Fractal dimension analysis of machined surface depending on coated tool wear. Surf. Coat. Technol. 2005, 193, 259–265. [Google Scholar] [CrossRef]
  59. Ling, F.F. Fractals, engineering surfaces and tribology. Wear 1990, 136, 141–156. [Google Scholar] [CrossRef]
  60. Thomopoulos, N.T. Continuous distributions. In Probability Distributions, 1st ed.; Thomopoulos, N.T., Ed.; Springer International Publishing AG: Cham, Switzerland, 2018; pp. 1–25. [Google Scholar]
  61. Ahrari, V.; Baratpour, S.; Habibirad, A.; Fakoor, V. Goodness of fit tests for Rayleigh distribution based on quantiles. Commun. Stat. Simul. Comput. 2022, 51, 341–357. [Google Scholar] [CrossRef]
  62. ISO 4288:1996; Geometrical Product Specifications (GPS). International Organization for Standardization: Geneva, Switzerland, 1996.
  63. Chang, L.; Jeng, Y.R. Effects of negative skewness of surface roughness on the contact and lubrication of nominally flat metallic surfaces. Proc. IMechE Part J J. Eng. Trib. 2012, 227, 559–569. [Google Scholar] [CrossRef]
  64. Sabino, T.S.; Carneiro, A.M.C.; Carvalho, R.P.; Pires, F.M.A. The impact of non-Gaussian height distributions on the statistics of isotropic random rough surfaces. Trib. Int. 2022, 173, 107578. [Google Scholar] [CrossRef]
  65. Zhang, S.J.; To, S.; Wang, S.J.; Zhang, G.Q. A new representation with probability distribution for nanometric surface roughness in ultra-precision machining. Prec. Eng. 2016, 45, 445–449. [Google Scholar] [CrossRef]
  66. Thangaraj, M.; Ahmadein, M.; Alsaleh, N.A.; Elsheikh, A.H. Optimization of Abrasive Water Jet Machining of SiC Reinforced Aluminum Alloy Based Metal Matrix Composites Using Taguchi–DEAR Technique. Materials 2021, 14, 6250. [Google Scholar] [CrossRef] [PubMed]
  67. Muthuramalingam, T.; Vasanth, S.; Vinothkumar, P.; Geethapriyan, T.; Mohamed Rabik, M. Multi Criteria Decision Making of Abrasive Flow Oriented Process Parameters in Abrasive Water Jet Machining Using Taguchi–DEAR Methodology. Silicon 2021, 10, 2015–2021. [Google Scholar] [CrossRef]
Figure 1. Outline of the present work.
Surfaces 07 00021 g001
Figure 2. Indicative surface roughness profile with normal height distribution.
Surfaces 07 00021 g002
Figure 3. Height distribution of the indicative surface roughness profile.
Surfaces 07 00021 g003
Figure 4. Indicative surface roughness profile with the Weibull height distribution.
Surfaces 07 00021 g004
Figure 5. Height distribution of the indicative surface profile.
Surfaces 07 00021 g005
Figure 6. Comparison of the experimental and predicted (Rsk, Rku) pairs on the topological map.
Surfaces 07 00021 g006
Table 1. Values of surface roughness indicators from the AWJ pocket milling experiments.
Caseh (mm)ma (g/s)P (MPa)Ra (μm)Rz (μm)Rp (μm)Rv (μm)Rsk (−)Rku (−)
1321506.62228.69414.53715.408−0.0462.098
2342505.75625.75815.54315.240−0.1182.524
33635078.207426.930205.123234.357−0.5702.360
47225011.74653.59824.96628.706−0.1042.146
57435086.673460.477324.185193.0830.1272.690
6761509.93352.50024.05329.997−0.0602.300
7112350107.450537.975216.690260.027−0.7903.010
811415010.44759.74033.33326.4070.2332.777
911625013.73079.76740.56739.2030.1402.823
Table 2. Comparison of the values Rsk andRku from the normal distribution (theoretical values) and experimental values (please note the abbreviations A: acceptable error, MA: marginally acceptable error, U: unacceptable error, N/A: not applicable).
CaseRsk,
Theor.
Rku,
Theor.
Rsk, Exp.Rku, Exp.Error Rsk (%)Error Rku (%)Evaluation
103−0.0462.098N/A−42.993UU
203−0.1182.524N/A−18.859UMA
303−0.5702.360N/A−27.119UU
403−0.1042.146N/A−39.795UU
5030.1272.690N/A−11.524UMA
603−0.0602.300N/A−30.435UU
703−0.7903.010N/A0.332UA
8030.2332.777N/A−8.030UA
9030.1402.823N/A−6.270UA
Table 6. Comparison of values of Rz from the Weibull distribution (theoretical values) and experimental values (please note the abbreviations A: acceptable error, MA: marginally acceptable error, U: unacceptable error).
CaseRz,
Theor.
Rz, Exp. Percentage Error (%)Evaluation
128.69431.60010.128MA
225.75825.8000.163A
3426.930370.700−13.171MA
453.59856.3505.135A
5460.477412.000−10.528MA
652.50048.200−8.190A
7537.975501.500−6.780A
859.74047.530−20.439U
979.76764.460−19.190MA
Table 7. Comparison of the values of Rp and Rv from the Weibull distribution (theoretical values) and experimental values (please note the abbreviations A: acceptable error, MA: marginally acceptable error, U: unacceptable error).
CaseRp, TheorRp, Exp. Rv, Theor.Rv, Exp.Percentage Error (%)Percentage Error (%)Evaluation
115.61614.53716.38415.4087.4206.336AA
212.42615.54313.37515.240−20.057−12.241UMA
3152.331205.123218.369234.357−25.737−6.822UA
427.23124.96629.11828.7069.0721.437AA
5212.332324.185189.668193.083−34.503−1.769UA
619.56324.05328.63729.997−18.667−4.534MAA
7225.474216.690276.026260.0274.0546.153AA
825.20933.33322.32126.407−24.372−15.473UMA
933.36040.56731.10039.203−17.766−20.669MAU
Table 3. Comparison of the values Rsk andRku from the asymmetric generalized normal distribution (theoretical values) and experimental values (please note the abbreviations A: acceptable error, MA: marginally acceptable error, U: unacceptable error).
CaseRsk,
Theor.
Rku,
Theor.
Rsk, Exp.Rku, Exp.Error Rsk (%)Error Rku (%)Evaluation
1−0.0463.004−0.0462.0980.45743.174AU
2−0.1183.025−0.1182.5240.00819.840AMA
3−0.5703.584−0.5702.3600.07451.866AU
4−0.1043.019−0.1042.1460.16340.694AU
50.1273.0290.1272.6900.02412.591AMA
6−0.0603.006−0.0602.3000.01730.713AU
7−0.7904.131−0.7903.0100.04137.235AU
80.2333.0970.2332.7770.00611.511AMA
90.1403.0350.1402.8230.1997.509AA
Table 4. Comparison of the values Rsk andRku from the skew normal distribution (theoretical values) and experimental values (please note the abbreviations A: acceptable error, MA: marginally acceptable error, U: unacceptable error).
CaseRsk,
Theor.
Rku,
Theor.
Rsk, Exp.Rku, Exp.Error Rsk (%)Error Rku (%)Evaluation
1−0.0463.014−0.0462.0980.07543.681AU
2−0.1183.051−0.1182.5240.01420.865AU
3−0.5703.414−0.5702.3600.08144.654AU
4−0.1043.043−0.1042.1460.06141.790AU
50.1273.0560.1272.6900.00013.600AMA
6−0.0603.021−0.0602.3000.14831.330AU
7−0.7903.639−0.7903.0100.00320.891AU
80.2333.1250.2332.7770.02912.548AMA
90.1403.0630.1402.8230.0008.522AA
Table 5. Comparison of the values Rsk andRku from the Weibull distribution (theoretical values) and experimental values (please note the abbreviations A: acceptable error, MA: marginally acceptable error, U: unacceptable error).
CaseRsk,
Theor.
Rku,
Theor.
Rsk, Exp.Rku, Exp.Error Rsk (%)Error Rku (%)Evaluation
1−0.0462.730−0.0462.098−0.065−30.123AU
2−0.1182.765−0.1182.524−0.322−9.556AA
3−0.5713.410−0.5702.360−0.170−44.477AU
4−0.1042.757−0.1042.146−0.033−28.461AU
50.1272.7180.1272.690−0.176−1.031AA
6−0.0612.736−0.0602.300−0.345−18.944AMA
7−0.7934.014−0.7903.010−1.316−33.369AU
80.2332.7600.2332.777−0.0860.628AA
90.1402.7210.1402.823−0.2863.616AA
Table 8. Comparison of the values of Rp/Rv from the Weibull distribution (theoretical values) and experimental values (please note the abbreviations A: acceptable error, MA: marginally acceptable error, U: unacceptable error).
CaseRp/Rv,
Theor.
Rp/Rv, Exp.Percentage Error (%)Evaluation
10.9530.9431.019A
20.9291.020−8.907A
30.6980.875−20.300U
40.9350.8697.528A
51.1191.679−33.324U
60.6830.802−14.805MA
70.8170.833−1.977A
81.1291.262−10.527MA
91.0731.0353.660A
Disclaimer/Publisher’s Note: The statements, opinions and data contained in all publications are solely those of the individual author(s) and contributor(s) and not of MDPI and/or the editor(s). MDPI and/or the editor(s) disclaim responsibility for any injury to people or property resulting from any ideas, methods, instructions or products referred to in the content.

