
Returning Cropland to Grassland as a Potential Method for Increasing Carbon Storage in Dry-Hot Valley Areas

1
College of Forestry, Southwest Forestry University, Kunming 650224, China
2
Key Laboratory of National Forestry and Grassland Administration on Forestry and Ecological Big Data, Southwest Forestry University, Kunming 650224, China
3
College of Big Data and Intelligent Engineering, Southwest Forestry University, Kunming 650224, China
4
Chinese Academy of Tropical Agricultural Sciences, Haikou 571101, China
5
Yunnan Digital Industry Planning and Design Co., Ltd., Kunming 650108, China
*
Author to whom correspondence should be addressed.
Sustainability 2024, 16(10), 4150; https://doi.org/10.3390/su16104150
Submission received: 5 April 2024
/
Revised: 4 May 2024
/
Accepted: 13 May 2024
/
Published: 15 May 2024
(This article belongs to the Topic Carbon Capture, Storage and Utilisation Technologies (CCS/CCU) - 2nd Volume)
Abstract
:A key aspect of mitigating global climate warming is enhancing the carbon storage capacity of terrestrial ecosystems. China’s Grain for Green Program (GFGP) is the largest ecological restoration project in the world, which is closely associated with land use change. A systematic assessment of the GFGP’s impact on regional carbon storage is of great significance for promoting regional development and maintaining ecosystem stability. Therefore, this study selects a typical dry-hot valley area—Yanjin County—as the study area, which serves as an ecological protection barrier in Southwest China. We employed the InVEST model and Geo-detector model based on land use data from three periods (2000, 2014, and 2019), combined with static overlay analysis methods, in order to evaluate the impact of the implementation of GFGP on the spatial and temporal distribution of carbon storage. We also explored the driving factors of the spatial differentiation of carbon storage. The results indicate that, since the implementation of the GFGP, a total of 180.03 km2 of cropland has been converted to forestland, increasing the forest cover rate from 81.83% to 83.37%. The project has contributed 5.88 × 10⁵ t to regional carbon storage, effectively offsetting carbon emissions caused by human activities such as urban expansion while also promoting the growth of regional carbon storage. The implementation of the GFGP has led to changes in three types of land use. Among them, converting cropland to forestland (3262 t/km2) is the most effective carbon sequestration method, and converting cropland to grassland (2530 t/km2) has shown great potential in carbon sequestration. Additionally, the study found that elevation (0.038–0.059) is the main factor affecting the spatial differentiation of carbon storage, and the interaction between elevation and other factors can effectively enhance the carbon sequestration capacity of regional ecosystems. Overall, the GFGP not only plays a significant role in combating climate warming but also makes an important contribution to improving the stability and sustainability of regional ecosystems.
1. Introduction
Climate change on a global scale is one of the most significant challenges human society has ever faced [1]. Controlling greenhouse gas emissions and achieving regional carbon neutrality has become the shared goal of countries around the world [2,3,4,5]. Global carbon cycling relies heavily on terrestrial ecosystems. It may be possible to reduce the greenhouse effect on the global climate by increasing the carbon storage capacity of terrestrial ecosystems, which can reduce the CO2 concentration in the environment significantly. Changes in land use are clearly correlated with carbon storage [6]. Through changing the structure, function, and processes of terrestrial ecosystems, land use change influences carbon storage, and it plays an important role in determining how carbon storage is distributed spatially and temporally in terrestrial ecosystems [7,8,9,10,11]. A main method for monitoring ecosystem service functions is the study of carbon storage responses regarding changes in land use relative to changes in the climate [12].
In the context of ratifying the Kyoto Protocol, the GFGP was recognized as an effective measure for mitigating global warming [13]. GFGP, as China’s largest eco-restoration project, is essentially a type of land use pattern adjustment that utilizes human methods for vegetation restoration and contributes to the regulation of carbon cycling in ecosystems, thus alleviating global warming [14]. Inquiry into the quantitative impact of the GFGP on the carbon storage capacity of terrestrial ecosystems in regions is crucial to the initiation of projects aimed at providing environmental restoration and economic development in the region. Some research has been conducted on the carbon storage of GFGP in some typical areas of China, such as the Loess Plateau [15,16], and researchers have examined soil and forest carbon storage changes following the GFGP on a range of scales. Under the GFGP, soil organic carbon (SOC) on the entire Loess Plateau increased at a rate of 0.712 Tg C/year [17]; GFGP exhibited substantial carbon sequestration capacity and potential, and the GFGP implementation at its early stage resulted in higher carbon sequestration than at its later stage [18]. Additionally, some scholars have found that there are differences in the carbon sequestration effects of different cropland-returning methods. For instance, converting cropland to forestland has been shown to contribute the most to the carbon storage of terrestrial ecosystems in the Loess Plateau region [19]. Meanwhile, afforestation on unused lands has been identified as the most effective method of reforestation in the hilly red soil regions of southern China [20]. In addition, some scholars calculated NPP based on the CASA model and studied the response of GFGP on carbon sequestration [21,22]. However, current study results are not evaluated if they are applicable in dry-hot valley areas. Therefore, methods for analyzing the influence of GFGP on the carbon storage of terrestrial ecosystems in dry-hot valleys are urgently needed, especially those that are related to the transformation of cropland back to carbon sinks, which require further attention.
Yanjin County is a typical dry-hot valley area in China, and it is also an important ecological protection barrier in Northeast Yunnan, China, with sensitive and fragile ecosystem characteristics and high carbon sequestration potential. The area has been plagued by soil erosion and other problems for many years. Therefore, GFGP has been implemented in Yanjin County since 2000. However, few studies have quantitatively analyzed the impact of the GFGP on regional carbon storage in the dry-hot valley area. In order to solve the problem of lack of research in this region, this study aimed to evaluate the spatial and temporal distribution characteristics of terrestrial ecosystem carbon storage and explore the driving factors of spatial differentiation during the implementation of the GFGP from 2000 to 2019. In addition, different land-use changes contribute differently to the growth of carbon storage [23]. Therefore, another purpose of this study is to analyze the contribution of GFGP with respect to different cropland return methods and their effect on carbon storage. This study reveals the carbon sequestration benefits of global eco-environmental planning in the dry-hot valley area, which is conducive to the rational formulation and implementation of regional ecological restoration measures.
2. Materials and Methods
2.1. Study Area
Yanjin County (Figure 1) is located in the karst landform area and the dry-hot valley area of the Yunnan–Guizhou Plateau; this is a special geographical location that has a complex and variable climate. With an average annual temperature of 17.8 °C and an average rainfall of 1204.4 mm, the county is influenced by both a mid-subtropical and temperate monsoon climate, exhibiting obvious dry and wet seasonal changes. The county’s topography is mainly mountainous, and the deep-cutting effects of the Guan and Baishui Rivers have formed geomorphic features, including overlapping mountains and crisscrossing gullies. Due to long-term human activities and natural conditions, the county has a high degree of soil erosion and serious soil and water loss, resulting in a fragile ecological environment, frequent drought and flood disasters, and changes in carbon storage. Since 2000, Yanjin County has implemented the GFGP. By 2019, two rounds of GFGP were carried out, encompassing ten townships.
2.2. Data Sources and Preprocessing
The land use statistics of Yanjin County were derived from the CLCD (China Land Cover Data set) 30 m product [24], which had an overall accuracy of 80%, meeting the needs of this study. Drawing upon the ‘20 Years of the GFGP’ report published by China’s National Forestry and Grassland Administration, this article selects land use data from three phases—2000 (the inception year of the GFGP), 2014 (the end of the first round of the GFGP), and 2019 (the end of the second round of the GFGP)—to investigate the impact of the GFGP initiative on the regional terrestrial ecosystem’s carbon storage. Additionally, according to the “Regulations on Specially Provisioned Shrubland by the State” issued by the State Forestry and Grassland Administration of China, due to its special ecological fragility in dry-hot valley areas, shrubland can be regarded as a type of forest to play its carbon sequestration role. Based on GB/T21010-2017 [25]—the Classification of Land Use Status—the land use types were reclassified into five main types: cropland, forest, grassland, waterbody, and impervious. ArcGIS 10.8 and Excel 2021 were used to preprocess and count land use data.
The DEM data were from the SRTM 90 m product data issued by the National Aeronautics and Space Administration (NASA) in 2003 (http://srtm.csi.cgiar.org/, accessed on 4 April 2024). The slope and elevation data of the study area were obtained by preprocessing the DEM.
Yanjin County’s boundary data were taken from the 1:1 million national basic geographic database under the National Geographic Information Resources Catalog Service System (http://www.webmap.cn, accessed on 4 April 2024).
In addition, there are four components of carbon density data: the biomass above ground (Ci-above), the biomass below ground (Ci-below), the soil (Ci-soil), and the dead organic matter (Ci-dead). Aboveground biomass and soil have similar carbon densities [26]. A calculation of belowground biomass relies on the ratio between aboveground vegetation and underground rhizomes [27]. The carbon density of aboveground biomass is approximately 10 times that of dead organic matter [28]. Table 1 provides specific data regarding carbon density. The InVEST model was used to preprocess carbon density and land use data in order to obtain carbon storage results.
In addition, Yanjin County’s spatial differentiation of carbon storage is a result of several factors, including soil type, elevation, slope, normalized difference vegetation index (NDVI), temperature, and precipitation [29,30,31] (Table 2). The data are used in the Geo-detector model to explore the driving factors of the spatial differentiation of carbon storage.
2.3. Research Framework
The carbon module of the InVEST model was used in this study, and the geographical detector was used to analyze spatiotemporal distribution characteristics and the driving forces of the carbon storage of terrestrial ecosystems in Yanjin County from 2000 to 2019. The detector also combined the land use transition matrix overlay analysis to examine how GFGP affects carbon storage in terrestrial ecosystems in the region. The following is a description of the research framework (Figure 2).
2.4. Methods
2.4.1. Land Use Transition Matrix
Using the land use transition matrix, we were able to identify how land use has changed in the study area and analyze how this has affected local carbon storage levels.
where S is the area; n is the number of land use types before and after the transfer; i and j (i, j = 1, 2, 3, …, n) represent the land types before and after the transfer; and Sij is the area of the ith land type before the transfer converted to the jth land type after the transfer.
As the land parcels for returning cropland to forestland include converting cropland to forests, cropland to grassland, grassland to forests (afforestation of barren hills and wasteland), unused land to forests, and unused land to grassland [32], this study identified the implementation parcels and areas of the GFGP from the land use transition matrix. In addition, by superimposing the land use transfer matrix with carbon storage results, the carbon sequestration capacity of different cropland-returning methods can be identified.
2.4.2. Spatial Heterogeneity Analysis Based on the Geo-Detector Model
An analysis of spatial heterogeneity using the Geo-detector model comprises a statistical method, and it is widely used in ecology, meteorology, and environment fields to explore the spatial variation of variables and reveal driving factors [33]. Based on the study area’s current situation and relevant research, the driving factors were divided as follows: independent variables—terrain factors (slope and elevation), climatic factors (temperature and precipitation on an annual basis), and environment factors (soil type and NDVI); the dependent variable is the amount of carbon stored in the study area. Using the Geo-detector’s factor and interaction detectors, we identified the key factors that influence spatial variations in carbon storage with respect to croplands changing to forests.
(1) Factor detection: The spatial variation in ecosystem quality and the effects of various factors (X) on the ecosystem quality index (Y) are identified:
where h = 1, 2, …, n; L is the stratification of variable Y or factor X, that is, the classification or partition; Nh and N are the number of units in layer h and the entire area, respectively; and σh2 and σ2 are the variances of Y values in layer h and the entire area, respectively. The range of q is [0, 1], and the larger the value, the more obvious the spatial heterogeneity of Y; if the stratification is generated by the independent variable X, then the larger the q value, the stronger the explanatory power of X on the attribute Y and vice versa.
(2) Interaction detection: The interactions between the XS risk factors are determined; that is, whether factors X1 and X2 have a joint effect on the dependent variable Y or whether these factors affect Y independently is determined. For the purpose of evaluation, the first step is to calculate the q-values of the two factors X1 and X2 separately for Y: q(X1) and q(X2); then, the q-value that results when they interact is calculated: q(X1∩X2). Finally, q(X1), q(X2), and q(X1∩X2) are compared. Table 3 illustrates the specific relationships between the interactions.
2.4.3. Using the InVEST Model to Estimate Carbon Storage
InVEST is a suite of models for the integrated assessment of ecosystem services and trade-offs. In this study, terrestrial ecosystem carbon storage was estimated using the carbon storage module of InVEST.
where Ci is a certain type of land use; Ci-above, Ci-below, Ci-soil, and Ci-dead represent the carbon density (t/km2) of the aboveground, belowground, soil, and dead organic matter of the land use type; Ctot is the total carbon storage (t) of the terrestrial ecosystem; Si is the area (km2) of the land use type i; n is the number of land use types.
3. Results
3.1. Land Use Changes in Yanjin County from 2000 to 2019
As shown in Figure 3, the land use pattern of Yanjin County has undergone great changes from 2000 to 2019. The regional forest coverage rate increased from 81.83% in 2000 to 83.37% in 2019 (Table 4). Based on the statistics provided by the land use transition matrix (Table 5), the land use types and change rates in Yanjin County from 2000 to 2014 exhibited different characteristics. The largest area changes were in croplands and forests, with forests decreasing by 16.57 km2 and croplands increasing by 14.28 km2, followed by waterbodies and impervious land, which increased by 1.64 km2 and 1.19 km2 at a relatively fast rate, respectively. The change rate of grassland was low, with an area reduction of 0.54 km2.
From 2014 to 2019, Yanjin County experienced the following main characteristics of land use change: cropland areas decreased significantly by 48.94 km2, while forest areas increased significantly by 47.89 km2; the changes in other land use types were relatively stable, without obvious trends of increase or decrease.
3.2. Spatial and Temporal Distribution of Carbon Storage in Yanjin County from 2000 to 2019
3.2.1. Carbon Storage Characteristics Related to Temporal Variations
From 2000 to 2019, carbon storage in Yanjin County has exhibited temporal variations (Figure 4). Between 2000 and 2014, regional ecosystem carbon storage decreased by 5.7 × 10⁴ t while, from 2014 to 2019, regional carbon storage increased from 211.97 × 10⁵ t to 213.52 × 10⁵ t, with an increase of 1.55 × 10⁵ t. The variation trend indicates that the carbon storage in Yanjin County presented a “V”—the trend is shaped as a decreasing and then increasing curve from 2000 to 2019, but it exhibited positive growth.
3.2.2. Spatial Distribution Characteristics of Carbon Storage
Figure 5 shows the spatial changes in carbon storage in Yanjin County from 2000 to 2019. The carbon storage of Yanjin County presents a point-like, strip-like, and patch-like distribution pattern, which is closely associated with the land use type. From 2000 to 2019, the carbon storage of Yanjin County exhibited an overall increasing trend, and the spatial changes were obvious. Among them, the northeastern region had the largest enhancement in carbon storage, and this was mainly due to the change from croplands to forests. In addition, this region benefitted from the GFGP in terms of carbon storage.
Figure 6 shows the distribution of carbon sequestration via different land use types. The carbon sequestration capacity of Yanjin County mainly depends on forest and cropland, which are widely distributed in the area. From 2000 to 2019, a high amount of carbon was stored primarily in forests, which indicates that these forests were the region’s major carbon sinks. Among the regions with low carbon storage, residential areas accounted for the majority, which contains impervious areas, rivers, reservoirs, and so on, indicating that these areas had more obvious carbon source effects. Different land use types contributed to regional carbon storage in the following ways: forest (181.92 × 10⁵ t to 187.23 × 10⁵ t) > cropland (25.6 × 10⁵ t to 29.43 × 10⁵ t) > water bodies (0.29 × 10⁵ t to 0.42 × 10⁵ t) > impervious (0.1 × 10⁵ t to 0.22 × 10⁵ t) > grassland (0.03 × 10⁵ t to 0.08 × 10⁵ t) (Table 6).
3.2.3. Analyzing the Factors Influencing the Spatial Differentiation of Carbon Storage
As a result of this study, we evaluated six factors that affect the spatial differentiation of carbon storage in the terrestrial ecosystem of Yanjin County, including elevation, slope, NDVI, annual mean temperature, annual precipitation, and soil type. Carbon storage in the terrestrial ecosystem of Yanjin County is affected by six factors in varying degrees (Table 7). Among them, elevation (0.038–0.059) has the strongest explanatory power in different years, indicating that there is a strong correlation between elevation and the spatial differentiation of carbon storage. It appears that elevation has played a significant role in the change in carbon storage in Yanjin County from 2000 to 2019. In the terrestrial ecosystem of Yanjin County, climatic factors, environmental factors, and carbon storage are spatially differentiated very little according to slope, and the explanatory power of the factors is less than 1% in all periods, such as the annual mean temperature (0.001–0.003), annual precipitation (0.000–0.005), slope (0.001–0.003), and so on, indicating that with respect to climatic factors, neither environmental factors nor slopes dominate the spatial differentiation of carbon storage in Yanjin County.
There were either non-linear enhancement relationships or two-factor enhancement relationships among the driving factors (Figure 7), indicating that there is a possibility that an array of factors may contribute to the spatial differentiation of carbon storage. At different points in time, the most influential synergy type for the spatial differentiation of carbon storage in the terrestrial ecosystem of Yanjin County was the synergy of elevation and the other five factors, with an explanatory power ranging from 0.04 to 0.066, suggesting that there may be richer carbon storage in areas affected by elevation and other factors. The synergy types between elevation and other factors included two-factor enhancement and non-linear enhancement, further proving that the main factor contributing to the spatial differentiation of carbon storage was elevation. The synergy types, among other factors, were mostly non-linear enhancement types in all years, indicating that factors acting synergistically were far more effective than factors acting alone. In summary, carbon storage in Yanjin County’s terrestrial ecosystem was more affected by the synergistic effects among driving factors. Moreover, a simple additive relationship was not present. In practice, several factors may influence the spatial differentiation of carbon storage, and these factors must be considered comprehensively.
3.3. Impacts of the GFGP on Carbon Storage in Terrestrial Ecosystems
The GFGP is a major ecological engineering project that aims to improve vegetation cover and ecosystem service functions by artificially intervening and changing land ecosystems. During the implementation of the project, land use in Yanjin County underwent drastic changes, which impacted the regional ecosystem’s carbon storage capacity significantly. As shown in Table 8, the GFGP in Yanjin County increased regional carbon storage. The study area returned 180.73 km2 of cropland from 2000 to 2019, of which the area of cropland that returned to forestland was the largest; the carbon storage of cropland returned to forestland increased by 5.88 × 10⁵ t in 20 years, of which carbon sequestration increased the most, reaching 5.87 × 10⁵ t, which was the main carbon sink type. From the perspective of different cropland-returning periods, 2000–2014 was the initial stage of project implementation, and it was also the stage with the highest project implementation intensity. During this period, a total of 96.13 km2 of cropland was returned, contributing 3.13 × 10⁵ t to the carbon storage of the study area, of which the cropland to forestland area was about 95.76 km2, and the cropland to grassland area and grassland afforestation area was about 0.38 km2. Moreover, carbon sink contribution accounted for less than 1%. The 2014–2019 period comprised the project implementation and management stage, which was mainly based on incentives and compensation, and cropland-returning intensity gradually slowed down. During this stage, a total of 84.6 km2 of cropland was returned, and this was achieved by mainly returning cropland to forestland, and grassland and grassland afforestation area accounted for 1% of the total area of cropland returned. The return of cropland to forestland was still the main carbon sink type, and the carbon sink contribution rate of the return of cropland to forestland in different periods was higher than that of grassland. In addition, the carbon sink contribution (5.88 × 10⁵ t) of the GFGP in the study area from 2000 to 2019 was enough to offset the carbon emissions (4.91 × 10⁵ t) caused by human activities and construction expansion.
It can be clearly observed that the GFGP had the strongest implementation intensity and the widest coverage from 2000 to 2014 (Figure 8), and the vegetation restoration process and carbon sequestration effect characteristics were most representative in the region that mainly focused on the central–eastern part of the study area. The later stage of the project’s implementation (2014–2019) mainly consolidated and managed the previous stage of GFGP achievements. This stage returned sloping cropland that was not suitable for cultivation. Moreover, the intensity and area of returning cropland were significantly lower than in the first stage, and this was mainly based on the return of cropland to forestland. The carbon storage increase range shifted from the central to the north and south regions. Generally, the implementation of the GFGP enhanced the carbon sequestration function of the study area and significantly improved the stability and carbon storage of the regional ecosystem.
3.4. Comparison of the Carbon Sequestration Capacity of Different Methods of Returning Cropland
3.4.1. Spatial Distribution of the Implementation Area of the GFGP
The GFGP can be categorized into three types: converting cropland to forests and grasslands, afforestation and grass planting on barren hills and wastelands, and forest cultivation through mountain closure. The first two types can lead to changes in land use, including the conversion of cropland to forest, cropland to grassland, grassland to forest, unused land to forest, and unused land to grassland, encompassing five types of transformations. Through integrating the overlay analysis results, the spatial distribution status of different types of returned cropland in Yanjin County from 2000 to 2019 was identified. Figure 9 clearly shows that the primary method of land return in Yanjin County is the conversion of cropland to forestland, and the conversion of cropland to grassland and grassland to forest comprised a smaller proportion.
3.4.2. Carbon Sequestration Effect of Different Methods of Cropland Return
The change from cropland to forestland resulted in differences in carbon storage among different land use types. The results of carbon storage per unit area in different periods showed that (Table 9) carbon storage in the region was primarily attributed to the conversion of cropland to forest, accounting for about 3262 t/km2 (50%), while the contributions of the conversion of cropland to grassland and grassland to forestland were about 2530 t/km2 and 690 t/km2 (mean values of both periods), respectively. The extent of each LUCC type within the region of the GFGP may explain this phenomenon; nevertheless, an analysis of carbon storage changes per unit area exhibited the following relation: cropland to grassland (138.8 t/km2) > grassland to forest (22.88 t/km2) > cropland to forestland (0.11 t/km2). In summary, for the purpose of storing carbon in the terrestrial ecosystem of Yanjin County, changing cropland to forestland is the most effective change type, while changing cropland to grassland has more carbon sequestration potential than changing cropland to forestland and grassland to forestland.
4. Discussion
4.1. Returning Cropland to Grassland Exhibits Great Potential for Carbon Sequestration
From 2000 to 2019, comparing different types of cropland changes with their carbon storage per unit area (Table 9), it was observed that the conversion of cropland to forestland was the most effective way to increase carbon storage (3262 t/km2), which is consistent with the results of Zhang et al. [34]. It is possible that forest types may have a higher carbon density at the soil and vegetation levels [35]. When land types with lower biomass are transferred to land types with higher biomass, carbon storage will increase. Zhao and his team analyzed the carbon storage changes in various terrestrial ecosystems in the southeastern United States and observed that the carbon sink in this region is mainly the result of the conversion of farmland to forest [36]. Zhu and his team observed an increase in vegetation carbon storage due to the expansion of forestland from 1990 to 2010 in Zhejiang Province [37]. These findings are consistent with the conclusions of this study. In addition, research in the hilly red soil region of southern China found that unused land converted to forest is the most effective method for increasing carbon storage [20]. On the other hand, our research showed that although converting cropland to grassland was not the dominant cropland conversion method in the study area, it comprised a small area proportion and exhibited a substantial potential for carbon sequestration (2530 t/km2). According to the report “Returning Cropland to Forest and Grassland: A Great Practice of Greening Mountains and Rivers and Generating Gold from Forests and Grasslands” issued by the National Forestry and Grassland Administration of China, the return of cropland to grassland can improve the structure and fertility of the soil, increase the soil’s organic matter and moisture, and enhance soil erosion resistance. After returning cropland, the roots of herbaceous plants can penetrate into the soil layer, increase the soil porosity and permeability, promote the recycling of a water body and nutrients, and reduce surface runoff and soil and waterbody loss. Simultaneously, the decomposition of herbaceous plant leaves and roots can provide organic matter, improve soil fertility and microbial activity, and enhance the soil carbon sequestration capacity. Therefore, during the implementation of the GFGP, by scientifically regulating the types and proportions of herbaceous plants or optimizing the management methods and utilization intensity of grasslands, the soil carbon input and retention capacity of grasslands can be improved, the soil carbon loss and emission capacity of grasslands can be reduced, and the soil carbon storage and stability of grasslands can be increased to give full play to the advantages and carbon sequestration potential of cropland to grassland conversion. In summary, in addition to converting cropland to forestland, later stages of the cropland changing project in the study area can also consider sowing grass on cropland. In combination, these two methods are more conducive to increasing regional carbon storage.
4.2. Total Carbon Storage Exhibits Two Decrease and Increase Stages during GFGP Implementation
As Yanjin County’s total carbon storage decreased and then increased over the 2000–2019 decade, a downward trend was observed first, followed by an upward trend (Figure 4). This phenomenon is primarily attributed to the expansion of impervious surfaces and the increase in cropland area induced by the inconvenient transportation and complex terrain of the dry-hot valley area. This presents certain disparities from previous research [38,39]. From 2000 to 2014, impervious land expanded by 1.19 km2, and the cropland area increased by 14.28 km2 (Table 5), resulting in a carbon loss of 3.7 × 10⁵ t (Table 8). During this period, the GFGP had not fully exerted its effect, and the regional carbon storage contribution of the GFGP was 3.13 × 10⁵ t (Table 8), which could not completely offset the impact of the expansion of impervious land and cropland. Therefore, carbon storage exhibited a downward trend (decreased by 5.7 × 10⁴ t) in this period. From 2014 to 2019, although the impervious area further expanded by 0.74 km2 (Table 5), with the implementation and consolidation of the new round of GFGP, the contribution of GFGP to carbon storage (2.76 × 10⁵ t) not only offset the carbon loss caused by construction expansion (1.2 × 10⁵ t) but also promoted an increase in the total carbon storage in this period (increased by 1.55 × 10⁵ t) (Table 8). In summary, the implementation of GFGP from 2000 to 2019 increased regional carbon storage from 212.54 × 10⁵ t in 2000 to 213.52 × 10⁵ t in 2019, and the carbon sequestration capacity of the regional terrestrial ecosystem was significantly improved. Going forward, the policymakers of Yanjin County can implement ecological construction as the starting point, control the expansion of impervious land, and strive to increase carbon storage in the study area.
4.3. Elevation Is the Dominant Factor in the Spatial Differentiation of Carbon Storage
The dominant factors affecting carbon storage change vary greatly among different regions and change with the selected variables and time. The change in carbon storage in the study area can be attributed to elevation, slope, NDVI, annual mean temperature, annual precipitation, and soil type factors, among which elevation (0.038–0.059) is the most important factor driving regional carbon storage differentiation (Table 7). Compared to typical regions such as the Loess Plateau [40], the Tibetan Plateau [41], the Taihang Mountains [42], and the Yellow River Basin [43], the unique topography and climatic characteristics of dry-hot valleys have significantly shaped the spatial distribution pattern of carbon storage in this area. Elevation is used as an indirect factor, which affects the growth of vegetation by influencing temperature, precipitation, and soil nutrients. Vegetation is the main source of carbon storage, with different vegetation having different levels of carbon storage. Using ArcGIS 10.8 to overlay elevation and carbon storage in three periods and perform zoning statistics (Figure 10), there is an inverted U-shaped trend with respect to carbon storage in the study area as elevation increases and carbon storage primarily occurs in low-elevation areas of 900–1300 m. The possible reason is that the temperature and precipitation conditions in the middle- and low-elevation areas of 900 to 1300 m are more conducive to the growth of vegetation and the accumulation of soil organic carbon. Precipitation and temperature both change with elevation. High elevations result in low temperatures, which reduce the rate of photosynthesis and soil nutrient release, shorten the growing season of vegetation, and greatly reduce carbon sequestration efficiency [44]. In addition, as elevation increases, the decrease in waterbody supply also limits the growth of vegetation, resulting in a decrease in carbon storage [45].
Based on the study, other factors, with the exception of elevation, were relatively weakly related to regional carbon storage variations. Nevertheless, it appears that the combination of different driving factors may have an enhanced effect on carbon storage patterns, manifested as two-factor enhancement or non-linear enhancement (Figure 7), which was consistent with other related studies [46,47]. Among them, there was a strong interaction between elevation and other factors, such as elevation and slope (0.044–0.065), elevation and temperature (0.04–0.06), elevation and precipitation (0.04–0.063), elevation and soil type (0.048–0.063), and elevation and NDVI (0.041–0.066). Comprehensive analyses suggested that in order to promote the increase in regional carbon storage, we should consider the interaction and synergy of various factors and adopt differentiated, precise, and diversified regulation strategies, such as planting vegetation with strong carbon sequestration abilities and those that are adapted to the growth environment at different elevation gradients. By strengthening the monitoring and protection of carbon storage in high-elevation areas, we can improve the potential and efficiency of carbon sinks and contribute to the management of global climate change.
4.4. Uncertainties and Prospect
The carbon density used in this article is modified based on previous research results. Because there is an abundant body of research on carbon storage with respect to related results and the data are accurate and reliable, this article uses the carbon density value of the same latitude area as a reference to conduct research on Yanjin County. Correcting carbon density is more helpful in improving the accuracy of carbon storage assessments than using national-scale carbon density for regional studies, but this also has certain problems. It ignores the spatiotemporal changes in carbon density and has some limitations [48]. Carbon density values will change over time due to climate change, human activities, and so on. Moreover, the values vary spatially because of geographical and climatic conditions. Therefore, the accuracy of the results can be improved in the future by obtaining the carbon density values of detailed land use/land cover types and vary spatiotemporally. At this time, carrying out many field investigations is particularly important.
Simultaneously, a static superposition method was adopted to identify the GFGP area. More effective methods, such as using multi-source data and advanced algorithms (such as phenology-based algorithms) to continuously monitor dynamic changes in land use/land cover year by year, can effectively improve accuracies [49]. On the other hand, more detailed land use change data need to be obtained, such as land use data based on vegetation types. The modeling approaches estimate carbon sequestration from GFGP by estimating the precise locations where land conversion occurred. This method is based on the overlap of multiple spatial data sets. Each data set has its own random errors, which will affect the results. The uncertainty analysis of results and the improvement of the model’s simulation accuracy are the focus of our next research studies.
5. Conclusions
The conversion of GFGP has a significant impact on the increase in carbon storage in regional terrestrial ecosystems and has made a positive contribution to mitigating global climate warming. This study revealed that, since the implementation of the GFGP, 180.03 km2 of cropland in Yanjin County has been successfully converted into forestland, and the forest coverage rate has increased from 81.83% to 83.37%. The project has contributed a total of 5.88 × 10⁵ t to the regional terrestrial ecosystem’s carbon storage, which effectively offsets the carbon emissions caused by human activities, such as urban expansion while promoting the growth of regional carbon storage. The implementation of the GFGP has resulted in the transformation of three land use types. Among them, converting cropland to forestland (3262 t/km2) was found to be the most efficient method of carbon sequestration. However, conversion from cropland to grassland (2530 t/km2) exhibited great advantages in carbon sequestration potential—a finding that highlights the uniqueness of the dry-hot valley area with respect to other regions. In addition, the study also found that elevation is the main factor affecting the spatial differentiation of carbon storage. Therefore, when promoting the conversion of the GFGP in dry-hot valley areas, we should not only give priority to the strategy of converting cropland into grassland but also fully consider the interactions between elevation factors and other environmental factors in order to achieve best practices tailored to local conditions, thereby increasing regional carbon reserves. Overall, the GFGP is not only of great significance in combating climate warming but also provides important contributions to improving the stability and sustainability of regional ecosystems.
Author Contributions
Y.H.: data curation, writing—original draft. W.K.: writing—review and editing. Y.C.: data curation and validation. H.L.: methodology. K.Z.: software and resources. All authors have read and agreed to the published version of the manuscript.
Funding
This research was funded by Yunnan Province’s “Prosperous Yunnan Talents Plan” (YNWR-QNBJ-2019-270) and the Ecological Product Value Realization Mechanism Construction and Special Research (4530000HT202105161) projects.
Institutional Review Board Statement
Not applicable.
Informed Consent Statement
Not applicable.
Data Availability Statement
Data are contained within the article.
Acknowledgments
The authors acknowledge and appreciate the Forestry and Grassland Bureau of Yanjin County, China, for their support. We thank the help of the Key Laboratory of National Forestry and Grassland Administration on Forestry and Ecological Big Data, Southwest Forestry.
Conflicts of Interest
Author Kaifu Zhao was employed by the company Yunnan Digital Industry Planning and Design Co., Ltd. The remaining authors declare that the research was conducted in the absence of any commercial or financial relationships that could be construed as a potential conflict of interest.
References
- Canadell, J.G.; Raupach, M.R. Managing Forests for Climate Change Mitigation. Science 2008, 320, 1456–1457. [Google Scholar] [CrossRef] [PubMed]
- Letourneau, A.; Verburg, P.H.; Stehfest, E. A land-use systems approach to represent land-use dynamics at continental and global scales. Environ. Model. 2012, 33, 61–79. [Google Scholar] [CrossRef]
- Ewane, E.B.; Deh-Nji, A.; Mfonkwet, N.Y.; Nkembi, L. Agricultural expansion and land use land cover changes in the Mount Bamboutos landscape, Western Cameroon: Implications for local land use planning and sustainable development. Int. J. Environ. Stud. 2023, 80, 186–206. [Google Scholar] [CrossRef]
- Toro, G.; Otero, M.P.; Clerici, N.; Szantoi, Z.; González-González, A.; Escobedo, F.J. Interacting municipal-level anthropogenic and ecological disturbances drive changes in Neotropical forest carbon storage. Front. Environ. Sci. 2022, 10, 937147. [Google Scholar] [CrossRef]
- Li, J.-P.; Xia, S.-X.; Yu, X.-B.; Li, S.-X.; Xu, C.; Zhao, N.; Wang, S.-T. Evaluation of carbon storage on terrestrial ecosystem in Hebei province based on InVEST model. J. Ecol. Rural Environ. 2020, 36, 854–861. [Google Scholar]
- Li, K.-R. Research Progress of Global Climate Change and Its Impact and Future Prospect. Acta Geogr. Sin. 1996, S1, 1–14. [Google Scholar]
- Sleeter, B.M.; Marvin, D.C.; Cameron, D.R.; Selmants, P.C.; Westerling, A.L.; Kreitler, J.; Daniel, C.J.; Liu, J.; Wilson, T.S. Effects of 21st-century climate, land use, and disturbances on ecosystem carbon balance in California. Glob. Change Biol. 2019, 25, 3334–3353. [Google Scholar] [CrossRef] [PubMed]
- Cantarello, E.; Newton, A.C.; Hill, R.A. Potential effects of future land-use change on regional carbon stocks in the UK. Environ. Sci. Policy 2011, 14, 40–52. [Google Scholar] [CrossRef]
- Chen, G.-S.; Tian, H.-Q. The impact of land use/cover change on the carbon cycle of terrestrial ecosystems. Chin. J. Plant Ecol. 2007, 31, 189–204. [Google Scholar]
- Chuai, X.; Huang, X.; Wang, W.; Zhao, R.; Zhang, M.; Wu, C. Land use, total carbon emissions change and low carbon land management in Coastal Jiangsu, China. J. Clean. Prod. 2015, 103, 77–86. [Google Scholar] [CrossRef]
- Yang, Y.; Shi, Y.; Sun, W.; Chang, J.; Zhu, J.; Chen, L.; Wang, X.; Guo, Y.; Zhang, H.; Yu, L.; et al. Terrestrial carbon sinks in China and around the world and their contribution to carbon neutrality. Sci. China Life Sci. 2022, 65, 861–895. [Google Scholar] [CrossRef] [PubMed]
- Posner, S.; Verutes, G.; Koh, I.; Denu, D.; Ricketts, T. Global use of ecosystem service models. Ecosyst. Serv. 2016, 17, 131–141. [Google Scholar] [CrossRef]
- Heimann, M.; Reichstein, M. Terrestrial ecosystem carbon dynamics and climate feedbacks. Nature 2008, 451, 289–292. [Google Scholar] [CrossRef] [PubMed]
- Tang, X.; Liu, S.; Zhou, G. Erosion and vegetation restoration impacts on ecosystem carbon dynamics in South China. Soil Sci. Soc. Am. J. 2010, 74, 272–281. [Google Scholar] [CrossRef]
- Deng, L.; Liu, S.; Kim, D.G.; Peng, C.; Sweeney, S.; Shangguan, Z. Past and future carbon sequestration benefits of China’s grain for green program. Glob. Environ. Change 2017, 47, 13–20. [Google Scholar] [CrossRef]
- Martin, P.; Jesper, M.; Madelene, O.; Jin-tao, X. The Chinese Grain for Green Programme: Assessing the carbon sequestered via land reform. J. Environ. Manag. 2013, 126, 142–146. [Google Scholar]
- Persson, M.; Moberg, J.; Ostwald, M.; Xu, J. Soil carbon sequestration potential for “Grain for Green” project in Loess Plateau, China. Environ. Manag. 2011, 48, 1158–1172. [Google Scholar]
- Wang, K.; Hu, D.; Deng, J.; Shangguan, Z.; Deng, L. Biomass carbon storages and carbon sequestration potentials of the Grain for Green Program-Covered Forests in China. Ecol. Evol. 2018, 8, 7451–7461. [Google Scholar] [CrossRef] [PubMed]
- Yao, N.; Liu, G.-Q.; Yao, S.-B.; Deng, Y.-J.; Hou, M.-Y.; Zhang, X. Evaluating on Effect of Conversion from Farmland to Forest and Grassland Porject on Ecosystem Carbon Storage in Loess Hilly-gully Region Based on InVEST Model. Bull. Soiland Water Conserv. 2022, 42, 329–336. [Google Scholar]
- Hu, X.; Li, Z.; Chen, J.; Nie, X.; Liu, J.; Wang, L.; Ning, K. Carbon sequestration benefits of the grain for Green Program in the hilly red soil region of southern China. Int. Soil Water Conserv. Res. 2021, 9, 271–278. [Google Scholar] [CrossRef]
- Wang, X.; Zhang, X.; Feng, X.; Liu, S.; Yin, L.; Chen, Y. Trade-offs and synergies of ecosystem services in karst area of China driven by grain-for-green Program. Chin. Geogr. Sci. 2020, 30, 101–114. [Google Scholar] [CrossRef]
- Jia, X.; Fu, B.; Feng, X.; Hou, G.; Liu, Y.; Wang, X. The tradeoff and synergy between ecosystem services in the Grain-for-Green areas in Northern Shaanxi, China. Ecol. Indic. 2014, 43, 103–113. [Google Scholar] [CrossRef]
- Deng, L.; Shangguan, Z.; Sweeney, S. “Grain for Green” driven land use change and carbon sequestration on the Loess Plateau, China. Sci. Rep. 2014, 4, 7039. [Google Scholar] [CrossRef] [PubMed]
- Yang, J.; Huang, X. The 30 m annual land cover dataset and its dynamics in China from 1990 to 2019. Earth Syst. Sci. Data 2021, 13, 3907–3925. [Google Scholar] [CrossRef]
- GB/T21010-2017; Current Land Use Classification. Available online: https://openstd.samr.gov.cn/ (accessed on 4 April 2024).
- Liu, X.-J.; Li, X.; Liang, X.; Shi, H.; Ou, J.-P. Simulating the change of terrestrial carbon storage in China based on the FLUS-InVEST model. Trop. Geogr. 2019, 39, 397–409. [Google Scholar]
- Mokany, K.; Raison, R.J.; Prokushkin, A.S. Critical analysis of root: Shoot ratios in terrestrial biomes. Glob. Change Biol. 2006, 12, 84–96. [Google Scholar] [CrossRef]
- Delaney, M.; Brown, S.; Lugo, A.E.; Torres-Lezama, A.; Quintero, N.B. The quantity and turnover of dead wood in permanent forest plots in six life zones of Venezuela 1. Biotropica 1998, 30, 2–11. [Google Scholar] [CrossRef]
- Balasubramanian, D.; Zhou, W.J.; Ji, H.L.; Grace, J.; Bai, X.-L.; Song, Q.-H.; Liu, Y.-T.; Sha, L.-Q.; Fei, X.-H.; Zhang, X.; et al. Environmental and management controls of soil carbon storage in grasslands of southwestern China. J. Environ. Manag. 2020, 254, 109810. [Google Scholar] [CrossRef]
- Mazarrasa, I.; Samper-Villarreal, J.; Serrano, O.; Lavery, P.S.; Lovelock, C.E.; Marbà, N.; Duarte, C.M.; Cortés, J. Habitat characteristics provide insights of carbon storage in seagrass meadows. Mar. Pollut. Bull. 2018, 134, 106–117. [Google Scholar] [CrossRef]
- González-Díaz, P.; Ruiz-Benito, P.; Ruiz, J.G.; Chamorro, G.; Zavala, M.A. A Multifactorial Approach to Value Supporting Ecosystem Services in Spanish Forests and Its Implications in a Warming World. Sustainability 2019, 11, 358. [Google Scholar] [CrossRef]
- Li, H. The Evaluation on Ecological Effects of the Project of Returning Farmland to Forest in Liaoning Province, Based on Remote Sensing and in VEST Model. Ph.D. Thesis, Jilin University, Changchun, China, 2019. [Google Scholar]
- Wang, J.-F.; Xu, C.-D. Geodetector: Principle and prospective. Acta Geogr. Sin. 2017, 72, 116–134. [Google Scholar]
- Zhang, Y.; Xie, Y.-C.; Qi, S.-H.; Gong, J.; Zhang, L. Carbon storage and spatial distribution characteristics in the Bailongjiang Watershed in Gansu based on InVEST model. Resour. Sci. 2016, 38, 1585–1593. [Google Scholar] [CrossRef]
- Feng, Y.; Chen, S.; Tong, X.; Lei, Z.; Gao, C.; Wang, J. Modeling changes in China’s 2000–2030 carbon stock caused by land use change. J. Clean. Prod. 2020, 252, 119659. [Google Scholar] [CrossRef]
- Zhao, Q.-G.; Huang, G.-Q.; Ma, Y.-Q. The problems in red soil ecosystem in southern of China and its countermeasures. Acta Ecol. Sin. 2013, 33, 7615–7622. [Google Scholar]
- Zhu, E.; Deng, J.; Zhou, M.; Gan, M.; Jiang, R.; Wang, K.; Shahtahmassebi, A. Carbon emissions induced by land-use and land-cover change from 1970 to 2010 in Zhejiang, China. Sci. Total Environ. 2019, 646, 930–939. [Google Scholar] [CrossRef] [PubMed]
- Hu, S.; Zhang, X.-R.; Guan, D.-J. Analysis on carbon storage change of construction land expansion in chongqing based on InVEST model. Res. Soil Water Conserv. 2018, 25, 323–331. [Google Scholar]
- Xiang, S.; Zhang, Q.; Wang, D.; Wang, S.; Wang, Z.-F.; Xie, Y.-Q.; Gao, M. Response and vulnerability analysis of carbon storage to LUCC in the main urban area of Chongqing during 2000–2020. J. Nat. Resour. 2022, 37, 1198–1213. [Google Scholar] [CrossRef]
- Li, M.-Y.; Shangguan, Z.-P.; Deng, L. Spatial distribution of carbon storages in the terrestrial ecosystems and its influencing factors on the Loess Plateau. Acta Ecol. Sin. 2021, 41, 6786–6799. [Google Scholar]
- Li, R.; Ye, C.; Wang, Y.; Han, G.; Sun, J. Carbon storage estimation and its drivering force analysis based on InVEST model in the Tibetan Plateau. Acta Agrestia Sin. 2021, 29, 43. [Google Scholar]
- Wang, C.; Luo, J.; Qing, F.; Tang, Y.; Wang, Y. Analysis of the Driving Force of Spatial and Temporal Differentiation of Carbon Storage in Taihang Mountains Based on InVEST Model. Appl. Sci. 2022, 12, 10662. [Google Scholar] [CrossRef]
- Hao, R.-W.; Zhou, R.-P.; Hu, S.-L.; Huge, J.-L. Simulating Carbon Sinks and Determining Driving Factors of Inner Mongolia Section in Yellow River Basin. Bull. Soiland Water Conserv. 2024, 44, 465–476. [Google Scholar]
- Du, J.; Shu, J.; Yin, J.; Yuan, X.; Jiaerheng, A.; Xiong, S.; He, P.; Liu, W. Analysis on spatio-temporal trends and drivers in vegetation growth during recent decades in Xinjiang, China. Int. J. Appl. Earth Obs. Geoinf. 2015, 38, 216–228. [Google Scholar] [CrossRef]
- Zhang, X.; Yue, Y.; Tong, X.; Wang, K.; Qi, X.; Deng, C.; Brandt, M. Eco-engineering controls vegetation trends in southwest China karst. Sci. Total Environ. 2021, 770, 145160. [Google Scholar] [CrossRef] [PubMed]
- Huo, H.; Sun, C. Spatiotemporal variation and influencing factors of vegetation dynamics based on Geodetector: A case study of the northwestern Yunnan Plateau, China. Ecol. Indic. 2021, 130, 108005. [Google Scholar] [CrossRef]
- Xu, J.; Chen, J.; Liu, Y. Partitioned responses of ecosystem services and their tradeoffs to human activities in the Belt and Road region. J. Clean. Prod. 2020, 276, 123205. [Google Scholar]
- Piao, S.; He, Y.; Wang, X.; Chen, F. Estimation of China’s terrestrial ecosystem carbon sink: Methods, progress and prospects. Sci. China Earth Sci. 2022, 65, 641–651. [Google Scholar] [CrossRef]
- Dong, J.W.; Kuang, W.H.; Liu, J.Y. Continuous land cover change monitoring in the remote sensing big data era. Sci. China Earth Sci. 2017, 60, 2223–2224. [Google Scholar] [CrossRef]
Figure 1.
The geographical location of the study area: (a) China, (b) Yunnan Province, and (c) Yanjin County.
Figure 1.
The geographical location of the study area: (a) China, (b) Yunnan Province, and (c) Yanjin County.

Figure 2.
Research framework.

Figure 3.
Land use change atlas of Yanjin County from 2000 to 2014 (a) and 2014 to 2019 (b).

Figure 4.
Temporal variations in carbon storage in Yanjin County from 2000 to 2019.

Figure 5.
Spatial distribution of carbon storage in Yanjin County from 2000 to 2019: (a) 2000, (b) 2014, and (c) 2019.
Figure 5.
Spatial distribution of carbon storage in Yanjin County from 2000 to 2019: (a) 2000, (b) 2014, and (c) 2019.

Figure 6.
Spatial distribution of carbon sequestration in different land use types: (a) 2000, (b) 2014, and (c) 2019.
Figure 6.
Spatial distribution of carbon sequestration in different land use types: (a) 2000, (b) 2014, and (c) 2019.

Figure 7.
Detection results of various interaction factors: (a) 2000, (b) 2014, and (c) 2019.

Figure 8.
(a) and (b) are the spatial distribution of carbon storage in Yanjin County in 2000–2014 and 2014–2019.
Figure 8.
(a) and (b) are the spatial distribution of carbon storage in Yanjin County in 2000–2014 and 2014–2019.

Figure 9.
Spatial distribution of different cropland to forestland conversion methods: (a) 2000–2014 and (b) 2014–2019.
Figure 9.
Spatial distribution of different cropland to forestland conversion methods: (a) 2000–2014 and (b) 2014–2019.
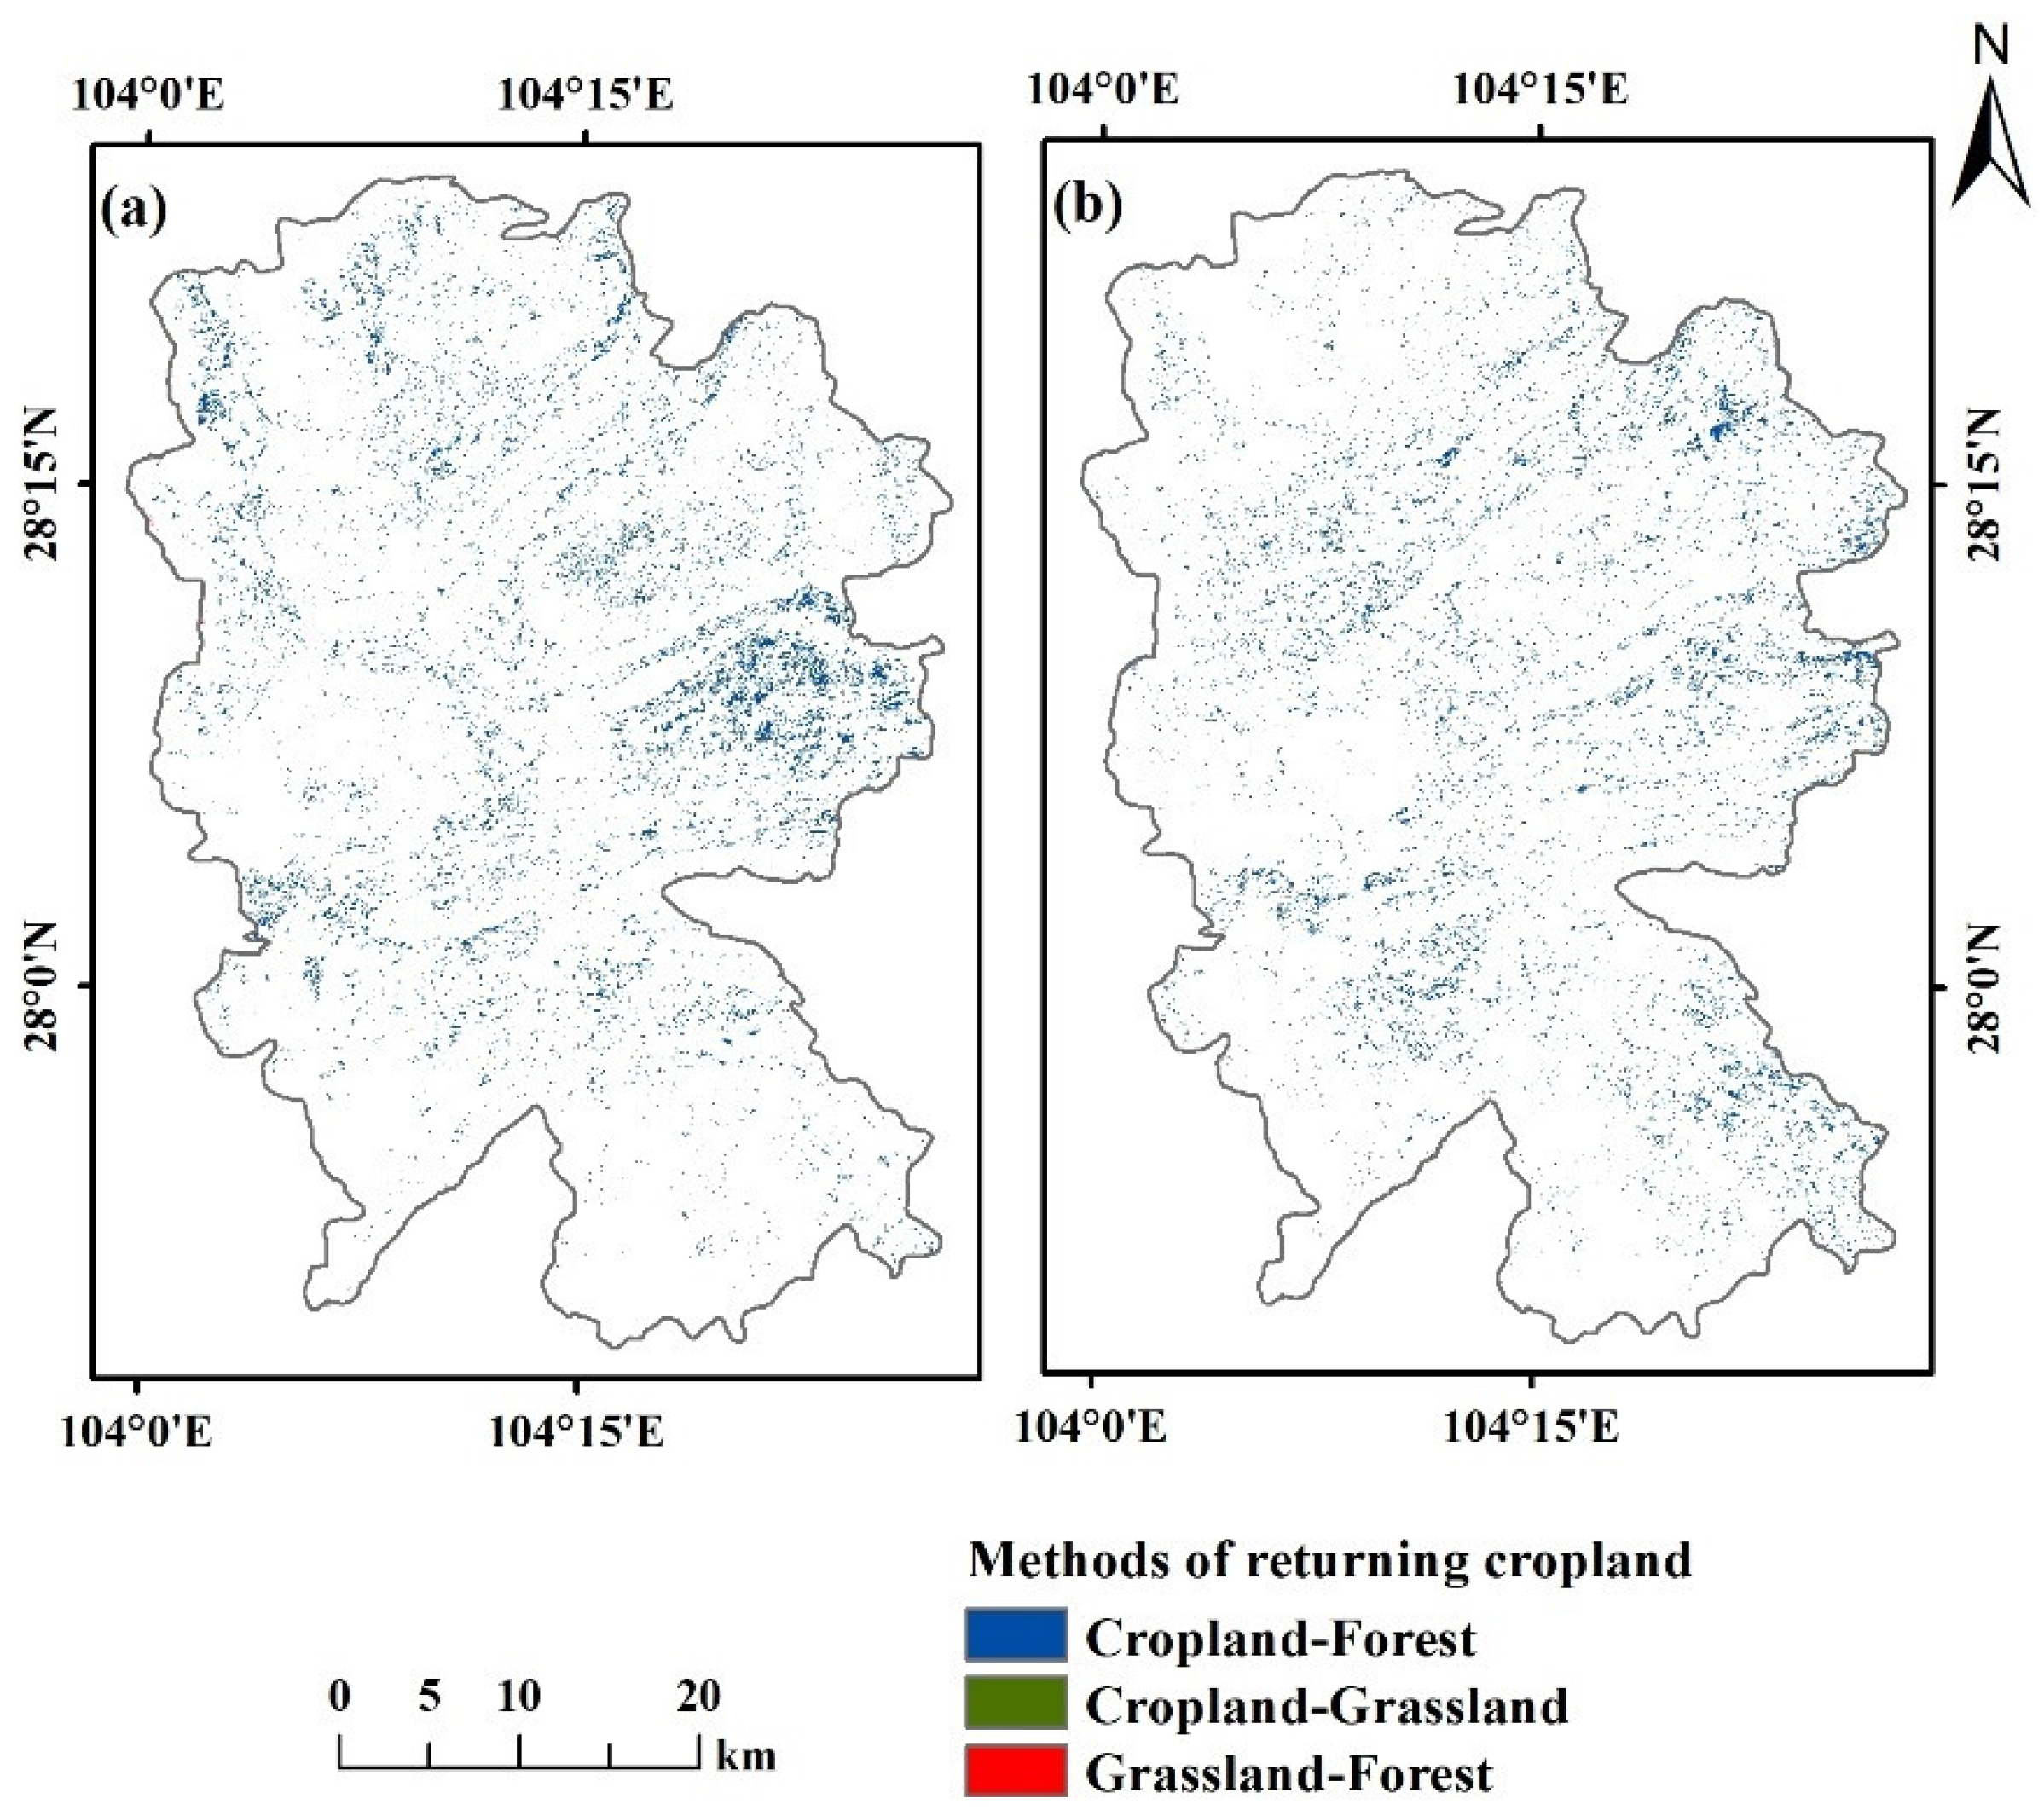
Figure 10.
Distribution map of carbon storage along the coast: (a) 2000, (b) 2014, and (c) 2019.


Table 1.
Carbon density data of the land use types in Yanjin County (t/km2).
| Land Use Type | Carbon Density | |||
|---|---|---|---|---|
| Ci-above | Ci-below | Ci-soil | Ci-dead | |
| Cropland | 26.41 | 5.28 | 43.94 | 2.64 |
| Forest | 44.75 | 8.95 | 52.71 | 4.48 |
| Grassland | 38.67 | 7.73 | 53.7 | 3.87 |
| Waterbody | 22.32 | 4.46 | 44.29 | 2.23 |
| Impervious | 18.24 | 3.65 | 41.61 | 1.82 |
Table 2.
Driving factors.
| Data Name | Data Type | Resolution | Data Sources |
|---|---|---|---|
| Soil type | Raster | 30 m | http://www.resdc.cn/, accessed on 4 April 2024 |
| Elevation | Raster | 30 m | |
| Slope | Raster | 30 m | |
| Annual mean precipitation | Raster | 1 km | https://data.tpdc.ac.cn, accessed on 4 April 2024 |
| Annual mean temperature | Raster | 1 km | https://data.tpdc.ac.cn, accessed on 4 April 2024 |
| NDVI | Raster | 1 km | https://search.earthdata.nasa.gov/search, accessed on 4 April 2024 |
Table 3.
The type of interaction.
| Interaction | |
|---|---|
| q(X1∩X2) < Min(q(X1), q(X2)) | Non-linear decrease |
| min(q(X1), q(X2)) < q(X1∩X2) < max(q(X1), q(X2)) | Single-factor non-linear decrease |
| q(X1∩X2) > max(q(X1), q(X2)) | Double-factor enhancement |
| q(X1∩X2) = q(X1) + q(X2) | Independent |
| q(X1∩X2) > q(X1) + q(X2) | Non-linear enhancement |
Table 4.
Distribution of land use area from 2000 to 2019 (km2).
| Land Use Type | 2000 | 2014 | 2019 | |||
|---|---|---|---|---|---|---|
| Area | % | Area | % | Area | % | |
| Cropland | 361.73 | 17.86 | 376.01 | 18.57 | 327.07 | 16.15 |
| Forest | 1657.12 | 81.83 | 1640.55 | 81.01 | 1688.44 | 83.37 |
| Grassland | 0.80 | 0.04 | 0.26 | 0.01 | 0.49 | 0.02 |
| Waterbody | 4.00 | 0.20 | 5.65 | 0.28 | 5.72 | 0.28 |
| Impervious | 1.49 | 0.07 | 2.68 | 0.13 | 3.43 | 0.17 |
Table 5.
Land use transfer matrix of Yanjin County (km2).
| Land Use Type | 2000–2014 | 2014–2019 | ||||
|---|---|---|---|---|---|---|
| Transfer to | Transfer out | Total | Transfer to | Transfer out | Total | |
| Cropland | 112.73 | 98.45 | 14.28 | 36.54 | 85.48 | −48.94 |
| Forest | 96.09 | 112.67 | −16.57 | 84.30 | 36.41 | 47.89 |
| Grassland | 0.14 | 0.67 | −0.54 | 0.33 | 0.10 | 0.23 |
| Waterbody | 1.88 | 0.24 | 1.64 | 0.34 | 0.26 | 0.07 |
| Impervious | 1.50 | 0.31 | 1.19 | 0.80 | 0.06 | 0.74 |
Table 6.
Carbon sequestration in different land use types from 2000 to 2019 (×105 t).
| Land Use Type | 2000 | 2014 | 2019 |
|---|---|---|---|
| Cropland | 28.31 | 29.43 | 25.60 |
| Forest | 183.76 | 181.92 | 187.23 |
| Grassland | 0.08 | 0.03 | 0.05 |
| Waterbody | 0.29 | 0.41 | 0.42 |
| Impervious | 0.10 | 0.18 | 0.22 |
| Total | 212.54 | 211.97 | 213.52 |
Table 7.
Explanatory power of each driver by year.
| Year | Terrain | Climate | Environment | |||
|---|---|---|---|---|---|---|
| Slope | Elevation | Temperature | Rainfall | NDVI | Soil Type | |
| 2000 | 0.001 | 0.038 | 0.003 | 0.005 | 0.003 | 0.002 |
| 2014 | 0.003 | 0.056 | 0.001 | 0.000 | 0.008 | 0.005 |
| 2019 | 0.002 | 0.059 | 0.001 | 0.002 | 0.000 | 0.004 |
Table 8.
Changes in the carbon storage of returned cropland in Yanjin County from 2000 to 2019.
| Type | 2000–2014 | 2014–2019 | Total |
|---|---|---|---|
| Cropland to forest area/km2 | 95.76 | 84.27 | 180.03 |
| Cropland to grassland/km2 | 0.06 | 0.30 | 0.36 |
| Grassland to forest/km2 | 0.32 | 0.03 | 0.35 |
| Cropland to forest carbon sink contribution/×105 t | 3.12 | 2.75 | 5.87 |
| Cropland to grassland carbon sink contribution/t | 148.03 | 781.79 | 929.83 |
| Grassland to forest carbon sink contribution/t | 218.60 | 21.18 | 239.78 |
| Contribution of carbon sinks from fallowed land/×105 t | 3.13 | 2.76 | 5.88 |
| The amount of carbon lost/t | 3.71 | 1.2 | 4.91 |
Table 9.
Carbon storage per unit area of returned cropland: 2000–2019 (t/km2).
| Time | Cropland–Forest | Cropland–Grassland | Grassland–Forest | Total |
|---|---|---|---|---|
| 2000–2014 | 3261.85 | 2467.17 | 683.13 | 6412.14 |
| 2014–2019 | 3261.95 | 2605.97 | 706.00 | 6573.92 |
| Change | 0.11 | 138.80 | 22.88 | 161.78 |
Disclaimer/Publisher’s Note: The statements, opinions and data contained in all publications are solely those of the individual author(s) and contributor(s) and not of MDPI and/or the editor(s). MDPI and/or the editor(s) disclaim responsibility for any injury to people or property resulting from any ideas, methods, instructions or products referred to in the content. |
© 2024 by the authors. Licensee MDPI, Basel, Switzerland. This article is an open access article distributed under the terms and conditions of the Creative Commons Attribution (CC BY) license (https://creativecommons.org/licenses/by/4.0/).
Share and Cite
MDPI and ACS Style
He, Y.; Kou, W.; Chen, Y.; Lai, H.; Zhao, K. Returning Cropland to Grassland as a Potential Method for Increasing Carbon Storage in Dry-Hot Valley Areas. Sustainability 2024, 16, 4150. https://doi.org/10.3390/su16104150
AMA Style
He Y, Kou W, Chen Y, Lai H, Zhao K. Returning Cropland to Grassland as a Potential Method for Increasing Carbon Storage in Dry-Hot Valley Areas. Sustainability. 2024; 16(10):4150. https://doi.org/10.3390/su16104150
Chicago/Turabian StyleHe, Yakai, Weili Kou, Yue Chen, Hongyan Lai, and Kaifu Zhao. 2024. "Returning Cropland to Grassland as a Potential Method for Increasing Carbon Storage in Dry-Hot Valley Areas" Sustainability 16, no. 10: 4150. https://doi.org/10.3390/su16104150
Note that from the first issue of 2016, this journal uses article numbers instead of page numbers. See further details here.