Article

Factor Analysis of Sustainable Livelihood Potential Development for Poverty Alleviation Using Structural Equation Modeling

by
Nitjakaln Ngamwong
,
Smitti Darakorn Na Ayuthaya
and
Supaporn Kiattisin
*
Information Technology Management Program, Faculty of Engineering, Mahidol University, Nakhon Pathom 73170, Thailand
*
Author to whom correspondence should be addressed.
Sustainability 2024, 16(10), 4213; https://doi.org/10.3390/su16104213
Submission received: 7 January 2024 / Revised: 8 April 2024 / Accepted: 10 April 2024 / Published: 17 May 2024

Abstract

:
The United Nations’ Sustainable Development Goals (SDGs) focus on reducing inequality while promoting economic growth, environmental protection, and access to critical services. The latest Multidimensional Poverty Index report shows that Thailand’s Multidimensional Poverty Index has decreased. This study analyzes factors that significantly affect the increase in sustainable livelihood potential development based on 37 indicators determined from a relevant questionnaire. The sample size was 17,536 households from 3612 villages and 193 districts, covering 20 provinces of Thailand, which is a region with a low Human Achievement Index (HAI). The data are analyzed and processed using structural equation modeling (SEM) statistical methods in order to confirm the factor structure and indicate the appropriateness of the empirical data according to the required criteria. It is found that sustainable living potential development includes 5 dimensions based on 37 indicators in Thailand, with natural capital being the most important, followed by human capital, financial capital, social capital, and physical capital. This research is expected to help community leaders or local agencies to prioritize projects or activities that improve the quality of life of people in each locality, including evaluating policies and various interventions, thus enabling the explanation of phenomena and statistical measurements.

1. Introduction

The United Nations’ Sustainable Development Goals (SDGs) are essential for reducing poverty and are designed to be integrated and mutually reinforcing. These goals focus on several issues, including reducing inequality as well as promoting economic growth, environmental protection, and access to essential services. The poverty situation in the context of the SDGs is a complex and multi-faceted issue. Poverty affects many aspects of people’s lives, including access to education, medical care, housing, and other basic needs.
A total of 17,536 secondary data samples adhering to the Taro Yamane formula were selected to assess the specified conditions of low-income family households. The data were collected by the Ministry of Higher Education, Science, Research, and Innovation (MHESI) in 2021–2022 for a total of 20 provinces in Thailand, comprising a group of regions characterized by a low Human Achievement Index (HAI). The data were analyzed and processed using structural equation modeling (SEM) statistical methods, including correlation and confirmatory factor analyses, in order to confirm the factor structure and indicate the appropriateness of the empirical data (Chi-square < 2, p-value > 0.05, CFI > 0.95, GFI > 0.95, AGFI > 0.95, RMSE < 0.05, RMR < 0.05, SRMR < 0.05).
A statistical analysis method was used to develop a forecasting model to increase the potential of sustainable living capital, allowing for analysis of the factors that significantly affect the increase in living capital. Through the consideration of a number of variables, the data collected using relevant questionnaires included at least 37 indicators (observable variables). The results are expected to help community leaders or local agencies, enabling them to assess the sustainability of projects or activities designed to improve the quality of life of people in each locality and evaluate policies and interventions numerically using the associated findings and phenomena.
This paper includes an introduction and hypothesis, a review of the related literature, the research methodology and procedures, and a sample. The results of data analysis using statistical methods are described in terms of mean values, correlations, confirmatory factor analysis, and structural equation modeling. A summary of the data analysis results, an interpretation of the results, and a description of potential applications are included in this study (Figure 1).

2. Literature Review

2.1. Multidimensional Poverty Index (MPI)

The Multidimensional Poverty Index report published on 17 October 2022, titled “Unpacking Deprivation Bundles to Reduce Multidimensional Poverty” was created by the United Nations Development Program (UNDP) in collaboration with the Human Resources Development and Poverty Alleviation Project. Oxford University’s Human Resources Development and Poverty Alleviation Initiative (OPHI) reported that 1.2 billion people in 111 developing countries around the world live in acute multi-dimensional poverty. Oxford University used 10 important issues as indicators, including nutritional status, child mortality, years of schooling, and school attendance. In this report, Thailand’s Multi-dimensional Poverty Index decreased to 0.002.
Multi-dimensional poverty measurement methods are currently being used in relevant assessments. Reflecting how well-being varies according to the indicators and effects of poverty factors [1], these methods generally focus on analyzing poverty factors rather than reflecting the enhancement or improvement of existing living factors [2], including changes aimed at achieving environmental sustainability [3]. Assumptions and conflicting objectives sometimes arise upon comparison with other well-being measurements, such as sustainable development and public health [4]. Therefore, this study reviews studies in the existing literature that have considered a different perspective on poverty based on the Sustainable Livelihood Framework Approach.

2.2. Sustainable Livelihood Framework (SLF)

In the early 1990s, the Sustainable Livelihood Approach (SLA) and the Sustainable Livelihood Framework (SLF) emerged as methods, frameworks, and theories for fieldwork. Prioritizing academics and applications, SLA is a shared position that values local knowledge obtained through engaging with local people [5]. Moreover, although SLA is not a method, it can be used in Rapid Rural Appraisal (RRA) evaluations and innovative methodologies such as Participatory Learning and Action (PLA). SLA became widespread in the 1990s, with its theoretical origins based on Sen’s (1985) capability approach, which focuses on the individual as a site for development [6].

2.2.1. Vulnerability Context

The context of vulnerability of low-income households includes trends, panic, and seasonal aspects of poverty [7]. The COVID-19 pandemic reduced incomes and affected the health and resilience of households and assets [8,9,10,11,12] Environmental changes, such as climate change, are another part of the context of vulnerability [7]; for example, vulnerability to environmental disasters such as landslides [13]. Households have various living assets, which may be used to escape poverty [14]. These are divided into human capital, social capital, financial capital, natural capital, and physical capital, and education has been identified as one of the most vital life assets [8,11,15,16,17,18,19]. Health is another aspect of human capital that is considered an asset in life [18]. Social capital is an asset for living and is generally considered helpful in reducing poverty [19,20]. Generosity in society is another relevant life asset, as are demographic factors such as family size and composition [16,19,20,21]. Race and ethnic diversity are possible sources of social capital. Although dependent on the context and other social factors [19,22], financial capital and economic resources—including income, accumulated wealth, and ownership of a house—affect family resources and resilience [11,21]. Assets for reducing risk, such as insurance, are also crucial for livelihoods [23]. In terms of natural capital, many types of natural assets are relevant to the livelihoods of individuals, such as access to water [24], access to green space for production and recreational needs [10], and access to agricultural resources, including equipment and supplies, labor, knowledge [25], and physical capital. Household energy efficiency can also be considered a livelihood asset affecting energy poverty [12,26]. Access to grid energy is considered a life asset owing to its direct impacts on energy availability and indirect effects such as access to refrigeration [27,28].
Many countries exhibit spatial trends in various poverty indicators, such as regional variation or differences between rural and urban communities [17,27,29,30,31]. For example, in India, eastern and northeastern states are more vulnerable to energy poverty [29], whereas energy poverty in Africa can occur in both rural and urban areas. Patterns vary depending on the country [30]. This pattern is not observed for food insecurity, which is observed in both urban and rural areas [27]. Therefore, patterns vary across countries and poverty contexts. This can be challenging to assess owing to overlapping risk patterns, which are influenced by factors such as the migration of risk groups between areas [32].

2.2.2. Livelihood Assets

With regard to human capital, at the individual level, households have various livelihood assets that they may use to escape poverty [14]. These assets can be divided into human, social, financial, natural, and physical capital. Education is one of the significant livelihood assets identified in previous studies [8,11,15,16,17,18,19]. Health is another aspect of human capital that can be considered a livelihood asset [18]. Social capital is another general livelihood asset associated with poverty reduction [19,20] and social integration. Demographic factors such as family size and composition are also relevant [16,19,20,21]. Ethnicity and ethnic diversity are potential sources of social capital, although this is highly contextual and contingent on other social factors [19,22], such as financial capital. Economic resources including income, accumulated wealth, and home ownership affect family resources and resilience [11,21]. Risk reduction assets, such as insurance, are also crucial for livelihoods [23]. Several types of natural capital assets are relevant to livelihoods, including access to water [24], access to green space for productive and recreational needs [10], and access to farming resources, including equipment and supplies, labor, and knowledge [25].
Physical capital and household energy efficiency can also be considered livelihood assets that affect energy poverty [26,33]. Access to grid energy may be considered a livelihood asset owing to its direct impact on energy availability and indirect effects (e.g., access to refrigeration) [27,28].

2.2.3. Policies, Institutions, and Processes

In general, policies to support sustainable poverty reduction should be implemented with a pro-alleviation stance, including programs such as agricultural insurance, universal health insurance, and disaster risk management [14]. Such policies must be accessible for low-income people, maintaining political access even without telecommunication infrastructure [34].
Policies for poverty eradication have had mixed effects. In China, land consolidation programs were poverty-reducing, although some were more effective than others [35]. Protective policies, such as those used to address COVID-19 in China, can mitigate the impact of shocks and help to replenish depleted livelihood assets [12]. Educational policies can be effectively used to help educators meet the needs of their students in poverty [36,37]. Transport infrastructure policies can increase transport accessibility, although the effects may not be as significant as their proponents claim [38]. Renewable energy policies may also address poverty, although these policies have only been routinely effective in Europe [33]. However, other procedures may hinder livelihoods, such as China’s poverty alleviation resettlement policy, in the context of which many people have struggled to integrate culturally, socially, and psychologically [20]. Marketization policies—which aim to remove government monopolies—have inverted effects, reducing poverty only up to a point [39]. Thus, the actual effectiveness of government strategies and policies is mixed.
There are other comprehensive policies and institutions that may affect livelihoods. In general, financial development is a factor in poverty [40], as are constraints on infrastructure, industry and human resource development, and industry policies [41]. Grid infrastructure reliability and coverage is a systemic policy factor in energy poverty, even in areas with full electrification [28,30,41]. Government economic policies, such as encouraging foreign direct investment (FDI) and promoting natural regional economic development, are other institutional factors affecting energy poverty [40,41]. Foreign aid policies also have a localized energy poverty reduction effect through transmission mechanisms such as education, economic growth, and income poverty reduction [37].
There are limits to the impact that government policy may exert on poverty eradication, including government and political support, financial limits on the country’s tax base and conflicting needs, resource mobilization capacity, and a political environment that supports such policies [42,43]. Policies must also balance conflicting interests, as those encouraging overall economic growth may negatively affect local communities [44]. There may also be unintended consequences of other policies on poverty reduction, such as COVID-19 cash transfer policies, which inadvertently excluded some recipients in poverty [8], or watershed management policies that constrain water resources for low-income communities [24]. Thus, government policies and institutions cannot fully control poverty reduction or livelihoods.

2.2.4. Livelihood Strategies

Livelihood strategies are often diversified, with clear choices driven by the environment, individual preferences, risk perception, and available livelihood assets [12,25]. Agriculture—including subsistence farming and cash cropping—is a primary and diversified livelihood strategy worldwide [7,44]. Other systems depend on natural resources, such as mining in Colombia [45]. These strategies may be adapted to address issues such as climate change or short-term and seasonal challenges [7].
Livelihood strategies may also be used to address specific short-term and long-term needs. The use of alternative fuels, such as wood, biomass, or other solid fuels, is a common seasonal and short-term livelihood strategy used to address energy poverty [28,46,47,48]. Cost reduction through energy conservation or even under-use is widespread [26,49]. In the long term, educational strategies may also be used, including educating children, preparing children for school, and spending resources on child health [15,50].

2.2.5. Livelihood Outcomes

Livelihood outcomes, which depend on the abovementioned components, can have mixed effects. Educational and child development strategies positively impact family poverty and help to secure multi-generational livelihoods [15,50,51]. Sustainable livelihood outcomes also affect long-term income, wealth accumulation, and migration aspirations [7]. However, strategies such as mining and unsustainable agricultural practices may not affect poverty or may even increase it [25,45]. Short-term strategies such as solid fuel use can negatively affect air quality, cause burns and injuries, and ultimately affect mental and physical health and life satisfaction [28,47,48]. Thus, not all livelihood outcomes are equal with respect to their effect on poverty.
In summary, several factors influence a household’s level of poverty and its ability to escape poverty, such as gender dynamics, social mores, the caste system, and prevailing religious beliefs affecting a household’s survival. Access should be provided to resources including credit and finance, market access and employment opportunities, safe drinking water for health services, and environmental education resources such as land and ecosystem services. Poverty analysis models also consider how these resources are connected and integrated. These frameworks are typically based on the following critical elements. (1) Assets: The resources that people have access to, including physical, financial, human, and social capital. (2) Vulnerability: The factors that make people vulnerable to shocks, such as poverty, conflict, climate change, and economic instability. (3) Livelihood strategies: The techniques that people use to make a living, such as farming, fishing, or working in the informal sector. (4) Livelihood outcomes: The results of people’s livelihood strategies, such as improved health, education, and income. (5) Context: The environment in which people live, including local policies and institutions and the global economy.

2.3. Analytic Framework

2.3.1. Structural Equation Modeling (SEM)

Structural equation analysis or exploratory structural equation modeling (ML-ESEM) is a method of statistical analysis that uses statistical modeling. This exploratory structural equation model is a measurement model that uses an advanced algorithm that aims to examine the structure of a variable with several multi-component facilities. Furthermore, it explores the relationship between construct or latent variables and indicators of variables, called observed variables, through the concept of the structural equation model.
Structural equation modeling (SEM) is a popular statistical technique for testing theories in various academic fields. It is a multivariate method of statistical analysis that measures latent constructs, which are identified through factor analysis, and estimates the path of hypothesized relationships between constructs. Overall, SEM has two main advantages: (1) it allows for the estimation of series but is independent of the equations; and (2) it can incorporate latent variables into the analysis and consider measurement error in the estimation process. In other words, SEM is a statistical technique that creates a model. In the study titled “Measurement and Structural Modeling to Address Complex Behavioral Relationships”, Hershberger examined the growth and development of structural equation modeling from 1994 to 2001, concluding that SEM is a prominent method for analyzing multivariate data. Many journals published articles describing SEM approaches and multivariate techniques, and SEM remains the most refined and broad technique for the purpose it serves. The explanatory scope and statistical power of model testing can be extended through the use of a single comprehensive structural equation [52].

2.3.2. Confirmatory Factor Analysis (CFA)

In factor analysis techniques, the measurement model is a statistical model that simulates the theoretical relationship between latent and observed variables. Using psychological construct variables as observable variables or behaviors, researchers can determine the operational definition and develop a measurement question for academic variables. In this measurement model, the variance of the obtained score is divided into two parts: the theoretical measurement variance and the measurement error variance. The results of this measurement model analysis will indicate whether each observed variable measures the latent variables well or not, which can be determined from the component weight (Lambda) or the standard component weight.
CFA (Confirmatory Factor Analysis) is a widely used analytical method [52] and is a structural equation modeling (SEM) approach that was first introduced by Anderson and Gerbing [53]. CFA helps researchers correct measurement errors while estimating multiple dependent relationships. It can be used to isolate the method variance arising from different sources. Relationships between constructs and related indicator items were calculated using maximum likelihood estimation in the work of Joreskog and Sorbom. Hair, Black, Babin, Anderson, and Tatham proposed an approach considering the covariance-isolated variance and error variance, in which the main criterion for the accuracy of a measurement model is the difference between the observed and estimated covariance matrices obtained from actual data and the hypothesized model, respectively [54].
Confirmatory factor analysis has other advantages. Confirmatory Factor Analysis (CFA) includes effectively verifying the structural validity of the measurement results obtained using a particular instrument. Exploratory structural equation modeling is a statistical technique that is suitable for studying the structure of multi-component variables, as it provides an effective measurement model that is consistent with empirical data. In particular, it can enhance the discriminative validity between elements and accurately reflect the nature of the data [55].

3. Materials and Methods

3.1. Materials and Research Areas

Poverty generally refers to people being unable to meet the basic needs of their livelihood. The basic needs of their livelihood can be variable. For example, the standard of living for people at present is that they must have food that contains nutrients from the five food groups, full meals, a place to live and sleep that is clean and strong, a career and income, and stability (i.e., able to live without working for at least three months).
This study used secondary data from low-income households, obtained using a 58-item questionnaire on the living conditions of low-income households issued by the Ministry of Higher Education, Science, Research, and Innovation (MHESI) in 2021–2022. The questionnaire was distributed in a group of regions with the lowest Human Achievement Index (HAI) in Thailand, and data were obtained for more than 241,512 households (or more than 1 million people). For sample selection, a combination of actual and stratified sampling was used to ensure the scientific nature and reliability of the survey. The final sample size was 17,536 households from 3612 villages and 193 districts covering 20 provinces of Thailand.
These data can be used to evaluate the individual elements that constitute poverty and their relative importance with respect to one another. The contents of the questionnaire were divided into three areas: (1) human capital, focusing on data at the individual level of members of the target households, and social capital, focusing on information at the community level related to or affecting the target household; (2) physical and financial capital, focusing on household-level data; and (3) natural resource capital. The questionnaire consisted of two main parts. The first addressed fundamental information about the household and the survey team, and the second addressed the capital base of the sample household. The survey was further divided into 7 subsections according to the 37 indicators, with a total 58 questions.
Part 1: Human Capital Indicators, 16 questions on the age, gender, health, social welfare, education, work status, occupation, vocational skills, and average income (analyzed as financial capital) of household members.
Part 2: Physical capital indicators, 16 questions on housing, hygiene in the home, facilities in the house, drinking water, used water, arable land (analyzed together with natural capital), transportation routes, awareness of information, and use of information technology.
Part 3: Financial Capital indicators, six questions on income, source of income, expenditure, savings, debt, credit, and assets.
Part 4: Indicators of Natural Capital, five survey questions on subsistence resources (these aid in the analysis of a career/income disaster).
Part 5: Social Capital Indicator, 10 questions on community activity participation, helping each other in the community and following the rules and regulations for living together, community conflict management, knowledgeable people in the community, and involvement in the community.
Part 6: Opinions on the problems and impacts of the infectious disease COVID-19 and unrest in the three southern border provinces, two questions.
Part 7: Opinions and suggestions, three questions (Figure 2).

3.2. Methodology and Variables

Data analysis involved converting questionnaire responses into values, dividing them into groups, and calculating averages for each group.
The poverty level was determined based on the average score of each group. The 37 indices were divided into five dimensions. Confirmatory factor analysis was performed to check the first-order model, and second-order confirmatory factor analysis was conducted to adjust the model (Figure 3).
Step 1: This step involved converting all 58 questionnaire answers (variables) into scores of 1, 2, 3, or 4 and grouping values according to the specified conditions by dividing questions into groups according to the 37 indicators. The answers and questions in the same index group were averaged to represent each index.
X ¯ = M n = 1 n i = 1 n X i
In statistics, “Mean” refers to the average of a set of numbers. It is calculated by adding all the numbers in a set and dividing the sum by the total number of values.
Step 2: The 37 indicators were divided into 5 dimensions according to the sustainable livelihood framework and the mean value was calculated for each group. Each index was given the same weight in each group (Table 1).
Step 3: The relationship between the variables in each dimension was calculated. Confirmatory factor analysis was performed in the first-order model by separating the calculations into five groups. A statistical method was used for correlation and confirmatory factor calculation. The factor structure was checked and the model was adjusted using the Mplus statistical program.
r = Σ x i x ¯   y i y ¯ Σ x i x ¯ 2 Σ y i y ¯ 2  
“Correlation” refers to the relationship between two variables. It measures the strength and direction of the relationship between two variables. The correlation coefficient is a numerical value that ranges from −1 to 1, where −1 means a perfect negative correlation, 0 means no relationship, and 1 indicates a perfect positive correlation.
Step 4: The correlation values for 37 indicators were calculated and a first-order confirmatory factor analysis was performed by separating the calculations for the five dimensions. Then, a second-order confirmatory factor analysis was conducted using correlation and confirmatory factor analysis methods. The Mplus statistical program was used to check the factor structure and adjust the model.

4. Results

The experimental results and the statistical analysis were classified according to the data from the 17,536 households. Statistical methods, including correlation and confirmatory factor analyses, confirmed the factor structure and indicated the appropriateness of the empirical data. The Mplus statistical program was used to verify and fit the model (Table 2 and Table 3, Figure 4, Figure 5, Figure 6, Figure 7, Figure 8, Figure 9 and Figure 10).

4.1. Results of Data Analysis for the First-Order Confirmatory Factor Analysis (CFA)

The results obtained in consideration of the sustainable livelihood framework for each province included average scores of between 1.91 and 2.28, which were obtained using following criteria for analyzing and interpreting data. The Table 4 show that the Overall Sustainable Livelihood Framework ( x ¯ = 2.10) is group 2. The results for the sustainable living dimensions in each part were in the order of human capital ( x ¯ = 2.46) and physical capital ( x ¯ = 2.32), followed by financial capital ( x ¯ = 2.03), natural capital ( x ¯ = 1.89), and social capital ( x ¯ = 1.80), when considering the definition of a relatively low-income household.
A thorough explanation of the map symbols used in Figure 11 (for the results of spatial data analysis of sustainable livelihood dimensions in the Figure 12).

4.1.1. Human Capital

The confirmatory factor analysis (CFA) results for human capital were obtained using the Mplus program. The Model Fit Measures of human capital were as follows: Chi-square = 2.418, df = 1, p = 0.120, CFI = 0.999, TLI = 0.993, RMSEA = 0.01, and SRMR = 0.00. According to the required criteria, the Goodness of Fit Index (GFI), CFI, and TLI were more significant than 0.95, and the RMSEA and RMR confirmatory factor analysis (CFA) results were lower than 0.05. Therefore, human capital consists of four components, where the three most essential components are (C13) careers and occupational skills to generate income, (C11) highest level of education, and (C16) good health.
The lost indicators were C12 and C14, with correlation coefficients of 0, which means that these index variables are not correlated with the dimensions of human capital (Table 5 and Table 6, Figure 13).

4.1.2. Physical Capital

The confirmatory factor analysis results for physical capital were obtained using the Mplus program. The Model Fit Measures of physical capital were as follows: Chi-square = 8.979, df = 4, p = 0.06, CFI = 0.997, TLI = 0.989, RMSEA = 0.01, and SRMR = 0.01. According to the required criteria, the Goodness of Fit Index (GFI), CFI, and TLI were more significant than 0.95, and the RMSEA and RMR were lower than 0.05. Therefore, physical capital consists of six components, where the three most essential components are (C23) hygiene in the home, (C22) roads/public paths and residential entrance, and (C25) electrical system/waterworks/information equipment.
The lost indicator was C27, with a correlation coefficient of 0, which means that this index variable is not correlated with the dimensions of physical capital (Table 7 and Table 8, Figure 14).

4.1.3. Financial Capital

The confirmatory factor analysis (CFA) results for financial capital were obtained using the Mplus program. The Model Fit Measures of financial capital were as follows: Chi-square = 3.288, df = 1, p = 0.069, CFI = 0.997, TLI = 0.984, RMSEA = 0.01, and SRMR = 0.00. According to the required criteria, the Goodness of Fit Index (GFI), CFI, and TLI were more significant than 0.95, and the RMSEA and RMR were lower than 0.05. Therefore, financial capital consists of four components, where the three most essential components are (C35) property for occupation, (C31) average annual household income, and (C34) debt.
The lost indicator was C32, with a correlation coefficient of 0, which means that this index variable is not correlated with the dimensions of financial capital (Table 9 and Table 10, Figure 15).

4.1.4. Natural Capital

The confirmatory factor analysis (CFA) results for natural capital were obtained using the Mplus program. The Model Fit Measures of natural capital were as follows: Chi-square = 5.525, df = 2, p = 0.063, CFI = 0.999, TLI = 0.997, RMSEA = 0.01, and SRMR = 0.00. According to the required criteria, the Goodness of Fit Index (GFI), CFI, and TLI were more significant than 0.95, and the RMSEA and RMR were lower than 0.05. Therefore, natural capital consists of four components, where the three most essential components are (C44) roads/public paths and workplace entrance, (C43) workplace problems, and (C46) using natural resources in the area to generate income.
The lost indicators were C41 and C45, with correlation coefficients of 0, which means that these index variables do not correlate with the dimensions of natural capital (Table 11 and Table 12, Figure 16).

4.1.5. Social Capital

The confirmatory factor analysis (CFA) results for social capital were obtained using the Mplus program. The Model Fit Measures of social capital were as follows: Chi-square = 7.176, df = 4, p = 0.126, CFI = 1.000, TLI = 0.999, RMSEA = 0.01, SRMR = 0.00. According to the required criteria, the Goodness of Fit Index (GFI), CFI, and TLI were more significant than 0.95, and the RMSEA and RMR were lower than 0.05. Therefore, social capital consists of six components, where the three most essential components are (C59) experience in developing or solving community problems; (C510) participation in community management, organizations, groups, or institutions in the community, and (C57) knowledge of solving problems and community development.
The lost indicators were C51, C52, and C54, with correlation coefficients of 0, which means that these index variables do not correlate with the dimensions of social capital (Table 13 and Table 14, Figure 17).

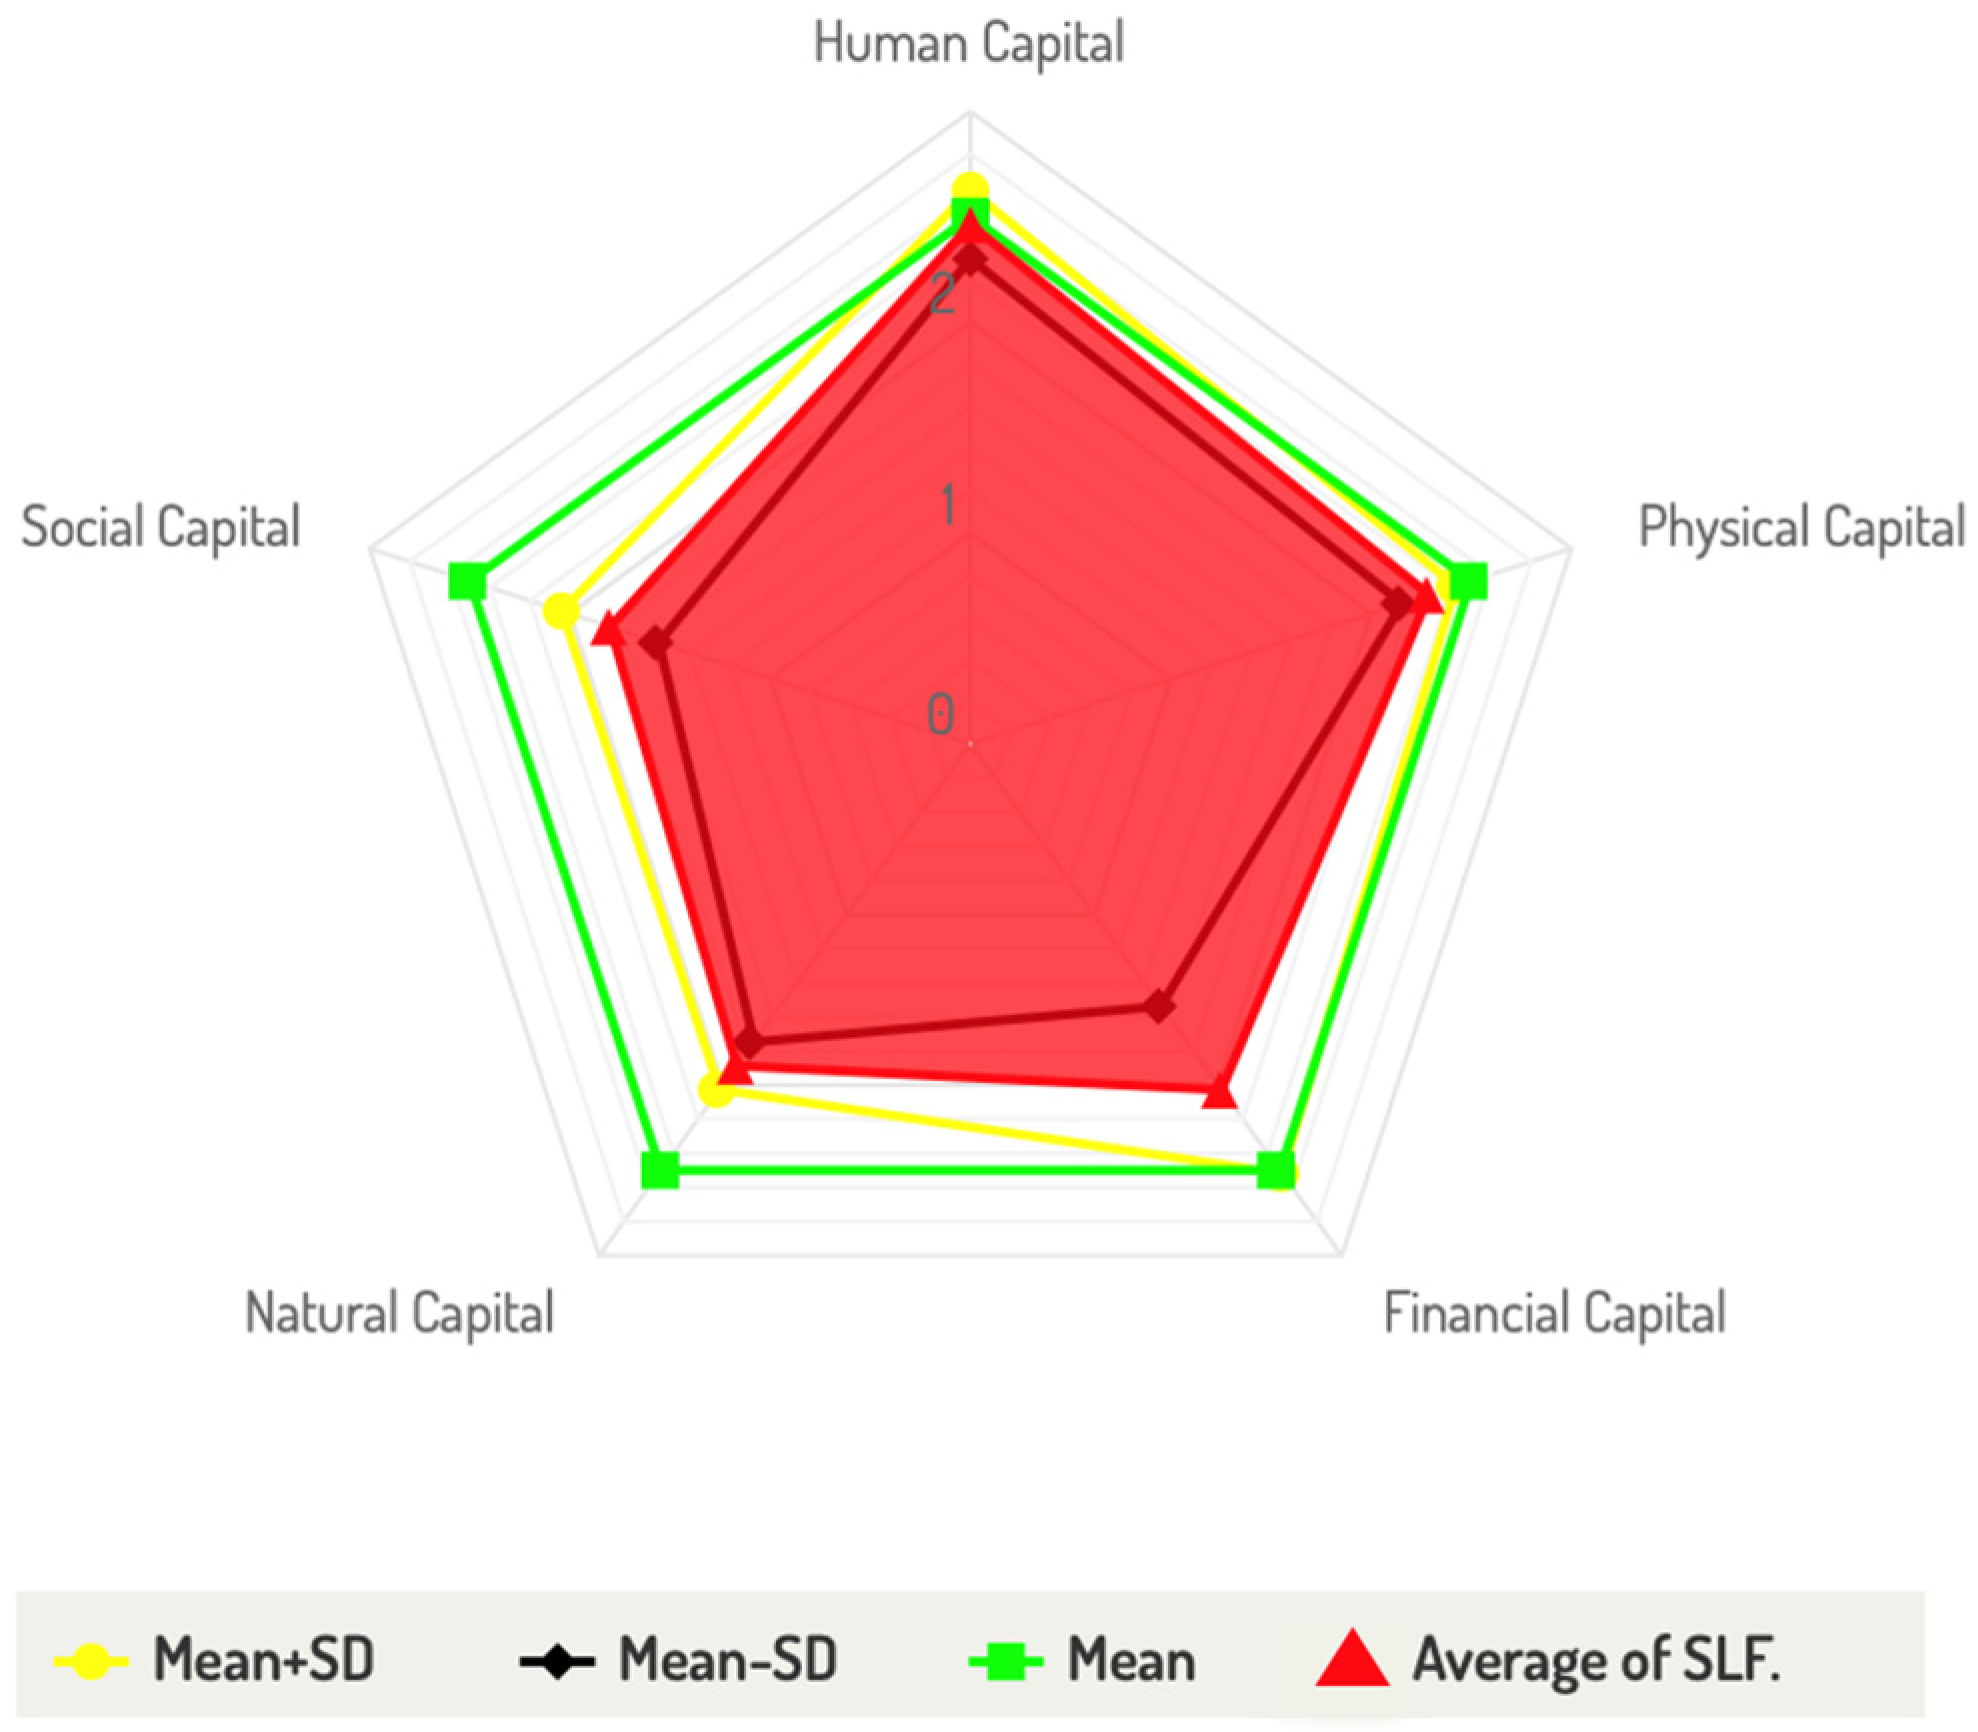
4.2. Results of Structural Equation Modeling (SEM) Using Second-Order CFA

The table below provides a detailed breakdown of structural equation modeling (SEM) utilizing second-order confirmatory factor analysis (CFA) (Table 15 and Table 16, Figure 18).
The results of the Structural Equation Modeling analysis for Sustainable Livelihood Potential Development in the case of Thailand were obtained using the Mplus program. The Model Fit Measures were as follows: Chi-square = 1264.98, df = 148, p-value = 0.000, CFI = 0.968, TLI = 0.950, RMSEA = 0.02, and SRMR = 0.02. According to the required criteria, the Goodness of Fit Index (GFI), CFI, and TLI were more significant than 0.95, and the RMSEA and RMR were lower than 0.05. The lost indicators with correlation coefficients of 0 (meaning that these variables are not correlated with the dimensions of the sustainable livelihood framework in Thailand) were C12, C14, C32, C25, C27, C41, C44, C45, C47, C51, C52, and C54.
Therefore, the sustainable living framework consists of five key components, with natural capital being the most important, followed by human, financial, social, and physical capital. We found the following:
(1)
The three highest-weighted indicators of natural capital were (C43) workplace problems, (C46) using natural resources in the area to generate income, and (C42) using water for agriculture.
(2)
The three highest-weighted indicators of human capital were (C11) highest education, (C13) careers and professional skills to create income, and (C16) good health.
(3)
The three highest-weighted indicators of financial capital were (C35) property for occupation, (C34) debt, and (C31) average annual household income.
(4)
The three highest-weighted indicators of social capital were (C59) experience in solving community problems, (C510) participation in community management, and (C57) having a knowledgeable person for development in the community.
(5)
The three highest-weighted indicators of physical capital were (C23) hygiene in the home, (C22) housing problems, and (C24) condition of electrical systems/waterworks/information equipment.

5. Conclusions and Limitations

5.1. Conclusions

The concept of this study was based on the Sustainable Livelihoods Framework, which was created as a theory, framework, and method for fieldwork. We demonstrated the appropriateness of the empirical data and provided evidence for its factor structure. The results obtained through such analyses must be communicated to local government officials or community leaders in order to assess the feasibility of projects or activities intended to improve the living conditions of citizens in a community. Many approaches can be evaluated through the use of statistical methods to measure and explain the associated occurrences and findings.
Using the indicator analysis approach, this article evaluated five dimensions—namely, financial, social, human, physical, and natural capital—to confirm the relationships between the indicators and the potential growth of low-income households in Thailand. In the sustainable living paradigm, natural capital had the highest significance, with a factor loading value of 0.913; human capital was ranked second, with a factor loading value of 0.819; financial capital had a factor loading value of 0.811, placing it third; and social capital came in fourth place, with a factor loading value of 0.649. Finally, physical capital had a factor loading value of 0.373, placing it last. The results obtained are as follows:
(1)
The potential development of natural capital should focus on solving problems in the workplace (0.498), encouraging the use of natural resources in the area to generate income (0.232), and supporting the use of water for agriculture (0.154).
(2)
The potential development of human capital should focus on supporting members of low-income families to obtain higher education (0.873), promoting vocational skills and income-generating careers (0.261), and promoting the good health of household members (0.025).
(3)
The potential development of financial capital should focus on supporting real estate for occupations (0.482) and reducing the debt burden (0.262). Moreover, the average annual household income should be increased (0.107).
(4)
The potential development of social capital should focus on supporting the use of experience in developing or solving community problems (0.841); promoting the participation of administrators, organizations, groups, or institutions in the community (0.801); and having strong community leaders. This will support the presence of knowledgeable people to help solve problems and develop communities (0.359).
(5)
The development of physical capital potential should focus on promoting and supporting good hygiene in homes (0.422), necessary essential utilities including electricity, water, and information equipment (0.388), and support for ownership of housing and land (0.156).
Most people escape poverty by moving from low- to high-productivity sectors, which often involves internal migration or the expansion of more productive firms into low-income areas. Although providing natural capital is important, it is not the only solution. Having money, owning a home, and having a good social network can also reduce poverty; however, these are often the result of having already escaped poverty or inherited wealth. It is important to acknowledge that policy interventions should focus on reducing poverty in a specific place and creating opportunities for people to escape poverty through other means, such as job growth or urbanization.

5.2. Limitations and Future Research Directions

Although this study provides a conceptual framework for developing sustainable livelihood capital potential among a sample of low-income households in Thailand, several limitations exist.
First, although many variables influence the living capital potential of low-income families, this research analyzed 37 indicators that affect living capital using 58 questions. There may be limitations in evaluating other dimensions. Second, the study included only 17,536 low-income households in 3612 villages and 193 districts, covering 20 provinces in Thailand. This may limit the generalizability of the survey results to other regions or countries.
Finally, this study used secondary data from 58 questionnaires and grouped them into 37 indicators. Analysis of the results using the Mplus version 7 statistical data analysis program was necessary in order to eliminate some variables. This contradicts the facts of subsistence capital analysis according to social science principles, and other statistical tools such as AMOS version 28, LISREL version 11, and JAMOVI version 0.9.1.9 could be selected to compare the full results in all dimensions.
Therefore, future research aimed at increasing the potential of household living capital should be conducted from various dimensions through in-depth analysis. Then, the guidance provided could be tested in sandbox areas in order to develop guidelines that are appropriate for the context of each area.

Author Contributions

Conceptualization, N.N.; methodology, N.N.; validation, S.D.N.A. and S.K.; formal analysis, N.N.; investigation, N.N.; resources, N.N.; data curation, N.N.; writing—original draft preparation, N.N.; writing—review and editing, N.N., S.D.N.A. and S.K.; visualization, N.N.; supervision, S.D.N.A. and S.K. All authors have read and agreed to the published version of the manuscript.

Funding

This research received no external funding.

Institutional Review Board Statement

The study was conducted according to the guidelines of the Declaration of Helsinki and approved by the Institutional Review Board (or Ethics Committee) of Mahidol University (protocol code MU-CIRB 2023/145.0510 and date of approval 5 October 2023).

Informed Consent Statement

Not applicable.

Data Availability Statement

Data sharing is not applicable to this article. Data are unavailable due to privacy or ethical restrictions.

Acknowledgments

The authors would like to thank the anonymous experts and reviewers for their valuable comments and suggestions that have improved this article.

Conflicts of Interest

The authors declare no conflicts of interest.

References

  1. Alkire, S.; Kanagaratnam, U.; Nogales, R.; Suppa, N. Revising the Global Multidimensional Poverty Index: Empirical Insights and Robustness. Rev. Income Wealth 2022, 68, S347–S384. [Google Scholar] [CrossRef]
  2. Seth, S.; Santos, M.E. On the Interaction Between Focus and Distributional Properties in Multidimensional Poverty Measurement. Soc. Indic. Res. 2019, 145, 503–521. [Google Scholar] [CrossRef]
  3. Pinar, M. Sensitivity of environmental performance index based on stochastic dominance. J. Environ. Manag. 2022, 310, 114767. [Google Scholar] [CrossRef]
  4. Pereira, M.A.; Marques, R.C. The ‘Sustainable Public Health Index’: What if public health and sustainable development is compatible? World Dev. 2022, 149, 105708. [Google Scholar] [CrossRef]
  5. Chambers, R. Rural Development: Putting the Last First; Longman: London, UK, 1983; Volume 198. [Google Scholar]
  6. Scoones, I. Livelihoods perspectives and rural development. J. Peasant. Stud. 2009, 36, 171–196. [Google Scholar] [CrossRef]
  7. Mallick, B.; Sultana, Z.; Bennett, C.M. How do sustainable livelihoods influence environmental (non-)migration aspirations? Appl. Geogr. 2020, 124, 102328. [Google Scholar] [CrossRef]
  8. Della Guardia, A.; Lake, M.; Schnitzer, P. Selective inclusion in cash transfer programs: Unintended consequences for social cohesion. World Dev. 2022, 157, 105922. [Google Scholar] [CrossRef]
  9. Henao-Cespedes, V.; Garcés-Gómez, Y.A.; Ruggeri, S.; Henao-Cespedes, T.M. Relationship analysis between the spread of COVID−19 and the multidimensional poverty index in the city of Manizales, Colombia. Egypt. J. Remote. Sens. Space Sci. 2022, 25, 197–204. [Google Scholar] [CrossRef]
  10. Mayen Huerta, C. Rethinking the distribution of urban green spaces in Mexico City: Lessons from the COVID-19 outbreak. Urban For. Urban Green. 2022, 70, 127525. [Google Scholar] [CrossRef]
  11. Ouoba, Y.; Sawadogo, N. Food security, poverty, and household resilience to COVID-19 in Burkina Faso: Evidence from urban small traders’ households. World Dev. Perspect. 2022, 25, 100387. [Google Scholar] [CrossRef]
  12. Zhao, H.; Guo, X.; Peng, N. What catalyzes the proactive recovery of peasants from the COVID-19 pandemic? A livelihood perspective in Ningqiang County, China. Int. J. Disaster Risk Reduct. 2022, 73, 102920. [Google Scholar] [CrossRef]
  13. Mirdda, H.A.; Bera, S.; Chatterjee, R. Vulnerability assessment of mountainous households to landslides: A multidimensional study in the rural Himalayas. Int. J. Disaster Risk Reduct. 2022, 71, 102809. [Google Scholar] [CrossRef]
  14. Diwakar, V.; Shepherd, A. Sustaining escapes from poverty. World Dev. 2022, 151, 105611. [Google Scholar] [CrossRef]
  15. Maity, S.; Rummana Barlaskar, M.U.; Sarkar, M.M. Girls’ educational attainment at the higher secondary level across Indian states: Scenario and determinants. Soc. Sci. Humanit. Open 2022, 6, 100283. [Google Scholar] [CrossRef]
  16. Obaco, M.; Pontarollo, N.; Mendieta Muñoz, R.; Díaz-Sánchez, J.P. On the association between housing deprivation and urban size: Evidence from South Asia. World Dev. 2022, 157, 105895. [Google Scholar] [CrossRef]
  17. Sajjad, M.; Munir, H.; Kanwal, S.; Asad Naqvi, S.A. Spatial inequalities in education status and its determinants in Pakistan: A district-level modeling in the context of sustainable development Goal-4. Appl. Geogr. 2022, 140, 102665. [Google Scholar] [CrossRef]
  18. Shahid, A.; Siddique HM, A.; Kiani, A.K.; Shafique, U. Human health, FDI, and economic growth nexus: A panel data analysis. Int. J. Bus. Econ. Financ. 2021, 2, 54–66. [Google Scholar]
  19. Tran, T.Q.; Thi Nguyen, H.T.; Hoang, Q.N.; Van Nguyen, D. The influence of contextual and household factors on multidimensional poverty in rural Vietnam: A multilevel regression analysis. Int. Rev. Econ. Financ. 2022, 78, 390–403. [Google Scholar] [CrossRef]
  20. Tang, J.; Xu, Y.; Qiu, H. Integration of migrants in poverty alleviation resettlement to urban China. Cities 2022, 120, 103501. [Google Scholar] [CrossRef]
  21. Abbas, K.; Butt, K.M.; Xu, D.; Ali, M.; Baz, K.; Kharl, S.H.; Ahmed, M. Measurements and determinants Of extreme multidimensional energy poverty using machine learning. Energy 2022, 251, 123977. [Google Scholar] [CrossRef]
  22. Koomson, I.; Afoakwah, C.; Ampofo, A. How does ethnic diversity affect energy poverty? Insights from South Africa. Energy Econ. 2022, 111, 106079. [Google Scholar] [CrossRef]
  23. Stoeffler, Q.; Opuz, G. Price, information, and product quality: Explaining index insurance demand in Burkina Faso. Food Policy 2022, 108, 102213. [Google Scholar] [CrossRef]
  24. Mengistu, F.; Assefa, E. Towards sustaining watershed management practices in Ethiopia: A synthesis of local perception, community participation, adoption, and livelihoods. Environ. Sci. Policy 2020, 112, 414–430. [Google Scholar] [CrossRef]
  25. Eichsteller, M.; Njagi, T.; Nyukuri, E. The role of agriculture in poverty escapes in Kenya—Developing a capabilities approach in the context of climate change. World Dev. 2022, 149, 105705. [Google Scholar] [CrossRef]
  26. Barrella, R.; Romero, J.C.; Linares, J.I.; Arenas, E.; Asín, M.; Centeno, E. The dark side of energy poverty: Who is under-consuming in Spain and why? Energy Res. Soc. Sci. 2022, 86, 102428. [Google Scholar] [CrossRef]
  27. Davis, J.; Magadzire, N.; Hemerijckx, L.-M.; Maes, T.; Durno, D.; Kenyana, N.; Lwasa, S.; Van Rompaey, A.; Verburg, P.H.; May, J. Precision approaches to food insecurity: A spatial analysis of urban hunger and its contextual correlates in an African city. World Dev. 2022, 149, 105694. [Google Scholar] [CrossRef]
  28. Mathen, C.K.; Sadath, A.C. Examination of energy poverty among households in Kasargod District of Kerala. Energy Sustain. Dev. 2022, 68, 472–479. [Google Scholar] [CrossRef]
  29. Gupta, S.; Gupta, E.; Sarangi, G.K. Household Energy Poverty Index for India: An analysis of inter-state differences. Energy Policy 2020, 144, 111592. [Google Scholar] [CrossRef]
  30. Ugembe, M.A.; Brito, M.C.; Inglesi-Lotz, R. Measuring energy poverty in Mozambique: Is energy poverty. A purely rural phenomenon? Energy Nexus 2022, 5, 100039. [Google Scholar] [CrossRef]
  31. Wang, X.; Hai, S.; Cai, P. Urban rural disparity of child poverty in China: Spatio-temporal changes and influencing factors. J. Rural Stud. 2022, 91, 170–183. [Google Scholar] [CrossRef]
  32. Brazil, N. The multidimensional clustering of health and its ecological risk factors. Soc. Sci. Med. 2022, 295, 113772. [Google Scholar] [CrossRef] [PubMed]
  33. Zhao, J.; Dong, K.; Dong, X.; Shahbaz, M. How renewable energy alleviate energy poverty? A global analysis. Renew. Energy 2022, 186, 299–311. [Google Scholar] [CrossRef]
  34. Ullah, A.; Pinglu, C.; Ullah, S.; Qaisar, Z.H.; Qian, N. The dynamic nexus of E-Government, and sustainable development: Moderating role of multi-dimensional regional integration index in Belt and Road partner countries. Technol. Soc. 2022, 68, 101903. [Google Scholar] [CrossRef]
  35. Zhang, Y.; Wang, W.; Feng, Y. Impact of different models of rural land consolidation on rural household poverty vulnerability. Land Use Policy 2022, 114, 105963. [Google Scholar] [CrossRef]
  36. Lu, C.Y.; Parkhouse, H.; Thomas, K. Measuring the multidimensionality of educators’ approaches to diversity: Development of the in-service teacher multicultural education model. Teach. Teach. Educ. 2022, 116, 103752. [Google Scholar] [CrossRef]
  37. Munyanyi, M.E.; Awaworyi Churchill, S. Foreign aid and energy poverty: Sub-national evidence from Senegal. Energy Econ. 2022, 108, 105899. [Google Scholar] [CrossRef]
  38. Benevenuto, R.; Caulfield, B. Examining the socioeconomic outcomes of transport interventions in the Global South. Transp. Policy 2022, 119, 56–66. [Google Scholar] [CrossRef]
  39. Ren, Y.-S.; Jiang, Y.; Narayan, S.; Ma, C.-Q.; Yang, X.-G. Marketization and rural energy poverty: Evidence from provincial panel data in China. Energy Econ. 2022, 111, 106073. [Google Scholar] [CrossRef]
  40. Wu, M.; Taghizadeh-Hesary, F.; Shahbaz, M. Nexus between financial development and energy poverty in Latin America. Energy Policy 2022, 165, 112925. [Google Scholar] [CrossRef]
  41. Wu, W.; Li, Y.; Liu, Y. What constrains impoverished rural regions: A case study of Henan Province in central China. Habitat Int. 2022, 119, 102477. [Google Scholar] [CrossRef]
  42. Bolch, K.B.; Ceriani, L.; López-Calva, L.F. The arithmetics and politics of domestic resource mobilization for poverty eradication. World Dev. 2022, 149, 105691. [Google Scholar] [CrossRef]
  43. Chinsinga, B.; Weldeghebrael, E.H.; Kelsall, T.; Schulz, N.; Williams, T.P. Using political settlements analysis to explain poverty trends in Ethiopia, Malawi, Rwanda, and Tanzania. World Dev. 2022, 153, 105827. [Google Scholar] [CrossRef]
  44. Bauer, T.; de Jong, W.; Ingram, V.; Arts, B.; Pacheco, P. Thriving in turbulent times: Livelihood resilience and vulnerability assessment of Bolivian Indigenous Forest households. Land Use Policy 2022, 119, 106146. [Google Scholar] [CrossRef]
  45. Prieto, A.V.; García-Estévez, J.; Ariza, J.F. On the relationship between mining and rural poverty: Evidence for Colombia. Resour. Policy 2022, 75, 102443. [Google Scholar] [CrossRef]
  46. Burguillo, M.; Barisone, M.; Juez-Martel, P. Which cooking and heating fuels are more likely to be used in energy-poor households? Exploring energy and fuel poverty in Argentina. Energy Res. Soc. Sci. 2022, 87, 102481. [Google Scholar] [CrossRef]
  47. Shupler, M.; Baame, M.; Nix, E.; Tawiah, T.; Lorenzetti, F.; Saah, J.; Anderson de Cuevas, R.; Sang, E.; Puzzolo, E.; Mangeni, J.; et al. Multiple aspects of energy poverty are associated with lower mental health-related quality of life: A modeling study in three peri-urban African communities. SSM Ment. Health 2022, 2, 100103. [Google Scholar] [CrossRef]
  48. Zhang, L.; Xiao, Y.; Wu, Q.; Li, J. Will the use of solid fuels reduce the life satisfaction of rural residents—Evidence from China. Energy Sustain. Dev. 2022, 68, 94–102. [Google Scholar] [CrossRef]
  49. Eisfeld, K.; Seebauer, S. The energy austerity pitfall: Linking hidden energy poverty with self-restriction in household use in Austria. Energy Res. Soc. Sci. 2022, 84, 102427. [Google Scholar] [CrossRef]
  50. Turnbull, K.L.P.; Mateus, D.M.C.; LoCasale-Crouch, J.; Coolman, F.L.; Hirt, S.E.; Okezie, E. Family routines and practices that support the school readiness of young children living in poverty. Early Child. Res. Q. 2022, 58, 1–13. [Google Scholar] [CrossRef]
  51. Karmaker, S.C.; Sen, K.K.; Singha, B.; Hosan, S.; Chapman, A.J.; Saha, B.B. The mediating effect of energy poverty on child development: Empirical evidence from energy poor countries. Energy 2022, 243, 123093. [Google Scholar] [CrossRef]
  52. Becker, T.E.; Cote, J.A. Additive and multiplicative method effects in applied psychological research: An empirical assessment of three models. J. Manag. 1994, 20, 625–641. [Google Scholar] [CrossRef]
  53. Anderson, J.C.; Gerbing, D.W. Structural equation modeling in practice: A review and recommended two-step approach. Psychol. Bull. 1988, 103, 411. [Google Scholar] [CrossRef]
  54. Hair, J.F., Jr.; Hult, G.T.M.; Ringle, C.M.; Sarstedt, M. A Primer on Partial Least Squares Structural Equation Modeling [PLS-SEM]; Sage Publications: Thousand Oaks, CA, USA, 2021. [Google Scholar]
  55. Tóth-Király, I.; Bőthe, B.; Orosz, G. Exploratory structural equation modeling analysis of the Self-Compassion Scale. Mindfulness 2017, 8, 881–892. [Google Scholar] [CrossRef]
Figure 1. The conceptual framework of factor analysis for poverty alleviation in Thailand.
Sustainability 16 04213 g001
Figure 2. Hypothesis model for a structural equation model.
Sustainability 16 04213 g002
Figure 3. Observed variables diagram of sustainable livelihood potential development in the case of Thailand.
Sustainability 16 04213 g003
Figure 4. The five-dimensional capital information obtained from the calculation.
Sustainability 16 04213 g004
Figure 5. Data for the sample population separated by age and sex.
Sustainability 16 04213 g005
Figure 6. Results calculated for the observed human capital variables.
Sustainability 16 04213 g006
Figure 7. Results calculated for the observed physical capital variables.
Sustainability 16 04213 g007
Figure 8. Results calculated for the observed financial capital variables.
Sustainability 16 04213 g008
Figure 9. Results calculated for the observed natural capital variables.
Sustainability 16 04213 g009
Figure 10. Results calculated for the observed social capital variables.
Sustainability 16 04213 g010
Figure 11. The map symbols for the results of spatial analysis obtained using ArcGIS Pro version 3.1.
Sustainability 16 04213 g011
Figure 12. Results of spatial data analysis for the sustainable livelihood dimensions.
Sustainability 16 04213 g012
Figure 13. Model for measuring the components of human capital.
Sustainability 16 04213 g013
Figure 14. Model for measuring the components of physical capital.
Sustainability 16 04213 g014
Figure 15. Model for measuring the components of financial capital.
Sustainability 16 04213 g015
Figure 16. Model for measuring the components of natural capital.
Sustainability 16 04213 g016
Figure 17. Model for measuring the components of social capital.
Sustainability 16 04213 g017
Figure 18. SEM model of sustainable living framework.
Sustainability 16 04213 g018
Table 1. Poverty level divided into four groups using the mean value of the indicator.
GroupSymbolDescription Mean   ( x ¯ )
Group 1RedThe households with the most poverty.1.00–1.75
Group 2OrangeThe households with relatively low income.1.76–2.50
Group 3YellowThe households that are at risk of being impoverished.2.51–3.25
Group 4GreenThe households that have relatively good lives.3.26–4.00.
Table 2. The poverty level of the livelihoods of 17,536 households divided into four groups.
Capital of SLF.Group 1Group 2Group 3Group 4
C1: Human capital 95 9997 7407 37
C2: Physical capital 187 13,772 3577 0
C3: Financial capital 5205 7614 4068 649
C4: Natural capital 4378 12,962 196 0
C5: Social capital 8450 7509 1557 20
Table 3. The criteria for analyzing and grouping the 17,536 households into four groups.
Capital of SLF.Variable Index           Mean   ( x ¯ ) Group 1Group 2Group 3Group 4
Sustainable
Livelihood Framework
(C)
C1 = Human Capital2.463959997740737
C2 = Physical Capital2.31818713,77235770
C3 = Financial Capital2.028520576144068649
C4 = Natural Capital1.887437812,9621960
C5 = Social Capital1.79784507509155720
Human Capital
(C1)
C11 = Highest education2.5911085654480051902
C12 = Educational status1.32414,91225011203
C13 = Careers and professional skills2.132015,5111324701
C14 = Average monthly income2.5331332707871781948
C15 = Health3.75257263134115,875
C16 = Government welfare1.910705674202933127
Physical Capital
(C2)
C21 = Home ownership2.793515259614,4250
C22 = Housing conditions1.9808224142778850
C23 = Hygiene in the home3.036282107198813,413
C24 = Electrical system/waterwork/equipment2.084134715,4607290
C25 = Roads/public paths into residential area2.263612922638994150
C26 = Communication channel, speed, accuracy2.885360206614,331779
C27 = Information sources related to
     livelihood and income generation
2.266609513109496635
C28 = Using digital technology to benefits
     living and generating income
1.000609513109496635
Financial Capital
(C3)
C31 = Average annual household income2.5338570008966
C32 = Average annual household expense1.43514,988002548
C33 = Savings2.13410,905006631
C34 = Debt1.77310,509070270
C35 = Property for occupation1.63413,65705023377
Natural Capital
(C4)
C41 = Stability of workplace1.11115,930138684136
C42 = Using water for agriculture1.21215,49136416810
C43 = Workplace problems3.2623438266208111,751
C44 = Roads/public paths into workplace 2.263612922638994150
C45 = Using natural resources for sustenance1.607688010,65600
C46 = Using natural resources to generate income1.941152915,7530254
C47 = Housing in natural disaster area1.752434113,19500
C48 = Workplace in natural disaster area2.370133312,258573888
Social Capital
(C5)
C51 = Participating in group activities1.856933344267413036
C52 = Participating in community activities1.856933344267413036
C53 = Helping each other when in trouble1.37513,0662367208716
C54 = Rules or regulations for a community1.9318098253869000
C55 = Compliance with rules, regulations,
     and agreements for the community.
3.29041480013,388
C56 = Community conflict management1.4878983855300
C57 = Having a knowledgeable person for
     development in the community
1.72112,8514594793747
C58 = Using a knowledgeable person
     to solve problems in the community
1.00017,536000
C59 = Having the necessary experience to solve
     problems
1.8238429567415241909
C510 = Having the necessary experience to
     participate in community management
1.8929509275729222348
Table 4. Statistical analysis of the Sustainable Livelihood Framework.
No.ProvincesSample Size
(Households)
Mean   ( x ¯ ) : The Level of Livelihood Capital (1–4)
Human CapitalPhysical CapitalFinancial CapitalNatural CapitalSocial CapitalAverage
1Chai Nat5882.542.412.061.911.702.12
2Nakhon Ratchasima7252.612.382.051.891.702.13
3Kalasin7292.412.301.751.931.952.07
4Mae Hong Son7382.412.201.801.592.182.04
5Narathiwat7692.472.382.111.961.722.13
6Surin8442.292.082.101.671.651.96
7Amnat Charoen8652.292.102.131.451.561.91
8Phatthalung8682.652.432.221.991.762.21
9Sisaket8832.362.202.041.881.722.04
10Pattani8862.432.341.971.891.452.02
11Sakon Nakhon9232.392.192.131.891.682.05
12Lampang9302.552.441.882.122.052.21
13Yala9522.572.451.822.181.832.17
14Roi Et9622.582.452.222.022.122.28
15Buriram9652.502.432.192.032.082.24
16Loei9682.482.422.061.871.822.13
17Mukdahan9832.342.101.991.721.531.94
18Yasothon9852.302.132.001.771.571.96
19Phitsanulok9932.492.451.942.091.982.19
20Ubon Ratchathani9802.612.462.061.801.872.16
Overall17,5362.462.322.031.891.802.10
Table 5. Correlation coefficients and standard deviations of the observed human capital variables.
VariableC11C13C15C16
C111
C130.2311
C150.1100.0051
C16−0.024−0.063−0.0121
Standard deviation0.5960.3870.4110.538
Table 6. Results of confirmatory component analysis of human capital obtained using the Mplus program.
Observed VariableCoefficient (β)Standard Error (S.E.)R-Squared (R2)
C110.2890.0470.084
C130.8000.1290.639
C150.0070.0100.000
C16−0.0790.0150.006
Chi-square = 2.418, df = 1, p-value = 0.120, CFI = 0.999, TLI = 0.993, RMSEA = 0.01, SRMR = 0.00.
Table 7. Correlation coefficients and standard deviations of the observed physical capital variables.
VariableC21C22C23C24C25C26
C211
C22−0.1061
C230.062−0.1581
C240.148−0.0740.0861
C250.016−0.0920.1110.0811
C26−0.0140.0060.032−0.0130.0431
Standard deviation0.4720.9580.4390.2210.7730.481
Table 8. Results of confirmatory component analysis of physical capital obtained using the Mplus program.
Observed VariableCoefficient (β)Standard Error (S.E.)R-Squared (R2)
C210.1270.0160.016
C22−0.3600.0170.130
C230.4420.0200.195
C240.1990.0140.040
C250.2480.0140.061
C26−0.0290.0190.001
Chi-square = 8.979, df = 4, p-value = 0.06, CFI = 0.997, TLI = 0.989, RMSEA = 0.01, SRMR = 0.01.
Table 9. Correlation coefficients and standard deviations of the observed financial capital variables.
VariableC31C33C34C35
C311
C330.0881
C340.0490.0021
C350.1600.0540.1071
Standard deviation1.5001.4550.6241.202
Table 10. Results of confirmatory component analysis of financial capital obtained using the Mplus program.
Observed VariableCoefficient (β)Standard Error (S.E.)R-Squared (R2)
C310.2620.0230.069
C330.0850.0140.007
C340.1760.0160.031
C350.6120.0510.374
Chi-square = 3.288, df = 1, p-value = 0.069, CFI = 0.997, TLI = 0.984, RMSEA = 0.01, SRMR = 0.00.
Table 11. Correlation coefficients and standard deviations of the observed natural capital variables.
VariableC42C43C44C46
C421
C430.0811
C440.1360.3861
C460.0240.1170.1781
Standard deviation0.5991.1830.7730.376
Table 12. Results of confirmatory component analysis of natural capital obtained using the Mplus program.
Observed VariableCoefficient (β)Standard Error (S.E.)R-Squared (R2)
C420.1700.0090.029
C430.4910.0140.241
C440.7870.0200.619
C460.2270.0100.052
Chi-square = 5.525, df = 2, p-value = 0.063, CFI = 0.999, TLI = 0.997, RMSEA = 0.01, SRMR = 0.00.
Table 13. Correlation coefficients and standard deviations of the observed social capital variables.
VariableC53C55C56C57C59C510
C531
C550.1541
C560.1530.1671
C570.0730.0710.0831
C590.2420.0980.1580.3101
C5100.2230.0980.1430.2910.6741
Standard deviation0.6911.2750.5001.2400.9861.110
Table 14. Results of confirmatory component analysis of social capital obtained using the Mplus program.
Observed VariableCoefficient (β)Standard Error (S.E.)R-Squared (R2)
C530.3290.0150.108
C550.1410.0100.020
C560.2110.0110.045
C570.4250.0160.181
C590.7320.0270.535
C5100.6810.0250.464
Chi-square = 7.176, df = 4, p-value = 0.126, CFI = 1.000, TLI = 0.999, RMSEA = 0.01, SRMR = 0.00.
Table 15. Results of SLF Structural Equation Modeling (SEM) using the Mplus program.
Latent Variable
Observed Variable
C1C2C3C4C5R2
βS.E.βS.E.βS.E.βS.E.βS.E.
C110.8730.018 0.762
C130.2610.009 0.068
C150.0160.012 0.000
C16−0.0250.008 0.001
C21 0.0880.016 0.008
C22 −0.3880.016 0.150
C23 0.4220.018 0.178
C24 0.1560.013 0.024
C26 0.0430.013 0.002
C31 0.1070.014 0.011
C33 −0.0860.014 0.007
C34 0.2620.027 0.068
C35 0.4800.050 0.230
C42 0.1540.009 0.024
C43 0.4980.014 0.248
C46 0.2320.010 0.054
C53 0.2850.0080.081
C55 0.1230.0080.015
C56 0.1820.0080.033
C57 0.3590.0070.129
C59 0.8410.0050.707
C510 0.8010.0050.642
Table 16. Results of Sustainable Livelihood Framework Structural Equation Modeling (SEM).
Observed VariableCoefficient (β)Standard Error (S.E.)R-Squared (R2)
C10.8190.0180.670
C20.3730.0170.139
C30.8110.0830.658
C40.9130.0250.833
C50.6490.0080.421
Chi-square = 1264.980, df = 148, p-value = 0.000, CFI = 0.968, TLI = 0.950, RMSEA = 0.02, SRMR = 0.02.
Disclaimer/Publisher’s Note: The statements, opinions and data contained in all publications are solely those of the individual author(s) and contributor(s) and not of MDPI and/or the editor(s). MDPI and/or the editor(s) disclaim responsibility for any injury to people or property resulting from any ideas, methods, instructions or products referred to in the content.

