Article

Application of Irrigation Management and Water-Lifting Technologies to Enhance Fodder Productivity in Smallholder Farming Communities: A Case Study in Robit Bata, Ethiopia

1
International Livestock Research Institute (ILRI), Addis Ababa P.O. Box 5689, Ethiopia
2
Bahir Dar Institute of Technology, Bahir Dar University, Bahir Dar, P.O. Box 26, Ethiopia
3
International Center for Agricultural Research in the Dry Areas (ICARDA), Addis Ababa P.O. Box 5689, Ethiopia
4
International Water Management Institute (IWMI), Addis Ababa P.O. Box 5689, Ethiopia
5
International Water Management Institute (IWMI), Accra A015, Ghana
*
Author to whom correspondence should be addressed.
Agronomy 2024, 14(5), 1064; https://doi.org/10.3390/agronomy14051064
Submission received: 26 March 2024 / Revised: 5 May 2024 / Accepted: 7 May 2024 / Published: 17 May 2024
(This article belongs to the Section Water Use and Irrigation)

Abstract

:
Small-scale cultivation of irrigated fodder is emerging as a vital production system in mixed farming communities. Efficient water management plays a key role in enhancing forage production, especially in the face of changing climate. A field-scale experimental study was conducted in Robit Bata kebele, Ethiopia, with the following objectives: (1) to examine the effects of conventional farmers’ irrigation scheduling versus climate-based irrigation scheduling; and (2) to assess the influence of water-lifting technologies (manual pulley and solar Majipump) on dry matter yield (DMY), water productivity (WP), irrigation labor productivity (ILP), and water productivity in terms of crude protein and metabolizable energy (WP.CP and WP.ME) of Napier grass. The experiment used 10 farmers’ plots each with a size of 100 m2. Half of the plots were treated using farmers’ scheduling while the other half were treated using climate-based irrigation scheduling. Monitoring of irrigation water use and crop yield took place over two irrigation seasons from November 2020 to June 2021. Results showed there was an interaction effect of irrigation management (p = 0.019) and water-lifting technologies (p = 0.016) with season on DMY. The highest DMY occurred in the first irrigation season with climate-based scheduling and solar Majipump use. The interaction effect of irrigation management and season affected WP (p = 0.047). Climate-based scheduling had a higher WP in the first season, while farmers’ scheduling had a higher WP during the second season. On average, the solar Majipump outperformed the pulley, achieving 5 kg m−3 WP compared to the pulley’s 4 kg m−3 (p = 0.018). Emphasizing the seasonal impact, it is recommended to promote full irrigation (climate-based) in the first season for maximum yield and WP. Conversely, in the second season, advocating only deficit irrigation is advised due to water scarcity and sustainability concerns. Statistical parity in DMY and lower WP with full irrigation in the second season supports this recommendation, addressing the challenge of optimizing water use in the context of a changing climate and ensuring sustainable smallholder agriculture practices. Therefore, implementing appropriate irrigation management alongside efficient water-lifting technologies holds the potential to enhance fodder productivity and bolster smallholder farmers’ livelihoods. Future research should explore the comparative benefits of irrigated fodder versus other crops and the overall advantages of investing in irrigated fodder over vegetables.

1. Introduction

Despite previous commendable efforts to alleviate food insecurity, the number of populations affected has risen significantly due to the compounding effects of pandemics and conflicts [1], impacting the food supply chain within the agricultural sector [2] and limiting access to agricultural inputs and technologies, particularly in remote rural areas [3]. This exacerbates crop failures and food shortages, particularly in Africa [4]. In response, sustainable intensification of crop and livestock farming systems has emerged as a potential solution to address food and nutritional security challenges [5]. One approach is by giving attention to the livestock farming system, regarded as a promising approach to ensuring food and livelihood security under climate change and population growth [6]. Investments in livestock farming and forage production have shown promise in boosting yield and income for smallholders, contributing to food security [7,8,9].
Integrating forage production with farmer-led, small-scale irrigation (SSI) is recognized as a chosen strategy for mitigating food insecurity and climate adaptation [10]. Ethiopia, where smallholder farmers contribute over 90% of the country’s total agricultural output and cultivate nearly 95% of the available cropped land, relies heavily on rain-fed agriculture [11]. In this context, small-scale irrigation holds significant promise for increasing agricultural productivity and fostering economic development to alleviate poverty effectively [12]. However, traditional irrigation practices often lack appropriate technology assistance, leading to inefficient water management [13]. Improving irrigation schedules and technologies is crucial to addressing these challenges [14].
There are a few studies on how agricultural water management for vegetable crops during the dry period can enhance productivity. In northwestern Ethiopia, use of climate-based irrigation scheduling enhanced the yield and irrigation water use efficiency of onion and garlic, compared to traditional farmers’ irrigation scheduling [15]. Another study on the climate-based irrigation method showed improved yield and water productivity of maize compared to conventional farmers’ scheduling [16].
While previous studies have primarily addressed water management for vegetable and cereal crops, an important aspect of livestock and a crucial agricultural practice in Ethiopia has been overlooked. Livestock feeding primarily relies on crop residues (43%) and natural pasture (35%), with improved forage production constituting a minimal share (0.2%) [17]. In the Ethiopian highlands, where a shortage of high-quality fodder is a pressing issue, Napier or elephant grass (Cenchrus purpureus) emerges as a promising forage species [18]. It is a preferred forage due to its advantageous characteristics, including its endurance to drought, adaptability to a variety of soil conditions, and high photosynthetic and water-use efficiency [19]. It is among the most important tropical forage grasses and is widely used as a cut-and-carry feed, mainly through rain-fed agriculture [20]. Napier grass is also superior to other tropical grasses in terms of dry-season growth and biomass yield [21].
Livestock feed sourcing based only on rain-fed agriculture is no longer viable. Therefore, there is an urgent need to focus on forage production during dry periods through efficient and sustainable irrigation use. However, there is a lack of widespread adoption of practices by farmers to cultivate fodder during the dry season using irrigation. Napier grass, with proper management, has the potential to supply continuous green forage throughout the year, making it particularly suitable for intensive small-scale farming systems in Ethiopia [22]. Achieving high-quality and quantity Napier grass production requires optimal agronomic practices, including irrigation during dry periods, fertilizer application, cutting management, and pest control [23].
While some attempts to incorporate irrigation into Napier grass production have been made, it has been primarily in experimental plots [22]. The importance of testing its water productivity with smallholder farmers lies in establishing empirical evidence and quantifying its performance under specific irrigation conditions and using technologies. Therefore, studying the dry matter yield and water productivity of Napier grass under different water management practices and technologies on the farmers’ fields is crucial for addressing water scarcity challenges, promoting sustainable agriculture, and ensuring resilience and productivity in the face of a changing climate. The findings of such studies offer valuable insights for making informed decisions regarding the adoption of agricultural water management and water-lifting technologies in livestock agricultural systems. These insights can influence resource allocation, labor management, and contribute to fostering sustainable and efficient fodder production. The information generated from such study serves as input for comparing investments between fodder and other crops, aiding stakeholders in optimizing agricultural practices based on their specific needs and priorities.
The objectives of this research are to: (1) evaluate the effect of irrigation water management treatments on the dry matter yield and water productivity of Napier grass; and (2) evaluate the effect of different water-lifting technologies (manual pulleys and solar Majipumps) on the dry matter yield and water productivity of Napier grass and irrigation labor productivity, under smallholder farm settings in the Ethiopian highlands.

2. Materials and Methods

2.1. Description of the Study Area

This experiment was conducted in the Yinebo and Robit watersheds (Figure 1) of Robit Bata kebele (ward, smallest administrative unit), located in the Bahir Dar Zuriya woreda (district), Amhara regional state, Ethiopia. The Robit Bata kebele is located 20 km north of Bahir Dar city, the capital city of the Amhara regional state. The selection of this area was because it has been an experimental site by the International Livestock Research Institute (ILRI) and Bahir Dar University (BDU) since 2015 to promote fodder production by irrigation during dry periods. Smallholder farmers in the kebele started growing Napier grass by irrigation from shallow groundwater using pulleys and solar pumps. This facilitated in conducting our experiment with smallholder farmers.
The climate is subtropical (Woina Dega), with a mean annual rainfall of 1444 mm (based on data from 2000 to 2019). Rainfall distribution in the area is characterized by a single rainy season, which lasts from June to September, accounting for 82% of the total annual rainfall. The highest rainfall occurs during July [24]. The remaining eight months are dry periods. Air temperature ranges between 8.1 °C and 30.3 °C based on 2000 to 2019 data.
Rural livelihoods are based on mixed crop farming, primarily rain-fed agriculture, and livestock husbandry. During the rainy season, the main crops cultivated are maize (Zea mays), finger millet (Eleusine coracana), tef (Eragrostis tef), and barley (Hordeum vulgare); also, small-scale irrigation is increasing, with 13% of the croplands under vegetable cultivation during the dry season from October to May [25]. The most common irrigated crops are tomato, onion, potato, cabbage, pepper, and garlic [26]. Since 2015, smallholder farmers started irrigating fodder production [27]. The main livestock feeds are crop residues and naturally occurring grass.

2.2. Experimental Design and Treatments

Three main factors were considered in this experiment. The first factor compared irrigation scheduling using reference evapotranspiration (ETO) based on climate and irrigation scheduling managed by farmers’ practices. The second factor assessed the impact of different water-lifting technologies, specifically solar Majipumps and manual pulleys. The third factor took into account irrigation season. Ten farmers were selected for the experiment, with five using the solar Majipumps and five using manual pulleys as water-lifting technologies. The selection criteria included farmers’ willingness to participate in the research, availability of a 100 m2 plot for Napier grass production, access to shallow groundwater wells, and ownership of either a pulley or a solar Majipump as a water-lifting technology. Each farmer prepared two plots, each measuring 50 m2 and planted Napier grass (Variety: Zehone-02 (ILRI accession 16791)) (Figure 2) sourced from the ILRI forage gene bank, Addis Ababa, Ethiopia. The two plots were randomly assigned to either farmers’ irrigation scheduling or climate-based irrigation scheduling.
The study used several response variables, including dry matter yield (DMY), water productivity (WP), water productivity in terms of crude protein (WP.CP), and metabolizable energy (WP.ME). For water-lifting technologies, additional response variables included soil moisture (SM) for climate-based scheduling and irrigation labor productivity (ILP) for farmers’ scheduling. Soil moisture was measured to assess the impact of different conveyance systems used in water-lifting technologies. It is worth noting that soil moisture was not considered as a responsible variable for farmers’ scheduling due to the variations in dates and rates at which farmers applied irrigation water.

2.2.1. Description of Irrigation Treatments

The approach to farmers’ irrigation practice involved farmers making irrigation decisions based on their own experience. In this method, farmers independently decided the amount, date, and frequency of irrigation, with records kept of the dates and amount applied. In contrast, climate-based irrigation followed a weekly schedule based on historical climate data, where the amount of irrigation was determined by actual crop evapotranspiration. Actual crop evapotranspiration (ETC) was calculated as a product of crop coefficient (Kc) and reference evapotranspiration. Irrigation was scheduled at 7-day intervals [28]. To avoid any runoff following irrigation, all sides of each plot were blocked by soil bunds. All other management practices, including weeding and manure application, were maintained the same across all plots. Inorganic fertilizer was not utilized. To ensure the determined amount of irrigation water was applied for the climate-based irrigation scheduling, specific local people were hired as laborers.
In the study site, dry-season irrigation production was practiced twice a year depending on water level and recharge. This study was conducted over two irrigation seasons for the year 2020/2021. The first irrigation season lasted from 20 November 2020 to 8 March 2021 while the second irrigation season lasted from 8 March 2021 to 3 June 2021. The inclusion of irrigation season as a factor in this study aimed to assess whether water availability influences farmers’ irrigation scheduling and productivity. During the first irrigation season, groundwater levels were shallower (average depth at the start of the irrigation season was found to be 4 m) while they were depleted in the second season, reaching 8 m depth on average [29]. In addition, the first irrigation period typically experienced no rainfall whereas some rainfall occurred in the second period.

2.2.2. Irrigation Water-Lifting Technology Treatments

Two water-lifting technologies, namely the manual pulley and the solar Majipump, were used to irrigate the plots. The manual pulley facilitated lifting water from wells, filling a watering can, and subsequently irrigating the plots. In cases where the groundwater level was insufficient for irrigation, a barrel containing stored water was used. The farmers then filled the watering can from the barrel to irrigate their plots. The solar Majipump used in this study was a submersible brushless DC motor solar Majipump (MP200). The pump weighs 1.5 kg, and can lift water to a 10 m discharge head using an 80 W (12 VDC) panel. The solar panel used was a monocrystalline 150 W rigid panel measuring 1.48 m by 0.67 m, with a total mass of 10.22 kg. Further details about the MP200 solar Majipump can be found in [30].
In addition to the solar pump, farmers were provided with a 1000 L water tank and a hose to irrigate their plots. The solar Majipump was therefore used to first fill their tanker, which was elevated to 1.5 m, to the required water level. Once sufficient water was collected, they used the hose to irrigate their plot. To assess whether water availability influenced farmers’ irrigation scheduling, groundwater levels were measured twice a week throughout the experiment. Water level measurement records were conducted in the morning before farmers withdrew any water from the shallow wells. The depth of the shallow water wells in this experiment varied from 8 m to 17.5 m.

2.3. Soil Physiochemical Properties

To assess potential variability between experimental plots, soil samples were taken before the implementation of the treatment intervention. Sampling included two depths: 0–30 cm and 30–60 cm [15]. Soil samples from different locations within each depth and plot were collected and combined for subsequent analysis. Soil laboratory analysis was conducted at Amhara Design and Supervision Works Enterprise (ADSWE) to determine the various physiochemical properties, including texture, pH, organic matter (OM), organic carbon (OC), total nitrogen (TN), electrical conductivity (EC), available phosphorous (Av. P), field capacity (FC) and permanent wilting point (PWP).
In the laboratory, soil texture was determined using the hydrometer method [31]. Before the hydrometer analysis, air-dried soil samples were gently crushed and sieved through a 2 mm mesh to remove gravel and plant fragments. Sodium hexametaphosphate dispersion was used to minimize flocculation and facilitate accurate separation of soil particles. Hydrometer readings were conducted at specified intervals following the instrument’s recommended procedure. Temperature correction ensured accurate particle size distribution, calculated based on formulae incorporating readings and correction factors. Soil classification employed the USDA soil texture triangle.
The water content at field capacity (FC) (−0.33 bar) and permanent wilting point (PWP) (−15 bar) was determined using a pressure (porous) plate apparatus (Eijkelkamp, Agrisearch equipment, The Netherlands) following the method described by Cassel and Nielsen [32]. Soil pH was measured electrometrically using a 1:2.5 soil–water suspension stirred for 30 min. A calibrated pH meter (PHS-3E, Xianxian Rushi Technology Co., Ltd., Cangzhou, China) with reference buffer solutions at the measurement temperature ensured accurate reading of the suspension pH [33].
Available phosphorus was obtained from the extraction of acid-soluble and adsorbed phosphorus with the fluoride-containing solution according to the Bray I test (acid soil) [34]. Extraction used a specific volume of fluoride-containing solution with subsequent phosphorus concentration measurement at a designated wavelength in a UV-5100B spectrophotometer (Shanghai Metash Instruments Co., Ltd., Shanghai, China). A reference standard calibration curve determined Av. P concentration, which was converted to its content in the soil. Total nitrogen was determined using the Kjeldahl method [33]. Digestion with a specific catalyst and acid mixture in the mentioned method allowed for ammonia release, which was quantified after distillation and titration using an indicator.
An electrical conductivity bridge was used to determine the EC (dS m−1) of a 60 min-stirred (stirred at 15 revolutions per minute) suspended soil solution (1:5 H2O ratio). The measurement temperature was recorded, and EC was reported in dS m⁻1. Soil organic carbon (OC) was determined using the Walkley–Black oxidation method [35] with dichromate oxidation (potassium dichromate). Titration with an indicator determined the endpoint, and OC content was calculated from dichromate consumption.

2.4. Crop Water Requirement (CWR) Computation

The amount of irrigation water applied based on the climate was determined through the computation of crop water requirement (CWR). Long-term (2000 to 2019) daily records of rainfall, temperature, humidity, wind speed, solar radiation, and sunshine hours data were obtained from a nearby station (Bahir Dar station) [36] which is around 10 km from the experimental area [25]. These collected data were used to calculate the daily reference evapotranspiration (ETO using the modified Penman–Monteith equation [37] as shown in Equation (1). Additionally, daily rainfall during the experimental period was directly measured using a manual rain gauge installed in the experimental area.
E T O = 0.408 R n G + γ 900 T + 273 u 2 ( e s e a ) + γ ( 1 + 0.34 u 2 )
where: ETO is the reference evapotranspiration (mm/day), Rn is the net radiation, G is the soil heat flux, γ is the psychometric constant, T is the mean daily air temperature (°C) at 2 m height, u2 is the wind speed at 2 m height (ms−1), es and ea are the saturation and actual vapor pressure (kPa), respectively, and Δ is the slope of the relationship between saturation vapor pressure and air temperature.
The reference evapotranspiration (ETO represents the water loss from a cropped field due to evapotranspiration and serves as a basis for determining the crop water requirement. The irrigation water depth was determined using crop evapotranspiration (ETC), which was calculated based on the crop coefficient (KC) and the reference evapotranspiration (ETO) [38], which can be calculated using the equation below
E T C = K C × E T O
where KC is the crop coefficient. The crop coefficient (KC) for this study was taken from Mulugeta [27]. ETC was calculated according to the last twenty years’ climatic data (2000–2019). The application of climate-based irrigation followed a weekly schedule based on the summation of the weekly calculated crop evapotranspiration based on Equation (2).

2.5. Biomass Yield Measurement

To measure biomass yield, forage was harvested and the total fresh biomass was weighed using a balance. After the fresh herbage from each plot was weighed, a 300–1000 g subsample was taken, dried at 60 °C for 48 h, and then reweighed to determine the percentage of dry matter (DM) and to calculate DM yield. The first-round harvest (first irrigation season harvest) was on 8 March 2021. The second-round harvest after the second irrigation season was on 3 June 2021.

2.6. Water Productivity

The water productivity (WP) of forage crops is calculated based on the seasonal or annual dry matter removal and the total amount of water supplied during that period. In this experiment, the total water productivity (WP) was computed by dividing the total dry matter yield by the unit volume of water applied, which includes both irrigation and effective rainfall, as shown in Equation (3).
W P = Y I + P e
where WP is the water productivity (kg/m3), Y is total dry matter yield (kg), I is the amount of irrigation water applied (mm), and Pe is effective rainfall (mm). The United States Department of Agriculture Soil Conservation Service (USDA-SCS) method [37] was used to determine the effective rainfall (Pe) as shown in Equation (4).
Pe = 0.8 × P 25               P > 75   mm / month Pe = 0.6 × P 10             P < 75   mm / month
where Pe and P are effective rainfall and precipitation in mm/month, respectively.

2.7. Soil Moisture

For plots irrigated based on historical climate, soil moisture was measured using a soil moisture profile probe (PR2, Delta-T Devices, Cambridge, UK). An access tube was installed in each experimental plot for this purpose. Soil moisture measurements were conducted to compare the conveyance and distribution efficiency of the water-lifting technologies, assessing how much of the total applied water reached the rooting depth when an equal amount of water was applied. These measurements were taken a day after irrigation, with the soil moisture probe capturing data at depths of 10, 20, 30, 40, 60, and 100 cm. The probe was calibrated using the gravimetric soil moisture on ten different plots, covering a range of water contents from field capacity to wilting point.

2.8. Irrigation Labor Productivity

To compare the water-lifting technologies by irrigation labor productivity, the time required to irrigate a certain amount of water using the two water-lifting technologies was recorded. Hence, the amount of irrigation water applied by each farmer and the time required for irrigation was monitored. To calculate the irrigation labor productivity, irrigation labor hours were converted to labor days required to irrigate (the applied depth of irrigation water by each farmer) one hectare of land (days ha−1). To convert irrigation labor hours to irrigation labor per day, we used a conversion factor of 8 because the average time a laborer is required to work is 8 h per day in the study area. The irrigation labor productivity for each water-lifting technology was calculated based on Hunt [39] as shown in Equation (5).
I r r i g a t i o n   l a b o r   p r o d u c t i v i t y k g   d a y 1 = D r y   m a t t e r   y i e l d   ( k g   h a 1 ) I r r i g a t i o n   l a b o r   t i m e   ( d a y s   h a 1 )

2.9. WP in Terms of Crude Protein and Metabolizable Energy

The efficiency of crops to produce protein per unit of land with a specific amount of water is measured by the water productivity for protein production (WP.CP) [40]. Water productivity for metabolizable energy (ME) production (WP.ME) characterizes the efficiency of crops to produce ME per unit of land with a given amount of water [40]. Forage subsamples from each plot were analyzed for crude protein and metabolizable energy in the animal nutrition laboratory of the International Livestock Research Institute in Addis Ababa. The samples were analyzed by near-infrared reflectance spectroscopy (NIRS) using a FOSS Forage Analyzer 5000 with the software package WinISI II (version 1.5, Intra Soft International, LLC, Port Matilda, PA, USA) and specifically developed calibration equations. The metabolizable energy (ME) of the forage was determined from the gas produced and crude protein as shown in Equation (6), according to Menke [41].
M E = 2.2 + 0.136 × G b + ( 0.0057 × C p )
G b = ( V 24 V 0 G b 0 × 0.2 ) / ( s a m p l e   w t . D M % × 0.01 )
where Gb refers to gas produced, Cp is crude protein (g kg−1), V24 is the 24-h gas produced (i.e., the volume of gas in the syringe after 24 h), V0 is the initial volume of gas in the syringe at 0 h, and Gb0 is gas produced from blank samples.
To compare the WP, in terms of crude protein (CP) and metabolizable energy (ME), among the different treatments, crude protein and metabolizable energy yields were calculated as the product of biomass and CP concentration and ME.
CP yield (kg CP ha−1) = DM (kg ha−1) × CP (g g−1)
ME yield (MJ ha−1) = ME (MJ kg−1) × DM (kg ha−1)
In addition to the calculation of the water productivity in terms of dry biomass yield, the water productivity as a function of crude protein yield and metabolizable energy yield was calculated as follows based on Purcell and Currey [42]:
WP . CP   ( g   m 3 ) = C P   y i e l d   ( g   h a 1 ) T o t a l   w a t e r   r e c i e v e d   b y   t h e   c r o p   ( m 3 h a 1 )
Water productivity (WP) for metabolizable energy (ME)
WP . ME   ( MJ   m 3 ) = M E   y i e l d   ( M J   h a 1 ) T o t a l   w a t e r   r e c i e v e d   b y   t h e   c r o p   ( m 3 h a 1 )

2.10. Statistical Analysis

Before analysis was conducted, the data were checked for normality using a Q–Q plot and the Shapiro–Wilk test. After checking the data for normality, the three-way (and then two-way) interaction effect of irrigation management, water-lifting technologies, and irrigation season on the amount of irrigation water applied, the number of irrigations, DMY, WP, WP.CP, and WP.ME were checked. Analysis of variance (p < 0.05) with the ANOVA packages of the SPSS® statistics software 26.0 (IBM Corporation, Armonk, NY, USA) was employed. The results presented are based on the interaction of the independent variables with the dependent variables. If there was an interaction, the interaction effects are presented. If no interaction was found, then the main effects are presented.

3. Results and Discussion
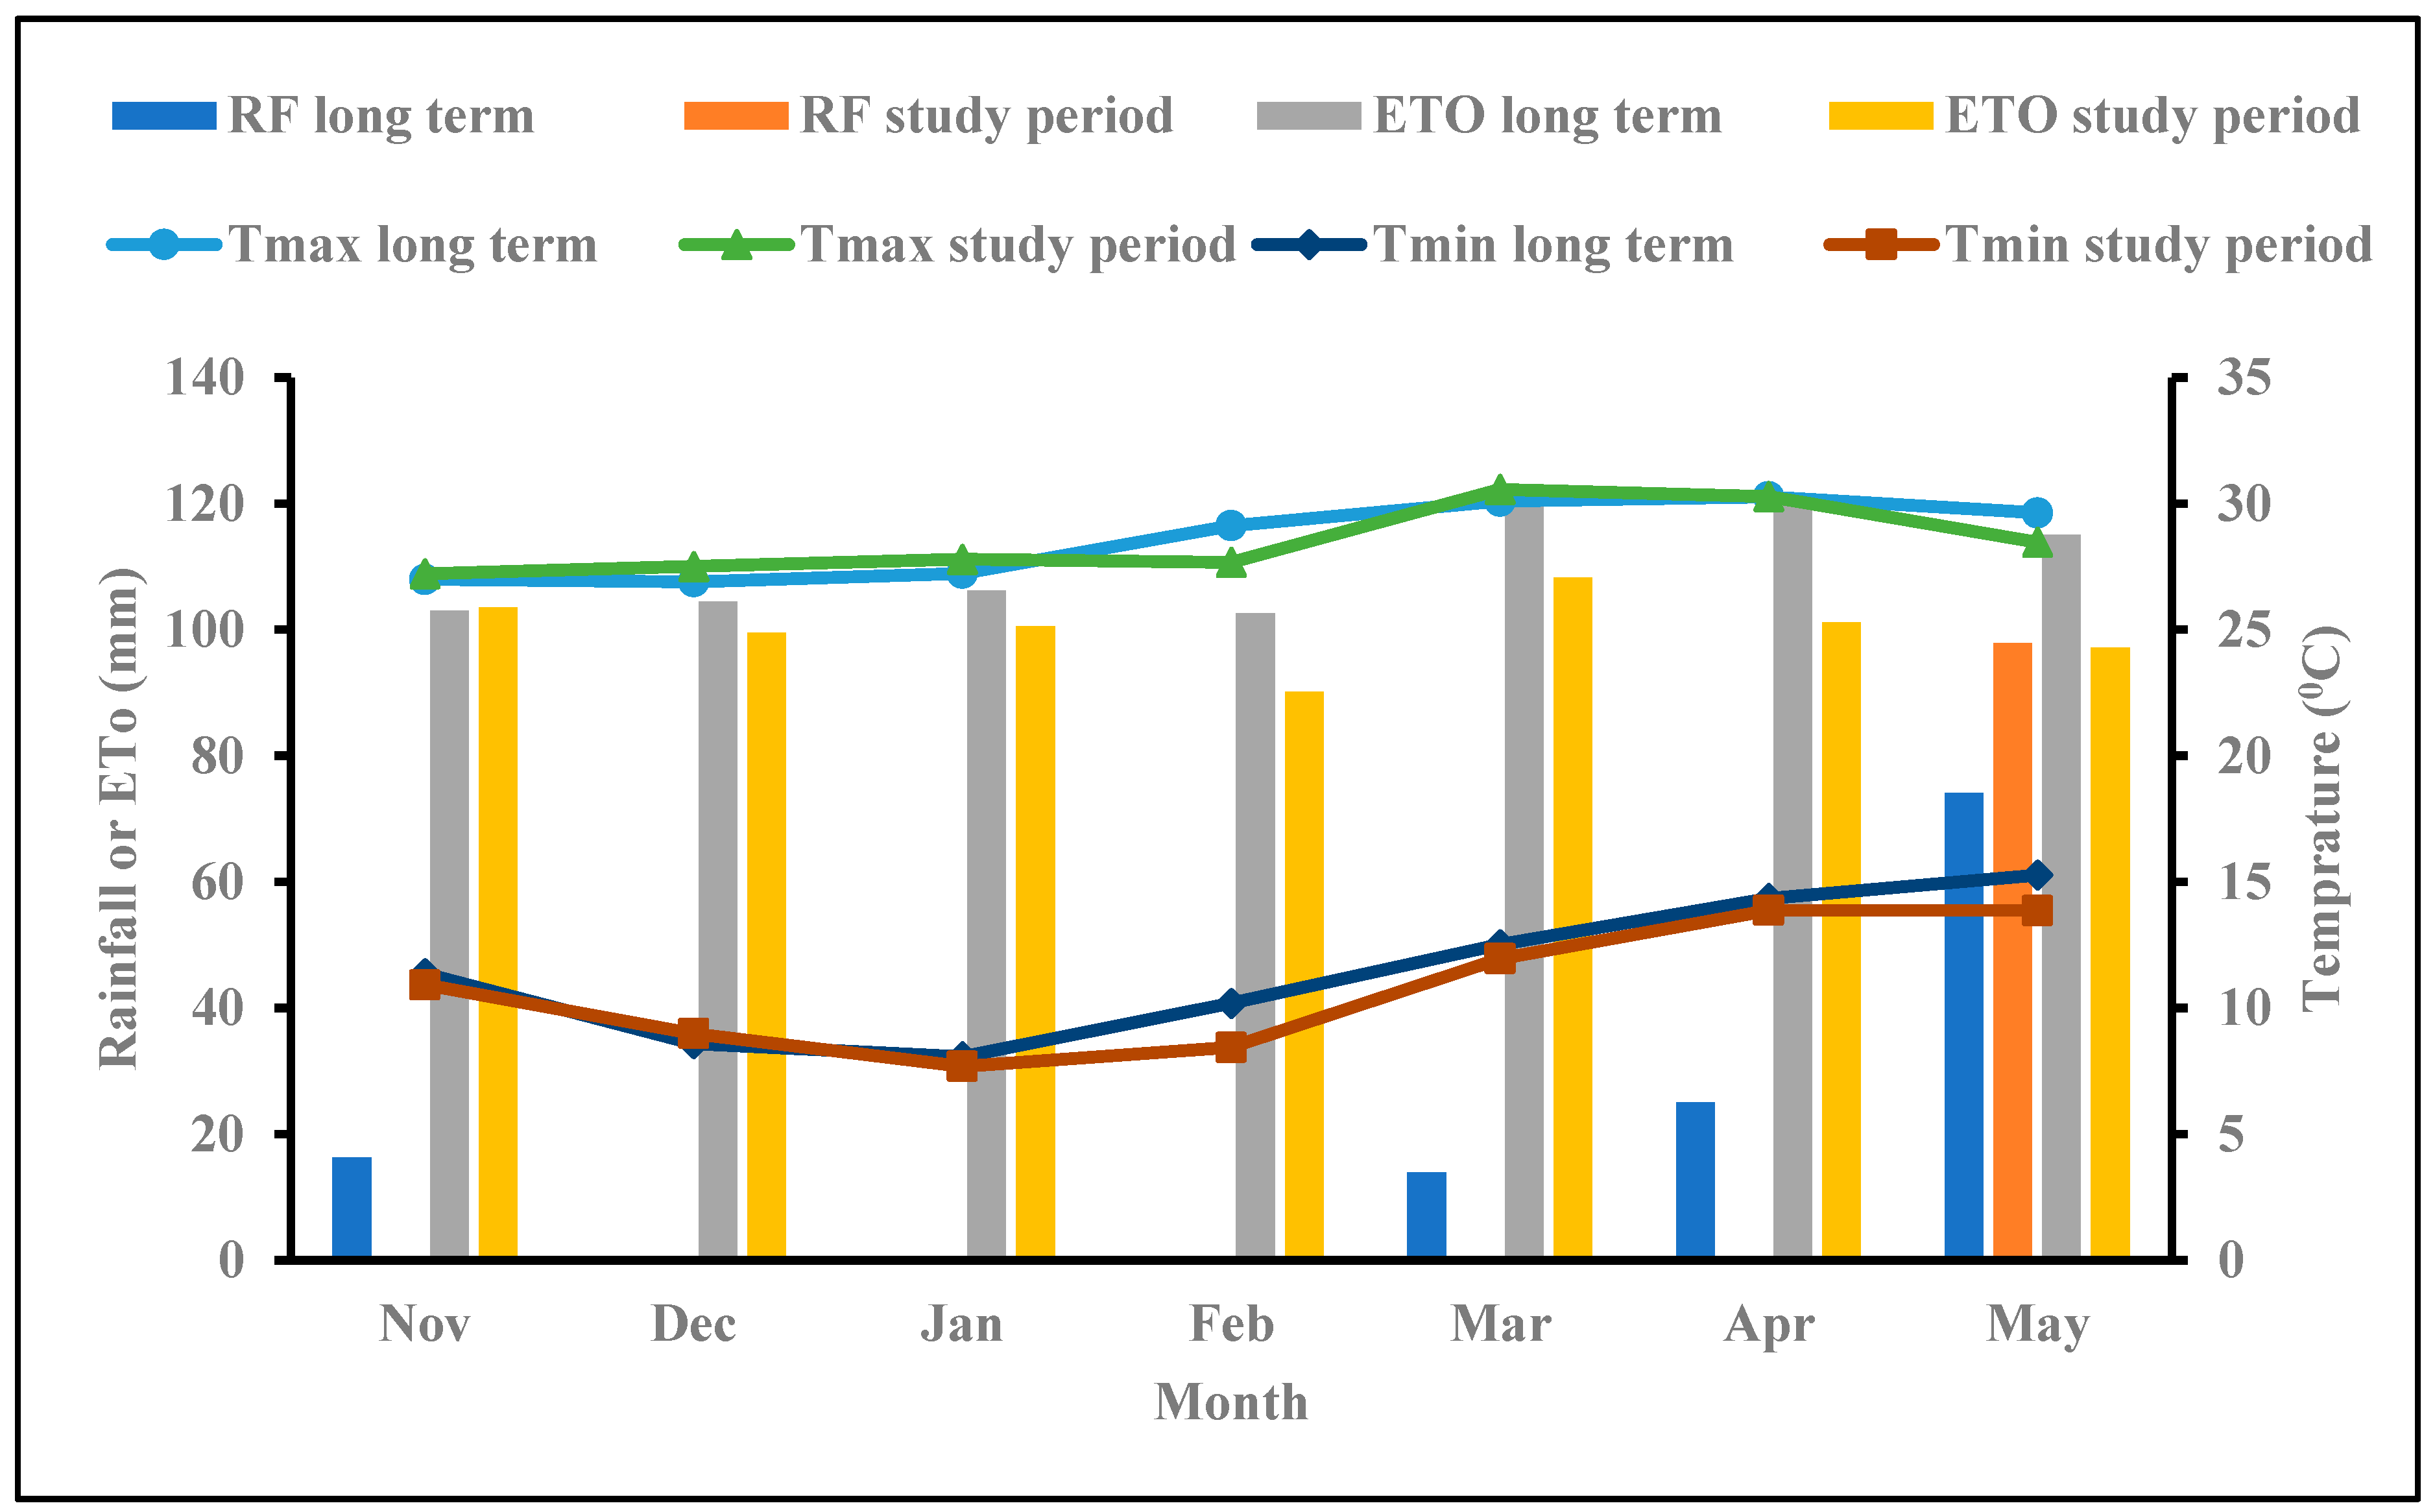
3.1. Climate Data

Over the 20 years from 2000 to 2019, the average monthly minimum temperature recorded during the experimental period (November to May) fluctuated, reaching a minimum of 8.1 °C in January and being a maximum of 15.3 °C in May. Similarly, the mean monthly maximum temperature varied, with a minimum of 24.6 °C in August and a maximum of 30.3 °C in April. The highest mean monthly rainfall during the dry period was observed in May (74 mm), while for the rainy period of the year, the highest rainfall (424.8 mm) was observed in July. The long-term average monthly reference evapotranspiration ranged from a minimum of 103 mm in November to a maximum of 120.7 mm in April (Figure 3) during the dry period of the irrigation experiment. The total reference evapotranspiration from November to May was 700 mm, while the total rainfall was 130 mm, indicating a need for irrigation for crop production during this period.

3.2. Soil Physiochemical Properties

The coefficient of variation (CV) was employed to characterize the variability of soil properties across experimental plots, revealing consistently low variability as indicated by CV values below 91% [43] (Table 1). Consequently, the soil characteristics within the plots are deemed to have minimal impact on treatment evaluations. The predominant soil class in the study site is identified as clay within the 0 to 30 cm depth and heavy clay within the 30 to 60 cm depth.

3.3. Interaction Effects

As presented in Table 2, there was no significant three-way interaction effect of irrigation management (IM), water-lifting technologies (WLT), and irrigation season (denoted as season) for any of the response variables (p > 0.05). A significant interaction effect (p < 0.05) indicates that the effect of one independent variable on dependent variables varies based on the level of the second or third independent variable. If no interaction is found, then only the effect of the main factor is presented in this manuscript. Whenever there is an interaction effect, the presentation is different. For example, in Table 2, the effect of irrigation management on water productivity is dependent on the season. In this case, the interaction effects are presented and factors such as irrigation management are discussed using the results between the different seasons.

3.4. Effect of Irrigation Management, Season, and Water-Lifting Technologies on Irrigation Water Applied and Number of Irrigation

3.4.1. Amount of Irrigation Water Applied (IWA)

The irrigation management had a significant impact (p < 0.001) on the amount of irrigation water applied (Figure S1a in Supplementary Material). Farmers applied 25% less water compared to the climate-based irrigation scheduling. Over the entire irrigation period (after combining the data from the first and second irrigation seasons), the climate-based irrigation plots received on average a total of 738 mm of water, while the farmer-managed plots received a total of 558 mm of irrigation water. In the same area, the same trend of applying less water from its requirement by farmers was observed for other crops. Similarly, farmers applied less water for irrigated garlic (377 mm) compared to time-domain reflectometer-based irrigation (470 mm) and climate-based crop water requirement irrigation (417 mm) in the same location [44]. However, in other locations such as Dangishita, where farmers have less experience with irrigation, more water was applied to farmer-managed plots (548 and 420 mm) than climate-based irrigation plots (520 and 260 mm) for onion and garlic, respectively [15]. These variations in application rates by farmers may be attributed to water availability and their knowledge of irrigation practices.
The type of water-lifting technologies did not exhibit a significant impact on the amount of irrigation water applied (Figure S1b in Supplementary Materials). There was, however, a statistically significant difference (p < 0.001) in the amount of irrigation water applied between the two irrigation seasons (Figure S1c in Supplementary Materials). When averaged over irrigation management and water-lifting technologies, 413 mm of irrigation water was applied for the first irrigation season (November to February) with a coefficient of variation (CV) of 14%. In contrast, 235 mm of water was applied for the second irrigation season with a CV of 17% (March to May). This was because of the occurrence of rainfall during the second season (53 mm of effective rainfall) leading to halted irrigation in May, and the growing season was shorter (81 days) compared to the first irrigation season (108 days). Additionally, the decline of the groundwater level after April may have led to less water application, as more labor to access the water was needed. The amount of water applied is often influenced by factors such as overall water availability, knowledge or experience of the plant’s available soil moisture and crop water requirement, and climatic variations within the irrigation season [45].

3.4.2. Number of Irrigation (Frequency) Applications

There was a significant two-way interaction between irrigation management and water-lifting technologies (p = 0.008) and between irrigation management and irrigation season (p < 0.001) for the number of irrigation applications (Table 2).
Throughout the two experimental seasons, combining the data from both irrigation seasons, the highest number of irrigation water applications occurred for the climate-based irrigation scheduling, regardless of the water-lifting technology. The same amount and number of irrigation applications were followed for the climate-based scheduling using both pulleys and solar Majipumps (Figure S2b), totaling 24 applications. In the farmer-based irrigation treatment, those using a manual pulley applied irrigation water an average of 16 times, while those using a solar Majipump applied water 19 times (Figure S3a). However, this difference was nonsignificant.
In comparison to climate-based scheduling, farmer-based irrigation scheduling led to a smaller number of irrigations (i.e., less frequent) in both seasons (Figure S3b in Supplementary Materials). Climate-based irrigated plots had 15 and 9 irrigations (CV = 0) for the first and second irrigation seasons, respectively, while farmers applied water an average of 10 (CV = 13%) and 8 (CV = 17%) times for the first and the second irrigation seasons, respectively (Figure S2a). The difference between seasons 1 and 2 was significant (Figure S3c in Supplementary Material). In season 2, factors such as the onset of rainfall in May that led to halting irrigation, a declining water level in the shallow groundwater, and a short growing period in season 2 likely led to the less frequent number of irrigations in season 2.

3.5. Effect of Water-Lifting Technologies on Soil Moisture Dynamics

To compare the conveyance and distribution efficiency of the two water-lifting technologies, soil moisture readings were taken using a soil moisture probe for the plots irrigated based on climate data. The volumetric soil moisture content (%) in the plots irrigated using the solar Majipump showed a significant (p < 0.001) increase compared to those irrigated using the pulley (Figure 4 and Figure S4 in the Supplementary Materials). The difference can be attributed to the efficient transport of water from the source to the irrigated plots using the solar Majipump, where minimal water is lost, unlike the plots irrigated using a pulley, which may experience substantial water loss during transportation from the shallow well to the plots using a watering can. On average, the soil moisture content for the plots irrigated with the solar Majipump was 16% higher than that for the plots irrigated using a pulley. The highest soil moisture difference, 21%, was observed at a depth of 100 cm while the lowest difference was at a depth of 20 cm (12%). Notably, for both water-lifting technologies, the soil moisture at the shallowest depth (10 cm) was lower compared to other depths, possibly due to high evaporation loss and the high infiltration capacity of volcanic soil [29].
The time series plot of the volumetric soil water content results shows that the soil moisture had a fluctuating trend, depending on the amount of irrigation water applied, ground cover (leaf area index), climatic conditions (evaporation), and rainfall received (Figure 4). For example, there was a sharp decline in soil moisture between the days from 28 February to 14 March (Figure 4), because the forage was harvested on 8 March 2021, which led to very low ground cover and hence high soil evaporation. In addition, the reduction in irrigation water application after harvest occurred because of a lower crop coefficient (KC).

3.6. Effect of Irrigation Management, Season, and Water-Lifting Technologies on DMY

3.6.1. Effect of Irrigation Water Management and Season on DMY

Table 2 shows significant two-way interactions between irrigation management and irrigation season (p = 0.019) for DMY. The main effect of irrigation management and irrigation season is shown in Figure S5a,b, respectively, in the Supplementary Material.
For the first irrigation season, a significant difference (p = 0.005) was observed in the dry matter yield of Napier grass between the two irrigation scheduling methods. The average dry matter yield of Napier grass for the climate-based scheduled plots during the first irrigation season was 23 t ha−1 while farmer-scheduled plots had an average of 14 t ha−1 (Figure 5a). This substantial difference is mainly due to the variations in the amount of water applied between the two irrigation scheduling methods and the associated water losses and hence the difference in yield response to available soil moisture in the root zone. Similar findings were reported by Spencer et al. [46] in the context of corn yield under different irrigation water management methods compared to conventional irrigation scheduling. Improved yields are noted when irrigation depths closely align with the reference evapotranspiration (ET0) [47]. As mentioned in Section 3.3, the amount of irrigation water applied to farmer-scheduled plots was less than that for climate-based-scheduled plots, leading to a reduction in dry matter yield.
During the second irrigation season, the difference in DMY between the two irrigation management methods was not statistically significant (p = 0.185). The DMY for climate-based irrigated plots was, however, higher (14 t ha−1) compared to plots irrigated according to farmers’ schedules (12 t ha−1). In the second irrigation period, the presence of effective rainfall (53 mm) and the decline of groundwater level (Figure S6) during the experiment likely contributed to the non significant difference between the two methods. In general, a statistically significant (p < 0.001) increase in dry matter yield was observed using climate-based scheduling during the first irrigation season (Figure 5a). This emphasizes the potential promotion of full irrigation during the first irrigation season post rainy period to maximize yield. However, during the subsequent irrigation season (second irrigation season), the dry matter yield from climate-based scheduling was statistically similar to farmers’ scheduling. Consequently, in the second irrigation season, promoting deficit irrigation could be beneficial. This approach is warranted due to water scarcity in the second season, and the local groundwater cannot sustainably support dual-season irrigation [29].
The yield result obtained in this study is generally comparable to or higher than those reported in the literature for both irrigation and rain-fed conditions. For example, in a study conducted in Wondo Genet, Southern Ethiopia, the dry biomass yield of six Napier grass accessions under supplementary irrigation conditions ranged from 11 to 20 t ha−1, a finding very comparable with our results. When compared to reports under rain-fed conditions, the forage DMY in the first season under climate based scheduled plots exceeded the reported range of 10 to 17 t ha−1. On the other hand, the result for both treatments in the second season and yield from farmers scheduled plot in the 1st season are comparable with the reported rainfed range [48].

3.6.2. Effect of Water-Lifting Technologies and Irrigation Season on DMY

A significant (p < 0.016) two-way interaction effect between water-lifting technologies and irrigation season was observed for the DMY of Napier grass (Table 2 and Figure 5b). The main effect of water-lifting technologies on DMY is shown in Figure S5c in the Supplementary Material. Specifically, for the first irrigation season, there was a significant difference (p < 0.008) in the biomass yield of Napier grass between the two water-lifting technologies. The average DMY of Napier grass for pulley users (14 t ha−1) was significantly lower than that of solar Majipump users (22 t ha−1). This difference is attributed to the higher amount of water application and the high-water conveyance and distribution efficiency of the solar Majipumps compared to the pulley. Other researchers have shown that the use of a solar Majipump minimized the labor requirements, incentivizing smallholder farmers to allocate enough water for vegetables, thereby boosting both labor and water productivity [30].
For the climate-based irrigated plots, even though the same amount of water was applied for the two water-lifting technologies, a higher amount of water from the pulley may be lost before reaching the plot, as discussed in Section 3.4. Yield is positively correlated with irrigation application uniformity and efficiency [49]. Farmers using pulleys applied less water compared to farmers using solar Majipumps, and pulley users irrigated less frequently, hence exposing the plant to water stress and reducing biomass. The diminished biomass production and yields for pulley users result from reduced transpiration under water-stressed conditions.
For the second irrigation period, the difference in Napier grass biomass yield between the two water-lifting technologies lacked statistical significance (p = 0.337). Solar Majipump users achieved an average dry matter yield of 14 t ha−1 while pulley users attained 12 t ha−1. The less pronounced difference in dry biomass yield between the two water-lifting technologies can be attributed to the same factors mentioned in other sections, such as rainfall and the drop of the groundwater levels. The groundwater levels vary on average between 8 m in the first season and 14 m in the second irrigation season (Figure S6). Because of the groundwater level drop, in the second irrigation period, the amount of water applied and the number of irrigations between farmers using solar Majipumps and those using pulleys were almost equal, and the solar Majipumps were limited by the available water to lift the required amount of water as it did in the first season.
Similar to irrigation management, the highest dry matter yield was attained using the solar Majipump in the first irrigation season (Figure 5b). However, in the second irrigation season, utilizing the solar Majipump did not result in a statistically significant difference compared to the pulley system. This lack of significance can be attributed to the decline in water levels in the shallow water wells. Due to this decline, promoting full irrigation cannot ensure optimal benefits in the second irrigation season. The process of lifting water from the shallow wells using a pulley system would demand substantial labor due to the drop in the water table. Additionally, solar pumps face limitations in lifting water easily from the shallow wells, given that the maximum discharge head of the solar Majipump is 10 m [30]. Therefore, applying deficit irrigation during the second irrigation season emerges as a beneficial alternative.

3.6.3. Effect of Irrigation Management and Water-Lifting Technologies on DMY

The interaction effect of irrigation management and water-lifting technologies on DMY of Napier grass was not significant, as shown in Table 2. Although not statistically significant, the optimal benefit in dry matter yield could be gained through the synergetic use of climate-based scheduling with the solar Majipump (Figure 6). During the whole experimental period (sum of harvests 1 and 2), the highest DMY of 42 t ha−1 was obtained with the climate-based scheduling using a solar Majipump, while the lowest DMY obtained was 21 t ha−1 for farmers’ scheduling with a pulley. The application of climate-based scheduling with the solar Majipump increased the DMY of Napier grass by 36% compared to climate-based scheduling with a pulley. Moreover, it increased the DMY by 100% and 40% compared to farmers’ scheduling using a pulley and farmers’ scheduling using a solar Majipump, respectively. In contrast, climate-based scheduling using a pulley increased the DMY by 47% compared to farmers’ scheduling using a pulley, and only by 3% compared to farmers’ scheduling using a solar Majipump. Farmers’ scheduling with the solar Majipump resulted in a yield increase of 43% compared to farmers’ scheduling with the pulley. These results underscore the significance of selecting the right combination of irrigation management and water-lifting technologies to maximize yield.
Similarly, the introduction of water-lifting technologies in Ghana yielded positive outcomes for agricultural production, contributing to enhanced crop productivity, as observed in a study by Namara et al. [50]. Moreover, Bizimana et al. [51] demonstrated in their study that the adoption of small-scale irrigation technologies enabled farmers to cultivate a greater variety of crops, resulting in improved food availability for households and increased cash profits. The implementation of water-lifting technologies not only increased income but also facilitated double cropping, saved time and labor, alleviated the workload for women and children, and enhanced social status, as highlighted in the study by Nigussie et al. [52].

3.7. Water Productivity

3.7.1. Effect of Irrigation Management and Season on WP

A significant (p = 0.047) two-way interaction effect of irrigation management and irrigation season was observed on water productivity. The main effects of irrigation management and irrigation season on water productivity are presented in Figure S7a,b, respectively, in the Supplementary Materials.
During the first irrigation season, the difference in WP between the two irrigation management methods was not statistically significant (p = 0.119). Despite this, the climate-based irrigated plots had higher WP, averaging 5 kg m−3, compared to those plots irrigated by farmers’ scheduling, which averaged 4 kg m−3. Getachew [44], reported a water productivity value of Napier grass in the same study area as 3.4 kg m−3 under farmer-managed irrigation conditions. Increasing water productivity requires improved irrigation scheduling techniques that consider the integrated effect of climate, soil, and crop characteristics [53].
Even though climate-based irrigated plots received more irrigation water compared to farmer-scheduled irrigated plots, the former exhibited higher water productivity. This was attributed to their higher biomass productivity. Achieving a relatively high yield is crucial for enhancing water productivity. Attaining a relatively high yield is important for attaining higher water productivity [54].
Previous studies showed that irrigation scheduling can improve water use efficiency along with efficient irrigation scheduling management [55]. Numerous studies in the literature have reported that the adoption of irrigation water management, for example, the use of tools such as soil moisture sensors, has led to increased water productivity of crops [46,56]. Farmers employing scheduling tools or efficient irrigation technologies, as opposed to those without such tools, have been shown to reduce water consumption and boost productivity [57].
Similarly, in the second irrigation season, there was no statistically significant difference (p = 0.276) between the two irrigation management methods on irrigation water productivity. Contrary to the first season, farmer-scheduled irrigated plots exhibited higher water productivity than climate-based irrigated plots. The average irrigation water productivity for farmer-scheduled irrigated plots was 5 kg m−3 while the average WP was 4 kg m−3 for climate-based irrigated plots (Figure S8). In the second irrigation season, farmer-scheduled irrigated plots had better irrigation water productivity because the plots received less water (as deficit irrigation) and the yield loss due to the deficit irrigation was not pronounced due to the impact of rainfall. The average irrigation water applied to farmer-scheduled plots in the second irrigation season was 192 mm, while 278 mm of irrigation water was applied for climate-based irrigation scheduling. This resulted in a 30% deficit irrigation, equivalent to 70% of full irrigation, for the farmer-scheduled plots. Consistent with our findings, other studies such as Montazar et al. [58], Fazel et al. [59], and Rathore et al. [60] have also demonstrated that applying 30% deficit irrigation enhanced water productivity and did not significantly reduced the dry matter yield.
Under water-limited conditions, Napier grass undergoes morphological changes, such as lower stomatal conductance and leaf rolling, leading to improved water use efficiency [61]. The right scheduling can boost water productivity when irrigation water is scarce. Overall, water productivity can be improved by good water management practices that involve decreasing the unproductive water losses (runoff, evaporation, conveyance losses, and deep percolation), and increasing the water use efficiency of the respective system components [62]. The findings presented in this section, along with the preceding results from Section 3.6.1 and Section 3.6.2, illustrate that advocating for full irrigation (utilizing climate-based irrigation) during the first irrigation season, and implementing deficit irrigation in the subsequent season, can lead to the optimization of both yield and water productivity.

3.7.2. Effect of Water-Lifting Technologies on WP

A significant difference (p = 0.018) in irrigation water productivity was observed between the two water-lifting technologies (Figure S7c in the Supplementary Materials). On average, solar Majipumps had an irrigation water productivity of 5 kg m−3, surpassing that of the pulley with an irrigation water productivity of 4 kg m−3. The better performance of the solar Majipump in irrigation water productivity can be attributed to the utilization of a hose connected to the tanker, minimizing conveyance loss compared to the pulley system. Efficient irrigation technologies play a crucial role in enhancing control over water delivery, thereby improving water productivity [63]. In comparison to the pulley system, the solar Majipump water-lifting system significantly improved vegetable water productivity [24,26,30].
This study demonstrates that enhanced irrigation management, incorporating efficient irrigation water-lifting technologies and scheduling, has the potential to enhance forage yield and water productivity of fodder, an aspect less explored in prior research compared to that of cereals, fruits, and vegetables [64].

3.8. Effect of Water-Lifting Technologies on Irrigation Labor Productivity

A significant difference (p < 0.001) in irrigation labor productivity was observed between the two water-lifting technologies. The pulley has labor productivity ranging from 2 to 10 kg day−1 with an average of 5 kg day−1, while the labor productivity for the solar Majipump ranged from 14 to 47 kg day−1 with an average of 23 kg day−1 (Figure S9 in Supplementary Materials). The solar Majipump outperformed the pulley, improving irrigation labor productivity by 403%. The reduced need for labor in lifting water compared to the pulley contributed to this enhancement, with labor solely required for the application of water. Notably, using a solar pump resulted in significantly lower irrigation labor requirements compared to methods involving a rope and washer or a rope and bucket [45].
Given that a significant portion of production costs is labor-related, investing in labor-saving water-lifting technologies for smallholder irrigation will increase profitability. Although manual water-lifting devices (i.e., rope and washer, treadle pumps) were found to have a positive performance on food security, poverty reduction, and crop revenue, their labor intensiveness hinders potential adoption [65]. Due to their high labor productivity, researchers advocated solar pumps as a solution to these problems [66]. Using solar pumps resulted in higher profits compared to farmers using a rope and washer for water lifting and farmers who did not use any water-lifting technology [45]. In Ethiopia, with abundant solar energy as a tropical region, there is considerable potential for solar PV-based irrigation, supporting smallholder farmers in climate-smart technology adoption [67].

3.9. WP in Terms of Crude Protein and Metabolizable Energy

In Section 3.8, we have only discussed WP in terms of dry matter yield. By extending the study of water productivity in terms of crude protein and metabolizable energy, we have attempted to assess the efficiency of water use in producing crude protein and metabolizable energy. This can help identify ways to optimize water use in livestock production systems, while ensuring that the nutritional needs of animals are met.

3.9.1. WP in Terms of Crude Protein (WP.CP)

There were no significant three-way or two-way interaction effects involving irrigation management, water-lifting technologies, and irrigation season on water productivity for protein production. The difference between the two irrigation management treatments on WP.CP was not statistically significant (0.947) (Figure S10a in Supplementary Materials). The average WP.CP was 413 g m−3 for climate-based-managed plots and 409 g m−3 for farmer-managed plots. Similarly, there was no significant effect of water-lifting technologies on WP.CP (p = 0.402) (Figure S10b in the Supplementary Materials). The average WP.CP was 387 g m−3 for plots irrigated using pulleys and 434 g m−3 for plots irrigated using solar Majipumps. The water productivity for protein production for the solar Majipump increased by 12.6% compared to the pulley. In addition, there was no significant effect of irrigation season on WP.CP (p = 0.839) (Figure S10c in Supplementary Materials). The average WP.CP was 417 and 405 g m−3 for the first and second irrigation seasons, respectively.

3.9.2. WP in Terms of Metabolizable Energy (WP.ME)

There was a significant (p < 0.026) two-way interaction effect of irrigation management and irrigation season on WP.ME. The average WP.ME was 35 MJ m−3 and 27 MJ m−3 for the first irrigation season and 33 and 38 MJ m−3 for the second irrigation season for climate-based and farmer-managed plots, respectively. The main effect of irrigation management and irrigation season on WP.ME is shown, respectively, in Figure S11a,c (in Supplementary Materials). There was a significant (p = 0.005) effect of water-lifting technologies on WP.ME (Figure S11b in Supplementary Materials). The average WP.ME was 29 and 37 MJ m−3 for the pulley and solar Majipump, respectively. The solar Majipump had a 28% higher WP.ME than the pulley.

4. Conclusions

This study has demonstrated that climate-based scheduling and the use of solar Majipump technology significantly enhanced the productivity of Napier grass under smallholder farming conditions in Robit kebele, Ethiopia. The results highlight the importance of effective irrigation management and efficient water-lifting technologies in enhancing crop and water productivity, particularly in harnessing shallow groundwater potential during the first irrigation season of the post-rainy period. Moreover, this study demonstrated that a second season irrigation is limited by water availability and should be done with deficit irrigation. It is crucial to promote these approaches to farmers through extension services, including training and simple water calendar methods. However, it is important to consider the potential barriers to adoption, such as the high initial cost of solar pumps and challenges in market access for farmers. To facilitate broader adoption, innovative financial mechanisms should be considered. Furthermore, future research should explore the specific benefits of irrigated fodder compared to other crops and evaluate Livestock Water Productivity (LWP) to facilitate comparisons between various forage production methods.

Supplementary Materials

The following supporting information can be downloaded at: https://www.mdpi.com/article/10.3390/agronomy14051064/s1, Figure S1: Effect of irrigation management on irrigation water applied (a), effect of water-lifting technology on irrigation water applied (b), and effect of irrigation season on irrigation water applied (c); Figure S2: Interaction effect of irrigation management and season (a), and irrigation management and water-lifting technology (b) on the number of irrigations; Figure S3: Effect of water-lifting technology on the number of irrigations (a), effect of irrigation management on the number of irrigations (b), and effect of irrigation season on the number of irrigations (c); Figure S4: The average soil moisture content at different depths for the two water-lifting technologies (a) and the average soil moisture for the different plots (b). Plots irrigated using a pulley are designated as P1–P5 (dashed lines) and plots irrigated using a solar pump as S1–S5 (solid lines); Figure S5: Effect of irrigation management on dry matter yield of Napier grass (a), effect of irrigation season on dry matter yield of Napier grass (b), and effect of water-lifting technology on dry matter yield of Napier grass (c); Figure S6: Water surface levels of the different wells during the study period (dashed lines represent pulley users and solid lines represent solar Majipump users); Figure S7: Effect of irrigation management on water productivity of Napier grass (a), effect of irrigation season on water productivity of Napier grass (b), and effect of water-lifting technology on water productivity of Napier grass (c); Figure S8: Interaction effect of irrigation management and season on water productivity of Napier grass; Figure S9: Effect of water-lifting technology on irrigation labor productivity of Napier grass; Figure S10: Effect of irrigation management on water productivity for protein production (WP.CP) of Napier grass (a), the effect of water-lifting technology on water productivity for protein production (WP.CP) of Napier grass (b), and effect of irrigation season on water productivity for protein production (WP.CP) of Napier grass (c); Figure S11: Effect of irrigation management on water productivity for metabolizable energy production (WP.ME) of Napier grass, effect of irrigation season on water productivity for metabolizable energy production (WP.ME) of Napier grass, and effect of water lifting technology on water productivity for metabolizable energy production (WP.ME) of Napier grass.

Author Contributions

Conceptualization, M.A.H., M.B.D., A.A. and S.A.T.; methodology, M.A.H., T.T.A. and S.A.T.; formal analysis, M.A.H.; investigation, M.A.H. and F.T.R.; resources, A.A.; data curation, M.A.H., F.T.R. and A.A; writing—original draft preparation, M.A.H.; writing—review and editing, F.T.R., M.B.D., T.T.A., A.W.W., A.H., A.A., C.S.J. and S.A.T.; visualization, M.A.H., M.B.D. and S.A.T.; supervision, M.B.D., T.T.A., A.W.W., A.H. and S.A.T.; project administration, M.B.D. and S.A.T.; funding acquisition, M.B.D., C.S.J. and S.A.T. All authors have read and agreed to the published version of the manuscript.

Funding

This work was supported by the U.S. Agency for International Development under the Feed the Future Innovation Lab for Small Scale Irrigation (contract no. AID-OAA-A-13-0055) and the CGIAR Initiative on Sustainable Animal Productivity, which is supported by contributors to the CGIAR Trust Fund (https://www.cgiar.org/funders/). CGIAR is a global research partnership for a food-secure future dedicated to transforming food, land, and water systems in a climate crisis.

Data Availability Statement

The raw data supporting the conclusions of this article will be made available by the authors upon request because the 1st author is a PhD student and uses the data for subsequent other publications.

Acknowledgments

We are grateful to Bahir Dar University, Bahir Dar Institute of Technology and ANDASA livestock research center for their collaboration to this research work.

Conflicts of Interest

The authors declare that the research was conducted in the absence of any commercial or financial relationships that could be construed as a potential conflict of interest.

References

  1. Fan, S.; Teng, P.; Chew, P.; Smith, G.; Copeland, L. Food system resilience and COVID-19–Lessons from the Asian experience. Glob. Food Secur. 2021, 28, 100501. [Google Scholar] [CrossRef] [PubMed]
  2. Coluccia, B.; Agnusdei, G.P.; Miglietta, P.P.; De Leo, F. Effects of COVID-19 on the Italian agri-food supply and value chains. Food Control. 2021, 123, 107839. [Google Scholar] [CrossRef] [PubMed]
  3. Haile, M. Weather patterns, food security and humanitarian response in sub-Saharan Africa. Philos. Trans. R. Soc. B Biol. Sci. 2005, 360, 2169–2182. [Google Scholar] [CrossRef] [PubMed]
  4. Rosegrant, M.W.; Cline, S.A. Global food security: Challenges and policies. Science 2003, 302, 1917–1919. [Google Scholar] [CrossRef]
  5. Sekaran, U.; Lai, L.; Ussiri, D.A.; Kumar, S.; Clay, S. Role of integrated crop-livestock systems in improving agriculture production and addressing food security—A review. J. Agric. Food Res. 2021, 5, 100190. [Google Scholar] [CrossRef]
  6. Frelat, R.; Lopez-Ridaura, S.; Giller, K.E.; Herrero, M.; Douxchamps, S.; Djurfeldt, A.A.; Erenstein, O.; Henderson, B.; Kassie, M.; Paul, B.K. Drivers of household food availability in sub-Saharan Africa based on big data from small farms. Proc. Natl. Acad. Sci. USA 2016, 113, 458–463. [Google Scholar] [CrossRef] [PubMed]
  7. Notenbaert, A.M.; Douxchamps, S.; Villegas, D.M.; Arango, J.; Paul, B.K.; Burkart, S.; Rao, I.; Kettle, C.J.; Rudel, T.; Vázquez, E. Tapping into the environmental co-benefits of improved tropical forages for an agroecological transformation of livestock production systems. Front. Sustain. Food Syst. 2021, 434, 742842. [Google Scholar] [CrossRef]
  8. Shikuku, K.M.; Valdivia, R.O.; Paul, B.K.; Mwongera, C.; Winowiecki, L.; Läderach, P.; Herrero, M.; Silvestri, S. Prioritizing climate-smart livestock technologies in rural Tanzania: A minimum data approach. Agric. Syst. 2017, 151, 204–216. [Google Scholar] [CrossRef]
  9. Thomas, M.G.; Mohamed, A.H.; Sawalhah, M.N.; Holechek, J.L.; Bailey, D.W.; Hawkes, J.M.; Luna-Nevarez, P.; Molinar, F.; Khumalo, G.J.R.E. Long-term forage and cow-calf performance and economic considerations of two stocking levels on Chihuahuan desert rangeland. Rangel. Ecol. Manag. 2015, 68, 158–165. [Google Scholar] [CrossRef]
  10. Thornton, P.K.; Kristjanson, P.M.; Thorne, P.J. Measuring the potential impacts of improved food-feed crops: Methods for ex ante assessment. Field Crops Res. 2003, 84, 199–212. [Google Scholar] [CrossRef]
  11. Hanjra, M.A.; Ferede, T.; Gutta, D.G. Reducing poverty in sub-Saharan Africa through investments in water and other priorities. Agric. Water Manag. 2009, 96, 1062–1070. [Google Scholar] [CrossRef]
  12. Yami, M. Irrigation projects in Ethiopia: What can be done to enhance effectiveness under ‘challenging contexts’? Int. J. Sustain. Dev. World Ecol. 2016, 23, 132–142. [Google Scholar] [CrossRef]
  13. Assefa, M.; Wesseler, J.; Hengsdijk, H. Socio-Economic Assessment of Two Small-Scale Irrigation Schemes in Adami Tullu Jido Kombolcha Woreda, Central Rift Valley of Ethiopia; Environmental Economics and Natural Resources Group, Wageningen University: Wageningen, The Netherlands, 2008. [Google Scholar]
  14. Vennila, C.; Ananthi, T. Impact of irrigation and nutrients on the performance of bajra Napier hybrid grass grown under light sandy soil. Int. J. Curr. Microbiol. Appl. Sci. 2019, 8, 804–812. [Google Scholar] [CrossRef]
  15. Belay, S.A.; Schmitter, P.; Worqlul, A.W.; Steenhuis, T.S.; Reyes, M.R.; Tilahun, S.A. Conservation agriculture saves irrigation water in the dry monsoon phase in the Ethiopian highlands. Water 2019, 11, 2103. [Google Scholar] [CrossRef]
  16. Yohannes, D.F.; Ritsema, C.; Eyasu, Y.; Solomon, H.; Van Dam, J.; Froebrich, J.; Ritzema, H.; Meressa, A. A participatory and practical irrigation scheduling in semiarid areas: The case of Gumselassa irrigation scheme in Northern Ethiopia. Agric. Water Manag. 2019, 218, 102–114. [Google Scholar]
  17. Centreal Statistics Agency of Ethiopia. Agricultural Sample Survey, 2019/2020, Crop and Livestock Product Utilization; Centreal Statistics Agency of Ethiopia: Addis Ababa, Ethiopia, 2020; Volume II.
  18. Farrell, G.; Simons, S.; Hillocks, R. Pests, diseases and weeds of Napier grass, Pennisetum purpureum: A review. Int. J. Pest Manag. 2002, 48, 39–48. [Google Scholar] [CrossRef]
  19. Mwendia, S.; Wanyoike, M.; JGM, N.; Wahome, R.; Mwangi, D. Evaluation of Napier Grass Cultivars for Resistance to Napier Head Smut; Univesity of Nairobi, Kenya Agricultural Research Institute: Nairobi, Kenya, 2006. [Google Scholar]
  20. Negawo, A.T.; Teshome, A.; Kumar, A.; Hanson, J.; Jones, C.S. Opportunities for Napier grass (Pennisetum purpureum) improvement using molecular genetics. Agronomy 2017, 7, 28. [Google Scholar] [CrossRef]
  21. Odongo, N.; Tanner, J.; Romney, D.; Plaizier, J.; Van Straaten, P.; McBride, B. The effects of supplementing Napier grass (Pennisetum purpureum) with rock phosphate and steamed bone meal compared with a commercial mineral mix on phosphorus absorption in cattle. Trop. Anim. Health Prod. 2002, 34, 329–338. [Google Scholar] [CrossRef]
  22. Zewdu, T. Variation in growth, yield, chemical composition and in vitro dry matter digestibility of Napier grass accessions (Pennisetum purpureum). Trop. Sci. 2005, 45, 67–73. [Google Scholar] [CrossRef]
  23. Cook, B.G.; Pengelly, B.C.; Brown, S.; Donnelly, J.; Eagles, D.; Franco, M.; Hanson, J.; Mullen, B.F.; Partridge, I.; Peters, M. Tropical Forages: An Interactive Selection Tool. Web Tool. CSIRO, DPI&F(Qld), CIAT and ILRI, Brisbane, Australia. 2005. Available online: https://cgspace.cgiar.org/items/f3b5a09f-5630-4fb6-b0ed-f6a1d61539c2 (accessed on 27 January 2023).
  24. Assefa, T.; Jha, M.; Reyes, M.; Tilahun, S.; Worqlul, A.W. Experimental evaluation of conservation agriculture with drip irrigation for water productivity in sub-Saharan Africa. Water 2019, 11, 530. [Google Scholar] [CrossRef]
  25. Fenta, H.M.; Hussein, M.A.; Tilahun, S.A.; Nakawuka, P.; Steenhuis, T.S.; Barron, J.; Adie, A.; Blummel, M.; Schmitter, P. Berken plow and intercropping with pigeon pea ameliorate degraded soils with a hardpan in the Ethiopian highlands. Geoderma 2022, 407, 115523. [Google Scholar] [CrossRef]
  26. Yimam, A.Y.; Assefa, T.T.; Adane, N.F.; Tilahun, S.A.; Jha, M.K.; Reyes, M.R. Experimental evaluation for the impacts of conservation agriculture with drip irrigation on crop coefficient and soil properties in the sub-humid Ethiopian Highlands. Water 2020, 12, 947. [Google Scholar] [CrossRef]
  27. Mulugeta, H. Development of Crop Coefficients and Evaluating the Productivity Andwater Use for Napier Grass under Small-Scale Irrigation: The Case of Robit Kebele. Master’s Thesis, Faculty of Civil and Water Resource Engineering, Bahir Dar University, Bahir Dar, Etiopia, 2015. Available online: https://ilssi.tamu.edu/publications/student-thesis-papers/ (accessed on 16 September 2020).
  28. Dadrasan, M.; Chaichi, M.; Pourbabaee, A.; Yazdani, D.; Keshavarz-Afshar, R. Deficit irrigation and biological fertilizer influence on yield and trigonelline production of fenugreek. Ind. Crops Prod. 2015, 77, 156–162. [Google Scholar] [CrossRef]
  29. Tilahun, S.A.; Yilak, D.L.; Schmitter, P.; Zimale, F.A.; Langan, S.; Barron, J.; Parlange, J.Y.; Steenhuis, T.S. Establishing irrigation potential of a hillside aquifer in the African highlands. Hydrol. Process. 2020, 34, 1741–1753. [Google Scholar] [CrossRef]
  30. Assefa, T.; Adametie, T.; Yimam, A.; Belay, S.; Degu, Y.; Hailemeskel, S.; Tilahun, S.; Reyes, M.; Prasad, P. Evaluating Irrigation and Farming Systems with Solar MajiPump in Ethiopia. Agronomy 2020, 11, 17. [Google Scholar] [CrossRef]
  31. Black, C.A. Methods of Soil Analysis: Sponsored by the American Society of Agronomy and the American Society for Testing Materials; American Society for Agronomy: Madison, WI, USA, 1965. [Google Scholar]
  32. Cassel, D.; Nielsen, D. Field capacity and available water capacity. In Methods of Soil Analysis, Part 1: Physical and Mineralogical Methods; American Society of Agronomy-Soil Science Society of America: Madison, WI, USA, 1986; Volume 5, pp. 901–926. [Google Scholar]
  33. Bremner, J.; Mulvaney, C. Nitrogen-total. In Methods of Soil Analysis, Part 2: Chemical and Microbiological Properties; Page, A.L., Miller, R.H., Keeney, D.R., Eds.; Soil Science Society of America: Madison, WI, USA, 1982; pp. 595–624. [Google Scholar]
  34. Olsen, S.; Dean, L. Phosphorus. In Methods of Soil Analysis, Part 2: Chemical and Microbiological Properties; American Society of Agronomy, Inc.: Madison, WI, USA, 1965; Volume 2, pp. 1035–1048. [Google Scholar]
  35. Nelson, D.A.; Sommers, L. Total carbon, organic carbon, and organic matter. In Methods of Soil Analysis, Part 2: Chemical and Microbiological Properties; Wiley Online Library: Hoboken, NJ, USA, 1983; Volume 9, pp. 539–579. [Google Scholar]
  36. Assefa, T.; Jha, M.; Reyes, M.; Worqlul, A.W. Modeling the impacts of conservation agriculture with a drip irrigation system on the hydrology and water management in sub-Saharan Africa. Sustainability 2018, 10, 4763. [Google Scholar] [CrossRef]
  37. Allen, R.G.; Pereira, L.S.; Raes, D.; Smith, M. Crop Evapotranspiration—Guidelines for Computing Crop Water Requirements; FAO Irrigation and Drainage Paper 56; FAO: Rome, Italy, 1998; p. D05109. [Google Scholar]
  38. Wu, Y.; Si, W.; Yan, S.; Wu, L.; Zhao, W.; Zhang, J.; Zhang, F.; Fan, J. Water consumption, soil nitrate-nitrogen residue and fruit yield of drip-irrigated greenhouse tomato under various irrigation levels and fertilization practices. Agric. Water Manag. 2023, 277, 108092. [Google Scholar] [CrossRef]
  39. Hunt, R.C. Labor productivity and agricultural development: Boserup revisited. Hum. Ecol. 2000, 28, 251–277. [Google Scholar] [CrossRef]
  40. Ul-Allah, S.; Khan, A.A.; Fricke, T.; Buerkert, A.; Wachendorf, M. Effect of fertiliser and irrigation on forage yield and irrigation water use efficiency in semi-arid regions of Pakistan. Exp. Agric. 2015, 51, 485–500. [Google Scholar] [CrossRef]
  41. Menke, K. Estimation of the energetic feed value obtained from chemical analysis and In Vitro gas production using rumen fluid. Anim. Res. Dev. 1988, 28, 7–55. [Google Scholar]
  42. Purcell, J.; Currey, A. Gaining Acceptance of Water Use Efficiency—Framework, Terms and Definitions; Final Report; National Program for Sustainable Irrigation (NPSI): Narrabri, NSW, Australia, 2003; pp. 7–15.
  43. Gallardo, A. Spatial variability of soil properties in a floodplain forest in northwest Spain. Ecosystems 2003, 6, 564–576. [Google Scholar] [CrossRef]
  44. Getachew, T. Development of Crop Coefficient and Evaluation of Partial Nutrient Balance for Garlic (Allium sativum) and Inter Cropped Napier Grass under Dry Period Irrigation in Robit Bata Watershed. Ph.D. Thesis, Bahir Dar University, Bahir Dar, Etiopia, 2020. [Google Scholar]
  45. Schmitter, P.S.; Tegegne, D.; Adie, A.; Baudron, F.; Blümmel, M.; Lefore, N.; Barron, J. Evaluation of Suitable Water Lifting and On-Farm Water Management Technologies for the Irrigation of Vegetables and Fodder in Lemo District, Ethiopia; International Livestock Research Institute: Addis Ababa, Ethiopia, 2016. [Google Scholar]
  46. Spencer, G.; Krutz, L.; Falconer, L.; Henry, W.; Henry, C.; Larson, E.; Pringle, H., III; Bryant, C.; Atwill, R. Irrigation water management technologies for furrow-irrigated corn that decrease water use and improve yield and on-farm profitability. Crop Forage Turfgrass Manag. 2019, 5, 1–8. [Google Scholar] [CrossRef]
  47. Frenken, K.; Gillet, V. Irrigation Water Requirement and Water Withdrawal by Country; FAO: Rome, Italy, 2012. [Google Scholar]
  48. Getiso, A.; Mijena, D. Performance Evaluation of Napier Grass (Penisetum purpuruem (L.) Schumach) accessions under rain fed and Irrigation System at Wondo Genet. Glob. J. Ecol. 2021, 6, 28–33. [Google Scholar]
  49. Salmerón, M.; Urrego, Y.; Isla, R.; Cavero, J. Effect of non-uniform sprinkler irrigation and plant density on simulated maize yield. Agric. Water Manag. 2012, 113, 1–9. [Google Scholar] [CrossRef]
  50. Namara, R.E.; Hope, L.; Sarpong, E.O.; De Fraiture, C.; Owusu, D. Adoption patterns and constraints pertaining to small-scale water lifting technologies in Ghana. Agric. Water Manag. 2014, 131, 194–203. [Google Scholar] [CrossRef]
  51. Bizimana, J.-C.; Richardson, J.W.; Clarke, N.P. Household Food Security and Nutrition Analysis Using a Farm Simulation Model (FARMSIM): Case Study of Robit in Amhara Region, Ethiopia. ES Food Agrofor. 2020, 2, 22–41. [Google Scholar] [CrossRef]
  52. Nigussie, L.; Lefore, N.; Schmitter, P.S.; Nicol, A. Gender and Water Technologies: Water Lifting for Irrigation and Multiple Purposes in Ethiopia; International Livestock Research Institute: Addis Ababa, Ethiopia, 2017. [Google Scholar]
  53. Singh, J.; Behari, P.; Yadava, R. On the estimation of evapotranspiration, water-use efficiency and crop coefficient of lucerne (Medicago sativa L.) in central India. Curr. Sci. 2007, 93, 17–19. [Google Scholar]
  54. Zhang, X.; Chen, S.; Sun, H.; Shao, L.; Wang, Y. Changes in evapotranspiration over irrigated winter wheat and maize in North China Plain over three decades. Agric. Water Manag. 2011, 98, 1097–1104. [Google Scholar] [CrossRef]
  55. Howell, T.; Evett, S.; Tolk, J. Irrigation systems and management to meet future food/fiber needs and to enhance water use efficiency. In Proceedings of the INIFAP-ARS Joint Meeting: A Framework for Cooperation, Weslaco, TX, USA and Río Bravo, Mexico, 6–7 November 2001; pp. 10–14. [Google Scholar]
  56. Hassanli, A.M.; Ebrahimizadeh, M.A.; Beecham, S. The effects of irrigation methods with effluent and irrigation scheduling on water use efficiency and corn yields in an arid region. Agric. Water Manag. 2009, 96, 93–99. [Google Scholar] [CrossRef]
  57. Levidow, L.; Zaccaria, D.; Maia, R.; Vivas, E.; Todorovic, M.; Scardigno, A. Improving water-efficient irrigation: Prospects and difficulties of innovative practices. Agric. Water Manag. 2014, 146, 84–94. [Google Scholar] [CrossRef]
  58. Montazar, A.; Bachie, O.; Corwin, D.; Putnam, D. Feasibility of moderate deficit irrigation as a water conservation tool in California’s low desert alfalfa. Agronomy 2020, 10, 1640. [Google Scholar] [CrossRef]
  59. Fazel, F.; Ansari, H.; Aguilar, J. Determination of the Most Efficient Forage Sorghum Irrigation Scheduling Strategies in the US Central High Plains Using the AquaCrop Model and Field Experiments. Agronomy 2023, 13, 2446. [Google Scholar] [CrossRef]
  60. Rathore, V.S.; Nathawat, N.S.; Bhardwaj, S.; Yadav, B.M.; Kumar, M.; Santra, P.; Kumar, P.; Reager, M.L.; Yadava, N.D.; Yadav, O.P. Optimization of deficit irrigation and nitrogen fertilizer management for peanut production in an arid region. Sci. Rep. 2021, 11, 5456. [Google Scholar] [CrossRef] [PubMed]
  61. Purbajanti, E.; Anwar, S.; Wydiati, F.K. Drought stress effect on morphology characters, water use efficiency, growth and yield of guinea and napier grasses. Int. Res. J. Plant Sci. 2012, 3, 47–53. [Google Scholar]
  62. Descheemaeker, K.; Amede, T.; Haileslassie, A. Improving water productivity in mixed crop–livestock farming systems of sub-Saharan Africa. Agric. Water Manag. 2010, 97, 579–586. [Google Scholar] [CrossRef]
  63. Kumar, M.D.; Sharma, B.R.; Singh, O.P. Water saving and yield enhancing micro-irrigation technologies: How far can they contribute to water productivity in Indian agriculture? In Strategic Analyses of the National River Linking Project (NRLP) of India, Series 1: India’s Water Future: Scenarios and Issues; International Water Management Institute: Colombo, Sri Lanka, 2009. [Google Scholar]
  64. Capstaff, N.M.; Miller, A.J. Improving the yield and nutritional quality of forage crops. Front. Plant Sci. 2018, 9, 535. [Google Scholar] [CrossRef] [PubMed]
  65. Kamwamba-Mtethiwa, J.; Weatherhead, K.; Knox, J. Assessing performance of small-scale pumped irrigation systems in sub-Saharan Africa: Evidence from a systematic review. Irrig. Drain. 2016, 65, 308–318. [Google Scholar] [CrossRef]
  66. Kelley, L.C.; Gilbertson, E.; Sheikh, A.; Eppinger, S.D.; Dubowsky, S. On the feasibility of solar-powered irrigation. Renew. Sustain. Energy Rev. 2010, 14, 2669–2682. [Google Scholar] [CrossRef]
  67. Schmitter, P.; Kibret, K.S.; Lefore, N.; Barron, J. Suitability mapping framework for solar photovoltaic pumps for smallholder farmers in sub-Saharan Africa. Appl. Geogr. 2018, 94, 41–57. [Google Scholar] [CrossRef]
Figure 1. Location map of experimental sites in Yinebo and Robit watersheds, Robit kebele, Ethiopia. Yinebo River joins Yidemo River which flows to Lake Tana. Robit River directly drains to Lake Tana.
Agronomy 14 01064 g001
Figure 2. Experimental layout using a pulley as a water-lifting technology (a) and using a solar Majipump (b) with plots divided between climate and farmer-based scheduling.
Agronomy 14 01064 g002
Figure 3. Long-term and study period mean monthly rainfall, temperature, and reference evapotranspiration in the study area.
Agronomy 14 01064 g003
Figure 4. Time series plot of the average soil moisture of the two water-lifting technologies.
Agronomy 14 01064 g004
Figure 5. Interaction effect of irrigation season and irrigation management (a) and water-lifting technologies (b) on DMY of Napier grass. Values represented by the same letter are not statistically significant.
Agronomy 14 01064 g005
Figure 6. Comparison of irrigation management and water-lifting technologies on DMY of Napier grass. Values represented by the same letter are not statistically significant.
Agronomy 14 01064 g006
Table 1. Soil physiochemical properties across experimental plots.
Soil PropertyUnitSoil Depth
0–30 cm30–60 cm
MinMaxMeanCV (%)MinMaxMeanCV (%)
pHH2O (1:2.5)5.175.555.342.45.266.025.583.94
ECdS/m0.040.180.0764.780.030.080.0437.04
OC%1.612.522.0415.120.591.881.2138.23
OM%2.784.353.5115.151.013.252.0838.46
TN%0.130.210.16170.030.150.0945.62
FC (gravimetric)%28.133.530.825.3330.135.933.295.65
PWP (gravimetric)%17.621.819.987.2319.92421.946.9
Av. Pppm3.8910.587.8224.293.088.746.3729.83
%Sand112517.826.593117.242.33
Texture%Silt274132.614.4112920.229.22
%Clay346049.614.33608672.612.12
Table 2. Significance levels of fitted terms and their interaction.
IWADMYWPNoIrrWP.CPWP.MESMILP
IM******0.714***0.9470.541
WLT0.1030.0010.0180.0080.4020.005******
Season******0.589***0.8390.156
IM*WLT0.1030.7010.5580.0080.930.789
IM*Season0.6660.0190.047***0.6550.026
WLT*Season0.2340.0160.2160.5780.5740.205
IM*WLT*Season0.2340.8930.7040.5780.9370.822
IM = Irrigation management, WLT = Water-lifting technology, IWA = Irrigation water applied, NoIrr = number of irrigation, WP.CP and WP.ME = Water productivity as a function of crude protein yield and metabolizable energy yield respectively, SM = Soil moisture, ILP = Irrigation labor productivity, *** = p < 0.001.
Disclaimer/Publisher’s Note: The statements, opinions and data contained in all publications are solely those of the individual author(s) and contributor(s) and not of MDPI and/or the editor(s). MDPI and/or the editor(s) disclaim responsibility for any injury to people or property resulting from any ideas, methods, instructions or products referred to in the content.

