
Predicting Response to Exclusive Combined Radio-Chemotherapy in Naso-Oropharyngeal Cancer: The Role of Texture Analysis

 , , , , , , ,
Abstract
:1. Introduction
2. Materials and Methods
2.1. Patient Selection
- Over 18 years of age;
- Diagnosis of HPV + OPC or EBV + NPC;
- Having undergone RT-CHT as an exclusive treatment;
- Pre-treatment MRI examination available.
- Previous exposure to radiation therapy in the head and neck district;
- Previous surgery in the head and neck district;
- MRI examination performed in a different center or on a different machine;
- No ADC maps or T1w post-contrast sequences;
- MRI not performed, neither for tumor staging nor after the 3–4-month follow-up;
- No cross-sectional imaging follow-up, including both FDG-PET/TC and MRI, or carried out for less than 12 months.
2.2. Image Acquisition
2.3. Image Analysis
Division into Groups Based on Imaging and Histological Examination
- Group 1: persistence or recurrence of disease—residual cancer—10 patients. Mass-like lesions showing intermediate signal intensity (SI) on T2w imaging; restricted diffusion with a subsequent decrease in ADC values, non-homogeneous post-contrast enhancement; positive FDG-PET/TC; positive biopsy;
- Group 2: responder patients—non residual cancer—27 patients. No mass at follow-up or mass-like lesion with negative biopsy (inflammatory oedema or fibrosis).
2.4. Statistical Analysis
3. Results
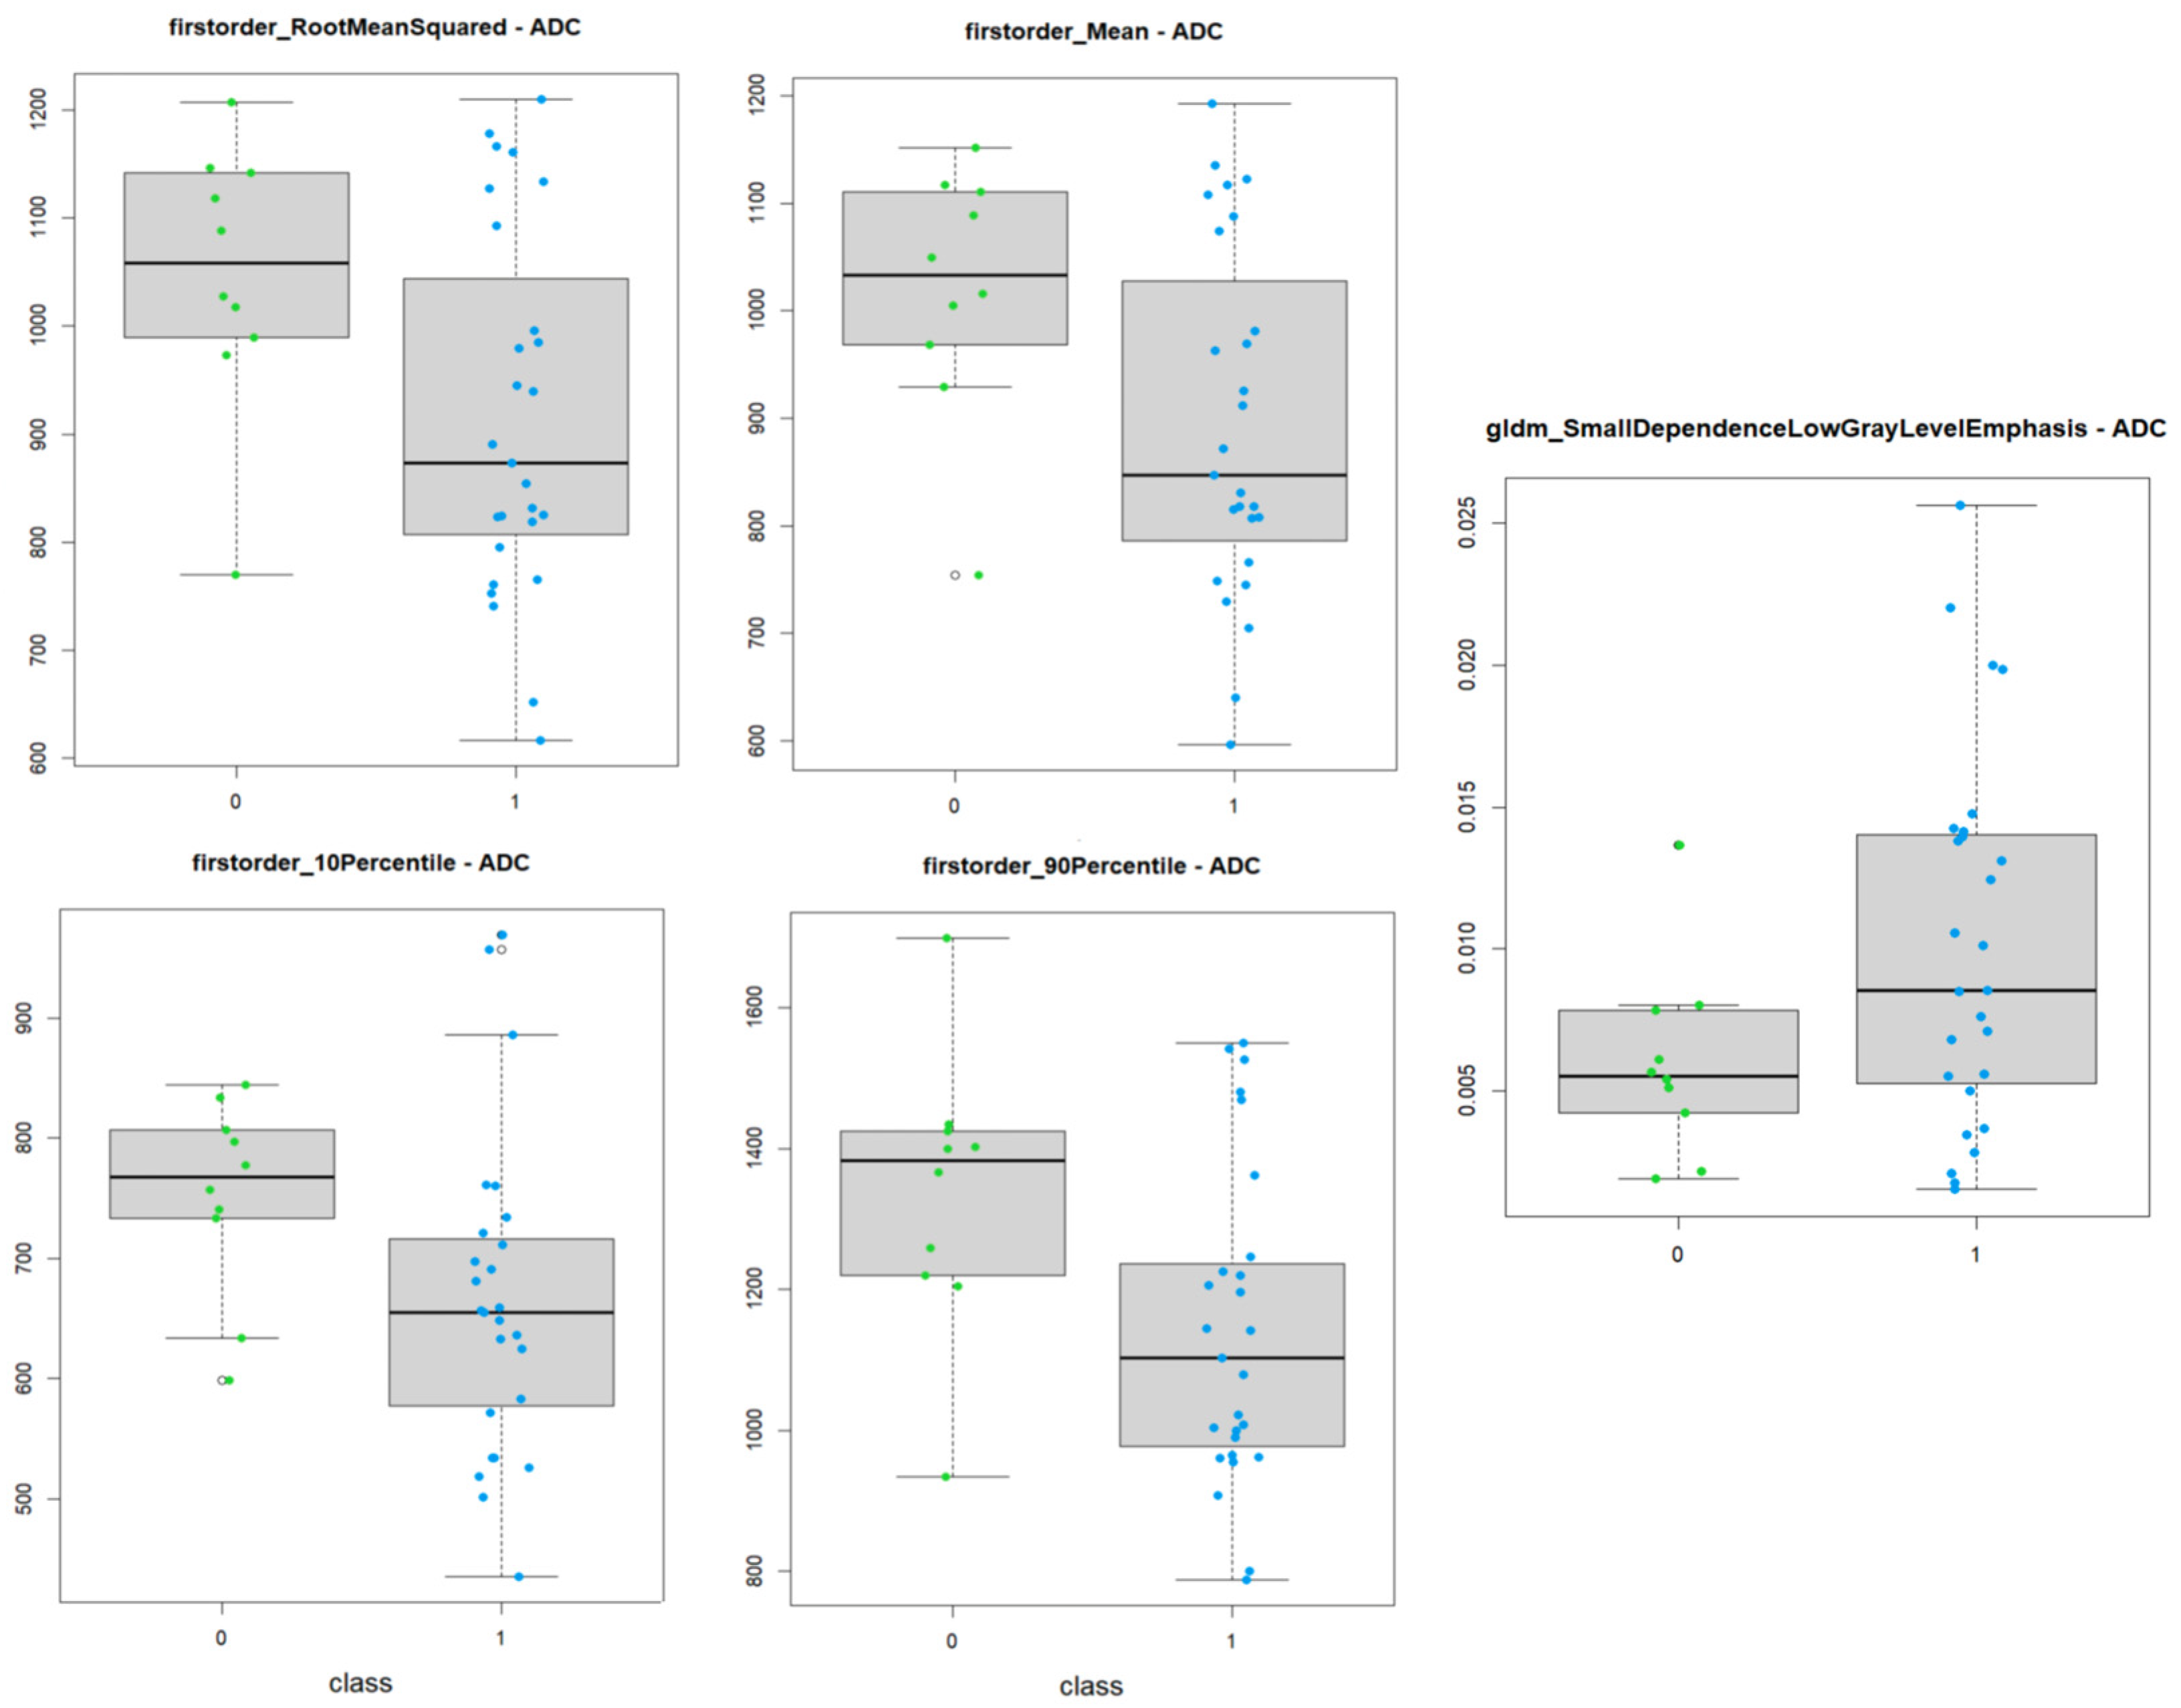
3.1. ADC Maps
- 9 First order features;
- 4 Gray Level Co-occurrence Matrix features;
- 1 Gray Level Dependence Matrix feature;
- 2 Gray Level Size Zone Matrix features.

| Significative Features | Test | p-Value |
|---|---|---|
| firstorder_10Percentile | t-test | 0.020 |
| firstorder_90Percentile | t-test | 0.022 |
| firstorder_Energy | Mann–Whitney test | 0.044 |
| firstorder_InterquartileRange | Mann–Whitney test | 0.048 |
| firstorder_Maximum | t-test | 0.040 |
| firstorder_Mean | t-test | 0.017 |
| firstorder_Median | t-test | 0.048 |
| firstorder_RootMeanSquared | t-test | 0.017 |
| firstorder_TotalEnergy | Mann–Whitney test | 0.037 |
| glcm_DifferenceEntropy | t-test | 0.044 |
| glcm_JointEnergy | Mann–Whitney test | 0.031 |
| glcm_JointEntropy | t-test | 0.042 |
| glcm_SumEntropy | t-test | 0.028 |
| gldm_SmallDependenceLowGrayLevelEmphasis | t-test | 0.017 |
| glszm_GrayLevelNonUniformityNormalized | t-test | 0.037 |
| glszm_ZoneEntropy | t-test | 0.040 |
- shape_Elongation;
- firstorder_10Percentile;
- glcm_ClusterShade;
- glcm_SumEntropy.
3.2. Post-Contrast T1w Imaging
- 8 First order features; 6 3D Shape-Based;
- 14 Gray Level Co-occurrence Matrix (GLCM);
- 5 Gray Level Size Zone Matrix (GLSZM);
- 5 Gray Level Run Length Matrix (GLRLM);
- 2 Neighboring Gray Tone Difference Matrix (NGTDM);
- 3 Gray Level Dependence Matrix (GLDM).
| Significative Features (43) | Test | p-Value |
|---|---|---|
| shape_LeastAxisLength | t-test | 0.0053 |
| shape_MeshVolume | Mann–Whitney test | 0.0082 |
| shape_MinorAxisLength | t-test | 0.0437 |
| shape_SurfaceArea | Mann–Whitney test | 0.0127 |
| shape_SurfaceVolumeRatio | Mann–Whitney test | 0.0114 |
| shape_VoxelVolume | Mann–Whitney test | 0.0082 |
| firstorder_Energy | Mann–Whitney test | 0.0031 |
| firstorder_Entropy | t-test | 0.0068 |
| firstorder_InterquartileRange | t-test | 0.0210 |
| firstorder_MeanAbsoluteDeviation | t-test | 0.0173 |
| firstorder_RobustMeanAbsoluteDeviation | t-test | 0.0155 |
| firstorder_TotalEnergy | Mann–Whitney test | 0.0102 |
| firstorder_Uniformity | Mann–Whitney test | 0.0058 |
| firstorder_Variance | Mann–Whitney test | 0.0141 |
| glcm_ClusterProminence | Mann–Whitney test | 0.0282 |
| glcm_ClusterTendency | Mann–Whitney test | 0.0092 |
| glcm_Contrast | t-test | 0.0362 |
| glcm_Correlation | t-test | 0.0104 |
| glcm_DifferenceAverage | t-test | 0.0360 |
| glcm_DifferenceEntropy | Mann–Whitney test | 0.0212 |
| glcm_DifferenceVariance | t-test | 0.0352 |
| glcm_Imc2 | t-test | 0.0161 |
| glcm_InverseVariance | t-test | 0.0456 |
| glcm_JointEnergy | Mann–Whitney test | 0.0127 |
| glcm_JointEntropy | t-test | 0.0071 |
| glcm_MaximumProbability | Mann–Whitney test | 0.0309 |
| glcm_SumEntropy | t-test | 0.0046 |
| glcm_SumSquares | Mann–Whitney test | 0.0102 |
| gldm_DependenceEntropy | t-test | 0.00028 |
| gldm_DependenceNonUniformity | Mann–Whitney test | 0.0021 |
| gldm_GrayLevelVariance | Mann–Whitney test | 0.0141 |
| glrlm_GrayLevelNonUniformity | Mann–Whitney test | 0.0405 |
| glrlm_GrayLevelNonUniformityNormalized | Mann–Whitney test | 0.0051 |
| glrlm_GrayLevelVariance | Mann–Whitney test | 0.0127 |
| glrlm_RunEntropy | t-test | 0.0021 |
| glrlm_RunLengthNonUniformity | Mann–Whitney test | 0.0024 |
| glszm_GrayLevelNonUniformity | Mann–Whitney test | 0.0058 |
| glszm_GrayLevelNonUniformityNormalized | Mann–Whitney test | 0.0082 |
| glszm_GrayLevelVariance | Mann–Whitney test | 0.0212 |
| glszm_SizeZoneNonUniformity | Mann–Whitney test | 0.0024 |
| glszm_ZoneEntropy | t-test | 0.00074 |
| ngtdm_Coarseness | Mann–Whitney test | 0.0114 |
| ngtdm_Strength | t-test | 0.0208 |
- gldm_DependenceNonUniformity;
- gldm LargeDependenceLowGrayLevelEmphasis;
- glrlm_RunEntropy;
- ngtdm_Strength.
4. Discussion
4.1. Post-Contrast T1w Imaging
4.2. ADC Maps
4.3. Limits and Future Perspectives
5. Conclusions
Author Contributions
Funding
Institutional Review Board Statement
Informed Consent Statement
Data Availability Statement
Conflicts of Interest
Appendix A
| Sequence | Contrast Agent | Repetition Time (ms) | Echo Time (ms) | Slice Thickness (mm) | Interslice Gap (mm) | Field of View (mm) | Matrix | Acceleration Factor | Number of Signal Averaged | Band Width (Hz/Px) | Acquisition Time (min:sec) | Voxel Size |
|---|---|---|---|---|---|---|---|---|---|---|---|---|
| SPACE T1-w Sagittal | pre | 500 | 7.2 | 0.9 | - | 229 × 229 | 230 × 256 | 2 | 1.4 | 630 | 5:47 | 0.9 × 0.9 × 0.9 |
| SPACE T2-w Sagittal Fat-Sat | pre | 3000 | 380 | 0.9 | - | 229 × 229 | 230 × 256 | 2 | 1.4 | 698 | 5:56 | 0.9 × 0.9 × 0.9 |
| TSE T2-w Axial | pre | 5050 | 117 | 3 | 0.9 | 210 × 190 | 261 × 484 | 2 | 3 | 191 | 2:23 | 0.5 × 0.5 × 3.0 |
| SPAIR EPI-DWI Axial (b 50/800 s/mm2) | pre | 4100 | 55 | 3 | 0.9 | 240 × 240 | 102 × 128 | 3 | 1 | 1608 | 3:09 | 1.6 × 1.6 × 3.0 |
| VIBE T1-w DCE-PWI Axial; FA 5°, 15° | pre | 4.65 | 1.66 | 3.5 | 0.7 | 250 × 226 | 139 × 132 | 3 | 1 | 390 | 1:04 | 1.3 × 1.3 × 3.5 |
| TSE T1-w Axial | post | 440 | 17 | 3 | 0.9 | 200 × 181 | 384 × 384 | 3 | 3 | 200 | 2:31 | 0.5 × 0.5 × 3.0 |
| VIBE Dixon Axial | post | 10 | 2.4 | 0.9 | 0.18 | 225 × 225 | 212 × 256 | - | 1 | 340 | 4:37 | 0.9 × 0.9 × 0.9 |
| VIBE T1-w DCE-PWI Axial; FA 30° | post | 4.65 | 1.66 | 3.5 | 0.7 | 250 × 226 | 139 × 132 | 3 | 1 | 300 | 4:17 | 1.3 × 1.3 × 3.5 |
References
- Mody, M.D.; Rocco, J.W.; Yom, S.S.; Haddad, R.I.; Saba, N.F. Head and neck cancer. Lancet 2021, 398, 2289–2299. [Google Scholar] [CrossRef] [PubMed]
- Rahman, R.; Shaikh, M.H.; Gopinath, D.; Idris, A.; Johnson, N.W. Human papillomavirus and Epstein-Barr virus co-infection in oral and oropharyngeal squamous cell carcinomas: A systematic review and meta-analysis. Mol. Oral. Microbiol. 2023, 38, 259–274. [Google Scholar] [CrossRef] [PubMed]
- Siegel, R.L.; Giaquinto, A.N.; Jemal, A. Cancer statistics, 2024. CA Cancer J. Clin. 2024, 74, 12–49. [Google Scholar] [CrossRef]
- Cantu, G. Nasopharyngeal carcinoma. A “different” head and neck tumour. Part A: From histology to staging. Acta Otorhinolaryngol. Ital. 2023, 43, 85–98. [Google Scholar] [CrossRef] [PubMed]
- Badoual, C. Update from the 5th Edition of the World Health Organization Classification of Head and Neck Tumors: Oropharynx and Nasopharynx. Head Neck Pathol. 2022, 16, 19–30. [Google Scholar] [CrossRef] [PubMed]
- Shinomiya, H.; Nibu, K.I. Etiology, diagnosis, treatment, and prevention of human papilloma virus-associated oropharyngeal squamous cell carcinoma. Int. J. Clin. Oncol. 2023, 28, 975–981. [Google Scholar] [CrossRef] [PubMed]
- Yan, E.Z.; Wahle, B.M.; Massa, S.T.; Zolkind, P.; Paniello, R.C.; Pipkorn, P.; Jackson, R.S.; Rich, J.T.; Puram, S.V.; Mazul, A.L. Race and socioeconomic status interact with HPV to influence survival disparities in oropharyngeal squamous cell carcinoma. Cancer Med. 2023, 12, 9976–9987. [Google Scholar] [CrossRef] [PubMed]
- Katirachi, S.K.; Grønlund, M.P.; Jakobsen, K.K.; Grønhøj, C.; von Buchwald, C. The Prevalence of HPV in Oral Cavity Squamous Cell Carcinoma. Viruses 2023, 15, 451. [Google Scholar] [CrossRef] [PubMed]
- Barsouk, A.; Aluru, J.S.; Rawla, P.; Saginala, K.; Barsouk, A. Epidemiology, Risk Factors, and Prevention of Head and Neck Squamous Cell Carcinoma. Med. Sci. 2023, 11, 42. [Google Scholar] [CrossRef]
- Wu, Z.; Qi, B.; Lin, F.F.; Zhang, L.; He, Q.; Li, F.P.; Wang, H.; Han, Y.Q.; Yin, W.J. Characteristics of local extension based on tumor distribution in nasopharyngeal carcinoma and proposed clinical target volume delineation. Radiother Oncol. 2023, 183, 109595. [Google Scholar] [CrossRef] [PubMed]
- Lechner, M.; Liu, J.; Masterson, L.; Fenton, T.R. HPV-associated oropharyngeal cancer: Epidemiology, molecular biology and clinical management. Nat. Rev. Clin. Oncol. 2022, 19, 306–327. [Google Scholar] [CrossRef]
- Shimizu, Y.; Murakami, N.; Mori, T.; Takahashi, K.; Kubo, Y.; Yoshimoto, S.; Honma, Y.; Nakamura, S.; Okamoto, H.; Iijima, K.; et al. Clinical impact of p16 positivity in nasopharyngeal carcinoma. Laryngoscope Investig. Otolaryngol. 2022, 7, 994–1001. [Google Scholar] [CrossRef] [PubMed]
- Manoharan, M.; Kalman, N.S.; Rabinowits, G. Head and Neck Squamous Cell Carcinoma of Unknown Primary: A Diagnostic Work-Up. Oncologist 2024, 29, 192–199. [Google Scholar] [CrossRef] [PubMed]
- Magnes, T.; Wagner, S.; Kiem, D.; Weiss, L.; Rinnerthaler, G.; Greil, R.; Melchardt, T. Prognostic and Predictive Factors in Advanced Head and Neck Squamous Cell Carcinoma. Int. J. Mol. Sci. 2021, 22, 4981. [Google Scholar] [CrossRef] [PubMed]
- Eberly, H.W.; Sciscent, B.Y.; Lorenz, F.J.; Rettig, E.M.; Goyal, N. Current and Emerging Diagnostic, Prognostic, and Predictive Biomarkers in Head and Neck Cancer. Biomedicines 2024, 12, 415. [Google Scholar] [CrossRef] [PubMed]
- Makitie, A.A.; Agaimy, A.; Almangush, A. Insight into Classification and Risk Stratification of Head and Neck Squamous Cell Carcinoma in Era of Emerging Biomarkers with Focus on Histopathologic Parameters. Cancers 2022, 14, 5514. [Google Scholar] [CrossRef] [PubMed]
- Boguszewicz, L. Predictive Biomarkers for Response and Toxicity of Induction Chemotherapy in Head and Neck Cancers. Front. Oncol. 2022, 12, 900903. [Google Scholar] [CrossRef] [PubMed]
- Schanne, D.H.; Koch, A.; Elicin, O.; Giger, R.; Medová, M.; Zimmer, Y.; Aebersold, D.M. Prognostic and Predictive Biomarkers in Head and Neck Squamous Cell Carcinoma Treated with Radiotherapy-A Systematic Review. Biomedicines 2022, 10, 3288. [Google Scholar] [CrossRef]
- Bozec, A.; Culié, D.; Poissonnet, G.; Demard, F.; Dassonville, O. Current Therapeutic Strategies in Patients with Oropharyngeal Squamous Cell Carcinoma: Impact of the Tumor HPV Status. Cancers 2021, 13, 5456. [Google Scholar] [CrossRef]
- Machczyński, P.; Majchrzak, E.; Niewinski, P.; Marchlewska, J.; Golusiński, W. A review of the 8th edition of the AJCC staging system for oropharyngeal cancer according to HPV status. Eur. Arch. Otorhinolaryngol. 2020, 277, 2407–2412. [Google Scholar] [CrossRef]
- Kang, H.; Kennedy, T.A.; Yu, E. Head and Neck Squamous Cell Cancer: Approach to Staging and Surveillance. In Diseases of the Brain, Head and Neck, Spine 2024–2027: Diagnostic Imaging; Hodler, J., Kubik-Huch, R.A., Roos, J.E., Eds.; Springer Nature: Cham, Switzerland, 2024; pp. 251–264. [Google Scholar]
- Junn, J.C.; Soderlund, K.A.; Glastonbury, C.M. Imaging of Head and Neck Cancer With CT, MRI, and US. Semin. Nucl. Med. 2021, 51, 3–12. [Google Scholar] [CrossRef]
- Mukherjee, S.; Fischbein, N.J.; Baugnon, K.L.; Policeni, B.A.; Raghavan, P. Contemporary Imaging and Reporting Strategies for Head and Neck Cancer: MRI, FDG PET/MRI, NI-RADS, and Carcinoma of Unknown Primary-AJR Expert Panel Narrative Review. AJR Am. J. Roentgenol. 2023, 220, 160–172. [Google Scholar] [CrossRef] [PubMed]
- Van Hoe, S.; Hermans, R. Post-treatment surveillance imaging in head and neck cancer: A systematic review. Insights Imaging 2024, 15, 32. [Google Scholar] [CrossRef] [PubMed]
- Kim, S.Y.; Beer, M.; Vogel, D.W.T. Imaging in head and neck cancers: Update for non-radiologist. Oral Oncol. 2021, 120, 105434. [Google Scholar] [CrossRef] [PubMed]
- Karabay, N.; Bülbül, H.M.; Doğan, E.; İkiz, A.Ö.; Bülbül, G.; Sarioğlu, S. The correlations between dynamic contrast enhanced magnetic resonance imaging and immunohistochemical data in head and neck squamous cell carcinomas. Turk. J. Med. Sci. 2022, 52, 1950–1957. [Google Scholar] [CrossRef] [PubMed]
- Lenoir, V.; Delattre, B.M.A.; M’RaD, Y.; De Vito, C.; de Perrot, T.; Becker, M. Diffusion-Weighted Imaging to Assess HPV-Positive versus HPV-Negative Oropharyngeal Squamous Cell Carcinoma: The Importance of b-Values. AJNR Am. J. Neuroradiol. 2022, 43, 905–912. [Google Scholar] [CrossRef] [PubMed]
- Salzillo, T.C.; Taku, N.; Wahid, K.A.; McDonald, B.A.; Wang, J.; van Dijk, L.V.; Rigert, J.M.; Mohamed, A.S.; Wang, J.; Lai, S.Y.; et al. Advances in Imaging for HPV-Related Oropharyngeal Cancer: Applications to Radiation Oncology. Semin. Radiat. Oncol. 2021, 31, 371–388. [Google Scholar] [CrossRef]
- Bukovszky, B.; Fodor, J.; Székely, G.; Tóth, E.; Major, T.; Oberna, F.; Takácsi-Nagy, Z.; Polgár, C. Neck Node Squamous Cell Metastasis from Unknown Primary and Mutagen Sensitivity: A Case Series. Case Rep. Oncol. 2023, 16, 1598–1605. [Google Scholar] [CrossRef] [PubMed]
- Avery, E.W.; Joshi, K.; Mehra, S.; Mahajan, A. Role of PET/CT in Oropharyngeal Cancers. Cancers 2023, 15, 2651. [Google Scholar] [CrossRef]
- Mungai, F.; Verrone, G.B.; Pietragalla, M.; Berti, V.; Addeo, G.; Desideri, I.; Bonasera, L.; Miele, V. CT assessment of tumor heterogeneity and the potential for the prediction of human papillomavirus status in oropharyngeal squamous cell carcinoma. Radiol. Med. 2019, 124, 804–811. [Google Scholar] [CrossRef]
- Corti, A.; De Cecco, L.; Cavalieri, S.; Lenoci, D.; Pistore, F.; Calareso, G.; Mattavelli, D.; de Graaf, P.; Leemans, C.R.; Brakenhoff, R.H.; et al. MRI-based radiomic prognostic signature for locally advanced oral cavity squamous cell carcinoma: Development, testing and comparison with genomic prognostic signatures. Biomark. Res. 2023, 11, 69. [Google Scholar] [CrossRef]
- Bologna, M.; Corino, V.; Cavalieri, S.; Calareso, G.; Gazzani, S.E.; Poli, T.; Ravanelli, M.; Mattavelli, D.; de Graaf, P.; Nauta, I.; et al. Prognostic radiomic signature for head and neck cancer: Development and validation on a multi-centric MRI dataset. Radiother. Oncol. 2023, 183, 109638. [Google Scholar] [CrossRef] [PubMed]
- Leijenaar, R.T.; Walsh, S.; Vaidyanathan, A.; Aliboni, L.; Sanchez, V.L.; Leech, M.; Joyce, R.; Gillham, C.; Kridelka, F.; Hustinx, R.; et al. External validation of a radiomic signature to predict p16 (HPV) status from standard CT images of anal cancer patients. Sci. Rep. 2023, 13, 7198. [Google Scholar] [CrossRef] [PubMed]
- Glogauer, J.; Kohanzadeh, A.; Feit, A.; Fournier, J.E.; Zians, A.; Somogyi, D.Z. The Use of Radiomic Features to Predict Human Papillomavirus (HPV) Status in Head and Neck Tumors: A Review. Cureus 2023, 15, e44476. [Google Scholar] [CrossRef] [PubMed]
- Lee, S.; Park, S.; Rim, C.H.; Lee, Y.H.; Kwon, S.Y.; Oh, K.H.; Yoon, W.S. A Potential Radiomics-Clinical Model for Predicting Failure of Lymph Node Control after Definite Radiotherapy in Locally Advanced Head and Neck Cancer. Medicina 2024, 60, 92. [Google Scholar] [CrossRef]
- Bernatz, S.; Böth, I.; Ackermann, J.; Burck, I.; Mahmoudi, S.; Lenga, L.; Martin, S.S.; Scholtz, J.E.; Koch, V.; Grünewald, L.D.; et al. Radiomics for therapy-specific head and neck squamous cell carcinoma survival prognostication (part I). BMC Med. Imaging 2023, 23, 71. [Google Scholar] [CrossRef]
- Huynh, B.N.; Groendahl, A.R.; Tomic, O.; Liland, K.H.; Knudtsen, I.S.; Hoebers, F.; van Elmpt, W.; Malinen, E.; Dale, E.; Futsaether, C.M. Head and neck cancer treatment outcome prediction: A comparison between machine learning with conventional radiomics features and deep learning radiomics. Front. Med. 2023, 10, 1217037. [Google Scholar] [CrossRef] [PubMed]
- Li, Q.; Xu, T.; Gong, J.; Xiang, S.; Shen, C.; Zhou, X.; Hu, C.; Wu, B.; Lu, X. Applying multisequence MRI radiomics of the primary tumor and lymph node to predict HPV-related p16 status in patients with oropharyngeal squamous cell carcinoma. Quant. Imaging Med. Surg. 2023, 13, 2234–2247. [Google Scholar] [CrossRef] [PubMed]
- Boot, P.A.; Mes, S.W.; de Bloeme, C.M.; Martens, R.M.; Leemans, C.R.; Boellaard, R.; van de Wiel, M.A.; de Graaf, P. Magnetic resonance imaging based radiomics prediction of Human Papillomavirus infection status and overall survival in oropharyngeal squamous cell carcinoma. Oral Oncol. 2023, 137, 106307. [Google Scholar] [CrossRef] [PubMed]
- Cozzi, L.; Franzese, C.; Fogliata, A.; Franceschini, D.; Navarria, P.; Tomatis, S.; Scorsetti, M. Predicting survival and local control after radiochemotherapy in locally advanced head and neck cancer by means of computed tomography based radiomics. Strahlenther. Onkol. 2019, 195, 805–818. [Google Scholar] [CrossRef]
- Haider, S.P.; Mahajan, A.; Zeevi, T.; Baumeister, P.; Reichel, C.; Sharaf, K.; Forghani, R.; Kucukkaya, A.S.; Kann, B.H.; Judson, B.L.; et al. PET/CT radiomics signature of human papilloma virus association in oropharyngeal squamous cell carcinoma. Eur. J. Nucl. Med. Mol. Imaging 2020, 47, 2978–2991. [Google Scholar] [CrossRef]
- Boca, B.; Caraiani, C.; Popa, L.; Lebovici, A.; Feier, D.S.; Bodale, C.; Buruian, M.M. The Utility of ADC First-Order Histogram Features for the Prediction of Metachronous Metastases in Rectal Cancer: A Preliminary Study. Biology 2022, 11, 452. [Google Scholar] [CrossRef] [PubMed]
- Rodrigues, A.; Loman, K.; Nawrocki, J.; Hoang, J.K.; Chang, Z.; Mowery, Y.M.; Oyekunle, T.; Niedzwiecki, D.; Brizel, D.M.; Craciunescu, O. Establishing ADC-Based Histogram and Texture Features for Early Treatment-Induced Changes in Head and Neck Squamous Cell Carcinoma. Front. Oncol. 2021, 11, 708398. [Google Scholar] [CrossRef] [PubMed]
- Fujima, N.; Homma, A.; Harada, T.; Shimizu, Y.; Tha, K.K.; Kano, S.; Mizumachi, T.; Li, R.; Kudo, K.; Shirato, H. The utility of MRI histogram and texture analysis for the prediction of histological diagnosis in head and neck malignancies. Cancer Imaging 2019, 19, 5. [Google Scholar] [CrossRef] [PubMed]
- Fujima, N.; Shimizu, Y.; Yoshida, D.; Kano, S.; Mizumachi, T.; Homma, A.; Yasuda, K.; Onimaru, R.; Sakai, O.; Kudo, K.; et al. Multiparametric Analysis of Tumor Morphological and Functional MR Parameters Potentially Predicts Local Failure in Pharynx Squamous Cell Carcinoma Patients. J. Med. Investig. 2021, 68, 354–361. [Google Scholar] [CrossRef]
- van der Hulst, H.J.; Vos, J.L.; Tissier, R.; Smit, L.A.; Martens, R.M.; Beets-Tan, R.G.; van den Brekel, M.W.; Zuur, C.L.; Castelijns, J.A. Quantitative Diffusion-Weighted Imaging Analyses to Predict Response to Neoadjuvant Immunotherapy in Patients with Locally Advanced Head and Neck Carcinoma. Cancers 2022, 14, 6235. [Google Scholar] [CrossRef]


Disclaimer/Publisher’s Note: The statements, opinions and data contained in all publications are solely those of the individual author(s) and contributor(s) and not of MDPI and/or the editor(s). MDPI and/or the editor(s) disclaim responsibility for any injury to people or property resulting from any ideas, methods, instructions or products referred to in the content. |
© 2024 by the authors. Licensee MDPI, Basel, Switzerland. This article is an open access article distributed under the terms and conditions of the Creative Commons Attribution (CC BY) license (https://creativecommons.org/licenses/by/4.0/).
Share and Cite
Bicci, E.; Calamandrei, L.; Di Finizio, A.; Pietragalla, M.; Paolucci, S.; Busoni, S.; Mungai, F.; Nardi, C.; Bonasera, L.; Miele, V. Predicting Response to Exclusive Combined Radio-Chemotherapy in Naso-Oropharyngeal Cancer: The Role of Texture Analysis. Diagnostics 2024, 14, 1036. https://doi.org/10.3390/diagnostics14101036
Bicci E, Calamandrei L, Di Finizio A, Pietragalla M, Paolucci S, Busoni S, Mungai F, Nardi C, Bonasera L, Miele V. Predicting Response to Exclusive Combined Radio-Chemotherapy in Naso-Oropharyngeal Cancer: The Role of Texture Analysis. Diagnostics. 2024; 14(10):1036. https://doi.org/10.3390/diagnostics14101036
Chicago/Turabian StyleBicci, Eleonora, Leonardo Calamandrei, Antonio Di Finizio, Michele Pietragalla, Sebastiano Paolucci, Simone Busoni, Francesco Mungai, Cosimo Nardi, Luigi Bonasera, and Vittorio Miele. 2024. "Predicting Response to Exclusive Combined Radio-Chemotherapy in Naso-Oropharyngeal Cancer: The Role of Texture Analysis" Diagnostics 14, no. 10: 1036. https://doi.org/10.3390/diagnostics14101036