Article

Tribological Behavior of Friction Materials Containing Aluminum Anodizing Waste Obtained by Different Industrial Drying Processes

by
Giovanni Straffelini
1,
Priyadarshini Jayashree
1,*,
Andrea Barbieri
2 and
Roberto Masciocchi
2
1
Department of Industrial Engineering, University of Trento, Via Sommarive, 9, 38123 Trento, Trentino, Italy
2
Ossicolor SRL, Localita’ Fontanelle, 126, 38010 Spormaggiore, Trentino, Italy
*
Author to whom correspondence should be addressed.
Lubricants 2024, 12(5), 173; https://doi.org/10.3390/lubricants12050173
Submission received: 12 March 2024 / Revised: 25 April 2024 / Accepted: 6 May 2024 / Published: 11 May 2024
(This article belongs to the Special Issue Emission and Transport of Wear Particles)

Abstract

:
With sustainability dominating the industry, recycling the generated waste from different processes is becoming increasingly important. This study focuses on recycling waste generated during aluminum anodizing waste (AAW) in friction material formulations for automotive braking applications. However, before utilization, the waste needs to be pre-treated, which mainly involves drying. Hence, four different industrial drying methods were studied to dry the AAW, and the corresponding characteristics were observed by evaluating its residual humidity and crushability index. The waste powders were further characterized using FT-IR and SEM/EDXS to understand their constituents. The initial analysis showed that the waste subjected to the drying process P2 and P1 with the lowest final humidity fetched the most desirable results, with P1 having the simpler drying procedure. The AAW powders were added in a commercial friction material formulation at 6 and 12 wt.% and subjected to friction, wear, and non-exhaust particulate matter analysis. The worn surfaces were analyzed using SEM/EDXS evaluation to understand the extension and composition of the deposited secondary contact plateaus. It was seen that the 12 wt.% addition of waste processed using the P1 technique provided the most satisfactory friction, wear, and emission characteristics, along with expansive secondary contact plateaus with a good contribution of the waste in its formation. This study showed a good relationship between the processing method and a formulation’s tribological and emission characteristics, thereby paving the way for using this drying method for other waste requiring pre-treatment.

1. Introduction

Aluminum and its alloys are the material of choice, especially for automotive, mineral processing, and aerospace applications, due to its high performance, low weight, and high thermal conductivity. Furthermore, aluminum matrix composites (AMCs) are known for their enhanced mechanical and thermal properties like high strength, ductility, modulus, corrosion resistance, high temperature creep resistance, low thermal expansion coefficient, and good fatigue strength. Furthermore, ceramic materials like alumina, SiC, and MgO, used in these matrices, are well-known for their elevated hardness, refractoriness, corrosion resistance, etc. Lastly, aluminum is particularly known for its recyclable properties, rendering it to be a prime contender for circular economy [1,2,3,4]. With rapid industrialization, the need to effectively recycle the corresponding generated waste is paramount. The current norm while recycling is landfilling, which is considered an undesirable alternative as it leads to soil pollution and the depletion of available lands [5]. Usually, recycling refers to using waste generated from one process as the raw material for another system. Unfortunately, much of the generated waste cannot be completely reused, leading to environmental and economic repercussions. One such example is aluminum anodizing waste (AAW) [6].
Aluminum anodizing consumes a large amount of water and produces significant waste, often subjected to treatment, and disposed of in landfills and sewage systems. Usually, the waste is made of 85 wt.% of water, aluminum hydroxide, calcium or sodium, and aluminum sulfates. AAW is classified as being inert and non-hazardous. Due to its nature and characteristics, the AAW has a strong potential to act as a raw material for other processes/applications. Furthermore, recycling this waste is considered lucrative for economic, environmental, and technological purposes—economical for the recycling capabilities and waste deposition costs, environmental for the reduced impact on the environment from the AAW disposal, and technological for the AAW’s ability to be recycled for manufacturing other products [6,7].
A pilot study conducted on the AAW by the authors [7] established that the waste can be efficiently used as a mild abrasive in different friction material formulations for automotive braking applications. Car friction materials broadly contain binders, reinforcements, fillers, and friction modifiers. Friction modifiers are classified into lubricants and abrasives [8]. Abrasives effectively help in the elevation and stabilization of friction traces and the removal of any carbonaceous products deposited on the counterface surface. With the addition of tested waste in friction material composition, not only will the recycling and reusing goals of the industries be realized, but it will also help reduce the production costs of friction pads [9].
However, from previous laboratory tests [6,7], it is seen that the AAW cannot be directly incorporated into any friction material formulation without undergoing proper pre-treatment procedures. As mentioned previously, the as-received waste mainly consists of aluminum hydroxide with a high water content. The water content must be removed to the maximum extent possible to successfully add in a formulation without compromising its structural integrity and performance. Therefore, the pre-treatment of the waste includes drying and crushing it to obtain a feasible and fine product. Hence, this study focuses on different industrial drying processes for removing the water/moisture content from the AAW. The humidity content is expected to affect crushability, but it is unclear if it may affect the tribological behavior of friction materials. This is a rather important issue since the humidity content is difficult to control even within the same process properly. Therefore, it is a pivotal parameter to be observed/evaluated.
After the different industrial treatments, the final products were added in a commercially employed friction material formulation at 6 and 12 wt.% content. The modified formulations with the waste were subjected to friction, wear, and emission analysis on a pin-on-disc testing equipment. Concerning the emission analysis, any new formulations or existing compositions with modifications must adhere to Euro7 or emit non-exhaust particulate matter emissions (PM) that are as low as possible [10]. The release of non-exhaust PM is a great concern as it seriously affects human health and the environment [11]. This study sheds light on the various characteristics of heat-treated waste. It compares the most desirable treatment process through the most feasible friction, wear, and emission characteristics and deposited secondary contact plateaus on the worn surfaces. Though this study is specific to a particular waste type, the drying methods could be incorporated into any produced industrial waste with a significantly high moisture content.

2. Materials and Methods

2.1. Materials

The AAW was produced in Ossicolor SRL, Spormaggiore, Trentino, Italy. It is very moist (high water content, approx. 85%) due to the anodizing process. Additionally, the waste is dull grey and clumped together [7].
The as-received AAW was subjected to four kinds of drying treatment before being crushed and added to friction material formulations. The names of the companies where the drying treatment occurred are not mentioned due to confidentiality. The processes are named P1, P2, P3, and P4. The details of the drying method for each process are provided in Table 1, along with the average air temperature while drying.
The dried AAW powders were subjected to a few analyses and compared with reference material. This reference was the as-received AAW, heat-treated in a laboratory furnace to 400 °C for 4.5 h to eliminate any moisture content. The reference was named ‘Lab Heating’. This reference was further subjected to friction, wear, and emission analysis in a previous study and was deemed to provide satisfactory characteristics [7].
The dried AAW powders and the reference were first analyzed for residual humidity. To calculate this, the dried waste was subjected to a further heat treatment at 200 °C for two hours. The residual humidity was calculated by weighing the powders before and after drying. Furthermore, the crushability index of the dried AAW and reference powders was also evaluated. This was carried out by weighing a predetermined powder weight (50 g) and grinding it for 30 s, and then weighing the powders collected after sieving them to obtain particle size below 90 microns. A crushability index was then introduced, defined as the difference between the initial and final powder weighed before and after crushing and sieving.
The different heat-treated AAWs were added in an already commercially employed friction material formulation (CFM). Table 2 shows the CFM constituents. The full CFM composition is not revealed for confidentiality reasons, but the main ingredients are shown [12].
The CFM is highly optimized, extensively tested, and used in high-speed cars. The previous study showed that friction material formulations’ most desirable AAW content is less than 12 wt.% [7]. Hence, in this study, 6 and 12 wt.% of P1, P2, P3, and P4 dried AAW were added to the formulation. To accommodate the AAW additions, the CFM composition was uniformly reduced to 94 and 88 wt.% to incorporate the 6 and 12 wt.% additions, respectively. This was carried out as CFM is highly sensitive to any changes in its composition and could affect its friction, wear, and emission features. From previous studies, it is already known that the AAW behaves as a mild abrasive; hence, any change in its characteristics would be attributed to the addition of waste. A reference composition with no waste was also tested to compare the tribological and emission features of the waste containing CFM.
All the CFM and its variations were tested in the form of pins, which were produced in-house using a standardized procedure [9,13,14]. The AAW waste added in this study were all sieved to have particle size less than 90 micron to completely mix with the CFM constituents without settling at the bottom of the container. The CFM with the AAW content was weighed and continuously mixed using a TURBULA® mixer (Muttenz, Switzerland) for one hour. The pins were produced using a hot-press procedure. The required amount of mixture was ‘tap-pressed’ in tool steel cylindrical mold, and the process was carried out in a BUEHLER® hot mounting press (Lake Bluff, IL, USA) at a compaction pressure of 100 MPa, temperature of 150 °C, and holding time of 10 min, producing the green body. The last step was to cure the green body specimens for 4 h at 200 °C in a generic muffle furnace.
The pins were paired against a pearlitic grey cast iron counterface surface tested in discs. The material was chosen as it is usually used as a counterface for automotive braking applications. The discs had a diameter of 60 mm and a thickness of 6 mm. The properties and the constituents of the disc material are shown in Table 3.

2.2. Pin-on-Disc and Emission Analysis

The friction, wear, and non-exhaust PM analysis on the reference CFM and its corresponding variations with the heat-treated waste was conducted on a pin-on-disc (PoD) testing equipment (make: Ducom, India). The PoD apparatus was selected for this study as it provides quick yet reliable results when preliminary studies are considered. In this study, the main intention was to find the most desirable heat treatment for AAW. Once the best process is determined, the next step involves specific dynamometric tests. For the tests, the average pin height and diameter were 10 mm. Before any trial, wherein a fresh disc was always employed, the discs were cleaned with 180-grit SiC paper and wiped with acetone repeatedly to rid the surface of any impurities and dirt. All trials were conducted at ambient temperature. The relative humidity of the lab was not controlled but regularly monitored, and it varied between 45–50%. All tests were conducted within ten days to have the same humidity throughout the trials. The testing conditions employed were a sliding velocity of 1.51 m/s and a constant contact pressure of 1 MPa, which is 79 N for 10 mm diameter pins. These testing conditions denote the mild braking conditions, typically used to observe the characteristics of the formed and deposited secondary contact plateaus on the worn mated surfaces [9]. To attain proper contact/conformance between the pin and disc surfaces, a 30 min run-in procedure was conducted. The actual tests were continuously conducted for 90 min to establish the friction layer on the mated surfaces properly. All compositions were tested four times to obtain repeatability in the results.
Figure 1 shows the schematics of the PoD testing equipment with the apparatus attached to measure the PM/emissions. Site A shows the introduction of ambient air from the lab, which is pulled in by the fan (B). The air is purified by passing it through a High-Efficiency Particulate Air (HEPA) filter (C), leading to the introduction of clean air inside the equipment chamber (D). The air velocity was maintained at 11.5 m/s, a magnitude obtained from previous studies [15]. Before the beginning of any trial, the air cleanliness was inspected and kept below 10 #/cm3.
Concerning emissions, to obtain the particle concentration, the air with the airborne PM is fed into a TSI® (TSI Incorporated, Shoreview, MN, USA) Optical Particle Sizer Spectrometer (OPS, model 3330) at site F in Figure 1. The OPS has the following features—total particle number concentration between the size range of 0.3 μm to 10 μm. The OPS is divided into 16 channels and has a sampling frequency of 1 Hz. It can record particle number concentrations up to 3000 #/cm3. Lastly, the equipment has a self-controlled sampling flow rate of 1 l/min.
The instantaneous friction coefficient (CoF) and emissions magnitude were directly procured from the software connected to the PoD and OPS, respectively. The specific wear coefficient (pin wear) was obtained by weighing the pins before and after each trial using an analytical weighing balance with a precision of 10−4 g and the following equation:
K a = V ( F × d )
where: V: wear volume loss; F: load applied; and d: sliding distance (~8150 m).

2.3. Characterization of the Worn Surfaces and Materials

To obtain their composition, the different heat-treated AAWs were subjected to Fourier-Transform Infrared Spectroscopy (FT-IR, Varian Excalibur series 4100, Palo, Alto, CA, USA) analyses. The pins’ worn surfaces and the AAW particles’ morphologies were obtained through SEM (JEOL IT300, JEOL, Tokyo, Japan), attached with Energy-Dispersive X-ray Spectroscopy (EDXS; Bruker, Billerica, MA, USA) system.

3. Results and Discussion

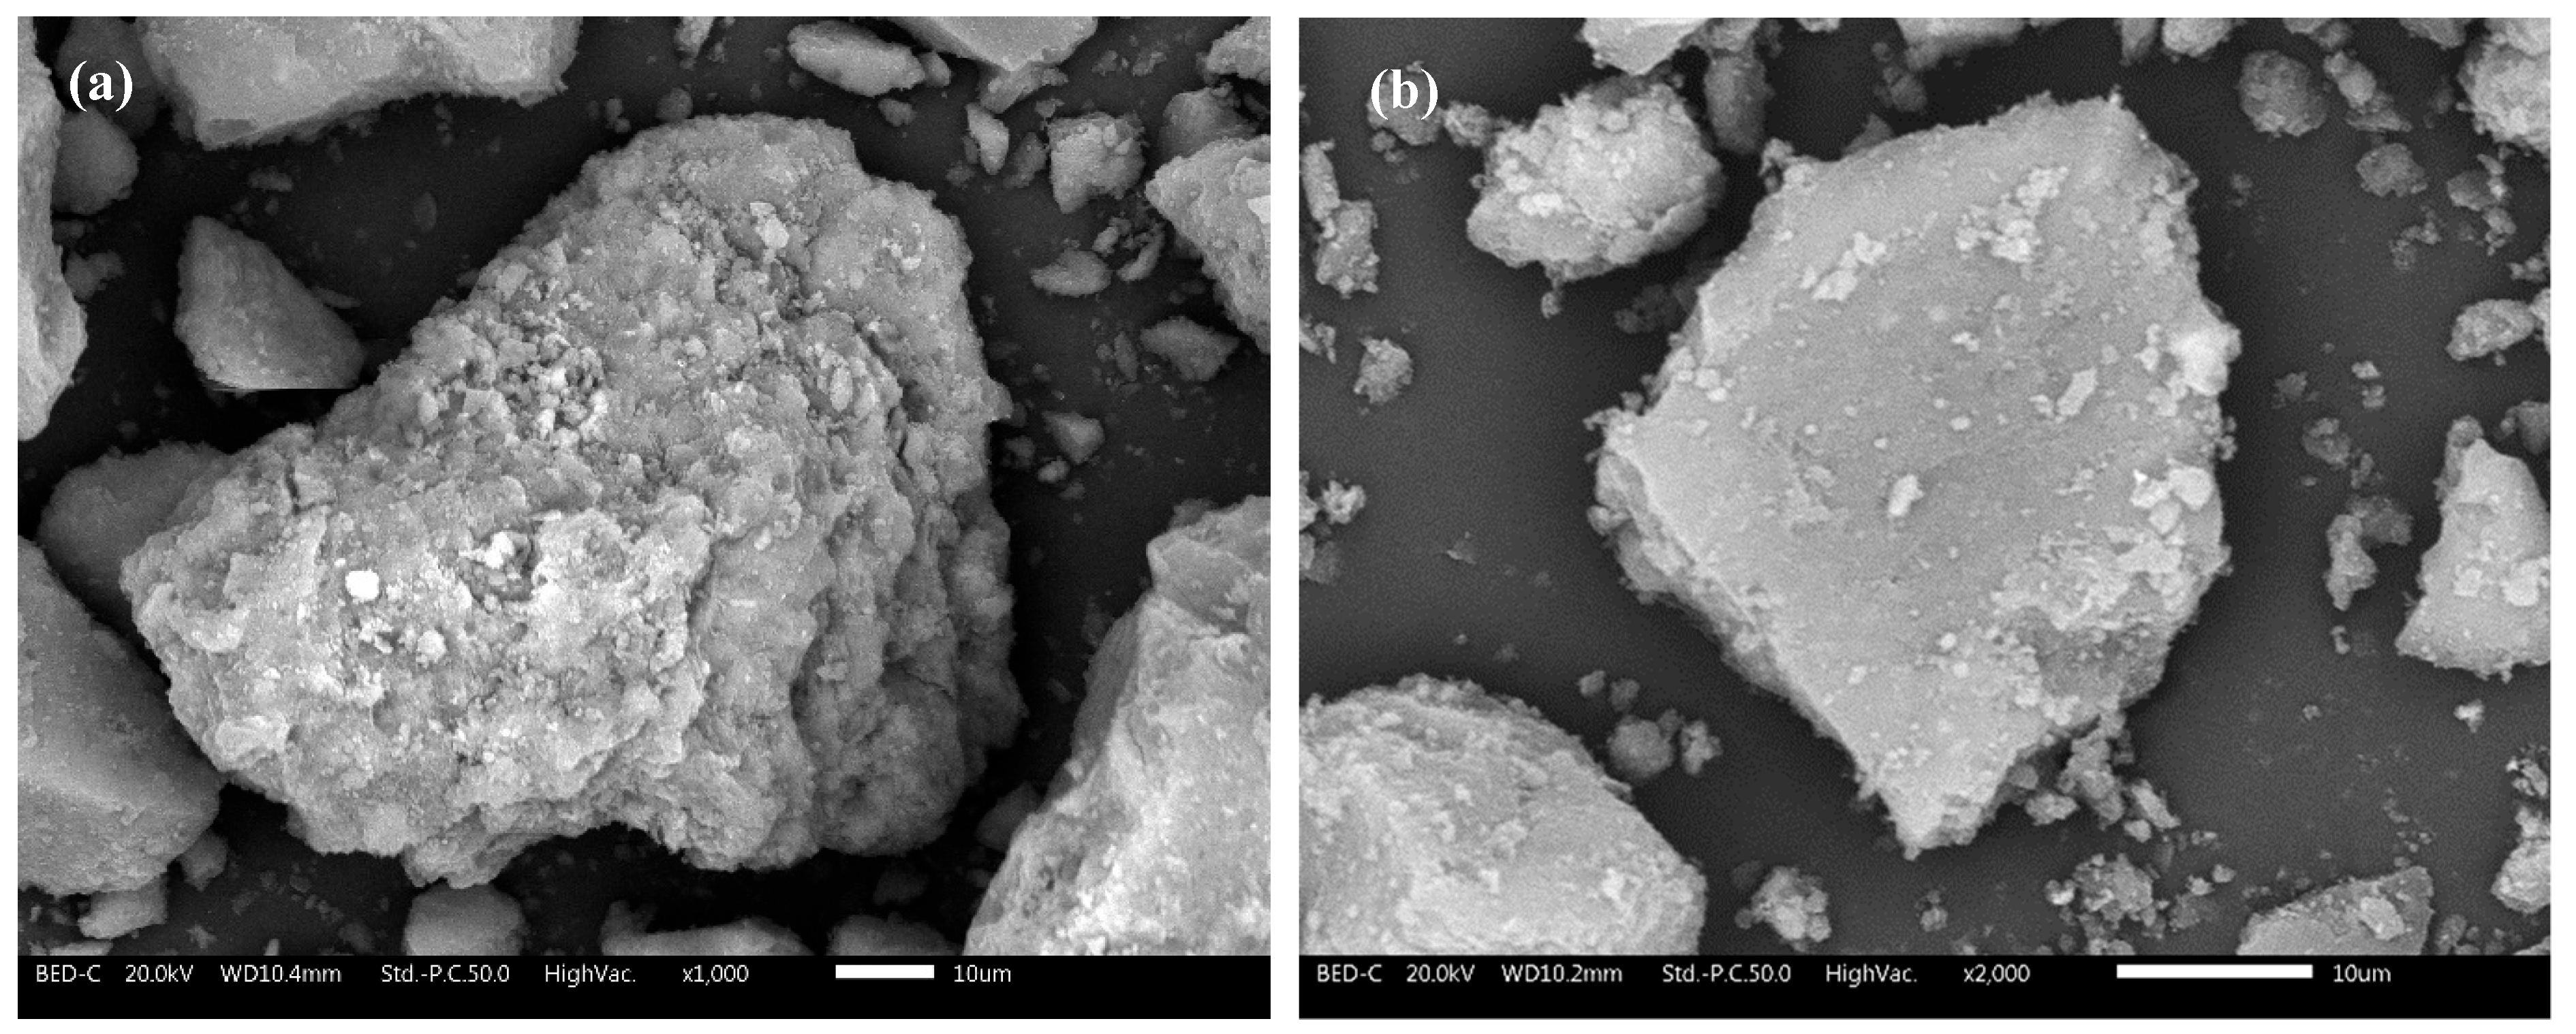
3.1. Various Industrially Dried AAW Characterization

Figure 2 compares humidity (Figure 2a), crushability index (Figure 2b), and crushability index with humidity (Figure 2c). Figure 2a shows that the humidity is the least for the lab-heated specimens, followed by P2, P1, P4, and P3. The relative humidity of P1 and P2, and P3 and P4 varies between 9–14 wt.% and 20–30 wt.%, respectively. Figure 2b shows lab heating, P2, P1, and P4 have the highest crushability index, in that order, while P3 provides the least. Lastly, Figure 2c shows the combined effect of the humidity and crushability index. It is well-known that the humidity and crushability index are proportional [16]. Due to this, the reference lab heating has the highest magnitude compared to other samples. However, it must be noted that the reference lab heating conditions cannot be used for industrial drying, as it requires a high temperature (400 °C) for a long time (4.5 h), which may not be economically feasible and could produce environmentally harmful off-gases. The ideal candidate is P2, with a low humidity and a high crushability index. However, Table 1 shows that, compared to P1, an additional vacuum treatment was conducted, which could again be economically not feasible in long run. Considering this, P1 has a higher crushability than P4 and P3 without additional treatment steps (vacuum) and like P2 (±5%). Hence, P2 and P1 could potentially be viable candidates for the ease of crushing and a suitable drying method.
A note from Table 1: P1 and P4 have the same drying method. However, the major difference is the drying temperature. P1 employs drying between 70–80 °C, whereas P4 uses 40–50 °C. It could be noted that, although the difference in the drying temperature may not be significant, a temperature close to 100 °C could effectively help in the thorough removal of moisture content. Now, consider P1 and P2. Again, the method is similar except for the vacuum in P2. This is an added step and could result in higher production costs. Lastly, P3 employs the same drying methods as its counterpart. However, the duration is 32 h, which, in the long run, may not be feasible from an industrial point of view.
To understand the phases present in the AAW, XRD analysis was conducted on the various heat-treated samples. However, the phases could not be recognized due to their extremely amorphous nature. However, to understand the composition of the different heat-treated AAWs, the powders were subjected to FT-IR analysis, as shown in Figure 3. The FT-IR graph includes the composition information of all AAW samples, along with alumina as a reference and the as-received AAW. According to the FT-IR database, the graph can be divided into four parts. Areas 1 and 2 are O-H (water and/or Al-hydroxide) [6,7]. The third area is the sulfate (SO4, Al sulfate hydrate), and the last area is the alumina, as can be seen from the curves of the reference alumina. Where the as-received AAW is concerned, the curves in Areas 1 and 2 are comparatively the deepest. However, with the heat treatment, the curves shrink significantly. The heat-treated AAWs have a similar O-H content, ranging from 15% to 25%. Like Areas 1 and 2, Area 3 (Al sulfate hydrate) observes a high content in the case of the as-received AAW, the curves shrinking with the introduction of heat treatment in the case of the P1, P2, P3, and P4 AAW. Lastly, all specimens show the presence of alumina in Area 4, inferring an alumina presence with or without heat treatment. Nevertheless, without a proper XRD evaluation, the exact phase cannot be determined and is referred to as AlOx. With the presence of AlOx, the theory of AAW potentially behaving as an abrasive is reinforced.
Figure 3 can be compared to the humidity measurements in Figure 2a. The as-received AAW has the highest humidity content, which is to be expected. The shallowest curves are seen for lab heating in Sections 1, 2, and 3, agreeing with the low humidity content in Figure 2a.
The heat-treated AAWs were also subjected to SEM/EDXS evaluation under two categories—full-frame and point/object EDXS analyses. Concerning the particle morphology, as an example, Figure 4 and Figure 5 show the low and high magnification images of P4 AAW. The particles appear to have smooth surfaces and sharp edges due to the brittle nature of the AAW particles and the crushing process after AAW drying. Similar results are also seen in Figure 5, wherein the focus is exclusively on two separate particles. Two categories of particle morphologies were observed. Figure 5a shows a particle with a flaky texture on the surface, whereas Figure 5b shows the typical particle with a smooth surface and pointed edge. Table 4 denotes the full-frame EDXS analysis of all heat-treated AAWs. The table shows a high Al and O content and minor constituents, which agrees with the FT-IR analysis. Similarly, Table 5 shows the average point EDXS analysis conducted on ten different particles for all heat-treated AAW particles. The results are like Table 4, with high amounts of Al and O. The presence of other minor elements includes Ca, Fe, Sn, and S. From the EDXS analysis, the AAWs are observed to have a lot of Al and O content, thereby confirming the presence of Al oxides and validating their abrasive nature.
Lastly, the average pin density of all the heat-treated AAWs at a 6 and 12 wt.% addition is shown in Figure 6. The density was calculated from ten pins for each composition [9,13,17,18]. Let us first consider the pins with 6 wt.% AAW additions. Compared to the reference, P1, P2, and P4 have a higher density, whereas P3 has a similar density. Concerning the pins with a 12 wt.% AAW content, compared to the reference, the general trend is the reduction of density with the addition of 12 wt.% AAW. Only P3 has a higher density compared to the reference. Hence, from the density analysis, the higher the addition of AAW, the lower the pin density. Nevertheless, in all cases, the pin density ranges between 2.05–2.4 g/cm3.

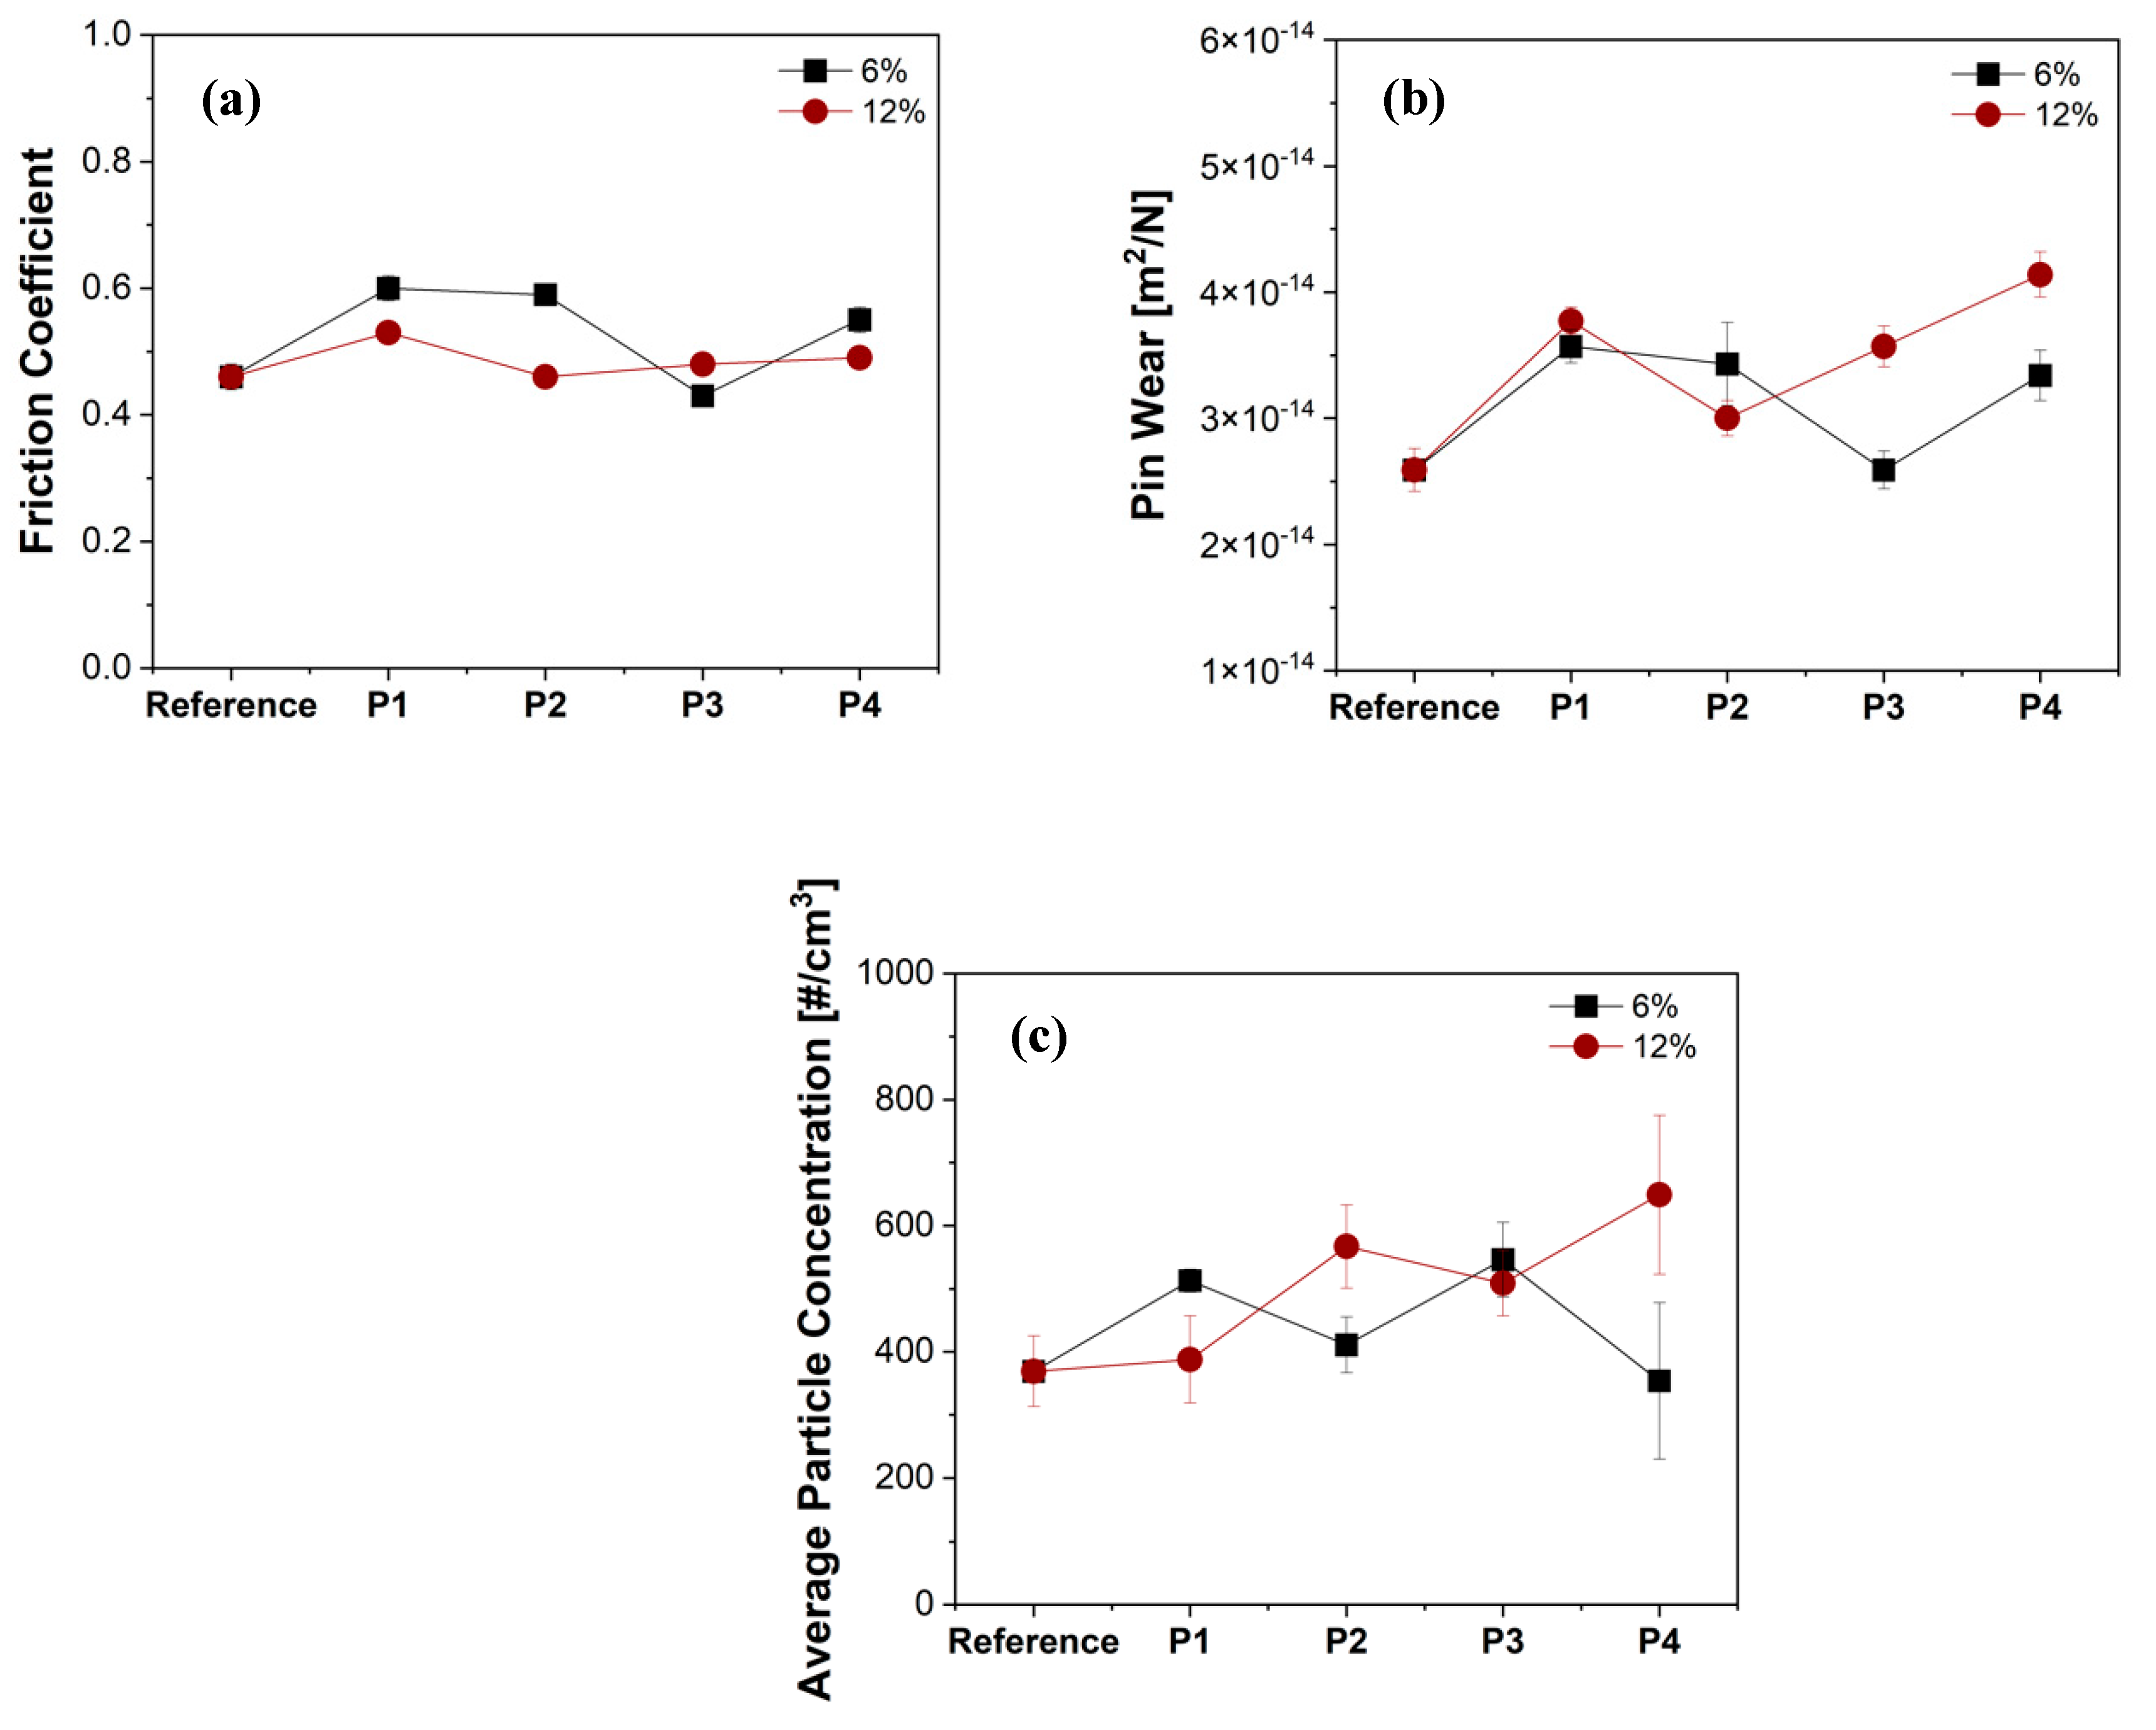
3.2. Friction, Wear, and Emission Analysis

Figure 7a,b show the typical friction curves of all heat-treated AAW at a 6 and 12 wt.% addition. All the AAW curves are compared with the reference composition containing no AAW. In Figure 7, the reference is represented by a black curve. In this case, we see an initial increase in the traces, followed by a gradual reduction and subsequent stabilization of the friction trace. The curve has no appreciable fluctuations and demonstrates a long steady state. Concerning friction traces at 6 wt.%, in Figure 7a, all traces except for P3 have elevated CoF curves compared to the reference. Like the reference, all traces observe a long steady state without any considerable fluctuations. With 12 wt.% waste additions, in Figure 7b, the results are similar to Figure 7a for steady-state attainment and maintenance. The major difference is that the CoF traces of the waste have a similar magnitude compared to the reference material.
Figure 8a,b represents the typical emission characteristics of the reference, with a 6 and 12 wt.% waste addition, respectively. In Figure 8, the black trace shows the reference curve. The mild fluctuations are characteristics of the emission curves. The reference curve attains stability right from the early part of the test and continues until the end of the test. In the 6 wt.% addition, Figure 8a, we see that the heat-treated waste has difficulty attaining a long steady state with minimum fluctuations. On the other hand, in the case of 12 wt.% addition, Figure 8b, P1 was able to attain characteristics and a magnitude similar to that of the reference. The rest of the heat-treated waste had elevated and highly fluctuated traces.
Figure 9 compares the average steady-state CoF, pin wear, and average particle concentration of the reference with all the heat-treated AAWs at a 6 and 12 wt.% addition. Figure 9a compares the steady-state CoF for both percentage additions. Consider the 6 wt.% addition first. The general trend is an increase in the steady-state CoF except P3, which has a similar CoF as the reference. On the other hand, in the case of the 12 wt.% addition, the steady-state CoF of the reference and all the heat-treated AAWs are quite similar to each other, varying between 0.45 and 0.5. Figure 9b shows the pin wear of the reference and all the heat-treated AAWs at both additions. Interestingly, in both cases, except for the 6 wt.% P3, all other compositions have a higher pin wear compared to the reference. However, it must be noted that, although the wear is higher, the pin wear for all the samples is still in the same wear regime—mild to severe (above 2 × 10⁻¹⁴ and below 10−13 m2/N) [19]. Additionally, in this case, all pin wear was between 2.5–4 × 10⁻¹⁴ m2/N, which is acceptable. Lastly, the average particle concentration/emissions are compared in Figure 9c. Similar to the pin wear, the general trend depicts an increase in emissions with the addition of waste. The only exception is P1 at a 12 wt.% addition and P4 at a 6 wt.% addition. However, P4 has a higher data scatter compared to P1, which has a similar emission magnitude as the reference. From the friction, wear, and emission analysis, the P1 addition at 12 wt.% provides similar characteristics as the reference, thereby enforcing a relationship between the drying method and wear and emission characteristics. Another note to be added here is the role of the AAW addition towards the tribological and emission characteristics. The AAW is, in general, beneficial regarding the friction coefficient (because of the known mild abrasive nature of the powder) and slightly negative regarding wear and emissions. However, in any case, the pin wear and emissions remain rather low and in the permissible range (Figure 9b,c).
Figure 10 shows the worn surface characteristics of the reference pin. Typically, the worn surfaces have certain features in a friction material for automotive braking applications, as shown in Figure. The surface usually contains primary contact plateaus, mainly steel fibers (reinforcements). The primary contact plateaus usually help in the deposition, collection, and compaction of wear debris against them. These compacted grey masses (shown in Figure) are secondary contact plateaus. The secondary contact plateaus are mainly caused by the oxidized wear debris detached from the counterface surface. Hence, they mainly constitute Fe oxides. The expansion and compaction of the secondary contact plateaus help regulate the wear and emission characteristics of any system. Apart from these constituents, the worn surfaces could also demonstrate the presence of graphite and vermiculite. In Figure 10, we see a considerable presence of graphite and steel fibers for the reference specimen. The secondary contact plateaus are well-spread but are in the form of small islands and are not very well-extended.
Figure 11a–d show the worn surface characteristics of P1, P2, P3, and P4 AAWs at 12 wt.%. The features and constituents are similar to Figure 10. The difference (Figure 11) is the extension of the secondary contact plateaus. Figure 11a,d have higher secondary contact plate extension extensions than Figure 11b,d. Similar results were also seen for the 6 wt.% additions, with P1 and P4 having a higher secondary contact plateau coverage.
Lastly, point/object EDXS analyses were conducted on ten deposited secondary contact plateau sites on the worn AAW specimens at a 12 wt.% content, along with the reference. The results are shown in Table 6. In all cases, there is a high Fe and O content, inferring Fe oxides to be the main constituent. An interesting observation is the Al content. The Al content is observed to increase with the AAW content, showing a good contribution of the AAW towards the development and sustenance of the secondary contact plateaus. P1 and P3 show the highest Al content. Lastly, in all cases, minor elements like Mg, Si, S, Zn, and Sn are also seen.
Hence, from the SEM/EDXS analysis, it was seen that P1 fared well concerning the extension, as well as the AAW content in the secondary contact plateaus. Hence, from the perspective of drying, wear, emissions, and worn surface characteristics, P1 is an ideal drying method choice.
Lastly, a comment on the residual humidity (Figure 2): From the PoD and worn surface analysis, no role of the residual humidity can be recognized. Hence, it does not play a role in the production stages. However, it is well-known that residual humidity after a certain extent (e.g., 80 wt.%) can alter the tribological characteristics and structural integrity of the specimens [7]. Here, in all cases, the typical contact plateaus are formed (Figure 11), and, in such plateaus, the contact temperature is rather high, rendering any role of residual humidity negligible [20].

4. Conclusions

This study explored the utilization of different drying methods in the pre-treatment of aluminum anodizing waste. Four treatments were utilized, and the waste powders were subjected to residual humidity, crushability index, FT-IR, and SEM/EDX analysis. The dried and crushed powders were added in a commercially employed friction material formulation and subjected to tribological and non-exhaust particulate matter analysis. The worn pin surfaces were analyzed using SEM/EDXS.
  • From the initial drying methods observations, P2 had the most feasible procedure, and the drying temperature was feasible but effective. Furthermore, the P1 results concerning the relative humidity and crushability index were also satisfactory with a simple drying procedure.
  • The FT-IR and SEM/EDX analysis showed the presence of Al, O, and alumina for all the dried waste powders.
  • Regarding the friction, wear, and emission characteristics, P1 showed a stable and allowable CoF, pin wear, and emission magnitude when compared to other drying methods. Through this, it was seen that there is a direct relationship between the drying method and tribological and emission characteristics.
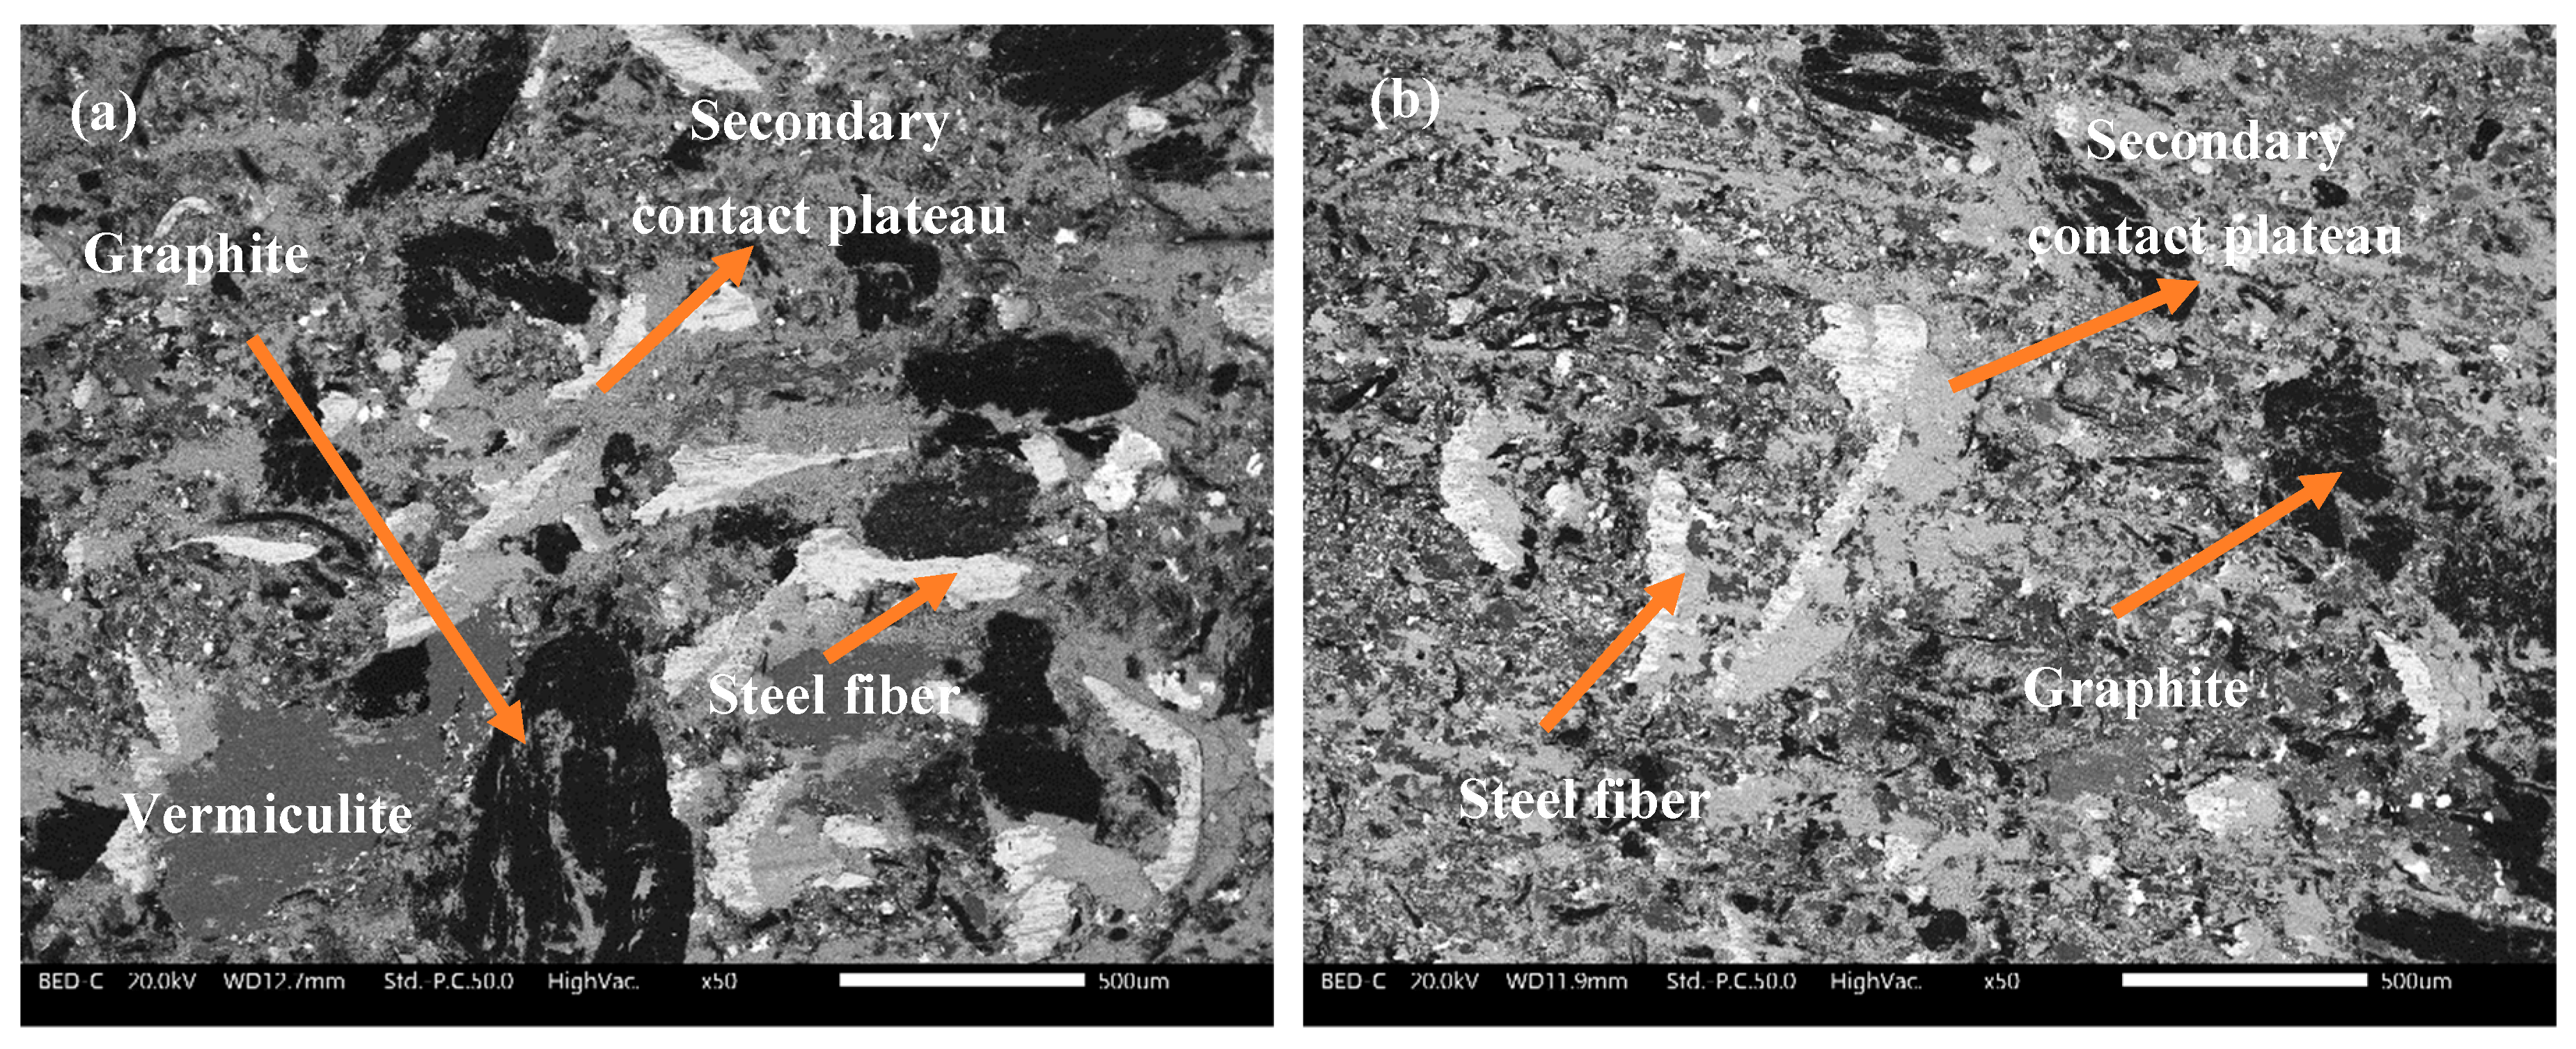
  • Amongst the alternatives, P1 and P4 had expansive secondary contact plateaus and P1 and P3 had the highest participation of AAW in the formation of the secondary contact plateaus. Hence, even from the worn surface analysis, the advantage of the P1 drying method utilization was observed.

Author Contributions

Conceptualization, G.S., A.B. and R.M.; Methodology, P.J.; Formal analysis, P.J.; Investigation, G.S. and P.J.; Resources, G.S., A.B. and R.M.; Writing—original draft, P.J.; Writing—review & editing, G.S. and R.M.; Supervision, R.M.; Project administration, G.S. and A.B.; Funding acquisition, G.S., A.B. and R.M. All authors have read and agreed to the published version of the manuscript.

Funding

The project is supported through Provincial Law n°6/1999 (Autonomous Province of Trento, Italy), for the promotion of research and development. This work has been produced with the co-funding of the European Union—FSE-REACT-EU, PON Research and Innovation 2014–2020 DM1062/2021.

Data Availability Statement

The raw data supporting the conclusions of this article will be made available by the authors on request.

Acknowledgments

The Authors thank Brembo SpA for the friction material formulation masterbatch.

Conflicts of Interest

Authors Andrea Barbieri and Roberto Masciocchi were employed by the company Ossicolor SRL. The remaining authors declare that the research was conducted in the absence of any commercial or financial relationships that could be construed as a potential conflict of interest.

References

  1. Miladinović, S.; Stojanović, B.; Gajević, S.; Vencl, A. Hypereutectic Aluminum Alloys and Composites: A Review. Silicon 2023, 15, 2507–2527. [Google Scholar] [CrossRef]
  2. Galindo, R.; Padilla, I.; Rodríguez, O.; Sánchez-Hernández, R.; López-Andrés, S.; López-Delgado, A. Characterization of Solid Wastes from Aluminum Tertiary Sector: The Current State of Spanish Industry. J. Miner. Mater. Charact. Eng. 2015, 3, 55–64. [Google Scholar] [CrossRef]
  3. Prasad, A. Developments of discontinuously reinforced aluminium matrix composites: Solving the needs for the matrix Developments of discontinuously reinforced aluminium matrix composites: Solving the needs for the matrix. J. Phys. Conf. Ser. 2022, 2212, 012029. [Google Scholar] [CrossRef]
  4. Prasad, D.S.; Shoba, C.; Ramanaiah, N. Investigations on mechanical properties of aluminum hybrid composites. J. Mater. Res. Technol. 2014, 3, 79–85. [Google Scholar] [CrossRef]
  5. Gregson, N.; Crang, M.; Fuller, S.; Holmes, H. Interrogating the circular economy: The moral economy of resource recovery in the EU. Econ. Soc. 2015, 44, 218–243. [Google Scholar] [CrossRef]
  6. Souza, M.T.; Simão, L.; Montedo, O.R.K.; Pereira, F.R.; de Oliveira, A.P.N. Aluminum anodizing waste and its uses: An overview of potential applications and market opportunities. Waste Manag. 2019, 84, 286–301. [Google Scholar] [CrossRef] [PubMed]
  7. Jayashree, P.; Straffelini, G. The Influence of the Addition of Aluminum Anodizing Waste on the Friction and Emission Behavior of Different Kinds of Friction Material Formulations. Tribol. Int. 2022, 173, 107676. [Google Scholar] [CrossRef]
  8. Leonardi, M.; Alemani, M.; Straffelini, G.; Gialanella, S. A pin-on-disc study on the dry sliding behavior of a Cu-free friction material containing different types of natural graphite. Wear 2020, 442–443, 203157. [Google Scholar] [CrossRef]
  9. Jayashree, P.; Matějka, V.; Foniok, K.; Straffelini, G. Comparative Studies on the Dry Sliding Behavior of a Low-Metallic Friction Material with the Addition of Graphite and Exfoliated g-C3N4. Lubricants 2022, 10, 27. [Google Scholar] [CrossRef]
  10. Mathissen, M.; Grochowicz, J.; Schmidt, C.; Vogt, R.; Farwick zum Hagen, F.H.; Grabiec, T.; Steven, H.; Grigoratos, T. A novel real-world braking cycle for studying brake wear particle emissions. Wear 2018, 414–415, 219–226. [Google Scholar] [CrossRef]
  11. Gietl, J.K.; Lawrence, R.; Thorpe, A.J.; Harrison, R.M. Identification of brake wear particles and derivation of a quantitative tracer for brake dust at a major road. Atmos. Environ. 2010, 44, 141–146. [Google Scholar] [CrossRef]
  12. Matějka, V.; Leonardi, M.; Praus, P.; Straffelini, G.; Gialanella, S. The Role of Graphitic Carbon Nitride in the Formulation of Copper-Free Friction Composites Designed for Automotive Brake Pads. Metals 2022, 12, 123. [Google Scholar] [CrossRef]
  13. Jayashree, P.; Matejka, V.; Sinha, A.; Gialanella, S.; Straffelini, G. A comprehensive study on the particulate matter characteristics of a friction material containing blast furnace slags. Tribol. Int. 2023, 186, 108567. [Google Scholar] [CrossRef]
  14. Jayashree, P.; Matějka, V.; Leonardi, M.; Straffelini, G. The influence of the addition of different kinds of slags on the friction and emission behavior of a commercially employed friction material formulation. Wear 2023, 522, 204705. [Google Scholar] [CrossRef]
  15. Nogueira, A.P.G.; Carlevaris, D.; Menapace, C.; Straffelini, G. Tribological and emission behavior of novel friction materials. Atmosphere 2020, 11, 1050. [Google Scholar] [CrossRef]
  16. Menapace, C.; Cipolloni, G.; Hebda, M.; Ischia, G. Spark plasma sintering behaviour of copper powders having different particle sizes and oxygen contents. Powder Technol. 2016, 291, 170–177. [Google Scholar] [CrossRef]
  17. Jayashree, P.; Sinha, A.; Gialanella, S.; Straffelini, G. Dry Sliding Behavior and Particulate Emissions of a SiC-Graphite Composite Friction Material Paired with HVOF-Coated Counterface. Atmosphere 2022, 13, 296. [Google Scholar] [CrossRef]
  18. Mat, V.; Jayashree, P.; Leonardi, M.; Vl, J.; Sabov, T. Utilization of Metallurgical Slags in Cu-Free Friction Material Formulations. Lubricants 2022, 10, 219. [Google Scholar] [CrossRef]
  19. Jayashree, P.; Federici, M.; Bresciani, L.; Turani, S.; Sicigliano, R.; Straffelini, G. Effect of Steel Counterface on the Dry Sliding Behaviour of a Cu-Based Metal Matrix Composite. Tribol. Lett. 2018, 66, 123. [Google Scholar] [CrossRef]
  20. Kyu, W.; Wook, M.; Hwan, S.; Jang, H.; Hyung, M. The influence of humidity on the sliding friction of brake friction material. WEA 2013, 302, 1397–1403. [Google Scholar]
Figure 1. PoD equipment: (A) air, (B) fan, (C) HEPA filter, (D) air in the chamber, (E) disc, (F) air outlet to the OPS, and (G) weights.
Lubricants 12 00173 g001
Figure 2. Comparison of (a) humidity; (b) crushability index; and (c) crushability index and humidity.
Lubricants 12 00173 g002
Figure 3. FT-IR analysis of the AAW as-received, reference alumina, and P1, P2, P3, P4 AAW. Areas 1 and 2 are O-H and/Al hydroxide; Area 3 is SO4, Al sulfate hydrate, and Area 4 is alumina.
Lubricants 12 00173 g003
Figure 4. Low magnification image of P4 AAW particles.
Lubricants 12 00173 g004
Figure 5. High magnification images of P4 AAW individual particles (a) at 1000X; (b) at 2000X.
Lubricants 12 00173 g005
Figure 6. Average density of all heat-treated AAW pins at 6 and 12 wt.% addition.
Lubricants 12 00173 g006
Figure 7. Typical friction curves for reference and with (a) 6 wt.% waste addition; and (b) 12 wt.% waste addition for all heat-treated AAWs.
Lubricants 12 00173 g007
Figure 8. Typical emission curves for reference and with (a) 6 wt.% waste addition; and (b) 12 wt.% waste addition for all heat-treated AAWs.
Lubricants 12 00173 g008
Figure 9. Comparison of (a) steady-state CoF; (b) pin wear; and (c) average particle concentration of all compositions.
Lubricants 12 00173 g009
Figure 10. Worn surface characteristics of the reference pin material.
Lubricants 12 00173 g010
Figure 11. Worn surface characteristics at 12 wt.% addition: (a) P1; (b) P2; (c) P3; and (d) P4.
Lubricants 12 00173 g011aLubricants 12 00173 g011b
Table 1. Different drying methods and average air temperature while drying.
Industrial ProcessMethodAverage Air Temperature
Process 1 (P1)Moving belt, hot air flow, 2 h and 15 min as residence time70–80 °C
Process 2 (P2)Moving belt, hot air flow, 2 h and 15 min as residence time under technological vacuum60 °C
Process 3 (P3)Muffle furnace with air circulation, duration: 32 h 50 °C
Process 4 (P4)Moving belt, hot air flow, 2 h and 15 min as residence time40–50 °C
Table 2. A few constituents of the commercial formulation with their respective function in (wt.%).
ConstituentsFunctionContent
Phenolic resinBinder8
SteelReinforcing fibers30
Vermiculite, othersFillers24
Silicon Carbide, magnesium oxide, aluminum oxideAbrasives25
Graphite, tin sulfide, zinc oxideLubricants13
Table 3. Properties and composition of the pearlitic grey cast iron counterface.
DiscChemical Composition, wt.%Hardness
[HV 30]
Thermal Conductivity (W/mK)Specific Heat (J/gK)
CMnSiSnPSFe
Pearlitic Grey Cast Iron3.400.502.000.110.150.05Rest245 ± 6520.447
Table 4. Full-frame EDXS analysis of different heat-treated AAWs.
ElementP1P2P3P4
Oxygen58475253
Aluminum34453833
Copper1.23---
Silicon0.68-1.181.62
Calcium3.223.202.614.16
Iron1.051.430.861.13
Tin1.882.72.293.34
Sulfur--3.813.23
Table 5. Object/point EDXS analysis of different heat-treated AAWs.
ElementP1P2P3P4
Oxygen41 ± 735 ± 638 ± 743 ± 3
Aluminum29 ± 738 ± 440 ± 632 ± 2
Carbon17 ± 319 ± 111 ± 313 ± 4
Copper0.5 ± 0.3---
Silicon0.8 ± 0.280.78 ± 0.30.84 ± 0.41.5 ± 0.65
Calcium3.81 ± 1.32.78 ± 0.292.91 ± 0.613.02 ± 0.18
Iron1.7 ± 1.11.36 ± 0.530.93 ± 0.140.93 ± 0.21
Tin1.4 ± 0.82.96 ± 12.71 ± 0.443.4 ± 0.21
Sulfur2.5 ± 1.64-3.86 ± 0.93 ± 0.22
Table 6. Object/point EDXS analysis of the secondary contact plateaus deposited on different heat-treated AAW pins at 12 wt.% addition.
ElementReferenceP1P2P3P4
Oxygen24 ± 424 ± 323 ± 120 ± 520 ± 3
Magnesium3 ± 0.52.5 ± 0.42.2 ± 0.73 ± 0.92 ± 0.2
Aluminum2 ± 0.084 ± 0.93 ± 0.54 ± 0.63 ± 0.05
Silicon1.5 ± 0.022 ± 0.81.6 ± 0.21.3 ± 0.31.5 ± 0.09
Sulfur1.6 ± 0.22 ± 1.11.4 ± 0.51.7 ± 0.31.4 ± 0.05
Calcium0.6 ± 0.050.7 ± 0.090.6 ± 0.050.8 ± 0.090.8 ± 0.1
Chromium0.7 ± 0.050.6 ± 0.030.5 ± 0.030.9 ± 0.010.7 ± 0.04
Iron61 ± 460 ± 562 ± 364 ± 165 ± 3
Zinc3 ± 1.23 ± 0.73 ± 0.43 ± 1.33 ± 0.8
Tin1.7 ± 0.31.7 ± 0.81.6 ± 0.051.3 ± 0.91.2 ± 0.4
Disclaimer/Publisher’s Note: The statements, opinions and data contained in all publications are solely those of the individual author(s) and contributor(s) and not of MDPI and/or the editor(s). MDPI and/or the editor(s) disclaim responsibility for any injury to people or property resulting from any ideas, methods, instructions or products referred to in the content.

