
Effects of Strain Rate on the GND Characteristics of Deformed Polycrystalline Pure Copper
School of Materials Science and Engineering, Shanghai Jiao Tong University, Shanghai 200241, China
*
Authors to whom correspondence should be addressed.
Metals 2024, 14(5), 582; https://doi.org/10.3390/met14050582
Submission received: 30 March 2024
/
Revised: 7 May 2024
/
Accepted: 14 May 2024
/
Published: 16 May 2024
Abstract
:Geometrically necessary dislocations (GNDs) play a pivotal role in polycrystalline plastic deformation, with their characteristics notably affected by strain rate and other factors, but the underlying mechanisms are not well understood yet. We investigate GND characteristics in pure copper polycrystals subjected to tensile deformation at varying strain rates (0.001 s−1, 800 s−1, 1500 s−1, 2500 s−1). EBSD analysis reveals a non-linear increase in global GND density with the strain rate rising, and a similar trend is also observed for local GND densities near the grain boundaries and that in the grain interiors. Furthermore, GND density decreases from the grain boundaries towards the grain interiors and this decline slows down at high strain rates. The origin of these trends is revealed by the connections between the GND characteristics and the behaviors of relevant microstructural components. The increase in grain boundary misorientations at higher strain rates promotes the increase of GND density near the grain boundaries. The denser distribution of dislocation cells, observed previously at high strain rates, is presumed to increase the GND density in the grain interiors and may also contribute to the slower decline in GND density near the grain boundaries. Additionally, grain refinement by higher strain rates also promotes the increase in total GND density. Further, the non-linear variation with respect to the strain rate, as well as the saturation at high strain rates, for grain boundary misorientations and grain sizes align well with the non-linear trend of GND density, consolidating the intimate connections between the characteristics of GNDs and the behaviors of these microstructure components.
1. Introduction
The nucleation, movement, and storage of dislocations are important in the plastic deformation of crystalline materials [1]. Dislocations within crystals are generally categorized into statistically stored dislocation (SSD) and geometrically necessary dislocation (GND). SSDs are generated through the random trapping of dislocations to each other. These dislocations are distributed randomly within the deformed crystals and do not change the crystal orientation. GNDs serve to harmonize the incompatibility of plastic deformation and maintain the continuity of the lattice [2,3,4,5], with their density determined by the plastic strain gradient. Unlike SSDs, GNDs induce changes in crystal orientation and crystal lattice bending. Consequently, the GND density can be quantified by evaluating the lattice curvature using techniques such as electron back-scatter diffraction (EBSD) or X-ray analysis.
It is widely recognized that GNDs enhance the work hardening of materials through two ways. Firstly, GNDs act as short-range barriers, impeding the slip of nearby dislocations and increasing the total dislocation density, thereby leading to a rise in the flow stress, through the forest hardening mechanism [6]. Secondly, GNDs of the same sign accumulate together to create long-range back stress to hinder the movement of dislocations in a much wider range [7].
Given the pivotal role of GNDs in the plastic deformation of crystals, it becomes crucial to understand their characteristics within polycrystals. GND characteristics can be affected by various external factors such as deformation temperature, strain, strain rate, etc. Investigating the effects of these factors on GND characteristics can offer profound insights into the microscopic mechanisms underlying the macroscopic mechanical properties of materials.
The characteristics of GNDs in various materials exhibit diverse trends with an increasing deformation temperature. Several studies suggested that the density of GNDs in metals tends to decrease at a higher temperature [8,9,10]. For instance, Zhang et al. [11] showed a decline in GND density with increasing temperature in the 6061 alloy. In contrast, some researchers reported an increase in GND density at higher deformation temperatures in other materials [12,13]. For instance, Jena et al. [13] noted that the highest density of GNDs occurred at 800 °C, with the lowest density observed at 350 °C in the Co-Cr-Al alloys at tensile deformation under different temperatures in the range of 25 °C to 800 °C.
Numerous investigations have highlighted the significant influence of applied strain on GND characteristics. It has been observed that the average density of GNDs tends to rise with increasing applied strain [14,15,16]. For instance, Kundu et al. [17] revealed a gradual increase followed by saturation of GND density during quasi-static tensile deformation. Moreover, the distribution of GNDs changes as the strain increases. Typically, GNDs tend to concentrate at high-angle grain boundaries and triple junctions [18]. As the strain increases, the distribution of GNDs gradually extends into the interiors of the grains, while the GND density near the grain boundaries remains significantly higher than that in the grain interiors [19]. Similar GND characteristics have also been simulated in Mg alloys with strain gradient crystal plasticity models by Pai et al. [20].
The effect of the strain rate on GND characteristics is also remarkable. Li et al. [21,22,23] and Cheng et al. [24] demonstrated a positive correlation between GND density and the strain rate, during tensile deformation at low to medium strain rates and in compression experiments with the strain rate ranging from 1800 s−1 to 4200 s−1, respectively. At even higher strain rates, Liu et al. [25] discovered that the GND density increases significantly during extremely high-strain-rate impact in AISI 1045 steel. For the distribution of GNDs, many researchers [26,27,28,29] have revealed that GNDs prefer to aggregate near the grain boundaries and triple junctions, and further extend into the grain interiors as the strain rate increases. This trend of GND distribution with the strain rate is similar to that with the strain. Crystal plasticity finite element simulations [27,30] have also demonstrated a denser distribution of GNDs near the grain boundaries at high strain rates.
In addition to the aforementioned external factors, the microstructures of materials also affect the GND characteristics. Materials with different microstructures exhibit different plastic deformation mechanisms. Most of the above-mentioned cases involved dislocation slip, but twinning and phase transformation can also influence the GND characteristics. The significant impact of twin deformation on GND density was demonstrated by Tian et al. [31] in FCC high-entropy alloys. They observed that the GND densities in materials undergoing plastic deformation through twinning and dislocation slip increase more slowly compared to materials where a sole dislocation slip dominated. For the effect of the phase transformation, Kundu et al. [32] discovered that martensitic phase transformations could cause a slower increase in GND density in dual-phase steels compared to ferritic interstitial free steels. In multiphase materials, a mismatch in thermal properties can also influence the GND characteristics in addition to the mechanical causes. That is, a mismatch in the thermal expansion of different phases also contributes to the aforementioned increase in GND densities at higher deformation temperatures by Jena et al. [13]. Different thermal expansion coefficients may cause the increase in geometric mismatch dislocation densities as the temperature rises, while GND density originated from deformation heterogeneity is usually assumed to decrease as the temperature increases [8,9,10,11]. Therefore, the net increase in GND density at higher temperatures observed by Jena et al. could be attributed to the increase in geometrical mismatch dislocations overcoming the reduction in GND density associated with the deformation.
Pure copper is a single-phase FCC metal with moderate stacking fault energy, primarily undergoing plastic deformation through dislocation slip and twinning mechanisms. However, twinning is difficult to occur in pure copper when subjected to strain rates around and below the order of 103 s−1 [33]. These inherent properties of copper provide an opportunity to focus on studying the GND characteristics resulting from interactions among dislocations and interactions of dislocations with grain boundaries. Consequently, it allows us to analyze the GND characteristics solely based on dislocation behaviors, without considering other factors such as twinning and phase transitions, as these additional factors not only affect GND characteristics but are also influenced by the strain rate. By excluding these factors, the analysis becomes more focused, enabling a clearer interpretation of the connection between GND characteristics and the strain rate.
Therefore, we choose pure copper as the material for investigating the GND characteristics at different strain rates. Despite the significant influence of the strain rate on GND characteristics in pure copper, relatively few studies have been conducted. Previous studies mainly focused on comparing GND characteristics between low and high strain rates, with limited exploration of the underlying microscopic mechanisms and the evolution of GND characteristics at high strain rates. To investigate GND characteristics in polycrystalline pure copper at varying strain rates, we employ quasi-static tensile testing and a split Hopkinson tensile bar (SHTB) experiment to deform pure copper (99.99%) at both quasi-static (0.001 s−1) and high strain rates (800 s−1, 1500 s−1, 2500 s−1). By employing EBSD analysis, we obtain the GND characteristics of the deformed specimens at different strain rates, as well as the variations in characteristics globally and locally. For pure copper, in contrast to existing studies that mainly focus on GND characteristics at low strain rates [16,26,34], the present study investigates the GND characteristics at higher strain rates and explores the underlying microscopic mechanisms; this provides a robust experimental foundation for modeling and theoretical research.
2. Materials and Experimental Methods
Pure copper is subjected to deformation at various strain rates using both quasi-static tensile testing (0.001 s−1) and SHTB experiments at high strain rates (800 s−1, 1500 s−1, 2500 s−1). The distribution and density of GNDs are investigated by EBSD.
2.1. Materials
We choose annealed copper with 99% purity. The grain sizes in the initial microstructure predominantly range from 15 μm to 25 μm, as shown in Figure 1. Some annealing twins exist in the initial pure copper specimens. However, the statistical analysis of GND data excludes the regions containing these annealed twins to focus on the effects of grain boundaries on the characteristics of GNDs. The geometric dimensions of the copper specimens used for tensile testing are depicted in Figure 2a, and those for SHTB experiment are depicted in Figure 2b. Six specimens are tested at each strain rate to confirm reproducibility.
2.2. Experimental Methods
Quasi-static tensile tests are performed utilizing an electronic universal testing machine (Z20) manufactured by ZWICK (Ulm, Germany), and high-strain-rate tensile experiments are performed through the SHTB technique. As the experimental method of the quasi-static tensile test has been well established, the SHTB technique is briefly introduced here.
The SHTB is a device designed to investigate the mechanical response of materials subjected to strain rates ranging from 102 to 104 s−1 [35,36]. A schematic of the conventional one-dimensional SHTB is depicted in Figure 3. Strain gauges are installed on the incident rod to capture both incident and reflection waves, while those on the transmission rod capture the transmission waves. The stress–strain relationship of the specimens at a specific strain rate can be determined by the data collected from strain gauges [37].
In this study, specimens are consistently deformed to an engineering strain of 10% at each strain rate. At this strain, a significant density of GNDs with a discernible distribution can generally be guaranteed, as observed in the quasi-static tensile deformation of pure copper [34]. To control the strain during high-strain-rate deformation, we devise an interruption fixture and correspondingly add shoulders to the specimen, as depicted in Figure 4, similar to previous research [38,39,40]. By adjusting the gap distance between the movable shoulders and the interrupted fixtures, precise control over strain in dynamic tensile tests at high strain rates is facilitated, as depicted in the inset of Figure 4a.
2.3. EBSD Observation of GNDs
Microstructure characterization for GND densities in deformed specimens is conducted using EBSD. The EBSD device employed is the MIRA3 manufactured by TESCAN (Brno, Czech Republic), operating at a test voltage of 20 kV, with data processing carried out using ATEX software (2017).
The accuracy of calculating GND density by EBSD can be influenced by several factors, such as scanning step size and shift sensitivity [41]. The minimum level of noise, denoted as , is closely related to the angular resolution and scanning step size of the EBSD system [42]:
The angular resolution of the EBSD system is typically determined by the experimental equipment. Furthermore, employing a smaller scanning step size generally provides more detailed characterization of GNDs. However, a step size that is too small can also yield unrealistic GND density results.
We choose a scanning step size of 0.1 μm following the method proposed by Ruggles et al. [43]. The average GND density decreases as the scanning step size increases, eventually stabilizing on a plateau. The accuracy of the GND density is enhanced at this plateau stage, as shown in stage B in Figure 5a. The correlation between the scanning step size and the GND density of pure copper is depicted in Figure 5b, showing a notable plateau trend. Selecting a smaller scanning step size provides finer characterization. Therefore, the step size corresponding to the inflection point before the increase in GND density is considered most suitable for higher resolution and reduced noise. Consequently, a scanning step size of 0.1 μm is chosen for subsequent analyses.
3. Experimental Results
We collect EBSD data on GNDs from approximately 100 grains in all the specimens deformed at each strain rate. The evolutions of GND density and distribution at both global and local scales (in the grain interiors and near the grain boundaries) at varying strain rates are obtained by further investigating these data.
3.1. Evolution of Global GND Characteristics with Strain Rate
The global characteristics of GNDs, concerning both GND distributions and densities, strongly depend on the strain rate.
The distributions of GNDs are clearly different at various strain rates. Two EBSD images with a higher presence of grain boundaries and triple junctions at each strain rate are shown in Figure 6, Figure 7 and Figure 8. Almost no GNDs are observed in the undeformed specimens. However, the presence of GNDs becomes apparent in both quasi-static and varying strain-rate-tensile-deformed specimens. GNDs predominantly aggregate near the triple junctions in the quasi-static deformed specimens, as observed in grain boundaries A and B in Figure 7a,b. The GNDs aggregate more prominently near the grain boundaries at higher strain rates compared to the quasi-static deformation, gradually extending into the grain interiors, as evidenced by grains C and D in Figure 8a,b.
The total average GND density exhibits a clear non-linear increase with the rise in the strain rate, corresponding to the denser distribution of GNDs. There is a rapid rise in total GND density from quasi-static to high strain rates, followed by a slowing of the increase as the strain rate further rises, as shown in Figure 9. Thereby, the total GND density exhibits a non-linear increase as the strain rate rises.
3.2. Evolution of Local GND Characteristics with Strain Rate
The local characteristics of GNDs, observed in the grain interiors and near the grain boundaries, exhibit a similar trend to that of the global GND characteristics as the strain rate increases. These two local regions are approximately delineated by a line positioned 2 μm away from the grain boundary for investigating the local GND characteristics.
The average densities of GNDs, both in the grain interiors and near the grain boundaries, show a non-linear increase as the strain rate rises, as illustrated in Figure 10a,b. This trend is consistent with that of the total average GND density at varying strain rates. Moreover, it is observed that the average GND density near the triple junctions is higher than that near the grain boundaries. The observed phenomenon of GND aggregation near the grain boundaries at high strain rates in this experiment is in agreement with the findings in previous simulations [27,30].
The GND distributions near the grain boundaries clearly change with the strain rate. The highest GND density is concentrated at the grain boundaries, with a gradual decrease in GND density observed from the grain boundaries towards the grain interiors, as illustrated in Figure 10c. Interestingly, we found that this decline slows down at high strain rates. Furthermore, the GND density experiences a rapid decrease within approximately 1 μm of the grain boundaries, beyond which it stabilizes. This finding indicates that the regions significantly influenced by the grain boundaries extend to a range of approximately 1 μm.
4. Analysis and Discussion
The microscopic mechanisms underlying the aforementioned phenomena are analyzed by establishing connections between the characteristics of GNDs and the behaviors of misorientations as well as dislocation cells. Furthermore, the relationship between the grain refinement and GND characteristics observed at higher strain rates is also examined.
The temperature effect on GND characteristics during deformation (10%) is negligible in this study. The upper limit of temperature rise at the highest strain rate (2500 s−1) in our experiment is estimated to be at most 7.6 K by employing the method proposed by Dai et al. [44,45], which is insignificant for causing noticeable changes in the evolution of GNDs.
4.1. Influence of Intragranular Dislocation Cell Behaviors on GND Characteristics
The non-linear trend of the GND density in the grain interiors with the rise in the strain rate can be attributed to the different behaviors of dislocation cells at various strain rates. At higher strain rates, the denser distribution of dislocation cells in the grain interiors promotes the aggregation of intragranular GNDs.
The denser dislocation cells at higher strain rates arise from changes in the behaviors of dislocations with the strain rate. Dislocation interaction and nucleation are more active at higher strain rates, so the entanglement of dislocations is more intense and the dislocation cells that result are smaller and more densely distributed, as observed by George et al. [46]. Therefore, a higher GND density in the grain interiors is obtained at high strain rates compared to the quasi-static deformation.
Furthermore, dislocation cell sizes decrease during deformation until they reach a lower limit, causing the density of dislocation cells to gradually saturate at high strain rates [47,48]. Consequently, the increase in the number of dislocation cells in the grain interiors slows down with the strain rate, as well as that of the GND density.
4.2. Influence of Dislocation Cells and Misorientations on GND Characteristics near the Grain Boundaries
The characteristics of GNDs near the grain boundaries are influenced by the collective behaviors of dislocation cells and grain boundary misorientations.
Grain boundary misorientation typically serves as an indicator of grain boundary resistance to dislocations. It refers to the misalignment or offset of atomic positions along grain boundaries, revealing differences in grain orientation between adjacent grains [49]. Grain boundaries with higher misorientations can produce greater resistance to dislocations [50,51,52,53], thereby promoting the aggregation of GNDs near these boundaries. The misorientation can be calculated using a Eulerian mismatch angle between adjacent grains [54].
The average grain boundary misorientation exhibits a non-linear increase as the strain rate increases, consistent with the trend of GND density near the grain boundaries as illustrated in Figure 11a. The increased misorientation at high strain rates results in increased GND densities near these boundaries. Misorientations near the triple junctions are higher than those of usual grain boundaries, as shown in Figure 11b, indicating a greater hindrance for dislocations crossing boundaries near the triple junctions. Furthermore, dislocations are impeded by more boundaries in the vicinity of triple junctions. Consequently, the average GND density near the triple junctions is higher than that observed near the grain boundaries, aligning with the distribution of GNDs in regions A and B shown in Figure 7a,b.
It is noteworthy that the increase in grain boundary misorientations slows down at high strain rates, resulting in a slower rise in GND density near the grain boundaries at higher strain rates. This phenomenon may be attributed to the limited time available for coordinating deformation between grains at high strain rates, leading to an increase in grain boundary misorientations. Therefore, additional GNDs are required to maintain continuous deformation near the grain boundaries.
The behaviors of dislocation cells and misorientations contribute to the slower decline in GND density from grain boundaries towards grain interiors at high strain rates, as shown in Figure 10c. As the distribution of dislocation cells becomes denser at higher strain rates [46], the density of GNDs in the grain interiors increases. The increase in GND density in the vicinity of grain boundaries is comparatively less than the increase observed in the grain interiors at high strain rates, resulting in a slower decline in GND density away from the grain boundaries.
The distribution of misorientations exhibits a bimodal distribution at high strain rates, as shown in Figure 11c,d. In undeformed samples, misorientations are predominantly distributed within the range of 40° to 60°, indicating a single-peak distribution, as depicted in Figure 11c. However, the proportions of misorientations beyond 60° and below 20° gradually rise as strain rates increase, exhibiting a bimodal distribution. The left peak of the bimodal distribution is attributed to minor misorientations between newly formed small grains and their parent grains [55,56,57], while the right peak stems from the evolution of pre-existing high-angle grain boundaries within the initial pure copper specimens.
The pure copper specimens show only minor but noticeable changes in texture at a strain of 10%, as illustrated in Figure 12. The changes in grain boundary misorientation are in line with the observed texture changes in this research.
4.3. Effect of Grain Refinement on GND Density
In addition to dislocation cells and grain boundary misorientations, grain sizes also affect the global GND density, with significant grain refinement induced by high strain rates promoting an increase in GND density.
The formation of sub-grains during high-strain-rate deformation results in a high percentage of low-angle grain boundaries, contributing to an increase in GND density. The non-linear trends of the grain size and global GND average density when the strain rate increases are further illustrated in Figure 13. While grain refinement is relatively moderate during quasi-static tensile deformation, it becomes remarkable at higher strain rates. Smaller grains tend to facilitate the increase in GND density [58]. Thus, the increase in global GND density at high strain rates is also influenced by grain refinement.
5. Conclusions
This study reveals the characteristics of GNDs, including their densities and distributions, in pure copper at quasi-static (0.001 s−1) and high-strain-rate (800 s−1, 1500 s−1, 2500 s−1) tensile deformations through EBSD analysis. Connections between the GND characteristics and the behaviors of microstructural components, including dislocation cell size/distribution, grain boundary misorientations and grain sizes, are established to unveil the underlying mechanisms, as summarized in Figure 14.
Author Contributions
Conceptualization, Y.S., Y.M., S.X. and G.L.; methodology, Y.M. and S.X.; validation, Y.M.; formal analysis, S.Y. and R.C.; investigation, Y.M.; data curation, Y.M., G.L. and S.X.; writing—original draft preparation, Y.M.; writing—review and editing, Y.M., G.L., Y.S., S.Y., S.X. and R.C.; funding acquisition, G.L. and Y.S. All authors have read and agreed to the published version of the manuscript.
Funding
This research is supported by Stability Support Project of Key Laboratory of Surface Physics and Chemistry (WDZC202203), the Key Lab Fund Project (No. 2021JCJQLB05706), National Natural Science Foundation of China (Grant No. 52071210), the Science Challenge Project No. TZ2018001, the Science and Technology Commission of Shanghai (Grant No. 21ZR1430800).
Data Availability Statement
The original contributions presented in the study are included in the article, further inquiries can be directed to the corresponding authors.
Conflicts of Interest
The authors declare no conflicts of interest.
References
- Ashby, M.F. The deformation of plastically non-homogeneous materials. Philos. Mag. A J. Theor. Exp. Appl. Phys. 2006, 21, 399–424. [Google Scholar] [CrossRef]
- Fleck, N.A.; Ashby, M.F.; Hutchinson, J.W. The role of geometrically necessary dislocations in giving material strengthening. Scr. Mater. 2003, 48, 179–183. [Google Scholar] [CrossRef]
- Gao, H.; Huang, Y. Geometrically necessary dislocation and size-dependent plasticity. Scr. Mater. 2003, 48, 113–118. [Google Scholar] [CrossRef]
- Mughrabi, H. Dislocation wall and cell structures and long-range internal stresses in deformed metal crystald. Acta Metall. 1983, 31, 1367–1379. [Google Scholar] [CrossRef]
- Hughes, D.A.; Hansen, N. Microstructure and strength of nickel at large strains. Acta Mater. 2000, 48, 2985–3004. [Google Scholar] [CrossRef]
- Taylor, G.I. The Mechanism of Plastic Deformation of Crystals. Part I. Theoretical Plastic Deformation of Crtstals. Proc. R. Soc. Lond. 1934, 145, 362–387. [Google Scholar]
- Kuhlmann-Wilsdorf, D.; Laird, C. Dislocation behavior in fatigue II. Friction stress and back stress as inferred from an analysis of hysteresis loops. Mater. Sci. Eng. A 1979, 37, 111–120. [Google Scholar] [CrossRef]
- Jang, M.J.; Praveen, S.; Sung, H.J.; Bae, J.W. High-temperature tensile deformation behavior of hot rolled CrMnFeCoNi high-entropy alloy. J. Alloys Compd. 2018, 730, 242–248. [Google Scholar] [CrossRef]
- Han, Q.; Lei, X. Effects of temperature and load on fretting fatigue induced geometrically necessary dislocation distribution in titanium alloy. Mater. Sci. Eng. A 2021, 800, 140308. [Google Scholar] [CrossRef]
- Zheng, J.; Pruncu, C. Quantifying geometrically necessary dislocation density during hot deformation in AA6082 Al alloy. Mater. Sci. Eng. A 2021, 814, 141158. [Google Scholar] [CrossRef]
- Zhang, J.; Wang, B.; Wang, H. Geometrically necessary dislocations distribution in face-centerd cubic alloy with varied grain size. Mater. Charact. 2020, 162, 110205. [Google Scholar] [CrossRef]
- Despax, L.; Vidal, V.; Delagnes, D. Influence of strain rate and temperature on the deformation mechanisms of a fine-grained Ti-6Al-4V alloy. Mater. Sci. Eng. A 2020, 790, 139718. [Google Scholar] [CrossRef]
- Jena, P.S.M.; Pradham, S.K. Evolution of geometrically necessary dislocation at the γ-γ′ interface and its effect on tensile deformation behaviour of disk super alloy. Mater. Sci. Eng. A 2021, 807, 140855. [Google Scholar] [CrossRef]
- Gao, W.; Liu, J.; Zhou, J. Effect of grain size on deformation and fracture of Inconel718: An in-situ SEM-EBSD-DIC investigation. Mater. Sci. Eng. A 2022, 961, 144362. [Google Scholar] [CrossRef]
- Gallet, J.; Perez, M.; Guillou, R. Experimental measurement of dislocation density in metallic materials: A quantitative comparison between measurements techniques (XRD, R-ECCI, HR-EBSD, TEM). Mater. Charact. 2023, 199, 112842. [Google Scholar] [CrossRef]
- Jiang, J.; Britton, T.B. The orientation and strain dependence of dislocation structure evolution in monotonically deformed polycrystalline copper. Int. J. Plast. 2015, 69, 102–117. [Google Scholar] [CrossRef]
- Kundu, A. Geometrically Necessary Dislocation Density Evolution in Interstitial Free Steel at Small Plastic Strains. Metall. Mater. Trans. A 2018, 49A, 3274–3281. [Google Scholar] [CrossRef]
- Liu, M.; Liu, Y.; Li, H. Deformation mechanism of ferrite in a low carbon Al-killed steel: Slip behavior, grain boundary evolution and GND development. Mater. Sci. Eng. A 2022, 842, 143093. [Google Scholar] [CrossRef]
- Zhang, S.; Romo, S.; Giorjao, R.A.; Leao, P.B.P.; Ramirez, A.J. EBSD analysis of strain distribution and evolution in ferritic-Pearlitic steel under cyclic deformation at intermediate temperature. Mater. Charact. 2022, 193, 112293. [Google Scholar] [CrossRef]
- Pai, N.; Prakash, A.; Samajdar, I.; Patra, A. Study of grain boundary orientation gradients through combined experiments and strain gradient crystal plasticity modeling. Int. J. Plast. 2022, 156, 103360. [Google Scholar] [CrossRef]
- Li, J.; Wu, X.; Liao, B. Simulation of dynamic recrystallization in an Al-Mg-Si alloy during inhomogeneous hot deformation. Mater. Today Commun. 2021, 29, 102810. [Google Scholar] [CrossRef]
- Li, Z.; Ge, J.; Kong, B. Strain Rate Dependence and Recrystallization Modeling for TC18 Alloy during Post-Deformation Annealing. Materials 2023, 16, 1140. [Google Scholar] [CrossRef] [PubMed]
- Shaarbaf, M.; Toroghinegad, M.R. Influence of high strain rate deformation on the microstructure and mechanical behavior of NiCoCrFe high entropy alloy. J. Mater. Res. Technol. 2023, 27, 2264–2279. [Google Scholar] [CrossRef]
- Cheng, J.; Xu, C.; Zhang, T. Microstructure and dynamic mechanical behavior of wire-arc additive manufactured high-strength steel. J. Mater. Res. Technol. 2023, 25, 6099–6110. [Google Scholar] [CrossRef]
- Liu, Q.; Fang, L.; Xiong, Z. The response of dislocations, low angle grain boundaries and high angle grain boundaries at high strain rates. Mater. Sci. Eng. A 2021, 822, 141704. [Google Scholar] [CrossRef]
- Jiang, J.; Britton, T.B. Accumulation of geometrically necessary dislocations near grain boundaries in deformed copper. Philos. Mag. Lett. 2012, 92, 580–588. [Google Scholar] [CrossRef]
- Kundu, A.; Field, D.; Chakraborti, P.C. Effect of strain and strain rate on the development of deformation heterogeneity during tensile deformation of a solution annealed 304 LN austenitic stainless steel: An EBSD study. Mater. Sci. Eng. A 2020, 733, 138854. [Google Scholar] [CrossRef]
- Sadeghi, B.; Qi, J.; Min, X. Modelling of strain rate dependent dislocation behavior of CNT/Al composites based on grain interior/grain boundary affected zone (GI/GBAZ). Mater. Sci. Eng. A 2021, 820, 141547. [Google Scholar] [CrossRef]
- Tang, W.; Liu, S.; Liu, Z. Microstructure evolution and constitutive relation establishment of Mg–7Gd–5Y–1.2Nd–0.5Zr alloy under high strain rate after severe multi-directional deformation. Mater. Sci. Eng. A 2021, 809, 140994. [Google Scholar] [CrossRef]
- Ye, C.; Chen, R.; Liu, G. Crystal Plasticity Finite Element Simulation of Polycrystal Aluminum under Shock Loading. Chin. J. High Press. Phys. 2022, 36, 064203. [Google Scholar]
- Tian, Z.; Zhang, T.; Wang, Z. Dynamic tensile deformation of Al0.1Ti0.1CoCrFeNi high entropy alloy with heterogeneous grain structure. J. Alloys Compd. 2023, 968, 172092. [Google Scholar] [CrossRef]
- Kundu, A.; Field, D.P. Influence of microstructural heterogeneity and plastic strain on geometrically necessary dislocation structure evolution in single-phase and two-phase alloys. Mater. Charact. 2020, 170, 110690. [Google Scholar] [CrossRef]
- Voisin, T.; Grapes, M.D.; Santala, M.K. In situ TEM observations of high-strain-rate deformation and fracture in pure copper. Mater. Today 2020, 33, 10–16. [Google Scholar] [CrossRef]
- Jiang, J.; Britton, T.B.; Wilkinson, A.J. Evolution of dislocation density distributions in copper during tensile deformation. Acta Mater. 2013, 61, 7227–7239. [Google Scholar] [CrossRef]
- Lu, F. Hopkinson Bar Experimental Technique; Science Press: Beijing, China, 2013. [Google Scholar]
- Wang, L. Stress Wave Foundation; National Defense Industry Press: Beijing, China, 2005. [Google Scholar]
- Chen, W.W.; Song, B. Split Hopkinson Bar: Design, Testing and Applications; Springer: New York, NY, USA, 2011. [Google Scholar]
- Ma, D.; Chen, D.; Wu, S. An interrupted tensile testing at high strain rates for pure copper bars. J. Appl. Phys. 2010, 108, 114902. [Google Scholar]
- Wang, C.; Wang, C.; Sun, C. Strain rate effects on mechanical behavior and microstructure evolution with the sequential strains of TWIP steel. Mater. Sci. Eng. A 2022, 835, 142673. [Google Scholar] [CrossRef]
- Slycken, J.V. Advanced Use of a Split Hopkinson Bar Setup Application to TRIP Steels. Ph.D. Thesis, Universient Gent, Gent, Belgium, 2008. [Google Scholar]
- Jiang, J.; Britton, T.B.; Wilkinson, A.J. Measurement of geometrically necessary dislocation density with high resolution electron backscatter diffraction: Effects of detector binning and step size. Ultramicroscopy 2013, 125, 1–9. [Google Scholar] [CrossRef] [PubMed]
- Wilkinson, A.J.; Randman, D. Determination of elastic strain fields and geometrically necessary dislocation distributions near nanoindents using electron back scatter diffraction. Philos. Mag. 2009, 90, 1159–1177. [Google Scholar] [CrossRef]
- Ruggles, T.J.; Rampton, T.M.; Khosravani, A. The effect of length scale on the determination of geometrically necessary dislocations EBSD continuum dislocation microscopy. Ultramicroscopy 2016, 164, 1–10. [Google Scholar] [CrossRef]
- Dai, J.; Min, X.; Wang, L. Dynamic response and adiabatic shear behavior of β-type Ti-Mo alloys with different deformation modes. Mater. Sci. Eng. A 2022, 857, 144108. [Google Scholar] [CrossRef]
- Zheng, Y.; Zheng, W.; Wang, Y. High strain rate compression behavior of a heavily stabilized beta titanium alloy: Kink deformation and adiabatic shearing. J. Alloys Compd. 2017, 708, 84–92. [Google Scholar] [CrossRef]
- Gray, G.T., III. High Strain rate deformation: Mechanical behavior and deformation substructures induced. Annu. Rev. Mater. Sci. 2012, 42, 285–303. [Google Scholar] [CrossRef]
- Chang, Y.J.; Shume, A.J.; Bassim, M.N. A note on dislocation-cell structures in commercial copper. Mater. Sci. Eng. A 1988, A103, L1–L4. [Google Scholar] [CrossRef]
- Meyer, M.A.; Gregori, F.; Kad, B.K. Laser-induced shock compression of monocrystalline copper: Characterization and analysis. Acta Meterialia 2003, 51, 1211–1228. [Google Scholar] [CrossRef]
- Gottstein, G.; Molodov, D.A.; Shvindlerman, L.S. Grain boundary migration: Misorientation dependence. Curr. Opin. Solid State Mater. Sci. 2001, 5, 9–14. [Google Scholar] [CrossRef]
- Gottschalk, D.; McBride, A.; Reddy, B.D. Computational and theoretical aspects of a grain-boundary model that accounts for grain misorientation and grain-boundary orientation. Comput. Mater. Sci. 2016, 111, 443–459. [Google Scholar] [CrossRef]
- Lim, H.; Lee, M.G.; Kim, J.H. Simulation of polycrystal deformation with grain and grain boundary effects. Int. J. Plast. 2011, 27, 1328–1354. [Google Scholar] [CrossRef]
- Liu, W.; Liu, Y.; Sui, H. Dislocation-grain boundary interaction in metallic materials: Competition between dislocation transmission and dislocation source activation. J. Mech. Phys. Solids 2020, 20, 30391–30394. [Google Scholar] [CrossRef]
- Pan, H.; He, Y.; Zhang, X. Interactions between Dislocations and Boundaries during Deformation. Materials 2021, 14, 1012–1047. [Google Scholar] [CrossRef]
- Bollmann, W. Crystal Lattices, Interfaces, Matrices: An Extension of Crystallography; W. Bollmann: Geneva, Switzerland, 1983. [Google Scholar]
- Rui, S.; Niu, L.; Shi, H. Diffraction-based misorientation mapping: A continuum mechanics description. J. Mech. Phys. Solids 2019, 133, 103709. [Google Scholar] [CrossRef]
- Hansen, B.L.; Beyerlein, I.J.; Bronkhorst, C.A. A dislocation-based multi-rate single crystal plasticity model. Int. J. Plast. 2013, 44, 129–146. [Google Scholar] [CrossRef]
- Shahba, A.; Ghosh, S. Crystal plasticity FE modeling of Ti alloys for a range of strain-rates. Part I: A unified constitutive model and flow rul. Int. J. Plast. 2016, 87, 48–68. [Google Scholar] [CrossRef]
- Zhang, S.; Liu, W.; Wan, J. The grain size and orientation dependence of geometrically necessary dislocations in polycrystalline aluminum. Mater. Sci. Eng. A 2020, 775, 138939. [Google Scholar] [CrossRef]
Figure 1.
IPF mapping of the undeformed pure copper specimens.

Figure 2.
Schematic of specimen dimensions (a) for quasi-static tensile test (b) for SHTB.

Figure 3.
Schematic diagram of one-dimensional split Hopkinson tensile bar. Reprinted with permission from ref. [38]. 2024 AIP Publishing.
Figure 3.
Schematic diagram of one-dimensional split Hopkinson tensile bar. Reprinted with permission from ref. [38]. 2024 AIP Publishing.

Figure 4.
(a) Design drawing to show the connection of specimen and fixtures in interrupted SHTB experiment (The inset illustrates the movement of the specimen’s mobile shoulders during deformation); (b) Specimen’s movable shoulder deformation during deformation at high strain rates in practical experiment.

Figure 5.
(a) The relationship between scanning step size and GND density in tantalum. Reprinted with permission from ref. [43]. 2024 Elsevier; (b) The relationship between scanning step size and GND density in pure copper.
Figure 5.
(a) The relationship between scanning step size and GND density in tantalum. Reprinted with permission from ref. [43]. 2024 Elsevier; (b) The relationship between scanning step size and GND density in pure copper.
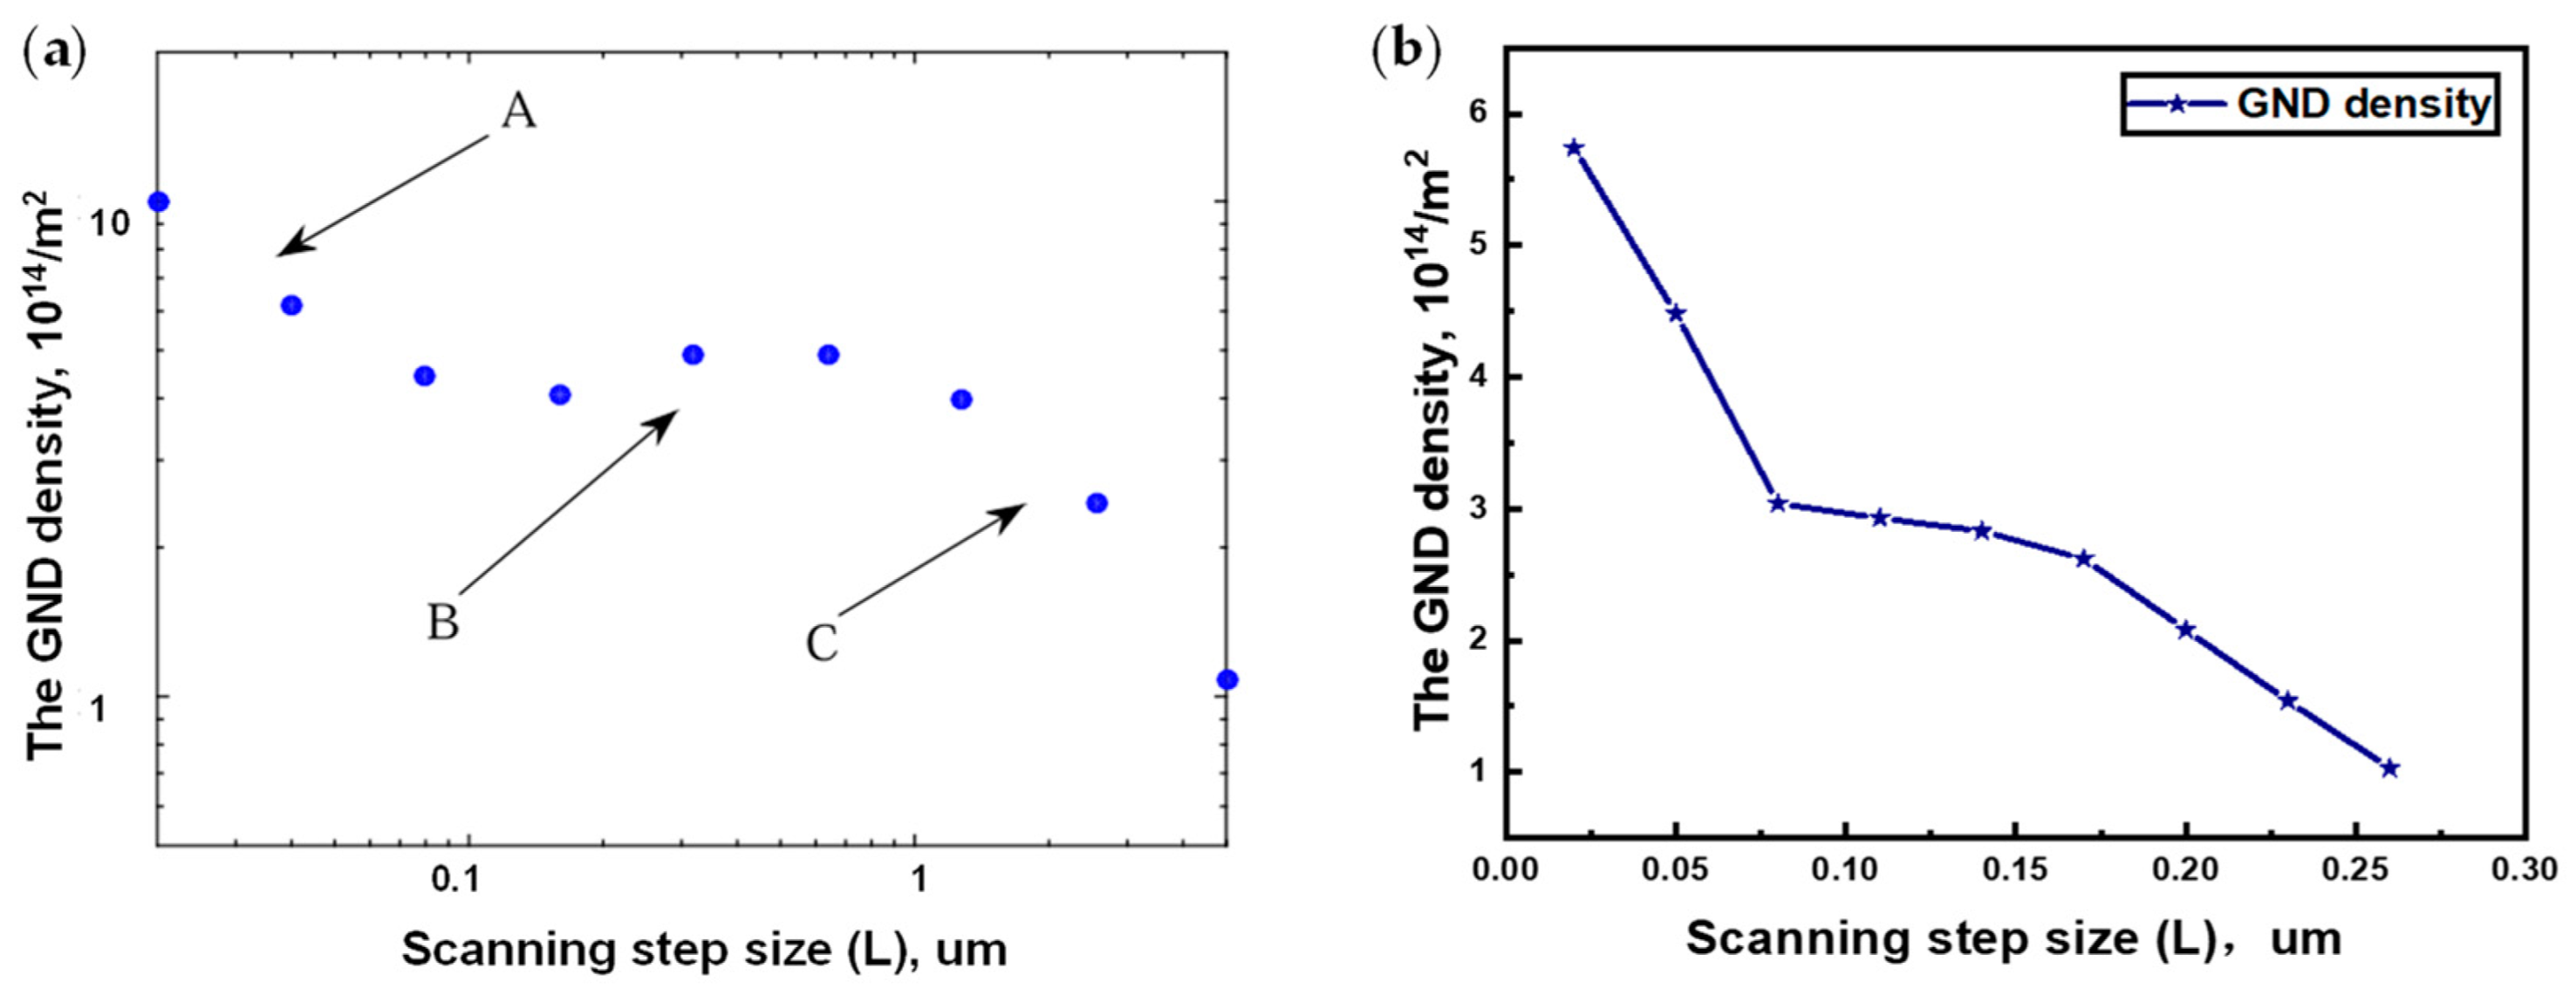
Figure 6.
(a,b) Distributions of GNDs in undeformed specimens from different regions.
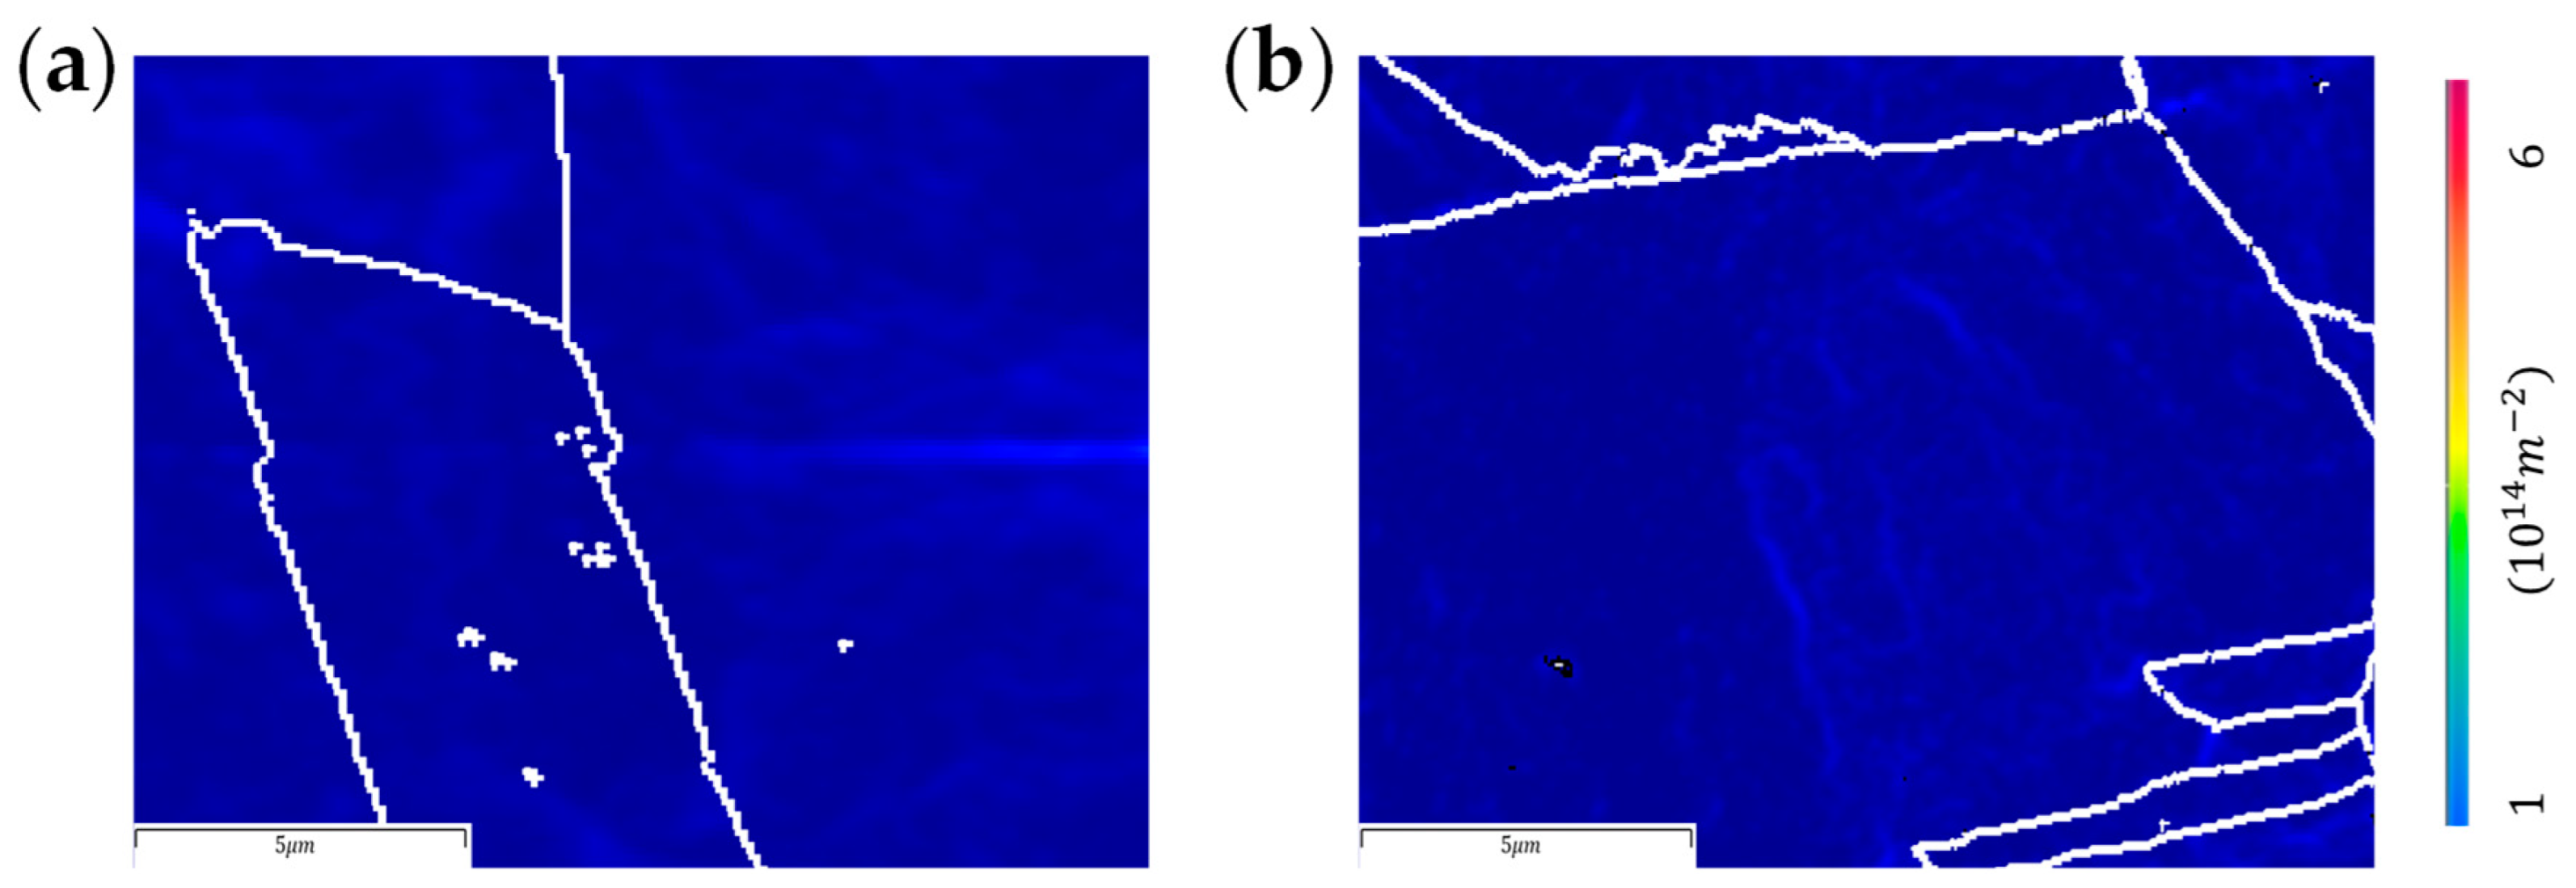
Figure 7.
(a,b) Distributions of GNDs in specimens after quasi-static (0.001 s−1) tensile deformation from different regions.
Figure 7.
(a,b) Distributions of GNDs in specimens after quasi-static (0.001 s−1) tensile deformation from different regions.

Figure 8.
(a,b) Distributions of GNDs in specimens after high-strain-rate (2500 s−1) tensile deformation from different regions.
Figure 8.
(a,b) Distributions of GNDs in specimens after high-strain-rate (2500 s−1) tensile deformation from different regions.

Figure 9.
Total average GND density at different strain rates.
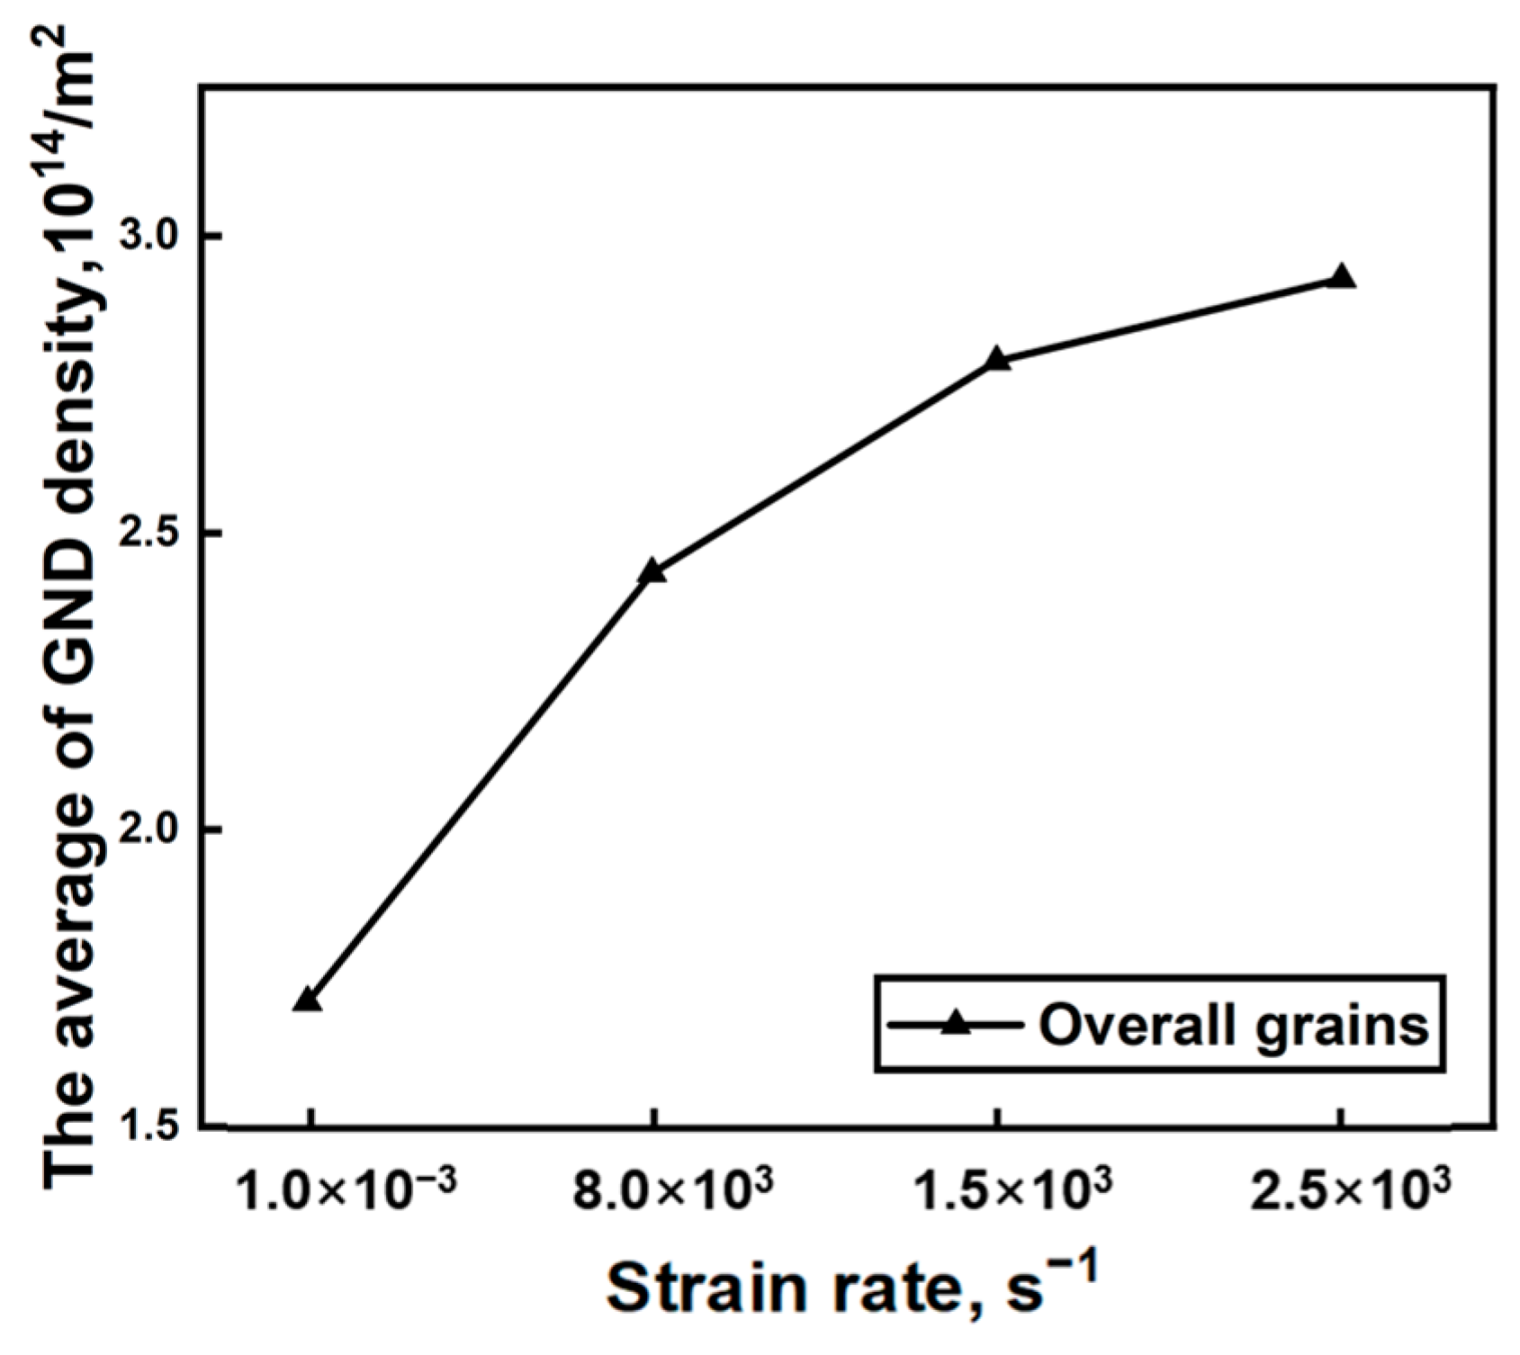
Figure 10.
(a) GND density with strain rate in the grain interiors; (b) GND density with strain rate near the triple junctions (red line) and grain boundaries (black line); (c) GND density with distance from grain boundary at different strain rates (the average GND densities on the left side of dotted line decrease rapidly, while they are gently distributed on the right side).

Figure 11.
(a) The average of grain boundary misorientations (red line) and average GND density (black line) near the grain boundaries for specimens undeformed and deformed at different strain rates; (b) Misorientations of grain boundaries (besides triple junctions, black line) and triple junctions (red line) in specimens undeformed and at deformed different strain rates; (c) Distribution of grain boundary misorientations in undeformed specimens; solid line represents the initial single-peak distribution of misorientations; (d) Distribution of grain boundary misorientations in specimens at different strain rates; star marks represent misorientations interval with the highest percentage, solid line represents the bimodal distribution of misorientations at strain rate of 2500 s−1.

Figure 12.
Pole figures for the textures of (a) undeformed (b) quasi-static tensile deformed in the pure copper specimens.
Figure 12.
Pole figures for the textures of (a) undeformed (b) quasi-static tensile deformed in the pure copper specimens.

Figure 13.
Average grain size (red line) and GND density (black line) at different strain rates showing the non-linear trends.
Figure 13.
Average grain size (red line) and GND density (black line) at different strain rates showing the non-linear trends.

Figure 14.
Diagram of the link between the microstructural components and GND characteristics.

Disclaimer/Publisher’s Note: The statements, opinions and data contained in all publications are solely those of the individual author(s) and contributor(s) and not of MDPI and/or the editor(s). MDPI and/or the editor(s) disclaim responsibility for any injury to people or property resulting from any ideas, methods, instructions or products referred to in the content. |
© 2024 by the authors. Licensee MDPI, Basel, Switzerland. This article is an open access article distributed under the terms and conditions of the Creative Commons Attribution (CC BY) license (https://creativecommons.org/licenses/by/4.0/).
Share and Cite
MDPI and ACS Style
Ma, Y.; Liu, G.; Yang, S.; Chen, R.; Xu, S.; Shen, Y. Effects of Strain Rate on the GND Characteristics of Deformed Polycrystalline Pure Copper. Metals 2024, 14, 582. https://doi.org/10.3390/met14050582
AMA Style
Ma Y, Liu G, Yang S, Chen R, Xu S, Shen Y. Effects of Strain Rate on the GND Characteristics of Deformed Polycrystalline Pure Copper. Metals. 2024; 14(5):582. https://doi.org/10.3390/met14050582
Chicago/Turabian StyleMa, Yidan, Guisen Liu, Shuqing Yang, Ran Chen, Shuopeng Xu, and Yao Shen. 2024. "Effects of Strain Rate on the GND Characteristics of Deformed Polycrystalline Pure Copper" Metals 14, no. 5: 582. https://doi.org/10.3390/met14050582
Note that from the first issue of 2016, this journal uses article numbers instead of page numbers. See further details here.