
Early Age Assessment of a New Course of Irish Fly Ash as a Cement Replacement


1
School of Transport & Civil Engineering, TU Dublin City Campus, D01 K822 Dublin, Ireland
2
Built Environment Research and Innovation Centre, TU Dublin City Campus, D01 K822 Dublin, Ireland
3
Institute of Advanced Study, Collegium Basilea, 4053 Basel, Switzerland
*
Author to whom correspondence should be addressed.
Appl. Sci. 2024, 14(10), 4128; https://doi.org/10.3390/app14104128
Submission received: 22 March 2024
/
Revised: 30 April 2024
/
Accepted: 11 May 2024
/
Published: 13 May 2024
(This article belongs to the Special Issue Geomaterials: Latest Advances in Materials for Construction and Engineering Applications (2nd Edition))
Abstract
:This paper explores the potential of a new source of fly ash, deposited on the site of a coal-fired power plant in Ireland dating from 1985 to 1995, as a cement replacement material. A series of X-ray diffraction (XRD) analyses on binder samples with cement replacement levels of 0, 10, 25 and 35% was undertaken to determine the fly ash’s mineralogical composition and to determine its suitability as a supplemental cementitious material (SCM). The XRD results reveal a unique mineral composition with promising characteristics for enhancing the strength and durability of concrete. The experimental results were used to calibrate a thermodynamic model to predict changing phase assemblage and hydration behaviour over time and per replacement level. Thermodynamic models have been shown to give credible predictions of the long-term performance of cements, including SCMs. The initial experimental results’ thermodynamic modelling demonstrates the feasibility of this fly ash source as a sustainable alternative to traditional cement, paving the way for more eco-friendly construction. Ash deposits dating from 1995 to 2005 and from 2005 to the present will be presented in subsequent publications.
1. Introduction
Coal-powered electrical energy in Ireland will be phased out entirely by 2025. The only coal-fired power station in Ireland is located at Moneypoint in Co. Clare on the west coast. Coal-burning for electricity generation in Ireland will be phased out by 2025, when the plant was due for decommissioning, but, due to the current energy crisis, it will continue operations as a back-up until 2029. Moneypoint, which generates up to 915 MW and has been operational since 1987, has several million tonnes of unconditioned (“wet”) fly ash deposited over a 25-acre ash field. Between now and 2028, when the station is scheduled to be finally decommissioned, a further 800,000 tonnes of fly ash may be deposited, based on projected operation patterns. The ash stored on site has been separated into three deposits from 1985 to 1995, 1995 to 2005 and 2005 to present. This paper presents a characterisation and hydration study of the ash dating from 1985 to 1995. Subsequent publications will present the two other deposits.
Significant reductions in current carbon dioxide (CO2) levels proposed by the European Union (80% by 2050 [1]) have been adopted by member states, including Ireland. The production of Portland cement (PC) contributes to 8% of worldwide greenhouse gas emissions [2]. Cement production in Ireland is currently at 5 million tonnes annually, which releases circa 4 million tonnes of CO2 into the atmosphere. Therefore, partially replacing or blending Portland cement with suitable supplementary cementitious materials (SCMs) would yield substantial reductions in CO2 emissions per tonne of cement. Current cement standards [3] define two types of siliceous fly ash blends that permit cement replacement by fly ash of up to 20% (CEM II/A-V) or 35% (CEM II/B-V). With a 35% replacement level (CEM II/B-V), typical in the US and UK, an annual reduction of circa 650,000 of CO2 could be realised, representing 2% of Ireland’s total carbon emissions annually. With over 12 million tonnes of concrete produced annually in Ireland, CEM II/B-V cement could utilise up to 750,000 tonnes of Moneypoint fly ash each year.
In order to investigate the suitability of this fly ash as a suitable cement replacement in concrete, building on previous work [4,5], this paper presents the initial findings of its characterisation, including moisture content and the XRF and XRD over time of hydrating samples. To observe how it performed in concrete, the compressive strength of concrete samples was assessed using 100 mm cubes. Fly ash has been used at CEM I replacement levels of 0, 10, 25 and 35% to demonstrate the optimum point of replacement, which is in accordance with EN 197 [3]. In addition, in order to improve thermodynamic predictions, a suite of phase equations to represent the behaviour of the ash amorphous/glass phase during hydration has been developed, taking into account its oxide proportions. These equations are added to the PHREEQC input file for fly ash replacement levels from 5 to 35% in 5% steps and replace the traditional method of adding additional CaO, Al2O3, etc. to represent the glass in fly ash. This approach can also be used to represent the glass phase in most SCMs.
2. Materials and Methods
The ash used for the analysis was taken from that stored at the Moneypoint power station situated in Co. Clare, Ireland (Figure 1). The samples for the study were obtained from three different sections within the ash field, reflecting ash deposits from different phases of operation (Figure 2). Four ash samples (each 5 kg) were collected at each of the three sections. The ash was taken from a depth of 1 m from the surface and stored within air tight containers to maintain the moisture content.
All experiments were carried out using commercially obtained CEM I cement with and without fly ash at various replacement levels, as described in Table 1. The chemical compositions of the materials were determined by X-ray fluorescence (XRF), and X-ray diffraction (XRD) was used to monitor the changing mineralogical composition over time as hydration continued, as described in Table 2 and Table 3. As shown in Table 2, most of the fly ash is SiO2, with high levels of Al2O3 and Fe2O3. Due to the lower CaO content and alumina content between 15 and 35%, this ash can be classified as Class F [6], as shown in the ternary diagram (Figure 3). A series of cement pastes were prepared at a w/c of 0.5 and cast into 20 × 20 × 20 mm cube moulds (Figure 4) and cured at 20 °C. XRD was carried out at 1, 7, 28 and 100 days, with a 20 mm cement cube being removed, powered down to 10 µm [7] and placed in the diffractometer for pattern acquisition. XRD data were collected using a Rigaku Miniflex600 spectrometer and scanned between 0 and 90° 2θ.
Particle-size distribution and SEM images of the ash taken from the site are shown in Figure 5 and Figure 6. As may be seen, the ash consists of very fine particles, with circa 99% passing a 0.1 mm sieve. This can also be seen in the SCM images taken at a 50 µm resolution.
Figure 7 shows an SCM of the 20% fly ash replacement after 60 days of hydration. The images show the formation of portlandite and ettringite, as highlighted by their expected crystal formation.
2.1. Moisture Content of Fly Ash
The moisture content of the fly ash was measured by weighing out 500 g each of the twelve samples and placing them inside an oven set to 105 °C for 24 h. The weight was measured again, and the moisture content was calculated.
2.2. Concrete Compressive Strength Assessment
Nine 100 × 100 × 100 mm concrete cubes were cast for each fly ash replacement level and subjected to compressive strength testing at 7, 28 and 56 days. All the mixes had a fixed w/c ratio of 0.5 and a total cement/binder content of 400 kg/m3, with a design slump of between 100 and 150 mm. The CEM I cement used complied with BS EN 197-1 [3], and the fine and coarse aggregates were obtained from local sources in Ireland. The fine aggregate used was medium-grade sand, and the coarse aggregate was crushed limestone with a maximum size of 20 mm. A summary of the mixes is shown in Table 4.
Following mixing in a pan mixer, the concrete was poured into the moulds in 50 mm thick layers and vibrated on a vibrating table until no more air bubbles were visible on the surface. The cubes were cured for 24 h under a polythene sheet to trap evaporating moisture, demoulded and then placed into a water-filled curing tank set to 20 °C until testing.
3. Thermodynamic Modelling
Thermodynamic calculations were carried out using PHREEQC geochemical software [10,11]. The cemdata18 thermodynamic database [12] was used to model the predicted solid hydrates, pore solution chemistry and pH over time. The C-A-S-H phase was modelled using a number of Discrete Solid Phases (DSPs) based on the continuous solid solution between five end-members with different Ca/Si and Al/Si ratios, described by Shaji et al. [13]. Details on how DSPs are derived can be found in [14]. Holmes et al. [15] previously demonstrated this approach for the derivation of DSPs for the CSH-3T and CSHQ end-members. The thermodynamic data for the derivation of DSPs were taken from the cemdata18 database and copied directly into the PHREEQC input file. DSPs were also derived to model the siliceous (Si) hydrogarnet phases using the C3FS1.34H3.32 and C3FS0.84H4.32 end-members in cemdata18 [12], and can be found in Shaji et al. [13].
The amorphous/glass phase of the glass was modelled using phase equations following the methodology described in Shaji et al. [13]. Using the oxide proportions and phase compositions in Table 2 and Table 3, respectively, the derived phase equations used in the thermodynamic calculations to account for the amorphous phase in the fly ash are listed below. These phases were added to the PHREEQC input file to represent the behaviour of the amorphous phases most accurately, rather than adding molar concentrations of the oxides found in the glass.
| FA % | FA amorphous/glass phase equations (log_k for the reactive and inactive phases are +999 and −999, respectively) |
| 5 | (SiO2)9.167(Al2O3)1.6678(Fe2O3)0.8449(CaO)1.3541(MgO)0.5311(K2O)0.2218(Na2O)0.0002(H2O)1.4427 = + 9.167 SiO2 + 3.3356 AlO2− + 1.6898 FeO2− + 1.3541 Ca+2 + 0.5311 Mg+2 + 0.4436 K+ + 0.0004 Na+ + 0.811 H+ + 1.0372 H2O |
| 10 | (SiO2)9.219(Al2O3)1.6537(Fe2O3)0.8299(CaO)1.3605(MgO)0.5359(K2O)0.2238(Na2O)0.0002(H2O)1.4416 = + 9.219 SiO2 + 3.3074 AlO2− + 1.6598 FeO2− + 1.3605 Ca+2 + 0.5359 Mg+2 + 0.4476 K+ + 0.0004 Na+ + 0.7264 H+ + 1.0784 H2O |
| 15 | (SiO2)9.2718(Al2O3)1.6394(Fe2O3)0.8145(CaO)1.3671(MgO)0.5407(K2O)0.2258(Na2O)0.0002(H2O)1.4405 = + 9.2718 SiO2 + 3.2788 AlO2− + 1.629 FeO2− + 1.3671 Ca+2 + 0.5407 Mg+2 + 0.4516 K+ + 0.0004 Na+ + 0.6402 H+ + 1.1204 H2O |
| 20 | (SiO2)9.3257(Al2O3)1.6248(Fe2O3)0.7989(CaO)1.3737(MgO)0.5457(K2O)0.2279(Na2O)0.0002(H2O)1.4393 = + 9.3257 SiO2 + 3.2496 AlO2− + 1.5978 FeO2− + 1.3737 Ca+2 + 0.5457 Mg+2 + 0.4558 K+ + 0.0004 Na+ + 0.5524 H+ + 1.1631 H2O |
| 25 | (SiO2)9.3805(Al2O3)1.61(Fe2O3)0.783(CaO)1.3805(MgO)0.5507(K2O)0.23(Na2O)0.0002(H2O)1.4382 = + 9.3805 SiO2 + 3.22 AlO2− + 1.566 FeO2− + 1.3805 Ca+2 + 0.5507 Mg+2 + 0.46 K+ + 0.0004 Na+ + 0.4632 H+ + 1.2066 H2O |
| 30 | (SiO2)9.4364(Al2O3)1.5949(Fe2O3)0.7667(CaO)1.3874(MgO)0.5559(K2O)0.2321(Na2O)0.0002(H2O)1.437 = + 9.4364 SiO2 + 3.1898 AlO2− + 1.5334 FeO2− + 1.3874 Ca+2 + 0.5559 Mg+2 + 0.4642 K+ + 0.0004 Na+ + 0.372 H+ + 1.251 H2O |
| 35 | (SiO2)9.4933(Al2O3)1.5794(Fe2O3)0.7502(CaO)1.3944(MgO)0.5611(K2O)0.2343(Na2O)0.0002(H2O)1.4358 = + 9.4933 SiO2 + 3.1588 AlO2− + 1.5004 FeO2− + 1.3944 Ca+2 + 0.5611 Mg+2 + 0.4686 K+ + 0.0004 Na+ + 0.2792 H+ + 1.2962 H2O |
4. Results
4.1. Fly Ash Composition
The XRD patterns of four samples taken from Phase 1 in the ash field are shown in Figure 8. The amount of reactive silica and alumina in the ash is largely responsible for its reactivity, which has been noted by Alelweet et al. [16], who also studied the ash in Moneypoint. Previous work on fly ash mineralogy has identified up to 316 individual minerals and 188 mineral groups [16,17], with the most abundant phase being glass, with crystalline compounds such as quartz, mullite, magnetite, melilite, gehlenite, kalsilite, calcium sulphate and alkali sulphate accounting for 5–50% [18].
As shown in Figure 8, there is significant glass in the fly ash. Alelweet et al. [16] calculated this to be between 40 and 60%, based on the background area between 15–35 2. Here, the glass/amorphous content is calculated to be 81% using a Rietveld analysis, with amounts of quartz, mullite, hematite, calcite and magnetite. This is in broad agreement with previous studies on Moneypoint fly ash [16,19] and is summarised in Table 5. This also agrees with the previous literature, which reports quartz and mullite to be the two major crystalline phases in low-Ca (CaO < 8%) fly ash, with a crystalline mineral content in the range of 11–48 wt.% [17]. Alelweet et al. [16] concluded that the lack of sulphates and calcium silicates in the Moneypoint fly ash is due to the composition of the subbituminous coal used in the power station, which is low in sulphur and calcium.
4.2. Fly Ash Moisture Content
The moisture content from the twelve flay ash samples taken is shown in Figure 9. As shown, the moisture contents ranges from 11.25% to 11.75%, with the average around 11.5%. This moisture content was considered during the concrete production, to ensure 0.5 w/c was achieved throughout, to ensure the design strengths were reached. The relatively high moisture content would indicate that the ash should be dried before use, or the free water content should be adjusted to account for the moisture within it.
4.3. Concrete Compressive Strength
The concrete compressive strength results are shown in Figure 10. As may be seen, the compressive strength results are not significantly affected with the addition of FA, compared with the CEM I only/0% FA samples at each age. However, the 35% FA samples do take longer to achieve similar strengths to CEM I only and to the other fly ash replacement levels. At 56 days, though, all compressive strengths appear to be similar.
4.4. X-ray Diffraction
Figure 11 shows the XRD pattens for hydrating CEM I with no fly ash additions. The CEM I clinker peaks are shown at 12.1 2 (C4AF), 31 2 (C2S), 32.5 2 (mainly C3S and C2S) and 35 2 (C3S). C3S also overlaps with the calcite peak at 29.5 2. C2S can be difficult to identify in XRD patterns, and it appears to overlap with the C3S peak at 32.5 2, whereas C3S is more abundant. C3A, along with overlapping C2S and C3S, is observed at 32–33 2.
The main hydrates, including portlandite and ettringite, along with calcite, are observed as expected. Due to the presence of approximately 4.8 g/100 g of calcite in the clinker (see Table 3), permitted for CEM I cements under EN 197 [3], monocarbonate is the most abundant AFm phase [20,21], as shown by the peak at 10.8 2 which remains as hydration continues over time. Ettringite is the dominant AFt phase and is stable over time, with dominant peaks at 9, 15.8, 19 and 23 2.
De Weerdt et al. [22] suggested that the main differences between plain and blended cements containing SCMs are best observed at low angles (8–13° ), where the main peaks of the AFm and AFt phases are found. Figure 12 shows the XRD patterns at these low angles for the three cement replacements here after 1, 7, 28, 60 and 100 days of hydration. Monosulphate, which has been shown to diffract at 9.8 in the literature [23], is not shown in the patterns, whereas monocarbonate is precipitated at 11.5, with a stable ettringite phase at 9.7 over time. Some hemicarbonate is shown at 11 at 7 days but decreases over time as monocarbonate is formed. These observations are consistent with previous studies [22,23,24]. Unfortunately, XRD patterns at 60 days for the 35% replacement samples are not available.
Another significant effect of blended fly ash cements is the reduction in portlandite over time due to pozzolanic activity, where it is converted to additional C-A-S-H with a lowering of the Ca:Si ratio. The increase in alumina may also lead to a reduction in ettringite and increase in AFm compared to 100% CEM I cement. This leads to a reduction in overall volume that could result in lower strengths, hence fly ash additions in cement standards being limited to 35%. This will be studied in the thermodynamic analysis.
4.5. Thermodynamic Modelling Analysis
The change in the solid phase assemblage predicted by PHREEQC over time is shown in Figure 13. The default output from PHREEQC is in moles. By multiplying this by the molar volume of each phase (using the SELECTED_OUTPUT and USER_PUNCH data blocks), the change in volume can be observed. The results show that the formation of monocarbonate with a stable ettringite phase is predicted, which agrees with the experimental observations. The formation of monocarbonate occurs at approximately 3 days, which is evident in the XRD patterns above and seen in the work by Lothenbach et al. [23]. Furthermore, with increasing fly ash, the volume of monocarbonate increases, which is due to additional calcium and aluminates being released into the solution and precipitating. De Weerdt et al. [22] showed that increasing fly ash in blended cements results in a faster OPC/CEM I reaction. Also confirmed is the reduction in portlandite as it reacts with silicates, along with additional alumina, to form additional C-A-S-H. Also, part of the additional aluminates will contribute additional ettringite and monocarbonate phases, as the sulphate content is lower in high-fly ash blended cement [22].
Lothenbach et al. [25] found that above 40% fly ash, monocarbonate and eventually ettringite both become unstable with the formation of strätlingite, depending on the reactivity of the fly ash, the Al2O3 content and Al uptake into the C–A-S–H. It was also found that, above 20% fly ash, portlandite was completely depleted. Strätlingite formation has not been observed in the experimental data but is evident in the thermodynamic simulations within the timeframe shown, at replacement levels at and above 20%, which agrees with previous research. Indeed, as seen in Figure 14, which depicts phase assemblages assuming full hydration at an infinite time in the future, strätlingite is thermodynamically predicted to form for fly ash blended cements ranging from 5 to 35%. Note that, although automatic peak identification assigns the reflection at 11.8° 2θ to the ferrite phase C4AF, we believe this to be erroneous. Our thermodynamic predictions suggest that this peak is due to the precipitation of gypsum, as shown in Figure 14, below.
As shown in Table 2, the SiO2, Al2O3 and Fe2O3 contents are high, whereas CaO is low. According to ASTM C618 [6], with a combined SiO2, Al2O3 and Fe2O3 of over 70% by mass, the ash belongs to the Class F family. It can be further classified as pozzolanic, and its reactivity is a function of aluminosilicate glass characteristics and particle fineness. The thermodynamic predictions here show portlandite completely depleted before 1000 days for fly ash blends over 10%, indicating that this source of ash is very reactive. This is observed in the XRD data, with the intensity of portlandite lowering over time for all replacement levels. Alelweet et al. [16] found that the ash is most reactive after approximately 20 h of hydration, using the method developed by Luxan et al. [26] and McCarter et al. [27], where the capacity of ash to combine with portlandite is a measure of its reactivity.
5. Discussion
The thermodynamic modelling of the fly ash blended cement appears to be in good agreement with other work in the literature in this area. The depletion of portlandite and precipitation of monocarbonate, co-existing with a stable ettringite phase, all appear to be as expected. These predictions are supported by the experimental data through XRD analysis. The depletion of portlandite and increase in C-A-S-H demonstrate the pozzolanic properties of the fly ash that can add to strength development over time. For all replacement levels at full hydration, portlandite and monocarbonate are shown to be fully exhausted (Figure 14). Upon reflection, the peak assigned to C4AF in Figure 12 may actually represent the re-precipitation of gypsum, as shown in Figure 14.
In terms of hydrates volume, replacement levels above 20% show a slight reduction. This has been observed in the literature [28,29,30], which found reductions in compressive and flexural strength in concrete samples when the fly ash replacement exceeded 20%. Small amounts of hemicarbonate are predicted in the 20% and 35% samples, which correspond with the slow reduction in monocarbonate. Previous works in the literature [23,31] also show small amounts of hemicarbonate, and Lothenbach et al. [23] postulated that the intermediate formation of hemicarbonate is due to the relatively slow dissolution of limestone and insufficient dissolved carbonate being available. While there is no clear XRD evidence for hemicarbonate in Figure 11, the amounts predicted in the model are very small. Not predicted in the thermodynamic predictions over time or the experimental data, at least within the timeframe here, is the existence of strätlingite. As may be seen in Figure 14, it is predicted to form after completing full hydration for all levels of fly ash replacement, due to the amount of soluble silicate in the ash.
6. Conclusions
The fly ash currently stored in Phase 1 (1985–1995) at the Moneypoint power station has shown to be a suitable Portland cement replacement. The ash is reactive and is shown here to be a pozzolanic material, contributing to solid phase assemblage and not just acting as a pore filler. This is demonstrated by the depletion of portlandite and increase in C-A-S-H in the thermodynamic predictions and experimental observations. Monocarbonate and ettringite appear stable over the timeframes considered here, with the former being removed from the phase assemblage, converting to strätlingite later, as shown by the predictions of the system after complete hydration.
The ash has also been shown, through its chemical properties (work is ongoing on the physical properties), that it meets the requirements of EN 450 to be considered suitable as a fly ash in structural concrete. Subsequent publications will investigate if the ash stored in Phase 2 (1995–2005) and Phase 3 (2005 to the present) are also suitable as a supplementary cementitious material in concrete.
Author Contributions
Conceptualization, N.S. and N.H.; methodology, N.S. and N.H.; software, N.S. and N.H.; validation, N.S., N.H. and M.T.; formal analysis, N.S.; investigation, N.S.; resources, N.H.; data curation, N.S.; writing—original draft preparation, N.S.; writing—review and editing, N.S., N.H. and M.T.; visualization, N.S.; supervision, N.H. and M.T.; project administration, N.H.; funding acquisition, N.H. All authors have read and agreed to the published version of the manuscript.
Funding
This research was funded by a TU Dublin Business Partners Research Scholarship.
Institutional Review Board Statement
Not applicable.
Informed Consent Statement
Not applicable.
Data Availability Statement
The raw data supporting the conclusions of this article will be made available by the authors on request.
Acknowledgments
The authors would like to acknowledge the valuable advice provided by the ESB Ireland staff at the Moneypoint power station for their assistance and to the technical staff at the FOCUS Research Centre in TU Dublin.
Conflicts of Interest
The authors declare no conflict of interest.
References
- Ireland Energy Needs. Available online: https://www.seai.ie/about/irelands-energy-targets/ (accessed on 7 November 2023).
- Making Concrete Change. Available online: https://www.chathamhouse.org/2018/06/making-concrete-change-innovation-low-carbon-cement-and-concrete (accessed on 7 November 2023).
- BS EN 197-1; Cement: Composition, Specification and Conformity Criteria for Common Cements. European Committee for Standardization (CEN): Brussels, Belgium, 2011.
- Snowdon, R.; Richardson, M. Influence of mix parameters on the permeability of PFA-concretes manufactured with PFA sourced in Ireland. In Proceedings of the Colloquium on Concrete Research in Ireland, Dublin, Ireland, 28 August 1997; pp. 3–9. [Google Scholar]
- Lenehan, J.; Richardson, M.; O’Kiely, P. Evaluation of pulverised fuel ash as a cement replacer in concretes used in silage storage structures. Irish J. Agric. Food Res. 2001, 39, 489. [Google Scholar]
- ASTM C618-12; Standard Specification for Coal Fly Ash and Raw or Calcined Natural Pozzolan for Use in Concrete. ASTM International: West Conshohocken, PA, USA, 2012.
- ASTM C1365-06; Standard Test Method for Determination of the Proportion of Phases in Portland Cement and Portland-Cement Clinker Using X-ray Powder Diffraction Analysis. ASTM International: West Conshohocken, PA, USA, 2007.
- Holmes, N.; Tyrer, M.; West, R.P.; Lowe, A.; Kelliher, D. Using PHREEQC to model cement hydration. Constr. Build. Mater. 2022, 319, 126–129. [Google Scholar] [CrossRef]
- BS EN 933-1; Tests for Geometrical Properties of Aggregates. Determination of Particle Size Distribution. Sieving Method. European Committee for Standardization (CEN): Brussels, Belgium, 2012.
- Parkhust, D.L.; Appelo, C.A.J. A Computer Program for Speciation, Batch—Reaction, One—Dimensional Transport and Inverse Geochemical Calculations; U.S. Geological Survey: Reston, VA, USA, 1999.
- Parkhurst, D.J.; Appelo, C.A.J. Description of Input and Examples for PHREEQC Version 3—A Computer Program for Speciation, Batch-Reaction, One-Dimensional Transport and Inverse Geochemical Calculations; U.S. Geological Survey: Reston, VA, USA, 2013.
- Lothenbach, B.; Kulik, D.A.; Matschei, T.; Balonis, M.; Baquerizo, L.; Dilnesa, B.; Miron, G.D.; Myers, R.J. Cemdata18: A chemical thermodynamic database for hydrated Portland cements and alkali-activated materials. Cem. Concr. Res. 2019, 115, 472–506. [Google Scholar] [CrossRef]
- Shaji, N.; Holmes, N.; Tyrer, M. Derivation of fly-ash glass phase equations for use in thermodynamic models. In Proceedings of the Civil Engineering Research in Ireland, Galway, Ireland, 29–30 August 2024. [Google Scholar]
- Walker, C.; Sutou, S.; Oda, C.; Mihara, M.; Honda, A. Calcium silicate hydrate (C-S-H) gel solubility data and a discrete solid phase model at 25 °C based on two binary non-ideal solid solutions. Cem. Concr. Res. 2016, 79, 1–30. [Google Scholar] [CrossRef]
- Holmes, N.; Walker, C.; Tyrer, M.; Kelliher, D. Deriving discrete solid phases from CSH-3T and CSHQ end-members to model cement hydration in PHREEQC. In Proceedings of the Civil Engineering Research in Ireland (CERI) Conference, Dublin, Ireland, 25–26 August 2022; pp. 28–33. [Google Scholar]
- Alelweet, O.; Pavia, S. Potential of a low-calcium fly ash (FA) for the production of alkali-activated materials. In Proceedings of the Civil Engineering Research in Ireland, Bishopstown, Ireland, 27–28 August 2020; pp. 162–167. [Google Scholar]
- Xu, G.; Shi, X. Characteristics and applications of fly ash as a sustainable construction material: A state-of-the-art review. Resour. Conserv. Recycl. 2018, 136, 95–109. [Google Scholar] [CrossRef]
- Shi, C.; Roy, D.; Krivenko, P. Alkali-Activated Cements and Concretes; CRC Press: Boca Raton, FL, USA, 2003. [Google Scholar]
- Walker, R.; Pavía, S. Physical properties and reactivity of pozzolans, and their influence on the properties of lime–pozzolan pastes. Mater. Struct. 2011, 44, 1139–1150. [Google Scholar] [CrossRef]
- Matschei, T.; Lothenbach, B.; Glasser, F.P. The role of calcium carbonate in cement hydration. Cem. Concr. Res. 2007, 37, 551–558. [Google Scholar] [CrossRef]
- Holmes, N.; Russell, M.; Davis, G.; Tyrer, M. Comparing the Measured and Thermodynamically Predicted AFm Phases in a Hydrating Cement. Appl. Sci. 2022, 12, 10147. [Google Scholar] [CrossRef]
- De Weerdt, K.; Haha, M.B.; Le Saout, G.; Kjellsen, K.O.; Justnes, H.; Lothenbach, B. Hydration mechanisms of ternary Portland cements containing limestone powder and fly ash. Cem. Concr. Res. 2011, 41, 279–291. [Google Scholar] [CrossRef]
- Lothenbach, B.; Saout, G.L.; Gallucci, E.; Scrivener, K. Influence of limestone on the hydration of Portland cements. Cem. Concr. Res. 2008, 38, 848–860. [Google Scholar] [CrossRef]
- Schöler, A.; Lothenbach, B.; Winnefeld, F.; Zajac, M. Hydration of quaternary Portland cement blends containing blast-furnace slag, siliceous fly ash and limestone powder. Cem. Concr. Compos. 2015, 55, 374–382. [Google Scholar] [CrossRef]
- Lothenbach, B.; Scrivener, K.; Hooton, R.D. Supplementary cementitious materials. Cem. Concr. Res. 2011, 41, 1244–1256. [Google Scholar] [CrossRef]
- Luxán, M.P.; Madruga, F.; Saavedra, J. Rapid evaluation of pozzolanic activity of natural products by conductivity measurement. Cem. Concr. Res. 1989, 19, 63–68. [Google Scholar] [CrossRef]
- McCarter, W.J.; Tran, D. Monitoring pozzolanic activity by direct activation with calcium hydroxide. Constr. Build. Mater. 1996, 10, 179–184. [Google Scholar] [CrossRef]
- Zhang, P.; Li, Q.; Zhang, H. Combined effect of polypropylene fiber and silica fume on mechanical properties of concrete composite containing fly ash. J. Reinf. Plast. Compos. 2011, 30, 1349–1358. [Google Scholar] [CrossRef]
- Sun, J.; Shen, X.; Tan, G.; Tanner, J.E. Compressive strength and hydration characteristics of high-volume fly ash concrete prepared from fly ash. J. Therm. Anal. Calorim. 2019, 136, 565–580. [Google Scholar] [CrossRef]
- Upadhyay, R.; Srivastava, V.; Arpan, H.; Mehta, P. Effect of Fly Ash on Flexural Strength of Portland Pozzolona Cement Concrete. J. Acad. Ind. Res. 2014, 3, 218–220. [Google Scholar]
- Kuzel, H.-J.; Pöllmann, H. Hydration of C3A in the presence of Ca(OH)2, CaSO4·2H2O and CaCO3. Cem. Concr. Res. 1991, 21, 885–895. [Google Scholar] [CrossRef]
- EN 450-1:2012; Fly Ash for Concrete—Part 1: Definition, Specifications and Conformity Criteria. European Committee for Standardization (CEN): Brussels, Belgium, 2012.
Figure 1.
(a) Location of Moneypoint power station in Ireland, (b) Moneypoint site layout.

Figure 2.
Fly ash storage zones at Moneypoint power station, Co. Clare.

Figure 3.
CaO-SiO2-Al2O3 ternary diagram.

Figure 4.
mm cement samples.

Figure 5.
Fly ash particle-size distribution using BS EN 833 [9].
Figure 5.
Fly ash particle-size distribution using BS EN 833 [9].

Figure 6.
SEM images of unhydrated fly ash.

Figure 7.
SEM images of hydrating cement blend with 20% fly ash after 60 days.

Figure 8.
XRD pattern for fly ash in Phase 1. Significant amorphous content within highlighted area (15–35 2).
Figure 8.
XRD pattern for fly ash in Phase 1. Significant amorphous content within highlighted area (15–35 2).

Figure 9.
Fly ash samples moisture content.
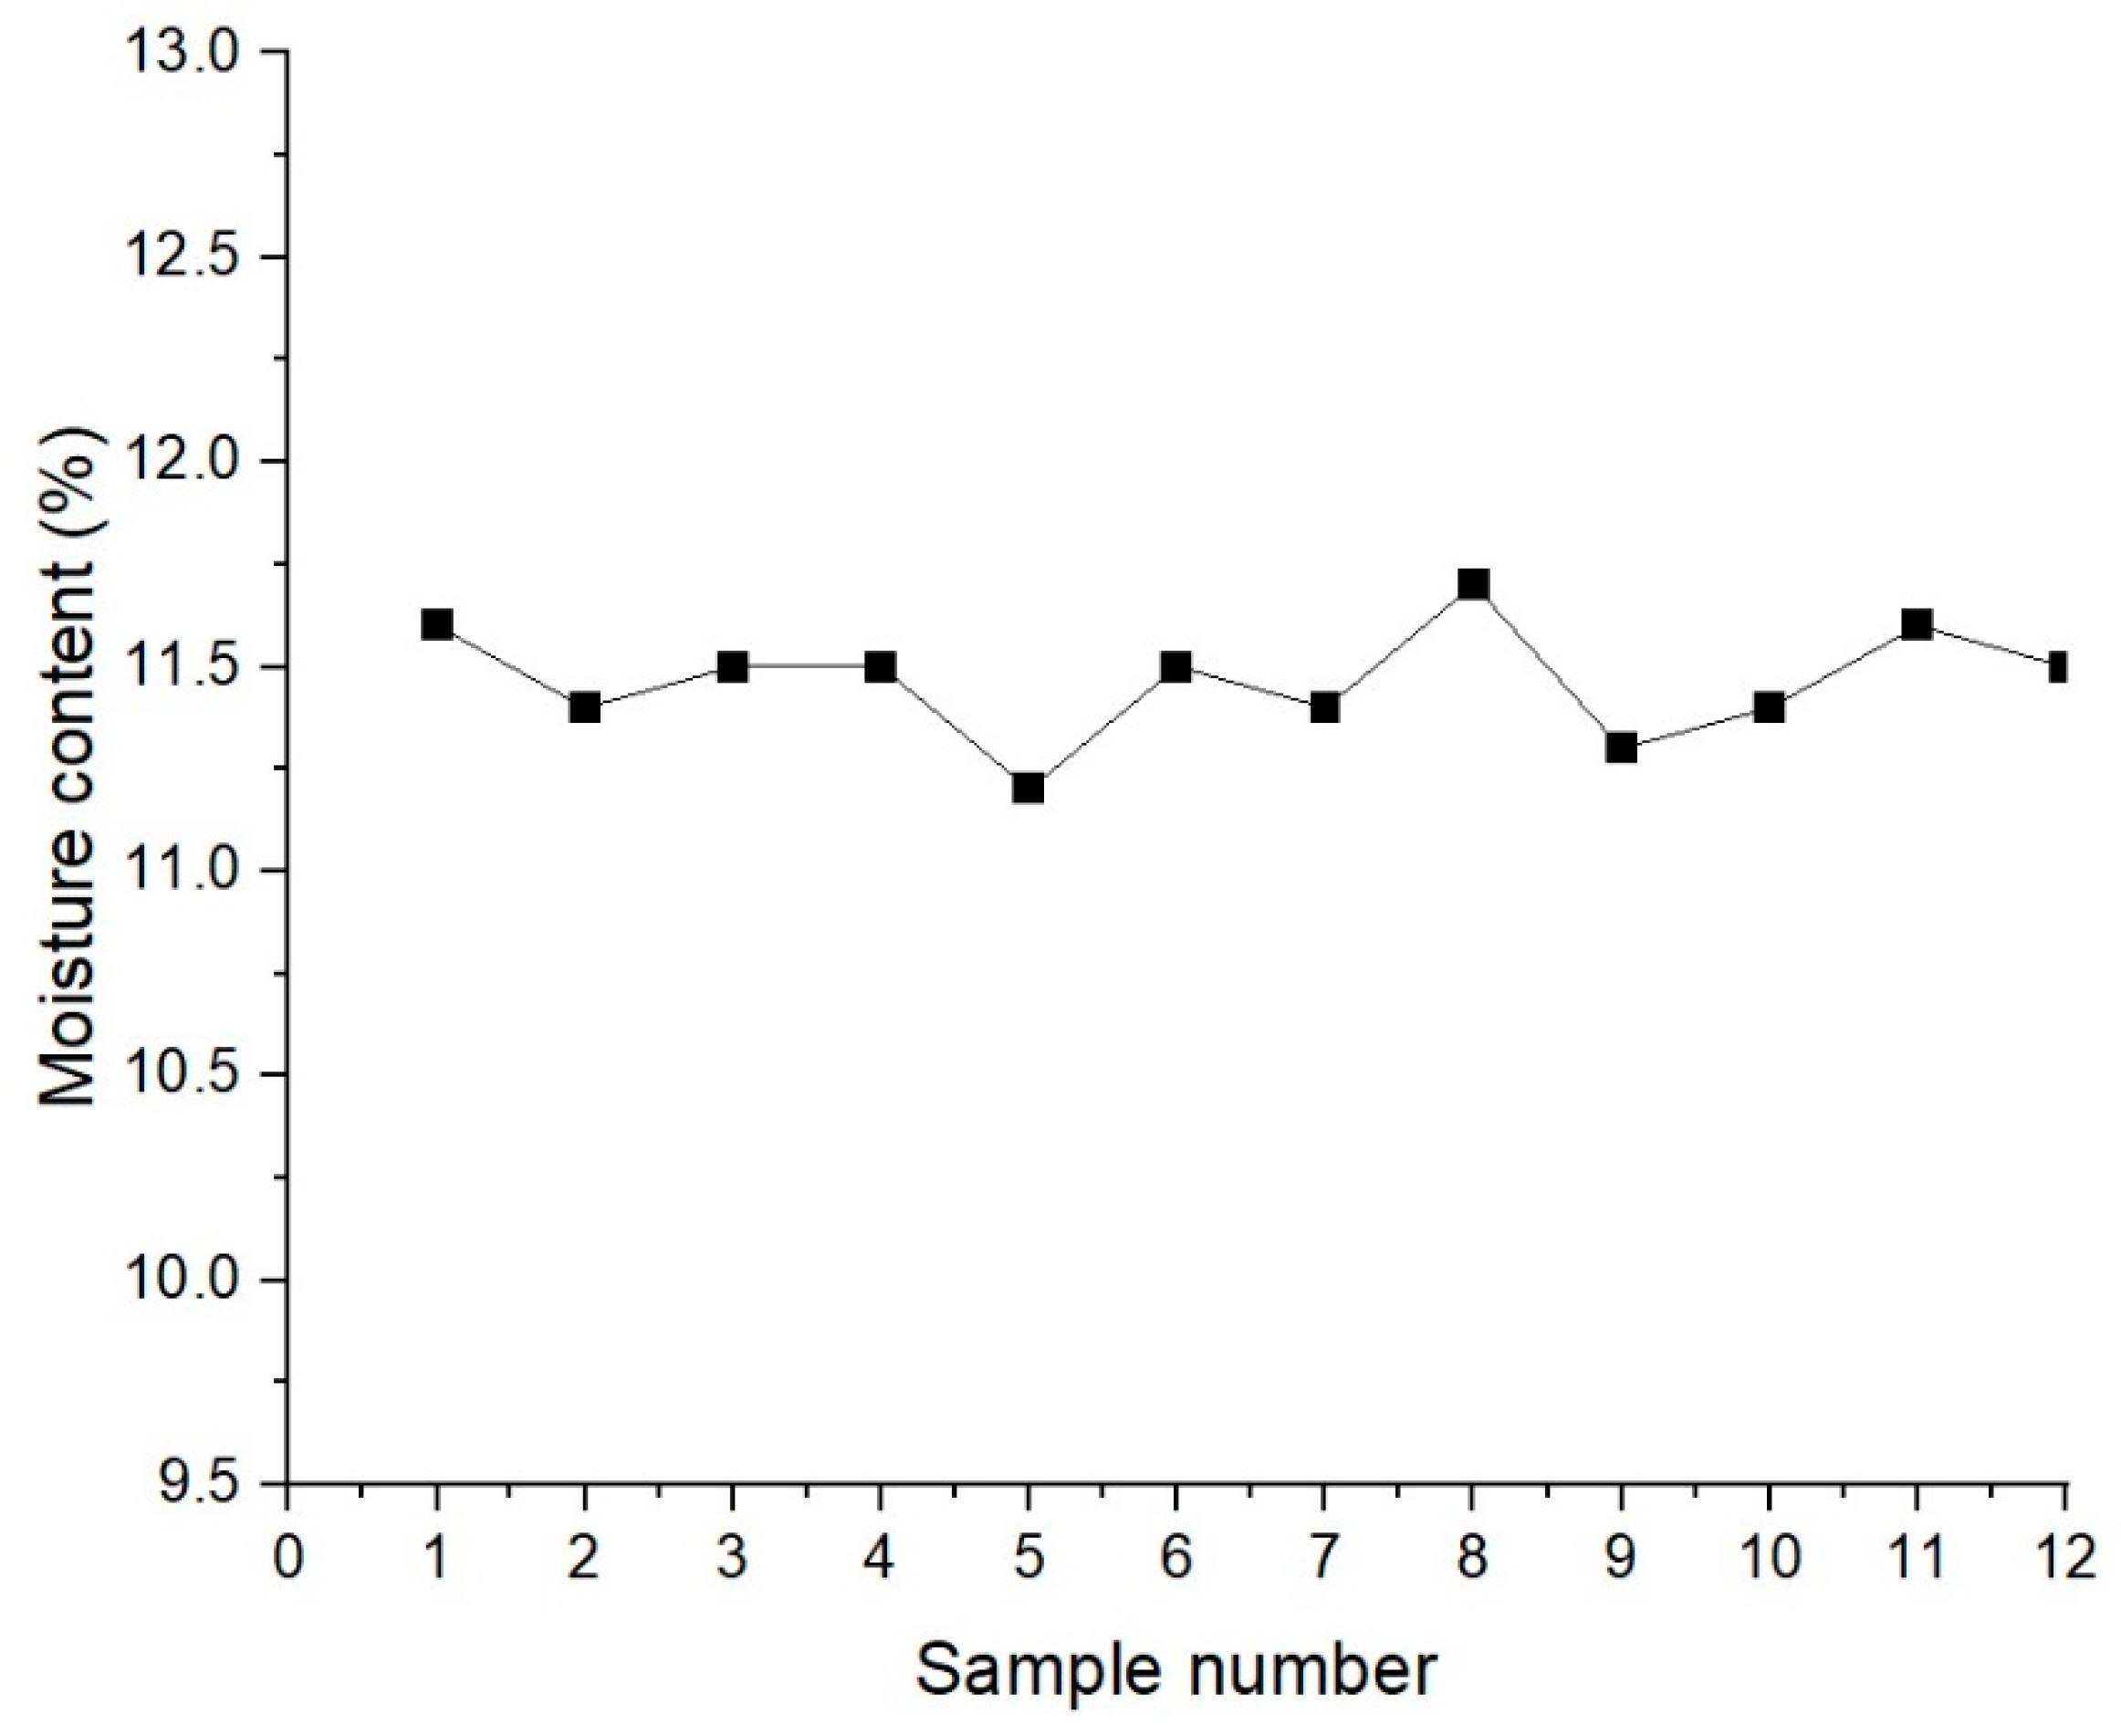
Figure 10.
Concrete compressive strength results.
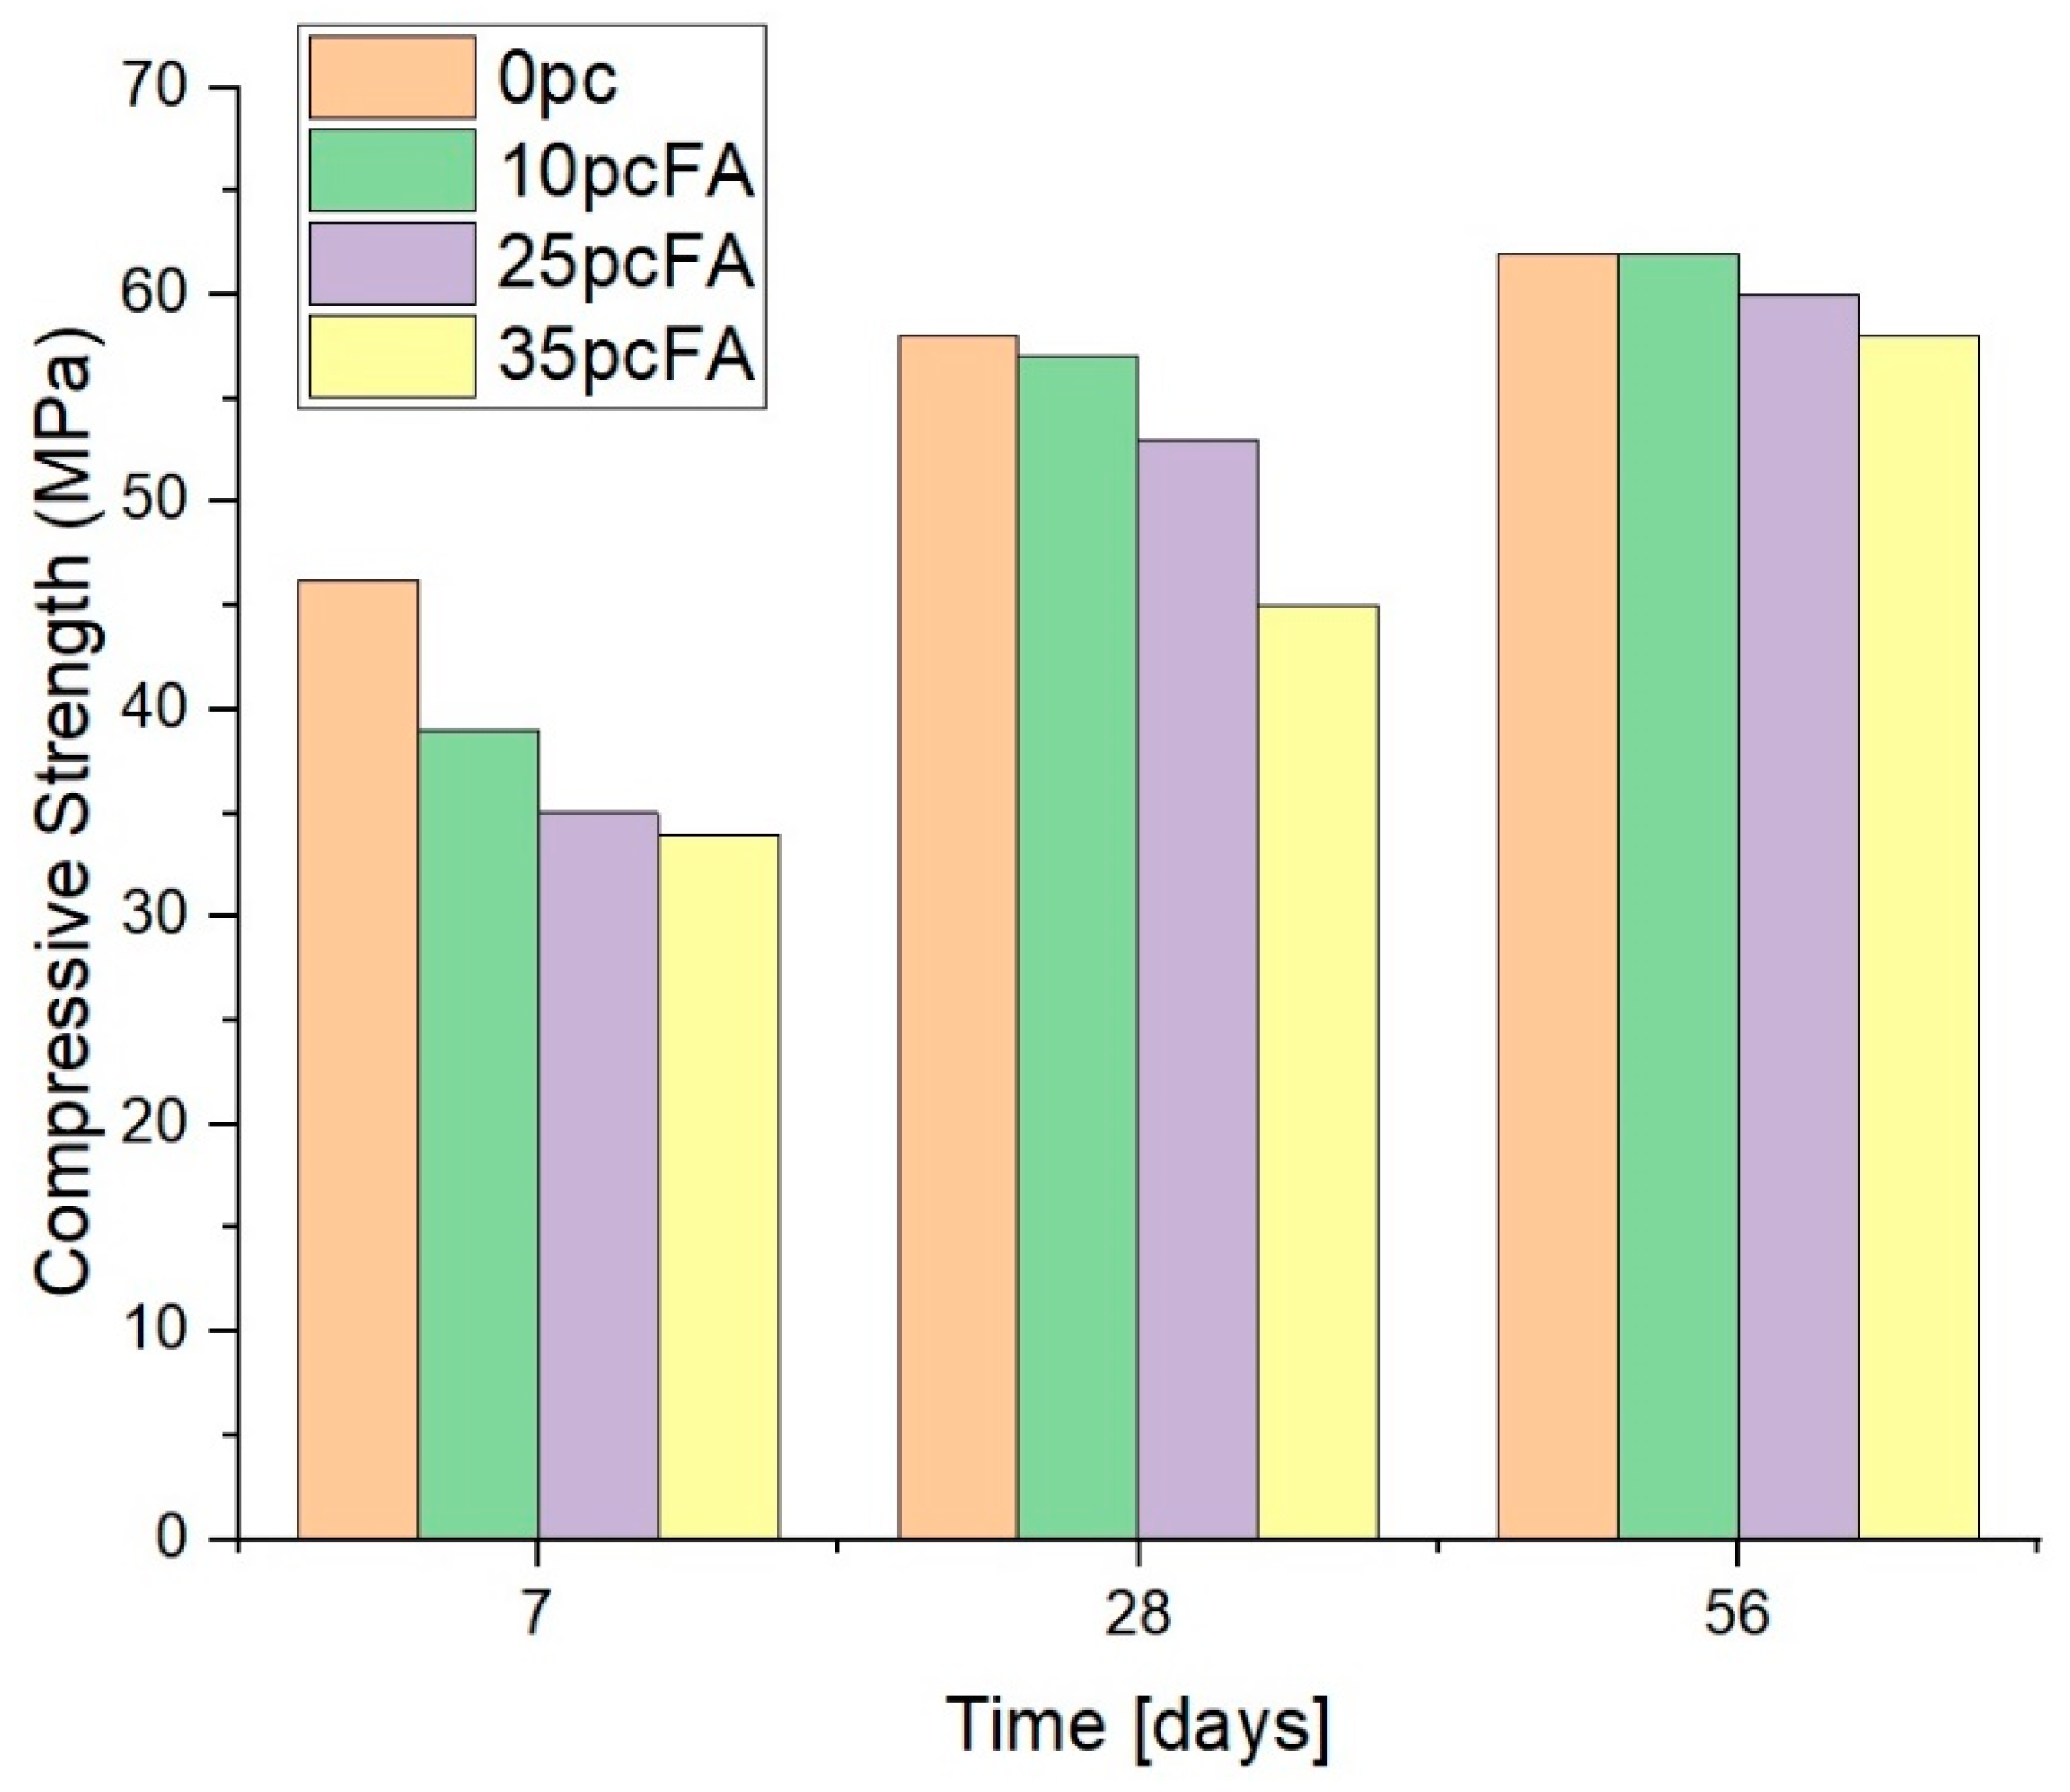
Figure 11.
XRD patters from 5 to 35 2 for CEM I.

Figure 12.
XRD patterns of blended fly ash cements with 0, 10, 20 and 35% replacement levels.

Figure 13.
Phase assemblage changes over time for 0, 10, 20 and 35% FA replacement levels.

Figure 14.
Phase assemblage for fully hydrated binder with fly ash replacements ranging from 0 to 35%.
Figure 14.
Phase assemblage for fully hydrated binder with fly ash replacements ranging from 0 to 35%.


Table 1.
Binders studied (wt.%).
| CEM I-FA | CEM I | FA |
|---|---|---|
| 100-0 | 150 | 0 |
| 90-10 | 135 | 15 |
| 80-20 | 120 | 30 |
| 65-35 | 97.5 | 52.5 |
Table 2.
Composition of CEM I cement and fly ash.
| Oxide (g/100 g) | CEM I a | FA |
|---|---|---|
| SiO2 | 19.04 | 53.70 |
| Al2O3 | 5.01 | 16.81 |
| Fe2O3 | 2.83 | 13.46 |
| CaO | 63.4 | 7.41 |
| MgO | 2.31 | 2.08 |
| K2O | 0.54 | 2.03 |
| Na2O | 0.28 | -- |
| SO3 | 2.65 | 1.11 |
| CaO (free) | 1.71 | -- |
| CO2 | 2.2 | -- |
| Periclase | 1.0 | -- |
| P2O5 | 0.41 | |
| TiO2 | 1.82 | |
| MnO | 0.13 | |
| LOI | 3.20 | 2.55 |
| Density (g/cm3) | 2.95 | 2.24 |
| Blaine fineness (m2/kg) | 386 | 450 |
a XRF data for the CEM I cement were obtained from the manufacturer.
Table 3.
Mineralogical composition of CEM I and fly ash used (wt.%).
| CEM I a | FA b | ||
|---|---|---|---|
| C3S | 55.86 | Quartz | 1.29 |
| C2S | 10.07 | Calcite | 1.11 |
| C3A | 8.12 | Hematite | 4.65 |
| C4AF | 8.24 | Mullite | 7.95 |
| Lime | 1.64 | Magnetite | 3.37 |
| Calcite | 4.79 | Amorphous | 81.65 |
| Gypsum | 4.27 | ||
| Periclase | 0.96 | ||
| K2SO4 | 0.86 | ||
| Na2SO4 | 0.28 | ||
| K2O | 0.05 | ||
| Na2O | 0.15 | ||
| MgO | 2.21 | ||
| SO3 | 2.53 | ||
a CEM I composition calculated using normalisation [8]. b Determined using XRD Rietveld.
Table 4.
Mix proportions.
| Mix ID | % PFA | Mass (kg/m3) | ||||
|---|---|---|---|---|---|---|
| Water | CEM I | FA | CA | |||
| 10 mm | 20 mm | |||||
| 1 | 0 | 200 | 400 | 0 | 350 | 700 |
| 2 | 10 | 200 | 360 | 40 | 350 | 700 |
| 3 | 25 | 200 | 300 | 100 | 350 | 700 |
| 4 | 35 | 200 | 260 | 140 | 350 | 700 |
Table 5.
Mineral composition of Moneypoint fly ash by Alelweet et al. [16].
Table 5.
Mineral composition of Moneypoint fly ash by Alelweet et al. [16].
| Material | % Glass | % Crystalline | Mineral Composition |
|---|---|---|---|
| FA °C | 40–60 | 60–40 | Glass Quartz (SiO2) Mullite (2Al2O3.2SiO2) |
| FA 500 °C | 10–30 | 70–90 | Glass Quartz (SiO2) Mullite (2Al2O3.2SiO2) |
| FA 800 °C | 10–30 | 70–90 | Glass Quartz (SiO2) Mullite (2Al2O3.2SiO2) |
| FA 1000 °C | 10–30 | 70–90 | Glass Quartz (SiO2) Mullite (2Al2O3.2SiO2) Hematite (Fe2O3) Possible Ca3Al2O6 and alkali sulphate |
Disclaimer/Publisher’s Note: The statements, opinions and data contained in all publications are solely those of the individual author(s) and contributor(s) and not of MDPI and/or the editor(s). MDPI and/or the editor(s) disclaim responsibility for any injury to people or property resulting from any ideas, methods, instructions or products referred to in the content. |
© 2024 by the authors. Licensee MDPI, Basel, Switzerland. This article is an open access article distributed under the terms and conditions of the Creative Commons Attribution (CC BY) license (https://creativecommons.org/licenses/by/4.0/).
Share and Cite
MDPI and ACS Style
Shaji, N.; Holmes, N.; Tyrer, M. Early Age Assessment of a New Course of Irish Fly Ash as a Cement Replacement. Appl. Sci. 2024, 14, 4128. https://doi.org/10.3390/app14104128
AMA Style
Shaji N, Holmes N, Tyrer M. Early Age Assessment of a New Course of Irish Fly Ash as a Cement Replacement. Applied Sciences. 2024; 14(10):4128. https://doi.org/10.3390/app14104128
Chicago/Turabian StyleShaji, Nikki, Niall Holmes, and Mark Tyrer. 2024. "Early Age Assessment of a New Course of Irish Fly Ash as a Cement Replacement" Applied Sciences 14, no. 10: 4128. https://doi.org/10.3390/app14104128
Note that from the first issue of 2016, this journal uses article numbers instead of page numbers. See further details here.