Article

Unstable State of Hydrologic Regime and Grain Yields in Northern Kazakhstan Estimated with Tree-Ring Proxies

by
Irina P. Panyushkina
1,*,
Altyn Shayakhmetova
2,*,
Sergey Pashkov
3 and
Leonid I. Agafonov
4
1
Laboratory of Tree-Ring Research, University of Arizona, Tucson, AZ 85721, USA
2
Agrotechnological Faculty, M. Kozyrbaev North Kazakhstan University, Petropavl 150000, Kazakhstan
3
Math and Natural Sciences Faculty, M. Kozyrbaev North Kazakhstan University, Petropavl 150000, Kazakhstan
4
Institute of Plant and Animal Ecology UB RAS, Yekaterinburg 620144, Russia
*
Authors to whom correspondence should be addressed.
Agriculture 2024, 14(6), 790; https://doi.org/10.3390/agriculture14060790
Submission received: 19 April 2024 / Revised: 14 May 2024 / Accepted: 16 May 2024 / Published: 21 May 2024
(This article belongs to the Section Crop Production)

Abstract

:
Changes in the hydrologic regime impose great challenges for grain production. We investigated the impact of dry and wet extremes on the recent losses of crops in Severo-Kazakhstanskaya Oblast (SKO), where 25% of Kazakhstan’s wheat is produced. We reconstructed the Palmer Drought Severity Index (June–August PDSI) and average grain yields (with an explained variance of 48% and 44%, respectively) using five tree ring width chronologies. The extended history of the moisture variability and yields of spring wheat, oats, and barley shows the strong impact of hydrology, rather than the heat, on the grain production. We defined three distinctive hydrologic regimes in SKO: (1) 1886–1942, (2) 1943–1977, (3) 1978–2023. The early regime had fewer drought events, including some that covered a single year. Their duration increased up to 3 years in the second period. The latest regime is an extreme mode of hydrologic variability with events abruptly switching from extremely dry to extremely wet conditions (called “whiplash”). The 21st century regime signifies that the intensified and prolonged decade-long drought transitioned into pluvial condition. The new regime created sizable instability for grain producers. This crop yield reconstruction denotes the potential of the tree-ring proxy for understanding the impact of climate change on the agriculture and food security of Central Asia.

1. Introduction

Increased climatic variability and more frequent extreme weather raise concerns about the sustainability of high crop yields in the near future [1,2,3,4]. In this study, we investigate the impact of climate change on grain crop production in Kazakhstan. Kazakhstan is an important producer of grains in Central Asia and a major exporter of wheat to Europe and Asia [5]. In the Severo-Kazakhstanskaya Oblast (hereafter designated SKO), where 25% of the country’s wheat is produced, wheat yields, particularly in the last two decades, have increased significantly. In part, the recent high yields have been sustained by governmental subsidies, higher quality cultivars, and improved harvesting technology. Nonetheless, in the last 3–4 years, extremely cold springs, mid-summer heat, and extremely wet late summers struck an agricultural industry that lost up to 50% of its grain crops due to delayed or shortened developmental stages of the wheat phenology, which consequently impaired the quality and quantity of the grain crop. Kazakhstan statistical services estimate up to a 72% drop in wheat and barley yields for the marketing year 2023/24 in northern Kazakhstan (https://fas.usda.gov/regions/kazakhstan, access on 10 April 2024).
The majority of studies on the impact of climate change on grain crops have focused on the rising temperatures, extreme heat, and droughts that adversely affect plant growth and development [4,6,7,8,9,10]. At a global scale, for each degree rise in temperature, wheat production is estimated to decline by 6% [7]. In Eurasian breadbaskets, wheat at the grain filling stage is most vulnerable to the heat of extreme temperatures [11,12], while high evapotranspiration during the wheat heading and flowering stages makes the crop sensitive to drought [13]. Understanding the impact of soil moisture and precipitation on grain yields carries a significant degree of uncertainty due to their dependency on the phenological stage of the cultivated species. Experimental studies have attributed a wide range of impacts from precipitation on the phenological stages of barley and oats by measuring the adaptability of oats to excess moisture at an early growth stage (0–28 days after sowing to grain filling) and the risky intolerance of barley to heavy rains [14]. Wheat does not react much to water stress during the milk–grain stages, yet short-term flooding significantly lowers photosynthetic activity, and, if it occurs during the stem elongation phase, the flooding may lead to crop failure [15]. The consensus predicts that grain yields would be reduced considerably if high temperature extremes and heavy precipitation become more frequent [3,4,6,16]. The biomass accumulation of the grain depends not only on temperature or precipitation but also on the interaction between the extreme weather conditions and the reproductive and grain filling stages of plant growth [17,18].
The goal of this study is to estimate the impact of hydrologic regime change on grain production in SKO, the breadbasket of Kazakhstan. SKO cultivates spring wheat on 2,567,603 ha, barley on 489,757 ha, and oats on 43,504 ha. Although wheat is grown over a wide range of environments and climatic regimes [19], northern Kazakhstan is considered a zone of extreme agroclimatic conditions for wheat production, since it is in a forest steppe biome with mixed hydrologic regimes of arid steppe and mesic boreal forest (Figure 1). Paradoxically, such complexity of the hydroclimate regime prompts the failure of wheat crops that are affected by both moisture deficit and water excess. The sensitivity of wheat crops to the impact of water stress is highly variable and depends on the phenological stage of the plant, as well as the duration, intensity, and frequency of the water stress [20]. Forecasting long-term trends in crop productivity requires an understanding of the decadal and multidecadal variability of hydrologic regimes in a particular area, since precipitation is a highly variable parameter. We hypothesize that in SKO the frequency and duration of extreme mesic and extreme arid conditions may control the trend in grain production. In this paper, we use tree-ring width proxies to reconstruct the interannual, decadal, and multidecadal variability of moisture and grain yields.
Tree-ring proxies have been successfully applied to reconstruct the yield of agricultural crops under various agroclimatic states. In dendrochronology, the relationship between the hydrologic regime (specifically droughts) and crop yields has been recognized from the very early association of tree ring growth with the climate [21,22]. Surprisingly, up to now there are very few well-calibrated reconstruction models for the yields of corn, rye, and wheat from Central America, North Africa, Fennoscandia, South Siberia, and China [23,24,25,26,27,28].

2. Materials and Methods

2.1. Study Area

Severo-Kazakhstanskya oblast (also called the Northern Kazakhstan region), the capital of which is the city of Petropavl, is one of the principal producers of grain crops in Central Asia. This administrative division of the Republic of Kazakhstan is approximately 600 km by 375 km (52° N–55° N latitude and 65° E–74° E longitude). It has a highly productive chernozem soil, and its agroclimatic resources are favorable for the growth of cereals, ligaments, oilseeds, and forage grasses [29]. The province is situated in a forest steppe biome with small patches of temperate steppe to the southwest and southeast (Figure 1a). There is a temperate continental climate. As observed at the Petropavlovsk weather station (Figure 1b), the summer is warm (July +19.29 °C) with 60–70% relative humidity, and the winter is cold (January −17.5 °C). The annual precipitation is 350 mm with a summer maximum (July). The length of the pine growing season is about 3 months. The season starts between March 28 and May 25.
The climatology of the region is suitable for the cultivation of grains, especially wheat (Triticum aestivum L.), oats (Avena sativa L.), and barley (Hordeum vulgare L.). The cultivation of these crops requires the average sum of the active temperatures above 10 °C (SAT) to be between 1500 °C and 1900 °C for ripening. The optimal temperature of the seed germination is +7 °C–10 °C for spring wheat and +12 °C–16 °C for the other grains. The SAT regime is critical for the first 16–29 days of grain growth, which occurs in June. The optimum precipitation for grain growth is ca. 200 mm [29].
Figure 1. Geography and climate of the studied Severo-Kazakhstanskaya Oblast (SKO). (a) Ecological map of Kazakhstan [30] (modified) and location of the modeling data: red triangles = weather stations, and black circle = tree-ring sites from Table 1 and Table 2. Blue marks the lakes. SKO mainly overlaps with the forest steppe ecological zone. (b) Climagraph boxplot of Petropavlovsk weather station (1933–2022). Note that Petropavl city used to have the name of Petropavlovsk and the weather station still carries this name. Monthly precipitation (top) and temperature (bottom) are plotted as the median (red horizontal line) over the interquartile range (blue box), and the red cross symbols are placed at values more than 1.5 times the interquartile range marked above or below the box. If there are no such outliers, the bracket marks the data extremes. The X-axis shows months from January (J) to December (D).
Agriculture 14 00790 g001

2.2. Tree-Ring Data

In the reconstruction, we used five tree-ring width chronologies of Pinus sylvestris, two of which were calculated from the cross-dated time series archived at the International Tree-Ring Data Bank [31,32]. Three other chronologies were developed using the standard techniques for wood sample preparation and cross-dating [33]. The tree-ring sites sampled across SKO are about 400 km apart, and two sites are in the Russian Federation near the border with Kazakhstan (Figure 1a map and Table 1).
Table 1. Statistics of tree-ring width chronologies used in this study.
#Site CodeCoordinatesNumber TreesSpanLength,
Years
EPS ≥ 0.85
Start Year
Interserial
Correlation
St. Dev.
1CRO54.06° N
69.10° E
221850–201016118770.690.42
2CBK53.56° N
69.31° E
271842–201117018560.620.31
3CSA52.62° N
68.79° E
301785–201022618180.750.45
4* russ36453.44° N
49.78° E
331786–201422918020.640.34
5* russ36753.36° N
46.89° E
311799–201421618030.570.31
* Chronologies from the International Tree-Ring Data Bank [31]. EPS is expressed population signal that quantifies the sample size. St. Dev. is Standard Deviation.
The tree-ring index chronology was calculated with a biweight robust mean of the detrended tree series. The detrending was completed with a cubic smoothing spline [34], applied to the cross-dated ring width measurements. The chronology variance was stabilized with the Briffa method [35], which accounts for the dependency of the variance on the sample size of the chronology population. The chronologies included 22–33 tree series and spanned between 161 and 229 years, ending in 2010–2014. Tree-ring chronologies were computed in the ARSTAN program [36]. Residual versions with removed autocorrelation (res) were used in the reconstruction modeling. The coherence of the tree-ring width variance in a chronology (the averaged curve) was measured with the EPS (the expressed population signal), which quantifies the degree to which a particular sample size represents a hypothetically perfect chronology with unaffected variance due to the reduced sample size in the early part [37]. The tree-ring index chronologies included in the modeling were truncated to the EPS ≥ 0.85 interval.

2.3. Climate Data

Table 2 provides information about the two weather stations from SKO used in the correlation analysis. The monthly data regarding precipitation (mm) and mean air temperature (°C) measured at the Saumalkol weather station were obtained from the KazHydroMet archive. The Petropavlovsk data are from the Global Historical Climate Network (GHCN), version 3 [38], downloaded from https://climexp.knmi.nl (accessed on 15 November 2023). The two datasets start at 1966 and 1933, respectively, and were updated until 2022. The monthly self-calibrated Palmer Drought Severity Index (scPDSI) was downloaded from http://climexp.knmi.nl (accessed on 15 November 2023). The index is calculated from the HadCRUT4 surface air temperature and precipitation over a calibration period of 1950–1979 using local conditions [39,40]. The June–August scPDSI series of a grid of 53° N–54° N × 67° E–68° E over the period of 1947–2020 (98 years) was used for the tree ring reconstruction model.
Table 2. Monthly climate data used in this study. #1 is temperature and precipitation from the Global Historical Climate Network (GHCN), and #2 from the KazHydroMet. #3 is the self-calibrating Palmer Drought Severity Index (PDSI).
#Station NameInterval Latitude, °N Longitude, °E Elevation, asl
1Petropavlovsk1933–202254.83 69.15 134 m
2Saumalkol1966–202253.18 68.06 325 m
3PDSI grid1947–202053–54 67–68 n/a

2.4. Crop Data

Averaged data of grain yields at the province-level (the oblast) in centner per hectare for the internal 1945–2022 (75 yrs) were assembled from reports of the Kazakhstan statistical services (KazStat). The data were collected from collective (prior to 1991) and industrial farms with an intensive production of grain crops. The average yield data measured in centner per hectare include the three main crops in the region: spring wheat, oats, and barley, which were analyzed; hereafter, they are called the grain yield. Table 3 shows the growth dates of these crops in SKO.

2.5. Statistical Analysis

The relationship of the climate with tree rings and grain yield was estimated with the Seascorr MatLab program [41], which calculates Pearson correlations and partial correlations between tree-ring index series (or the crop yield) and monthly data on mean air temperature and precipitation aggregated over seasons of variable lengths: one, three, and six months. The significance of Pearson correlations and partial correlations between the variables was assessed with Monte Carlo simulations. The correlation analysis estimates the main climatic parameter and the seasonal window influencing the variance in the tree ring and grain growth series. The grouping of primary correlations is used to select the seasonal window for reconstructing the PDSI.
The reconstructed models were built using the ReconAnalog R-program that preforms a two-stage stepwise regression [42]. The stage 1 stepwise regression screens a set of lagged tree ring chronologies and converts each chronology into a separate single-site reconstruction (SSR). Stage 2 is a multi-site reconstruction (MSR) that fits the stepwise regression on the principal component (PC) scores of the SSRs to assemble a final reconstruction model from multiple sites. The PCA is performed on the covariance matrix to scale the variability of the tree ring chronologies. This two-stage approach called SSR-MSR emphasizes the strong signal span between multiple chronologies and lessens any model over-fitting. The approach was applied to a reconstruction of the stream flow from multiple tree-ring sites, e.g., [43]. The cross-validation and split-sample validation of the MSR model were performed for the 1947–2010 (PDSI Model) and 1945–2012 (Grain Yield Model) periods. The skill of the reconstruction was estimated with the reduction in error (RE) statistic reported for both the cross-validation and split-sample validation [44]. The testing for normality in the cross-validation residuals was performed with the root mean square error (RMSE). The residuals were also analyzed to validate the best fit with the Durbin–Watson statistic (DW), which detects prediction errors [45]. The F-statistic was used for calculating the significance of the regression model considering the degrees of freedom.

3. Results and Discussion

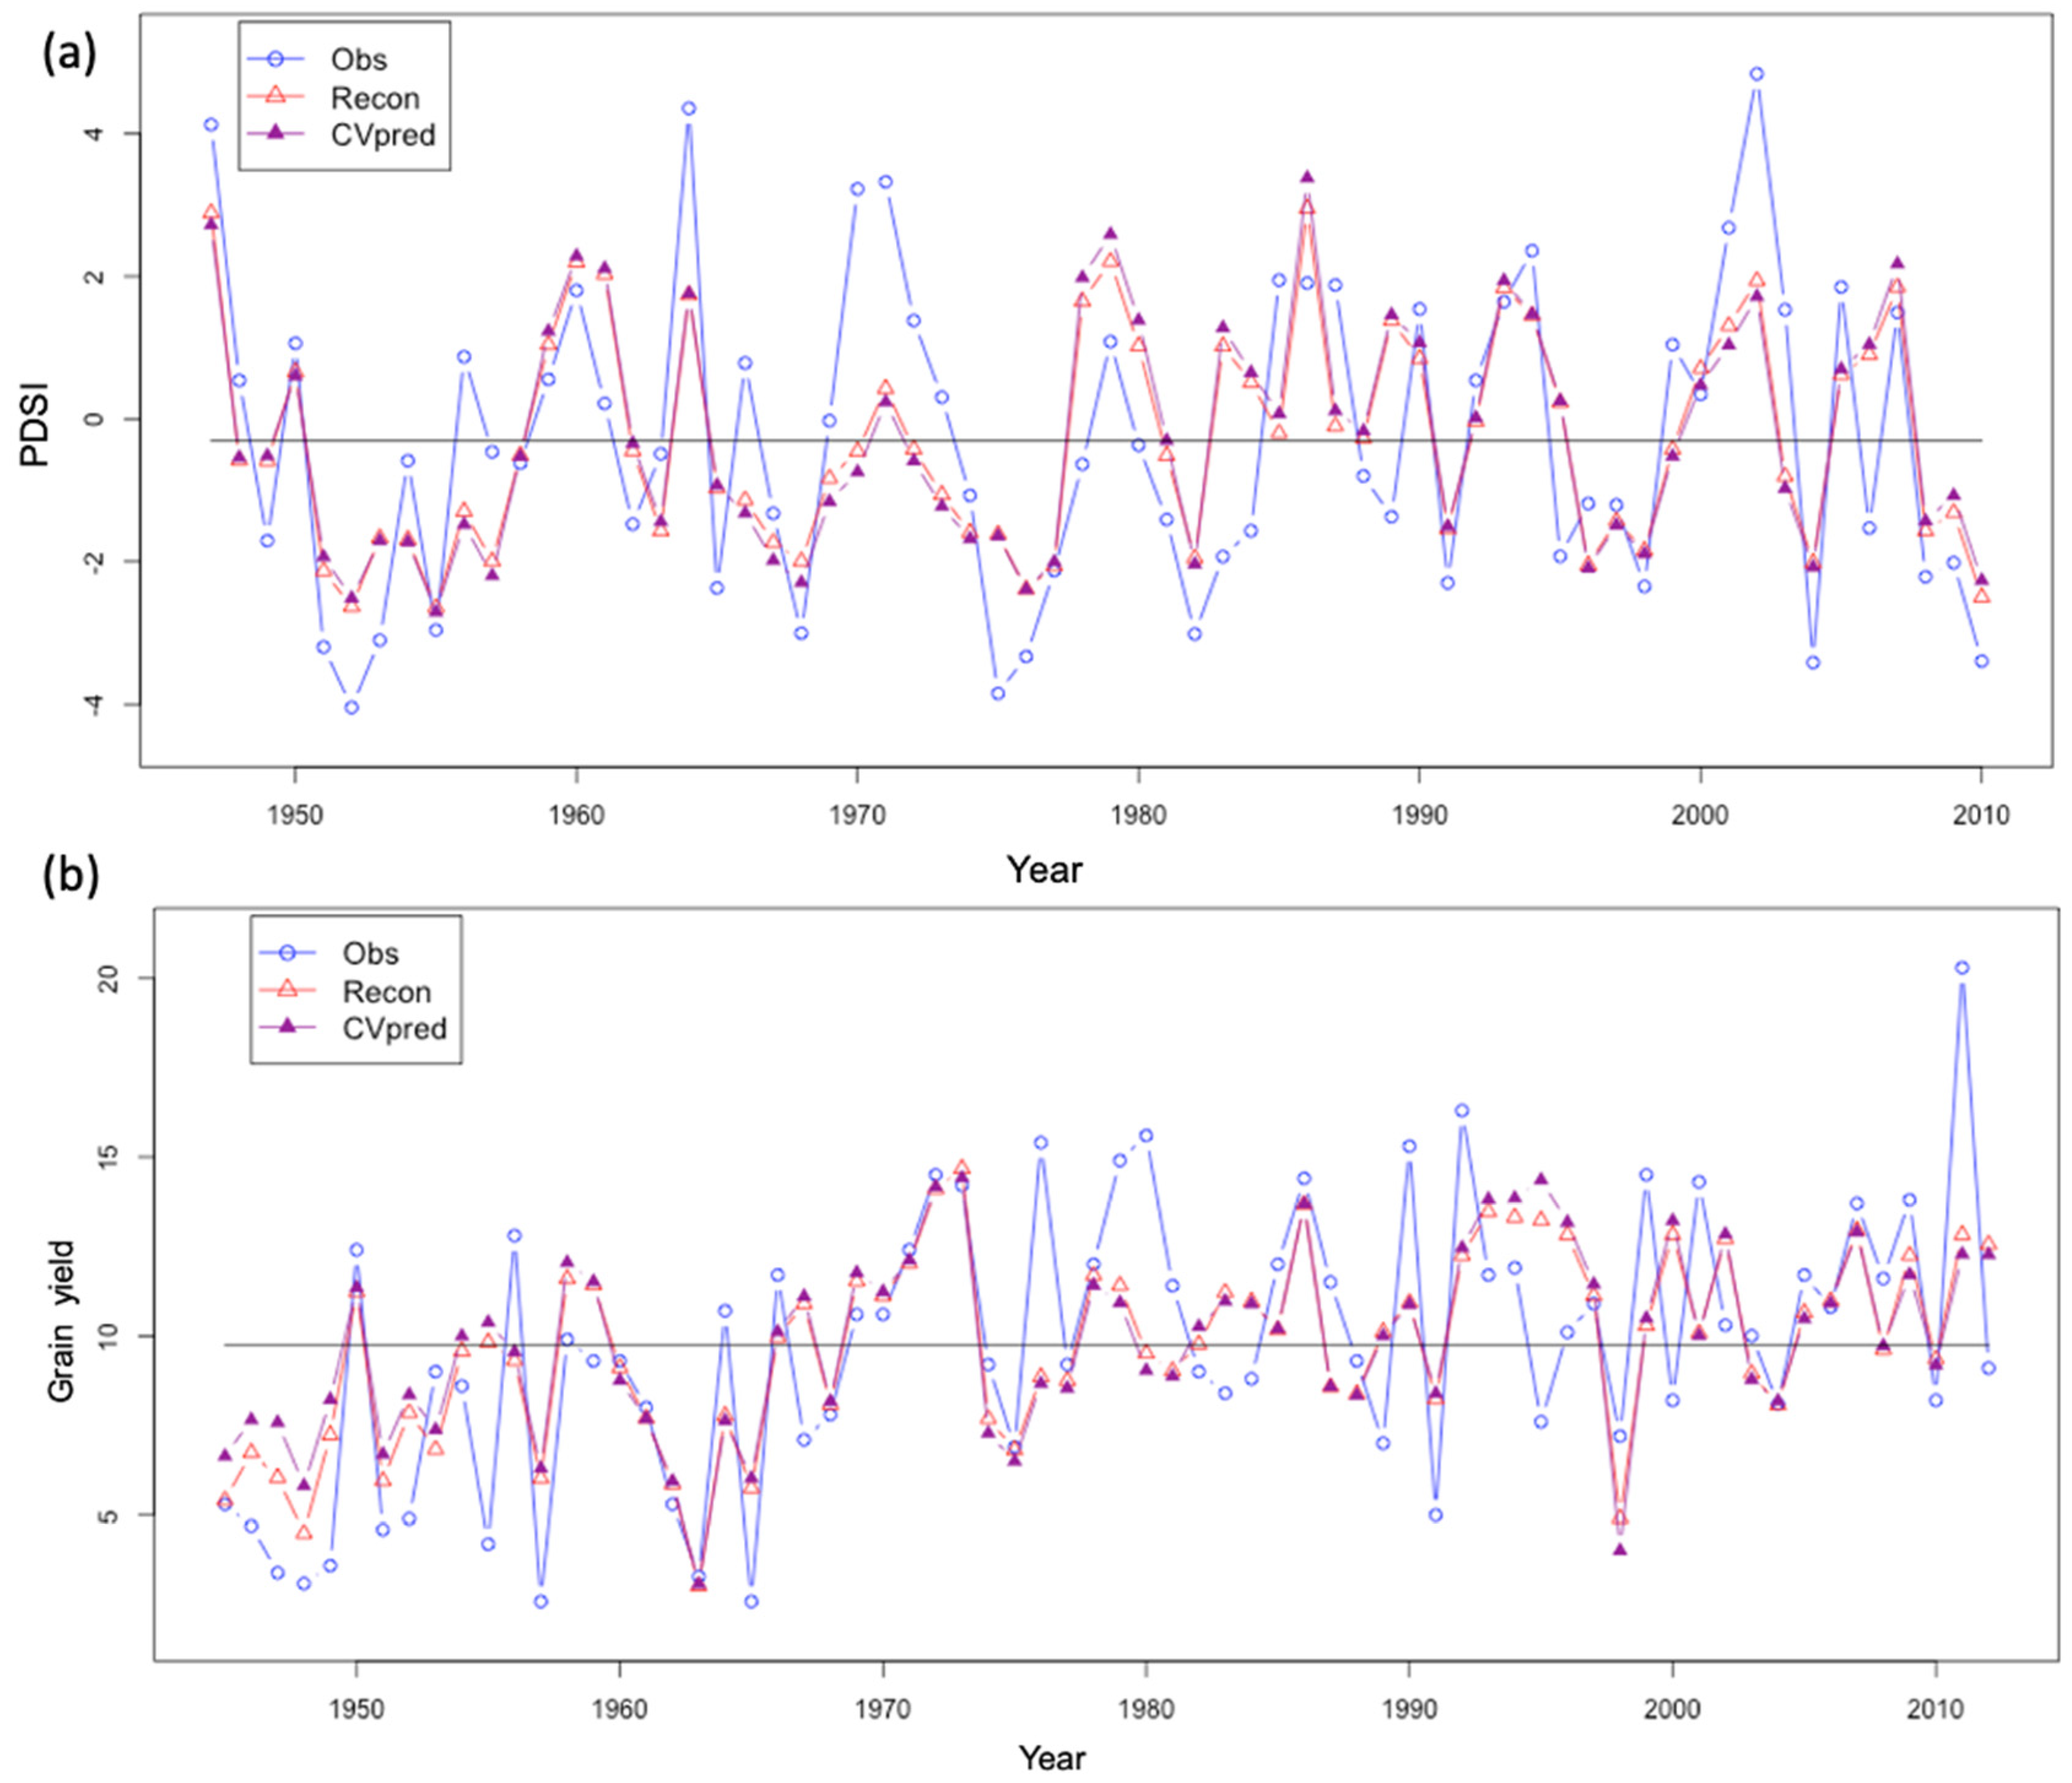
3.1. Tree Ring Reconstructions

We calculated five tree-ring index chronologies of Scots pine and used their residual versions in the reconstruction. Table 1 shows a strong common signal and stabilized sample size variance after 1885 in these records. The correlation analyses between the climate and tree-ring chronologies and the average grain yield series show that the climate impacts pine tree growth and grain yield in the same way. A warm Jun–Aug reduces plant growth (Figure 2), while summer precipitation positively influences growth. The primary temperature correlations are negative and indicate that a cooler spring and June decrease the evapotranspiration and preserve the soil moisture for longer, helping the plants initiate growth. Additionally, grain plants experience the negative impact of temperatures in May when the seeds germinate (the sowing stage). The partial correlation of the grain yield with precipitation is weaker in spring and early summer, suggesting that the soil holds the snowmelt water well and the plants have sufficient moisture. This tendency breaks by July, and the moisture stress on plants becomes visibly stronger, which is detected from the stronger correlation with the precipitation in July and August. A warm fall is important for the growth transition to dormancy but irrelevant to wheat and barley, because their harvest takes place in August. It is noteworthy that temperature has no significant impact on the studied plants outside of the warm season, while the impact of the hydrologic regime compounds annually because of the soil moisture (Figure 2, the 12-month season results). The mixed climatic signal retained by both temperature and precipitation variations is important for highlighting the matching impact of soil moisture on the pine tree ring proxies and grain crops. The tree rings and grain crops from other regions of Inner Eurasia showed similar correlation patterns with the climate [26,27,28].
The climate response of the grain group related to the phenology of spring wheat, barley, and oats in SKO, although these correlations are not detailed, due to the lack of individual crop statistics and the low-resolution monthly climate data that we used. Physiologically, wheat and barley prefer a cool June [30]. Tillering occurs best at June temperatures of 10–12 °C, which stimulate the intensive development of the root system. The reproductive growth occurs in June–early July for spring wheat. The moisture sensitivity of wheat appears the highest during a 20–30-day growth stage of stem elongation [46]. A moisture deficit due to high transpiration in May–June and low precipitation in July are the main factors of crop failure and a reduced grain yield in the study area [12,47]. A heavy rain episode in August may severely affect the crop production due to harvest complications and crop damage (according to personal communication with farmers) and such a signal may be present in the yield records, but it is not accounted for in our analysis.
We employed the response of tree-ring growth to temperature and precipitation in building reconstruction models for (1) the Jun–Aug PDSI and (2) grain yields. The two-stage SSR–MSR screening selected for the PCA overlapping variance set of the tree-ring chronologies, adding one altered record for each model: russ367 to the PDSI model and russ367 to the grain yield model (Figure 3). Figure 4 shows the variability modes of the tree-ring chronologies included in the PCA covariance matrix. The loadings of individual chronologies differ in the four PCs. The contrast in the climate signal of some chronologies is probably related to the variation in the seasonality of its responses. As discussed earlier, the pine growth and grain crop development show a slight difference of seasonal windows sensitive to the soil moisture (Figure 2). The final MSR screening selected PC1 and PC2 for the PDSI model (Figure 3a), and for the yield model—PC1, PC2, and PC4 (Figure 3b).
The regression PDSI model, calibrated for the period of 1947–2010, is as follows:
yˆ = aoˆ + b1ˆx1 + b2ˆx2
where x1 is the PC1 and x2 is the PC2 of the corresponding PCA matrix and ao, b1, and b2 are the estimated regression constants and coefficients. This is the estimated Jun–Aug PDSI. The fitted regression model for the PDSI, where y = −0.37 − 0.93 × PC1 + 0.40 × PC2, has the following statistics for the calibration period: R2 = 0.49, R2adj. = 0.48, and F(2,62) = 29.7 (p < 0.000).
The regression grain yield model, with a calibration period of 1945–2012, is as follows:
yˆ = aoˆ + b1ˆx1 + b2ˆx2 + b3ˆx3
where x1 is the PC1, x2 is the PC2, and x3 is the PC3 from the other PCA matrix and ao, b1, b2, and b3 are the estimated regression constants and coefficients. This is the estimated average grain yield for SKO. The fitted regression model for the yield, where y = 9.92 − 1.11 × PC1 − 0.96 × PC2 + 1.12 × PC4, has the following calibration statistics: R2 = 0.47, R2adj. = 0.44, and F(3,65) = 18.6 (p < 0.000).
Figure 4 shows the reconstructed and cross-validated curves for each modeled parameter, where the difference between the comparable curves is small. This indicates the good fit of the regression models and the accuracy of the reconstructed values. The cross-validation statistics in Table 4 support this visual conclusion and demonstrate the stability of the modeled dependencies within the early and late parts of the calibrated period. The residuals are normally distributed and have no significant dependence on the fitted values (see the RE split values in Table 4). The RMSE estimates the normally distributed errors, which once again points to the high quality of the reconstructions. The explained variance of the SKO grain yields in our model (47%) is very similar to other tree ring calibrated models from the forest steppe environments of South Siberia and northern China [27,28], although tree ring models from extremely dry environments like the arid land of North Africa may have 74% of explained variance for precipitation influencing the wheat yields [24]. This indicates the high potential of tree-ring proxies for modeling crop yields in the breadbaskets of Inner Eurasia, where tree-ring networks are available [48].

3.2. Extended History of Moisture Availability

The PDSI tracks short-term agricultural drought well since it responds quickly to changes in the soil water-holding capacity [1,39]. The PDSI values significantly correlate with the measured soil moisture content over summer in Inner Eurasia reaching 0.4–0.8 correlation values [39]. Globally, the PSDI values range from −10 (dry) to +10 (wet) with values below −3 representing severe to extreme dryness (drought) and above +3 an extreme wet spell. In the studied region, the highest (wettest) year was recorded in 2002 (+4.8) and the driest occurred in 1975 (−4.0), although different siPDSI datasets do not hold the maximum values for the same years.
The reconstruction extends the history of the PDSI observations in SKO back to 1886 (Figure 5a) and shows three hydrologic regimes over the last 139 years: (1) 1886–1942, a low variability period with only two extreme droughts in 1911 (PDSI −3.7) and 1920/1921 (PDSI −4.1 and −3.3, respectively), (2) 1943–1977 period of decadal-scale moderate droughts and moderate wet summers, (3) 1978–2023 period with very high inter-annual variability and abrupt shifts between extremely dry and extremely wet years. In the second period, dry or wet extremes last ca. 3 years, but more recently their duration increases up to a decade. Figure 6 demonstrates the latest decadal extremely dry and extremely wet spells. We found that the stable hydrologic state (the first period) shifted to an alternative hydrologic regime (the third period), and this happened gradually (during the second period). The high annual variability of the PDSI indicates the large change in soil water-holding capacity over summer from one year to another. A high-variability alternating mode of concurrent high/low precipitation and temperature is called “whiplash” that was just recently described in California and other arid states of the southwest of the U.S. with tree-ring modeling [49,50]. This feature refers to the most severe and rapid hydroclimate switches between extremes in consecutive years. The most evident “whiplash” years occurred in 1928–29, 1937–38, 1940–41, 1942–43, 1947–49, 1950–51, 1964–65, 1994–95, 2002–04, and 2010–13 with a single year shift of the absolute PDSI value exceeding 4 (Figure 5 and Figure 6). The latest record of the PDSI in SKO shows that the duration of extreme events is amplified and culminates in two decadal-long extremes (Figure 6).
Steventson et al. [51] projected using a multi-assemblage of climate-coupled models (CMIP5 and CMIP6) reflecting large soil moisture trends that would be considered an extreme drought or a pluvial event today. These are projected to become the average conditions after the middle of the 21st century. The “whiplash” phenomenon may signal a change in the baseline of the soil moisture content. The climate projections for large regions like Europe, western North America, the Western Amazon, and Australia signify the increased frequency and intensity of both extremely wet and extremely dry precipitation events during the 21st century [48,51,52,53]. We think that northern Kazakhstan (a forest steppe biome) could be one of the smaller regions where large soil moisture changes will prevail in the future and lead to the emergence of prolonged and extreme droughts and recurring extreme pluvial conditions. The heat extremes appear less significant for influencing the soil moisture levels here, which generally agrees with the uncertainty in understanding the linkage between the heat waves and agricultural droughts [54]. For example, the Russian heatwave of 2010 [55] did not show up in the PDSI record as a dry extreme, the soil was very dry several years before this thermal extreme (Figure 6).
Changes in the precipitation trends and the extremes contribute to the soil moisture variability [39]. The gauged observations show the significant changes in the seasonal precipitation and decline of spring–summer temperatures in SKO (Figure 7). The cooling temperature trend after 2011 (about 3 °C for spring and 1 °C for summer) and the near doubling of winter precipitation intensify the soil moisture excess due to weakened evapotranspiration. A slightly positive precipitation trend in the summer most likely sustains the prolonged extreme wetting over the most recent decade as well (Figure 7). Compared to other better studied regions in south Europe and Inner Eurasia, precipitation modeling in northern Kazakhstan is lacking, in part due to its marginal location between eastern Europe and Central Asia. A few studies report an intensification of the total and extreme precipitation and changes in the seasonality of moisture dynamics in Central Asia in the southern arid lands and the high mountains [53,54,56,57].
Besides the short-term atmospheric variability associated with hydrologic extremes, the soil moisture feedback is also linked to the longer-term variability in the SST anomalies and teleconnections of atmospheric circulation e.g., [54,58,59]. Qing et al. [60] looked into the changing moisture compared with the soil depth and showed that soil moisture–atmosphere feedback mechanisms have triggered a significant increase in the occurrence of transition from drought to pluvial conditions (0.24−1.03% per year) globally during 1980−2020. The mechanism behind the drought and pluvial transitions was explained by the plants’ use of the moisture in the root zone soil instead of the moisture in the topsoil layer, which affects the water storage in the root zone layer and regulates the surface evaporation [60,61]. Thus, more and more transitional regions are switching into the drought–pluvial regime, and we think our studied region is one of them.
The empirical evidence of the atmospheric circulation changes over Eurasia suggests weaker upper air extratropical westerlies and a wavier circulation over a larger meridional gradient that is conducive to the more frequent and persistent synoptic patterns linked to extreme weather events [62,63,64]. The weakened zonal winds and westerlies are consistent with the more southern trajectories of snowstorms and the waning of midlatitude storm tracks in summer [57,65,66]. Cook et al. [48] demonstrated that anticyclonic circulation over European Russia and low pressure east of the Caspian Sea plays a critical role in the mid-summer extreme and extended droughts in the studied region. Overall, despite the uncertainty regarding the mechanism of extreme precipitation that drives their frequency and duration in northern Kazakhstan, the extended tree-ring record of the PDSI clearly indicates the hydrologic regime shift toward more persistent and pronounced extreme droughts and pluvial spells. In the last two decades, we observe the transition from pronounced drought into decade-long pluvial events that may be the result of moisture–atmosphere feedback mechanisms.

3.3. Drought Impact on Grain Yields in SKO

Since 1945, the average yield of grain in SKO was 10.42 centner per hectare (1 centner ≈ 100 kg or 0.1 ton) in the south (a steppe biome) and 12.94 centner/ha in the north (a forest steppe biome). In recent decades, the yield has been steadily increasing and remained high after 2003 at an average of 13.29 centner/ha (27.5% above the average) in the south and 17.39 centner/ha (34.4% above the average) in the north. The average grain yields used in the modeling fluctuate between 3 centner/ha and 22 centner/ha with a mean of 21.95 centner/ha (a standard deviation of 4.5). The additional 3–4 centner per hectare compared to 1945 is a significant gain for the farmers in this region. The increased duration of the extreme hydrologic events may have overwhelming implications for crop management. The longer these extreme events last, the lower the crops.
In general, the spring wheat, oats, and barley production in northern Kazakhstan is challenged by insufficient heat and extreme precipitation fluctuating between a moisture deficit and water excess [60,67]. Heat stress for the plants via temperatures of +30 °C and above and a rapid increase in night-time temperature is possible here but rarely occurs in spring–early summer when the wheat tissues and reproductive processes are most sensitive to being burnt and to low photosynthesis [68,69]. The tree-ring reconstruction of grain yields (Figure 5b) hints that the late 19th century and the 1930s and 1970s were quite favorable for grain production in SKO. Extremely low yields of the crops could have occurred in the 1910s due to the moisture deficit. Interestingly, the historical chronicles report a severe and prolonged drought during 1929–33 (5 years) near Astana (former Akmola) bordering SKO to the south [70], yet our records show no dry extremes at that time nor any abnormally low potential yields. In our record, the most significant and prolonged decline in the grain yield occurred in 1918–1921 (Figure 5).
The moisture record does not coincide completely with the yield series but shows many similarities. Our reconstructions indicate that in the past the summer PDSI ranging between +2 and −2 values over several consecutive years represents the most favorable conditions that lead to higher average grain yields. We attribute this range of the PDSI to the optimal regime for the early phenological stages (the leaf and tiller development and the stem elongation), which are crucial for a good yield in SKO [12,46,47]. In contrast, the consequent years with a large magnitude of the changes in the PDSI (the “whiplash” years) correlate with low yields (Figure 5). In some years, the relationship falls apart (e.g., 1975–77, 1945–49, 2004, 2008–11, and 2019–21). It is hard to say what other climatic or non-climatic factor(s) influenced the grain growth. The climate–crop yield system is complex, and globally the variations of crop production may be impacted by up to 30–35% by climate change [3,4]. Together or separately, climatic and non-climatic factors shape the adaptation response of farming to the new hydrologic state. The recent modernization of farms and increased access to high-productive technologies, as well as governmental subsidies, may reduce or cancel the impact of climate factors. The statistical record of crops (Figure 6) indicates that sometimes the farmers in SKO are highly capable of sustaining good yields even in extreme hydrologic years, yet their success partially depends on the spatial extent and timing of the climatic parameters [5]. The spatial regression modeling estimates a reduction in wheat and barley yields after 1980 in northern Kazakhstan by 1.9% and 4.8%, respectively [11]. Our tree ring reconstructions clarify that the intensity, frequency, and duration of hydrologic extremes are increasing, and more consideration should be given to the new hydrologic regime in SKO after 1978.

4. Conclusions

The tree-ring width chronologies of Scots pine from northern Kazakhstan have a mixed summer temperature and precipitation signal that is similar to the climate controls of spring wheat, oats, and barley crops. Moisture is the common limiting factor of the growth for these plants in the region. We used this strong climate–growth relationship and built two well-fitting regression models (0.44–0.48 R2adj) to reconstruct the PDSI in Jun–Aug (linked to soil water-holding capacity variations) and the average grain yield in SKO. A new 139-year history of the climate and crop production over the period of 1886–2022 helps to understand the variability and interaction of these two parameters prior to the observations. We found that that the frequency and duration of the extreme hydrologic events have significantly changed since 1978 toward (1) more variable moisture conditions sometimes swinging from one extreme to another over 1–2 years (“whiplash” years), (2) more pronounced extreme events in the 21st century. The reconstructions suggest that northern Kazakhstan may have transitioned from drought to a pluvial regime, which was probably triggered by moisture feedback to large-scale atmospheric circulation changes as a result of the warming climate. The reconstructed history of climate and crop production provides crucial data and insights for understanding the impact of climate warming on the long-term trend in grain yields and water–land use management addressed to regional and global food security. We believe tree-ring networks from marginal and arid lands (forest steppe and low-elevation biomes) need to be further investigated and utilized in crop yield modeling.

Author Contributions

Conceptualization, I.P.P., A.S. and S.P.; data curation, S.P. and L.I.A.; statistical and formal analysis, I.P.P.; writing—original draft preparation and editing, I.P.P. and A.S.; and funding acquisition, A.S. All authors have read and agreed to the published version of the manuscript.

Funding

This research is funded by the Bolashak International Scholarship (#7976 from 18 July 2023) to A.S.; the U.S. National Science Foundation awards #1917503 from the Office of Polar Programs to I.P.P.; and the IPAE UB RAS #122021000093-6 to L.I.A.

Institutional Review Board Statement

Not applicable.

Data Availability Statement

All data is available upon request made to the corresponding author.

Conflicts of Interest

The authors declare no competing interests.

References

  1. Bindi, M.; Olesen, J.E. The responses of agriculture in Europe to climate change. Reg. Environ. Change 2011, 11, 151–158. [Google Scholar] [CrossRef]
  2. Lobell, D.B.; Schlenker, W.; Costa-Roberts, J. Climate trends and global crop production since 1980. Science 2011, 333, 616–620. [Google Scholar] [CrossRef] [PubMed]
  3. Ray, D.K.; Gerber, J.S.; MacDonald, G.K.; West, P.C. Climate variation explains a third of global crop yield variability. Nat. Commun. 2015, 6, 5989. [Google Scholar] [CrossRef] [PubMed]
  4. Heino, M.; Kinnunen, P.; Anderson, W.; Ray, D.K.; Puma, M.J.; Varis, O.; Siebert, S.; Kummu, M. Increased probability of hot and dry weather extremes during the growing season threatens global crop yields. Sci. Rep. 2023, 13, 3583. [Google Scholar] [CrossRef] [PubMed]
  5. Swinnen, J.; Burkitbayeva, S.; Schierhorn, F.; Prishchepov, A.V.; Müller, D. Production potential in the “Bread Baskets” of Eastern Europe and Central Asia. Glob. Food Secur. 2017, 14, 38–53. [Google Scholar] [CrossRef]
  6. Ferris, R.; Ellis, R.H.; Wheeler, T.R.; Hadley, P. Effect of high temperature stress at anthesis on grain yield and biomass of field-grown crops of wheat. Ann. Bot. 1998, 82, 631–639. [Google Scholar] [CrossRef]
  7. Asseng, S.; Ewert, F.; Martre, P.; Rotter, R.P.; Lobell, D.B.; Cammarano, D.; Kimball, B.A.; Ottman, M.J.; Wall, G.W.; White, J.W.; et al. Rising temperatures reduce global wheat production. Nat. Clim. Change 2015, 5, 143–147. [Google Scholar] [CrossRef]
  8. Barlow, K.M.; Christy, B.P.; O’Leary, G.J.; Riffkin, P.A.; Nuttall, J.G. Simulating the impact of extreme heat and frost events on wheat crop production: A review. Field Crops Res. 2015, 171, 109–119. [Google Scholar] [CrossRef]
  9. Prasad, P.V.; Bheemanahalli, R.; Jagadish, S.K. Field crops and the fear of heat stress–opportunities, challenges and future directions. Field Crops Res. 2017, 200, 114–121. [Google Scholar] [CrossRef]
  10. Wang, D.; Li, R.; Gao, G.; Jiakula, N.; Toktarbek, S.; Li, S.; Ma, P.; Feng, Y. Impact of climate on food security in Kazakhstan. Agriculture 2022, 12, 1087. [Google Scholar] [CrossRef]
  11. Schierhorn, F.; Hofmann, M.; Adrian, I.; Bobojonov, I.; Müller, D. Spatially varying impacts of climate change on wheat and barley yields in Kazakhstan. J. Arid. Environ. 2020, 178, 104164. [Google Scholar] [CrossRef]
  12. Cherenkova, E.A.; Semenov, V.A. A new approach to identifying the influence of climate extremes on wheat yield decline in the south of the European territory of Russia. Proc. Russ. Acad. Sci. Earth Sci. 2021, 500, 88–94. [Google Scholar] [CrossRef]
  13. Sarto, M.V.; Sarto, J.R.; Rampim, L.; Rosset, J.S.; Bassegio, D.; da Costa, P.F.; Inagaki, A.M. Wheat phenology and yield under drought: A review. Aust. J. Crop Sci. 2017, 11, 941–946. [Google Scholar] [CrossRef]
  14. Hakala, K.; Jauhiainen, L.; Rajala, A.; Jalli, M.; Kujala, M.; Laine, A. Different responses to weather events may change the cultivation balance of spring barley and oats in the future. Field Crops Res. 2020, 259, 107956. [Google Scholar] [CrossRef]
  15. Santangelo, E.; Beni, C.; Oreti, L.; Palma, A.; Bascietto, M. Vulnerability of wheat crops to flooding outweighs benefits from precision farming and agroecology practices: A case study in Central Italy. Land 2023, 12, 915. [Google Scholar] [CrossRef]
  16. Fan, X.; Zhu, D.; Sun, X.; Wang, J.; Wang, M.; Wang, S.; Watson, A.E. Impacts of extreme temperature and precipitation on crops during the growing season in South Asia. Remote Sens. 2022, 14, 6093. [Google Scholar] [CrossRef]
  17. Schlenker, W.; Roberts, M.J. Nonlinear temperature effects indicate severe damages to U.S. crop yields under climate change. Proc. Natl. Acad. Sci. USA 2009, 106, 15594–15598. [Google Scholar] [CrossRef] [PubMed]
  18. Hatfield, J.L.; Prueger, J.H. Temperature extremes: Effect on plant growth and development. Weather. Clim. Extrem. 2015, 10, 4–10. [Google Scholar] [CrossRef]
  19. Dadrasi, A.; Chaichi, M.; Nehbandani, A.; Soltani, E.; Nemati, A.; Salmani, F.; Heydari, M.; Yousefi, A.R. Global insight into understanding wheat yield and production through Agro-Ecological Zoning. Sci. Rep. 2023, 13, 15898. [Google Scholar] [CrossRef] [PubMed]
  20. Van Wart, J.; van Bussel, L.G.; Wolf, J.; Licker, R.; Grassini, P.; Nelson, A.; Boogaard, H.; Gerber, J.; Mueller, N.D.; Claessens, L. Use of agro-climatic zones to upscale simulated crop yield potential. Field Crops Res. 2013, 143, 44–55. [Google Scholar] [CrossRef]
  21. Shvedov, F. Tree Like a Chronicle of Droughts; Russian Imperial Academy of Sciences: St. Petersburg, Russia, 1892; 16p. [Google Scholar]
  22. Powell, L.B. Tree-rings and wheat yields in Southern Saskatchewan. Mon. Weather. Rev. 1932, 60, 220–221. [Google Scholar] [CrossRef]
  23. Therrell, M.D.; Stanle, D.W.; Diaz, J.V.; Cornelo Oviedo, E.H.; Cleaveland, M.K. Tree-ring reconstructed maize yield in central Mexico: 1474–2001. Clim. Change 2006, 74, 493–504. [Google Scholar] [CrossRef]
  24. Touchan, R.; Kherchouche, D.; Oudjehih, B.; Touchan, H.; Slimani, S.; Meko, D. Dendroclimatology and wheat production in Algeria. J. Arid. Environ. 2016, 124, 102–110. [Google Scholar] [CrossRef]
  25. Huhtamaa, H.; Helama, S. Reconstructing crop yield variability in Finland: Long-term perspective of the cultivation history on the agricultural periphery since AD 760. Holocene 2017, 27, 3–11. [Google Scholar] [CrossRef]
  26. Rygalova, N.V.; Rygalov, E.V.; Bykov, N.I. Reconstruction of grain yield in the steppe zone of the Altai territory (south of Western Siberia) in the XIX-XX centuries on the basis of tree-ring chronologies of tape burs. In Proceedings of the International Conference on Sustainable Development of Cross-Border Regions, Barnaul, Russia, 19–20 April 2019; Earth and Environmental Science. Volume 395, p. 012046. [Google Scholar]
  27. Babushkina, E.A.; Zhirnova, D.F.; Belokopytova, L.V.; Mehrotra, N.; Shah, S.K.; Keler, V.V.; Vaganov, E.A. Prospects of using tree-ring earlywood and Latewood width for reconstruction of crops yield on example of South Siberia. Forests 2021, 12, 174. [Google Scholar] [CrossRef]
  28. Peng, J.; Peng, K.; Li, J.; Peng, M.; Liu, Y.; Wei, X.; Li, J.; Li, X.; Cui, J.; Li, J. Concurrent response of tree growth and grain productivity to climate change: A case study from climatic transition zone in central China. Ecol. Indic. 2023, 154, 110608. [Google Scholar] [CrossRef]
  29. Baysholanov, S.S. (Ed.) Handbook of Agroclimatic Resources of Severo-Kazakhstanskaya Oblast; Institute of Geography: Astana, Kazakhstan, 2017; p. 125. [Google Scholar]
  30. Ventresca-Miller, A.; Spengler, R.; Haruda, A.; Miller, B.; Wilkin, S.; Robinson, S.; Roberts, P.; Boivin, N. Ecosystem engineering among ancient pastoralists in northern Central Asia. Front. Earth Sci. 2020, 8, 168. [Google Scholar] [CrossRef]
  31. ITRDB, 2024: International Tree-Ring Data Bank, NOAA Centers for Environmental Information. Available online: https://www.ncei.noaa.gov/products/paleoclimatology/tree-ring (accessed on 1 November 2023).
  32. Solomina, O.N.; Bushueva, I.S.; Dolgova, E.A.; Zolotokrylin, A.N.; Kuznettsova, V.V.; Kuznetsove, T.O.; Kuhta, A.E.; Lazukova, L.I.; Lomakin, N.A.; Matskovsky, V.V.; et al. Droughts of the East European Plain according to Hydrometeorological and Tree-Ring Data; Institute of Geography of the Russian Academy of Sciences: Moscow, Russia, 2017; p. 360. [Google Scholar]
  33. Stokes, M.A.; Smiley, M. An Introduction to Tree-Ring Dating; University of Chicago Press: Chicago, IL, USA, 1968. [Google Scholar]
  34. Cook, E.R.; Peters, K. The smoothing spline: A new approach to standardizing forest interior tree-ring width series for dendroclimatic studies. Tree-Ring Bull. 1981, 41, 45–53. [Google Scholar]
  35. Osborn, T.J.; Briffa, K.R.; Jones, P.D. Adjusting variance for sample-size in tree-ring chronologies and other regional mean timeseries. Dendrochronologia 1997, 15, 89–99. [Google Scholar]
  36. Cook, E.R.; Krusic, P.J.; Holmes, R.H.; Peters, K. Program ARSTAN, Version 41d, Download from 2007. Available online: www.ldeo.columbia.edu/tree-ring-laboratory (accessed on 1 September 2022).
  37. Wigley, T.M.L.; Briffa, K.R.; Jones, P.D. On the average value of correlated time series, with applications in dendroclimatology and hydrometeorology. J. Appl. Meteorol. Climatol. 1984, 23, 201–213. [Google Scholar] [CrossRef]
  38. Menne, M.J.; Williams, C.N.; Gleason, B.E.; Rennie, J.J.; Lawrimore, J.H. The global historical climatology network monthly temperature dataset, version 4. J. Clim. 2018, 31, 9835–9854. [Google Scholar] [CrossRef]
  39. Dai, A. Characteristics and trends in various forms of the palmer drought severity index (PDSI) during 1900–2008. Geophys. Res. 2011, 116, D12. [Google Scholar] [CrossRef]
  40. Barichivich, J.; Osborn, T.J.; Harris, I.; Schrier, G.; Jones, P.D. Monitoring global drought using the self-calibrating palmer drought severity Index in “State of the climate in 2020”. Bull. Am. Meteorol. Soc. 2021, 101, S1–S429. [Google Scholar] [CrossRef]
  41. Meko, D.M.; Touchan, R.; Anchukaitis, K.A. Seascorr: A MATLAB program for identifying the seasonal climate signal in an annual tree-ring time series. Comput. Geosci. 2011, 37, 1234–1241. [Google Scholar] [CrossRef]
  42. Meko, D.M.; Biondi, F.; Taylor, A.H.; Panyushkina, I.P.; Thaxton, R.D.; Prusevich, A.; Shiklomanov, A.I.; Lammers, R.B.; Glidden, S. Runoff variability in the Truckee-Carson river basin from tree rings and water balance model. Earth Interact. 2024. [Google Scholar] [CrossRef]
  43. Meko, D.M.; Woodhouse, C.A.; Baisan, C.H.; Knight, T.A.; Lukas, J.J.; Hughes, M.K.; Salzer, M.W. Medieval drought in the upper Colorado river basin. Geophys. Res. Lett. 2007, 34, L10705. [Google Scholar] [CrossRef]
  44. Fritts, H.C.; Guiot, J.; Gordon, G.A. Verification Methods of Dendrochronology: Applications in the Environmental Sciences; Cook, E.R., Kairiukstis, L.A., Eds.; Kluwer Academic Publishers: Alphen, The Netherlands, 1990; pp. 178–185. [Google Scholar]
  45. Michaelsen, J. Cross-validation in statistical climate forecast models. J. Appl. Meteorol. Climatol. 1987, 26, 1589–1600. [Google Scholar] [CrossRef]
  46. Ozturk, A.; Aydin, F. Effect of water stress at various growth stages on some quality characteristics of winter wheat. J. Agron. Crop Sci. 2004, 190, 93–99. [Google Scholar] [CrossRef]
  47. Petukhova, M.S.; Voropai, N.N. About the impact of natural and climatic factors on agriculture in the Siberian Federal Okrug. Econ. Agric. Russ. 2024, 1, 10–15. [Google Scholar] [CrossRef]
  48. Cook, E.R.; Solomina, O.; Matskovsky, V.; Cook, B.I.; Agafonov, L.; Berdnikova, A.; Dolgova, E.; Karpukhin, A.; Knysh, N.; Kulakova, M.; et al. The European Russia drought atlas (1400–2016 CE). Clim. Dyn. 2020, 54, 2317–2335. [Google Scholar] [CrossRef]
  49. Zamora-Reyes, D.; Black, B.; Trouet, V. Enhanced winter, spring, and summer hydroclimate variability across California from 1940 to 2019. Int. J. Climatol. 2022, 42, 4940–4952. [Google Scholar] [CrossRef]
  50. Winitsky, A.G.; Meko, D.M.; Taylor, A.H.; Biondi, F. Species sensitivity to hydrologic whiplash in the tree ring record of the high Sierra Nevada. Environments 2023, 10, 12. [Google Scholar] [CrossRef]
  51. Stevenson, S.; Coats, S.; Touma, D.; Cole, J.; Lehner, F.; Fasullo, J. Twenty-first century hydroclimate: A continually changing baseline, with more frequent extremes. Proc. Natl. Acad. Sci. USA 2022, 119, e2108124119. [Google Scholar] [CrossRef] [PubMed]
  52. Shi, H.; Wang, C. Projected 21st century changes in snow water equivalent over northern hemisphere landmasses from the CMIP5 model ensemble. Cryosphere 2015, 9, 1943–1953. [Google Scholar] [CrossRef]
  53. Ukkola, A.M.; De Kauwe, M.G.; Roderick, M.L.; Abramowitz, G.; Pitman, A.J. Robust future changes in meteorological drought in CMIP6 projections despite uncertainty in precipitation. Geophys. Res. Lett. 2020, 47, e2020GL087820. [Google Scholar] [CrossRef]
  54. Schubert, S.D.; Want, H.; Koster, R.D.; Suarez, M.J.; Groisman, P.Y. Northern Eurasian heat waves and droughts. J. Clim. 2014, 27, 3169–3207. [Google Scholar] [CrossRef]
  55. Otto, F.E.L.; Massey, N.; van Oldenborgh, G.J.; Jones, R.G.; Allen, M.R. Reconciling two approaches to attribution of the 2010 Russian heat wave. Geophys. Res. Lett. 2012, 39, L04702. [Google Scholar] [CrossRef]
  56. Yao, J.; Chen, Y.; Chen, J.; Zhao, Y.; Tuoliewubieke, D.; Li, J.; Yang, L.; Mao, W. Intensification of extreme precipitation in arid Central Asia. J. Hydrol. 2021, 598, 125760. [Google Scholar] [CrossRef]
  57. Zou, S.; Abuduwaili, J.; Duan, W.; Ding, J.; De Maeyer, P.; Van De Voorde, T.; Ma, L. Attribution of changes in the trend and temporal non-uniformity of extreme precipitation events in Central Asia. Sci. Rep. 2021, 11, 15032. [Google Scholar] [CrossRef]
  58. Saini, R.; Wang, G.; Pal, J. Role of soil moisture feedback in the development of extreme summer drought and flood in the United States. Hydrometeorology 2016, 17, 2191–2207. [Google Scholar] [CrossRef]
  59. Heino, M.; Puma, M.; Ward, P.; Gerten, D.; Heck, V.; Siebert, S.; Kummu, M. Two-thirds of global cropland area impacted by climate oscillations. Nat. Commun. 2018, 9, 1257. [Google Scholar] [CrossRef] [PubMed]
  60. Qing, Y.; Wang, S.; Yang, Z.-L.; Gentine, P. Soil moisture−atmosphere feedbacks have triggered the shifts from drought to pluvial conditions since 1980. Commun. Earth Environ. 2023, 4, 254. [Google Scholar] [CrossRef]
  61. Or, D.; Lehmann, P.; Shahraeeni, E.; Shokri, N. Advances in soil evaporation physics—A review. Vadose Zone J. 2013, 12, 1–16. [Google Scholar] [CrossRef]
  62. Screen, J.A.; Simmonds, I. Amplified mid-latitude planetary waves favour particular regional weather extremes. Nat. Clim. Change 2014, 4, 704–709. [Google Scholar] [CrossRef]
  63. Vavrus, S.J.; Wang, F.; Martin, J.E.; Francis, J.A.; Peings, Y.; Cattiaux, J. Changes in North American atmospheric circulation and extreme weather: Influence of Arctic amplification and Northern Hemisphere snow cover. J. Clim. 2017, 30, 4317–4333. [Google Scholar] [CrossRef]
  64. Walsh, J.E. Intensified warming of the Arctic: Causes and impacts on middle latitudes. Glob. Planet. Change 2014, 117, 52–63. [Google Scholar] [CrossRef]
  65. Rowell, D.P.; Jones, R.G. Causes and uncertainty of future summer drying over Europe. Clim. Dyn. 2006, 27, 281–299. [Google Scholar] [CrossRef]
  66. Francis, J.A.; Skific, N. Evidence linking rapid Arctic warming to mid-latitude weather patterns. Philos. Trans. R. Soc. 2015, 373A, 20140170. [Google Scholar] [CrossRef] [PubMed]
  67. Cook, B.I.; Mankin, J.S.; Marvel, K.; Williams, A.P.; Smerdon, J.E.; Anchukaitis, K.J. Twenty-first century drought projections in the CMIP6 forcing scenarios. Earth’s Future 2020, 8, e2019EF001461. [Google Scholar] [CrossRef]
  68. Garcia, G.A.; Serrago, R.A.; Dreccer, M.F.; Miralles, D.J. Post-anthesis warm nights reduce grain weight in field-grown wheat and barley. Field Crops Res. 2016, 195, 50–59. [Google Scholar] [CrossRef]
  69. Prasad, P.V.V.; Pisipati, S.R.; Ristic, Z.; Bukovnik, U.; Fritz, A.K. Effect of nighttime temperature on physiology and growth of spring wheat. Crop Sci. 2008, 48, 2372–2380. [Google Scholar] [CrossRef]
  70. Kahan, A. Russian Economic History: The Nineteenth Century; Weiss, R., Ed.; University of Chicago Press: Chicago, IL, USA, 1989; p. 251. [Google Scholar]
Figure 2. The behavior of climatic signals in the tree-ring width chronologies and the SKO record of the average grain yield. The correlations of (a) the CRO tree-ring width chronology and the Petropavlovsk weather station for the 1933–2010 period (78 yrs), and (b) the average grain yield and the Saumalkol weather station for the 1968–2022 period (55 yrs). Seascorr outputs [41]: top plot for each panel shows primary correlations and the bottom plot shows partial correlations. P-precipitation, blue bars, and T-temperature, red bars. The results are shown for season lengths of 1, 3, 6, and 12 months with variable ending months. The significance estimated by the Monte Carlo method is coded by color variance for two α levels. The x-axis labels months starting from September of the previous year (S*) to September of the current year (S).
Agriculture 14 00790 g002
Figure 3. A summary of the variability modes of tree ring chronologies included in the reconstruction models of the June–August PDSI (a) and average grain yield (b) in SKO. Heatmaps of the PCA loadings of the individual chronologies.
Agriculture 14 00790 g003
Figure 4. Verification of the tree ring regression models. Observed (Obs), reconstructed (Recon), and cross-validated-predicted (CVpred) time series plotted for the Jun-Aug PDSI model (a) and the average grain yield, ct/ha (b) in SKO. Summary statistics for the calibration and verification are shown in Table 4.
Agriculture 14 00790 g004
Figure 5. Extended history of (a) the summer PDSI and (b) grain yield (ct/ha) in SKO, Kazakhstan, reconstructed with tree ring chronologies, 1886–2013. Reconstructed curves (blue line with dots) and its 50% confidence interval (red shade) computed with the RMSE. The PDSI with values below−3 represents severe to extreme drought and above +3 an extremely wet year.
Agriculture 14 00790 g005
Figure 6. The latest history of the PDSI in Jun–Aug and the grain yield (ct/ha) available for SKO from observations, 1945–2022. The vertical line is 2013, the last year of the tree-ring reconstruction (Figure 5). Notice the 1964–65 “whiplash” years, the strongest in the record with the PDSI values shifting from 4.35 to −2.35.
Agriculture 14 00790 g006
Figure 7. Seasonal temperature and precipitation observed at the Petropavlovsk weather station, 1933–2016: (a) temperature anomaly (1970–1999) for spring (April–May) and summer (June–August), and (b) seasonal precipitation for winter (November–March), spring (April–May), summer (June–August), and fall (September–October).
Agriculture 14 00790 g007
Table 3. Growth statistics of the analyzed grain groups in SKO.
Grain Sow DatesHarvest Dates Length of Growth
Spring Wheat 15–25 May15–25 August 80–100 days
Oats25 May–5 June15–31 August 70–100 days
Barley25 May–5 June25 July–10 August65–80 days
Table 4. Calibration and validation statistics of the stepwise regression reconstruction models. The Jun−Jul PDSI model with a calibration period of 1947−2010 (64 years) and two split periods for validation: (A) 1947−1978 and (B) 1979−2010. Grain yield model: calibration period of 1945–2012 (68 years) and two split periods for validation: (A) 1945–1978 and (B) 1979–2012.
PredictandTree Ring Series in PC PredictorsR2adjDWFRMSEREsplit AREsplit B
Model
Jun–Aug PDSI
CSA, CBK, CRO, russ3640.481.61
p = 0.10
29.7
df = (3,64)
p = 1e−09
1.620.350.46
Model
Crop Yield
CSA, CBK, CRO, russ3670.441.3
p = 0.27
18.6
df = (4,68)
p = 8.44e−09
3.010.440.53
R2adj is R-squared adjusted for number of predictors in model, DW—Durbin–Watson statistic and its p-value (p > 0.05 indicates no lag-1 autocorrelation in residuals); F—statistic with p value (p < 0.05 indicates significant model), RMSE—root of mean squared, and RE—reduction in error.
Disclaimer/Publisher’s Note: The statements, opinions and data contained in all publications are solely those of the individual author(s) and contributor(s) and not of MDPI and/or the editor(s). MDPI and/or the editor(s) disclaim responsibility for any injury to people or property resulting from any ideas, methods, instructions or products referred to in the content.

