Design of Static Output Feedback Suspension Controllers for Ride Comfort Improvement and Motion Sickness Reduction
Abstract
:1. Introduction
- Three types of structures of SOF controllers are presented. With vz, and of an SPM as an output, three SOF control structures are presented. Those signals for the SOF controllers are obtained by integrating the vertical accelerations measured at each corner of the SPM.
- To design a SOF controller for a nonlinear vehicle model, SLOM is applied. Simulink model for the nonlinear vehicle one is built and the SOF controllers are optimized with SLOM.
- With the designed SOF controllers, a simulation is conducted on CarSim for comparison. Based on simulation results, it is recommended which SOF controller is the best for ride comfort improvement and motion sickness reduction.
2. Design of Static Output Feedback Controllers
2.1. Full-Car Model and State-Space Equation
2.2. Design of LQR
2.3. Sensor Signal Processing
2.4. Design of SOF Controller with LQOC
2.5. Design of SOF Controller with SLOM
3. Simulation and Discussion
3.1. Simulation Environment
3.2. Simulation with the SOF Controllers Designed with LQOC
3.3. Simulation with SOF Controllers Designed by SLOM
4. Conclusions
Author Contributions
Funding
Data Availability Statement
Conflicts of Interest
Nomenclature
| ASC | active suspension control |
| HOM | heuristic optimization method |
| LQOC | linear quadratic optimal control |
| LQR | linear quadratic regulator |
| LQSOF | linear quadratic static output feedback |
| LQSSOF | linear quadratic structured static output feedback |
| LQLSOF | linear quadratic Lotus modal static output feedback |
| LSOF | Lotus modal static output feedback control |
| SLOM | simulation optimization method |
| SOF | static output feedback |
| SPM | sprung mass or vehicle body |
| SSE | state-space equation |
| SSOF | structured static output feedback |
| TSWR | twisted sine wave road |
| USPM | unsprung mass or tire |
| az = | vertical acceleration of a sprung mass (m/s2) |
| bsi | damping coefficient of a damper at i-th suspension (N·s/m) |
| Ix, Iy | roll and pitch moments of inertia (kg·m2) |
| J | LQ cost function of LQR |
| JSO | Cost function of SLOM |
| ksi | spring stiffness of a spring at i-th suspension (N/m) |
| kti | spring stiffness of i-th tire (N/m) |
| lf, lr | distances from center of gravity of a sprung mass to front and rear axles (m) |
| ms | sprung mass (kg) |
| mui | unsprung mass under i-th suspension (kg) |
| tf, tr | half of track widths of front and rear axles (m) |
| T, t0, t1 | simulation horizon from the start time t0 to the end time t1 |
| ui | forces generated by an actuator at i-th suspension (N) |
| vz = | vertical velocity of SPM (m/s) |
| zc | heave displacement at center of gravity of a sprung mass (m) |
| zri | road elevation acting on i-th tire (m) |
| zsi | vertical displacement of i-th corners of a sprung mass (m) |
| zui | vertical displacement of i-th wheel center (m) |
| ξi | maximum allowable value of weight in LQ cost function |
| ζi | weight in LQ cost function |
| ϕ, | roll angle and rate of a sprung mass (rad, rad/s) |
| θ, | pitch angle and rate of a sprung mass (rad, rad/s) |
References
- Hrovat, D. Survey of advanced suspension developments and related optimal control applications. Automatica 1997, 33, 1781–1817. [Google Scholar] [CrossRef]
- Tseng, H.E.; Hrovat, D. State of the art survey: Active and semi-active suspension control. Veh. Syst. Dyn. 2015, 53, 1034–1062. [Google Scholar] [CrossRef]
- ISO 2631-1; Mechanical Vibration and Shock—Evaluation of human exposure to whole-body vibration—Part 1: General requirements. International Organization for Standardization: Geneva, Switzerland, 1997.
- Rimell, A.N.; Mansfield, N.J. Design of digital filters for frequency weightings required for risk assessments of workers exposed to vibration. Ind. Health 2007, 45, 512–519. [Google Scholar] [CrossRef]
- Yurtsever, E.; Lambert, J.; Carballo, A.; Takeda, K. A survey of autonomous driving: Common practices and emerging technologies. IEEE Access 2020, 8, 58443–58469. [Google Scholar] [CrossRef]
- Diels, C.; Bos, J.E. Self-driving carsickness. Appl. Ergon. 2016, 53, 374–382. [Google Scholar] [CrossRef] [PubMed]
- Asua, E.; Gutiérrez-Zaballa, J.; Mata-Carballeira, O.; Ruiz., J.A.; del Campo, I. Analysis of the motion sickness and the lack of comfort in car passengers. Appl. Sci. 2022, 12, 3717. [Google Scholar] [CrossRef]
- Xie, W.; He, D.; Wu, G. Inducers of motion sickness in vehicles: A systematic review of experimental evidence and meta-analysis. Transp. Res. Part F Traffic Psychol. Behav. 2023, 99, 167–188. [Google Scholar] [CrossRef]
- Lawther, A.; Griffin, M.J. A survey of the occurrence of motion sickness amongst passengers at sea. Aviat. Space Environ. Med. 1988, 59, 399–406. [Google Scholar]
- Griffin, M.; Newman, M. An experimental study of low-frequency motion in cars. Proc. Inst. Mech. Eng. Part D J. Automob. Eng. 2004, 218, 1231–1238. [Google Scholar] [CrossRef]
- Griffin, M.J.; Newman, M.M. Visual field effects on motion sickness in cars. Aviat. Space Environ. Med. 2004, 75, 739–748. [Google Scholar]
- Griffin, M.J.; Mills, K.L. Effect of frequency and direction of horizontal oscillation on motion sickness. Aviat. Space Environ. Med. 2002, 73, 537–543. [Google Scholar]
- Donohew, B.E.; Griffin, M.J. Motion sickness: Effect of the frequency of lateral oscillation. Aviat. Space Environ. Med. 2004, 75, 649–656. [Google Scholar] [PubMed]
- Ekchian, J.; Graves, W.; Anderson, Z.; Giovanardi, M.; Godwin, O.; Kaplan, J.; Ventura, J.; Lackner, J.R.; DiZio, P. A High-Bandwidth Active Suspension for Motion Sickness Mitigation in Autonomous Vehicles; SAE Technical Paper 2016-01-1555; SAE International: Warrendale, PA, USA, 2016. [Google Scholar]
- DiZio, P.; Ekchian, J.; Kaplan, J.; Ventura, J.; Graves, W.; Giovanardi, M.; Anderson, Z.; Lackner, J.R. An active suspension system for mitigating motion sickness and enabling reading in a car. Aerosp. Med. Hum. Perform. 2018, 89, 822–829. [Google Scholar] [CrossRef] [PubMed]
- Koohestani, A.; Nahavandi, D.; Asadi, H.; Kebria, P.M.; Khosravi, A.; Alizadehsani, R.; Nahavandi, S. A knowledge discovery in motion sickness: A comprehensive literature review. IEEE Access 2019, 7, 85755–85770. [Google Scholar] [CrossRef]
- Jeong, Y.; Yim, S. Design of active suspension controller for ride comfort enhancement and motion sickness mitigation. Machines 2024, 12, 254. [Google Scholar] [CrossRef]
- Sharp, R.S.; Crolla, D.A. Road vehicle suspension system design—A review. Veh. Syst. Dyn. 1987, 16, 167–192. [Google Scholar] [CrossRef]
- Cao, D.; Song, X.; Ahmadian, M. Editors’ perspectives: Road vehicle suspension design, dynamics, and control. Veh. Syst. Dyn. 2011, 49, 3–28. [Google Scholar] [CrossRef]
- Theunissen, J.; Tota, A.; Gruber, P.; Dhaens, M.; Sorniotti, A. Preview-based techniques for vehicle suspension control: A state-of-the-art review. Annu. Rev. Control 2021, 51, 206–235. [Google Scholar] [CrossRef]
- Al-Ashmori, M.; Wang, X. A systematic literature review of various control techniques for active seat suspension systems. Appl. Sci. 2020, 10, 1148. [Google Scholar] [CrossRef]
- Wilson, D.A.; Sharp, R.S.; Hassan, S.A. The application of linear optimal control theory to the design of active automobile suspensions. Veh. Syst. Dyn. 1987, 15, 105–118. [Google Scholar] [CrossRef]
- Hac, A. Optimal linear preview control of active vehicle suspension. Veh. Syst. Dyn. 1992, 21, 167–195. [Google Scholar] [CrossRef]
- Abdel-Hady, M.B.A.; Crolla, D.A. Active suspension control algorithms for a four wheel vehicle model. Int. J. Veh. Des. 1992, 13, 144–158. [Google Scholar]
- Mudduluru, S.R.; Chizari, M. Quarter and full car models optimisation of passive and active suspension system using genetic algorithm. arXiv 2021, arXiv:2101.12629. Available online: https://arxiv.org/abs/2101.12629 (accessed on 30 August 2021).
- Camino, J.F.; Zampieri, D.E.; Peres, P.L.D. Design of a vehicular suspension controller by static output feedback. In Proceedings of the American Control Conference, San Diego, CA, USA, 2–4 June 1999; pp. 3168–3171. [Google Scholar]
- Elmadany, M.M.; Al-Majed, M.I. Quadratic synthesis of active controls for a quarter-car model. J. Vib. Control 2001, 7, 1237–1252. [Google Scholar] [CrossRef]
- Park, M.; Yim, S. Design of static output feedback and structured controllers for active suspension with quarter-car model. Energies 2021, 14, 8231. [Google Scholar] [CrossRef]
- Jeong, Y.; Shon, Y.; Chang, S.; Yim, S. Design of static output feedback controllers for an active suspension system. IEEE Access 2022, 10, 26948–26964. [Google Scholar] [CrossRef]
- Jeong, Y.; Shon, Y.; Chang, S.; Yim, S. Design of virtual reference feedforward controller for an active suspension system. IEEE Access 2022, 10, 65671–65684. [Google Scholar] [CrossRef]
- Hansen, N.; Muller, S.D.; Koumoutsakos, P. Reducing the time complexity of the derandomized evolution strategy with covariance matrix adaptation (CMA-ES). Evol. Comput. 2003, 11, 1–18. [Google Scholar] [CrossRef]
- Lu, J.; DePoyster, M. Multiobjective optimal suspension control to achieve integrated ride and handling performance. IEEE Trans. Control Syst. Technol. 2002, 10, 807–821. [Google Scholar]
- Jung, Y.H.; Choi, J.W.; Seo, Y.B. Overlapping decentralized EA control design for an active suspension system of a full car model. In Proceedings of the 39th SICE Annual Conference, Iizuka, Japan, 28 July 2000; pp. 85–90. [Google Scholar]
- Bryson, A.E., Jr.; Ho, Y. Applied Optimal Control; Hemisphere: New York, NY, USA, 1975. [Google Scholar]
- Hong, K.; Sohn, H.; Hedrick, J.K. Modified skyhook control of semi-active suspensions: A new model, gain scheduling, and hardware-in-the-loop tuning. J. Dyn. Syst. Meas. Control 2002, 124, 158–167. [Google Scholar] [CrossRef]
- Ding, R.; Wang, R.; Meng, X.; Chen, L. Energy consumption sensitivity analysis and energy-reduction control of hybrid electromagnetic active suspension. Mech. Syst. Signal Process. 2019, 134, 106301. [Google Scholar] [CrossRef]
- Liu, W.; Wang, R.; Ding, R.; Meng, X.; Yang, L. On-line estimation of road profile in semi-active suspension based on unsprung mass acceleration. Mech. Syst. Signal Process. 2020, 135, 106370. [Google Scholar] [CrossRef]
- Ikenaga, S.; Lewis, F.L.; Campos, J.; Davis, L. Active suspension control of ground vehicle based on a full-vehicle model. In Proceedings of the American Control Conference, Chicago, IL, USA, 28–30 June 2000. [Google Scholar]
- Demic, M.; Diligenski, D.; Demic, I.; Demic, M. A method of vehicle active suspension design. Forsch Ingenieurwes 2006, 70, 145–158. [Google Scholar] [CrossRef]
- Braghin, F.; Resta, F.; Sabbioni, E. A modal control for active/semi-active suspension systems. In Proceedings of the 2007 IEEE/ASME International Conference on Advanced Intelligent Mechatronics, Zurich, Switzerland, 4–7 September 2007. [Google Scholar]
- Enders, E.; Karle, P.; Bonelli, G.; Killian, D.; Burkhard, G. Modal vertical vehicle dynamics control for semi-active and active suspension systems. In Proceedings of the 2020 Fifteenth International Conference on Ecological Vehicles and Renewable Energies (EVER), Monte-Carlo, Monaco, 10–12 September 2020. [Google Scholar]
- Park, M.; Jeong, Y.; Yim, S. Design of a modal controller with simple models for an active suspension system. IEEE Access 2022, 10, 65585–65597. [Google Scholar] [CrossRef]
- Syrmos, V.L.; Abdallah, C.T.; Dorato, P.; Grigoriadis, K. Static output feedback—A survey. Automatica 1997, 33, 125–137. [Google Scholar] [CrossRef]
- Andradóttir, S. Chapter 20 An Overview of Simulation Optimization via Random Search. Handb. Oper. Res. Manag. Sci. 2006, 13, 617–631. [Google Scholar]
- Amaran, S.; Sahinidis, N.V.; Sharda, B.; Bury, S.J. Simulation optimization: A review of algorithms and applications. Ann. Oper. Res. 2016, 240, 351–380. [Google Scholar] [CrossRef]
- Mechanical Simulation Corporation. CarSim Data Manual; Version 8; Mechanical Simulation Corporation: Ann Arbor, MI, USA, 2009. [Google Scholar]


| ms | 1653.0 kg | mu | 45.0 kg |
| Ix | 614.0 kg·m2 | Iy | 2765.0 kg·m2 |
| lf | 1.402 m | lr | 1.646 m |
| tf, tr | 0.8 m | kt | 230,000.0 N/m |
| ks | 34,000.0 N/m | bs | 3500.0 N·s/m |
| ξ1 | 0.05 m/s2 | ξ2 | 30.0 deg/s2 | ξ3 | 30.0 deg/s2 |
| ξ4 | 3.0 deg | ξ5 | 0.05 deg/s | ξ6 | 3.0 deg |
| ξ7 | 0.1 deg/s | ξ8 | 0.03 m | ξ9 | 0.03 m |
| ξ10 | 5000.0 N |
| KSOF | KSSOF | ||
| G+KLSOF |
| Controller | (m/s2) | (deg/s) | (deg/s) |
|---|---|---|---|
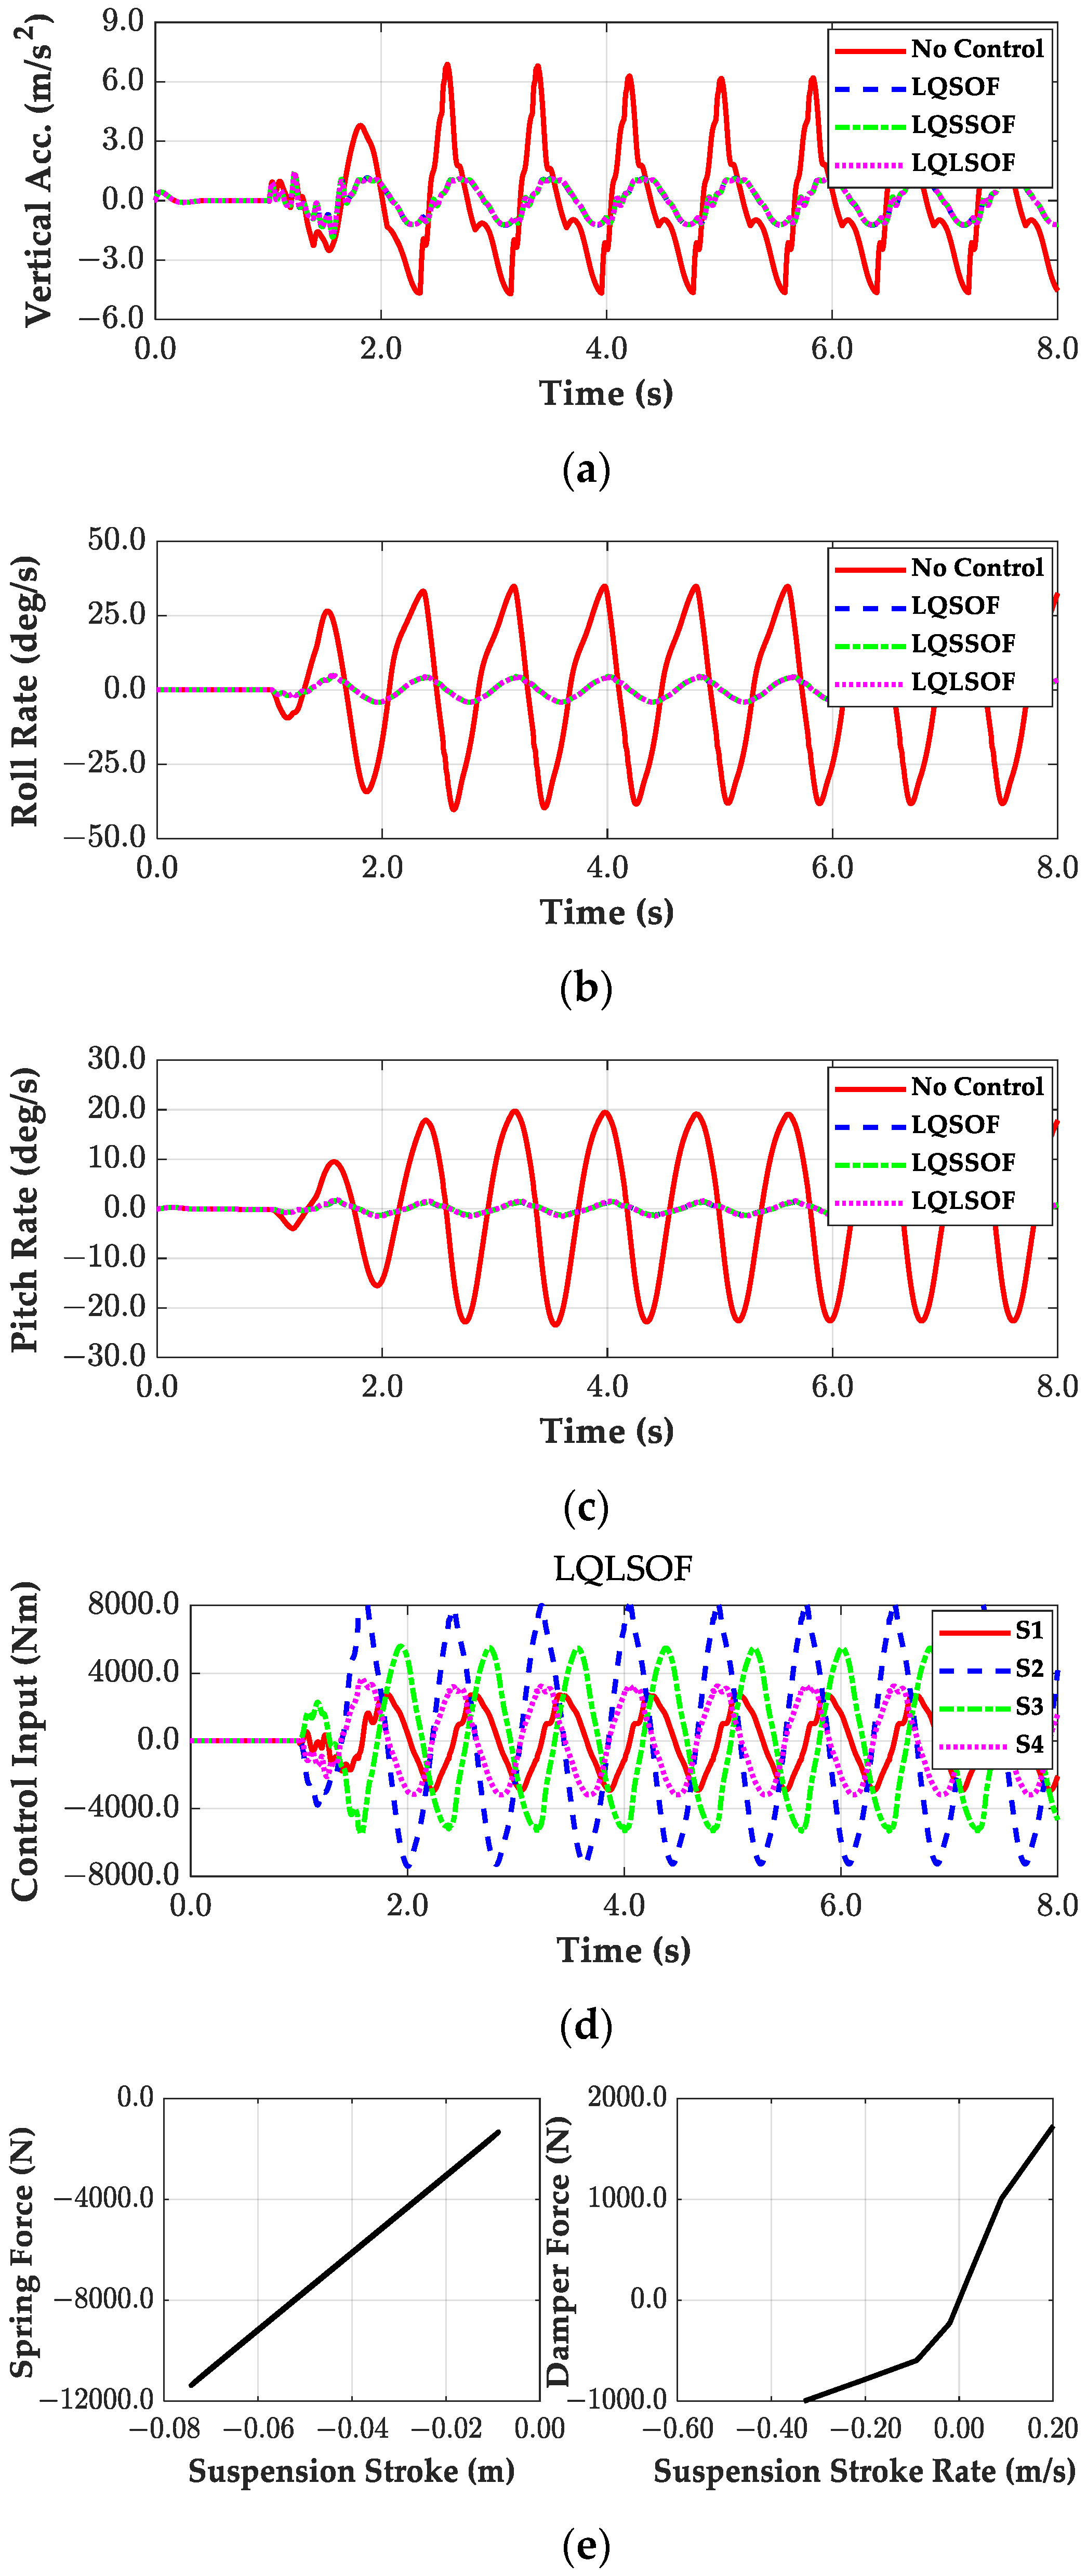
| No Control | 6.9 | 40.3 | 23.4 |
| LQSOF | 1.8 | 4.8 | 1.6 |
| LQSSOF | 1.8 | 4.8 | 1.7 |
| LQLSOF | 1.8 | 4.8 | 1.8 |
| Controller | (m/s2) | (deg/s) | (deg/s) |
|---|---|---|---|
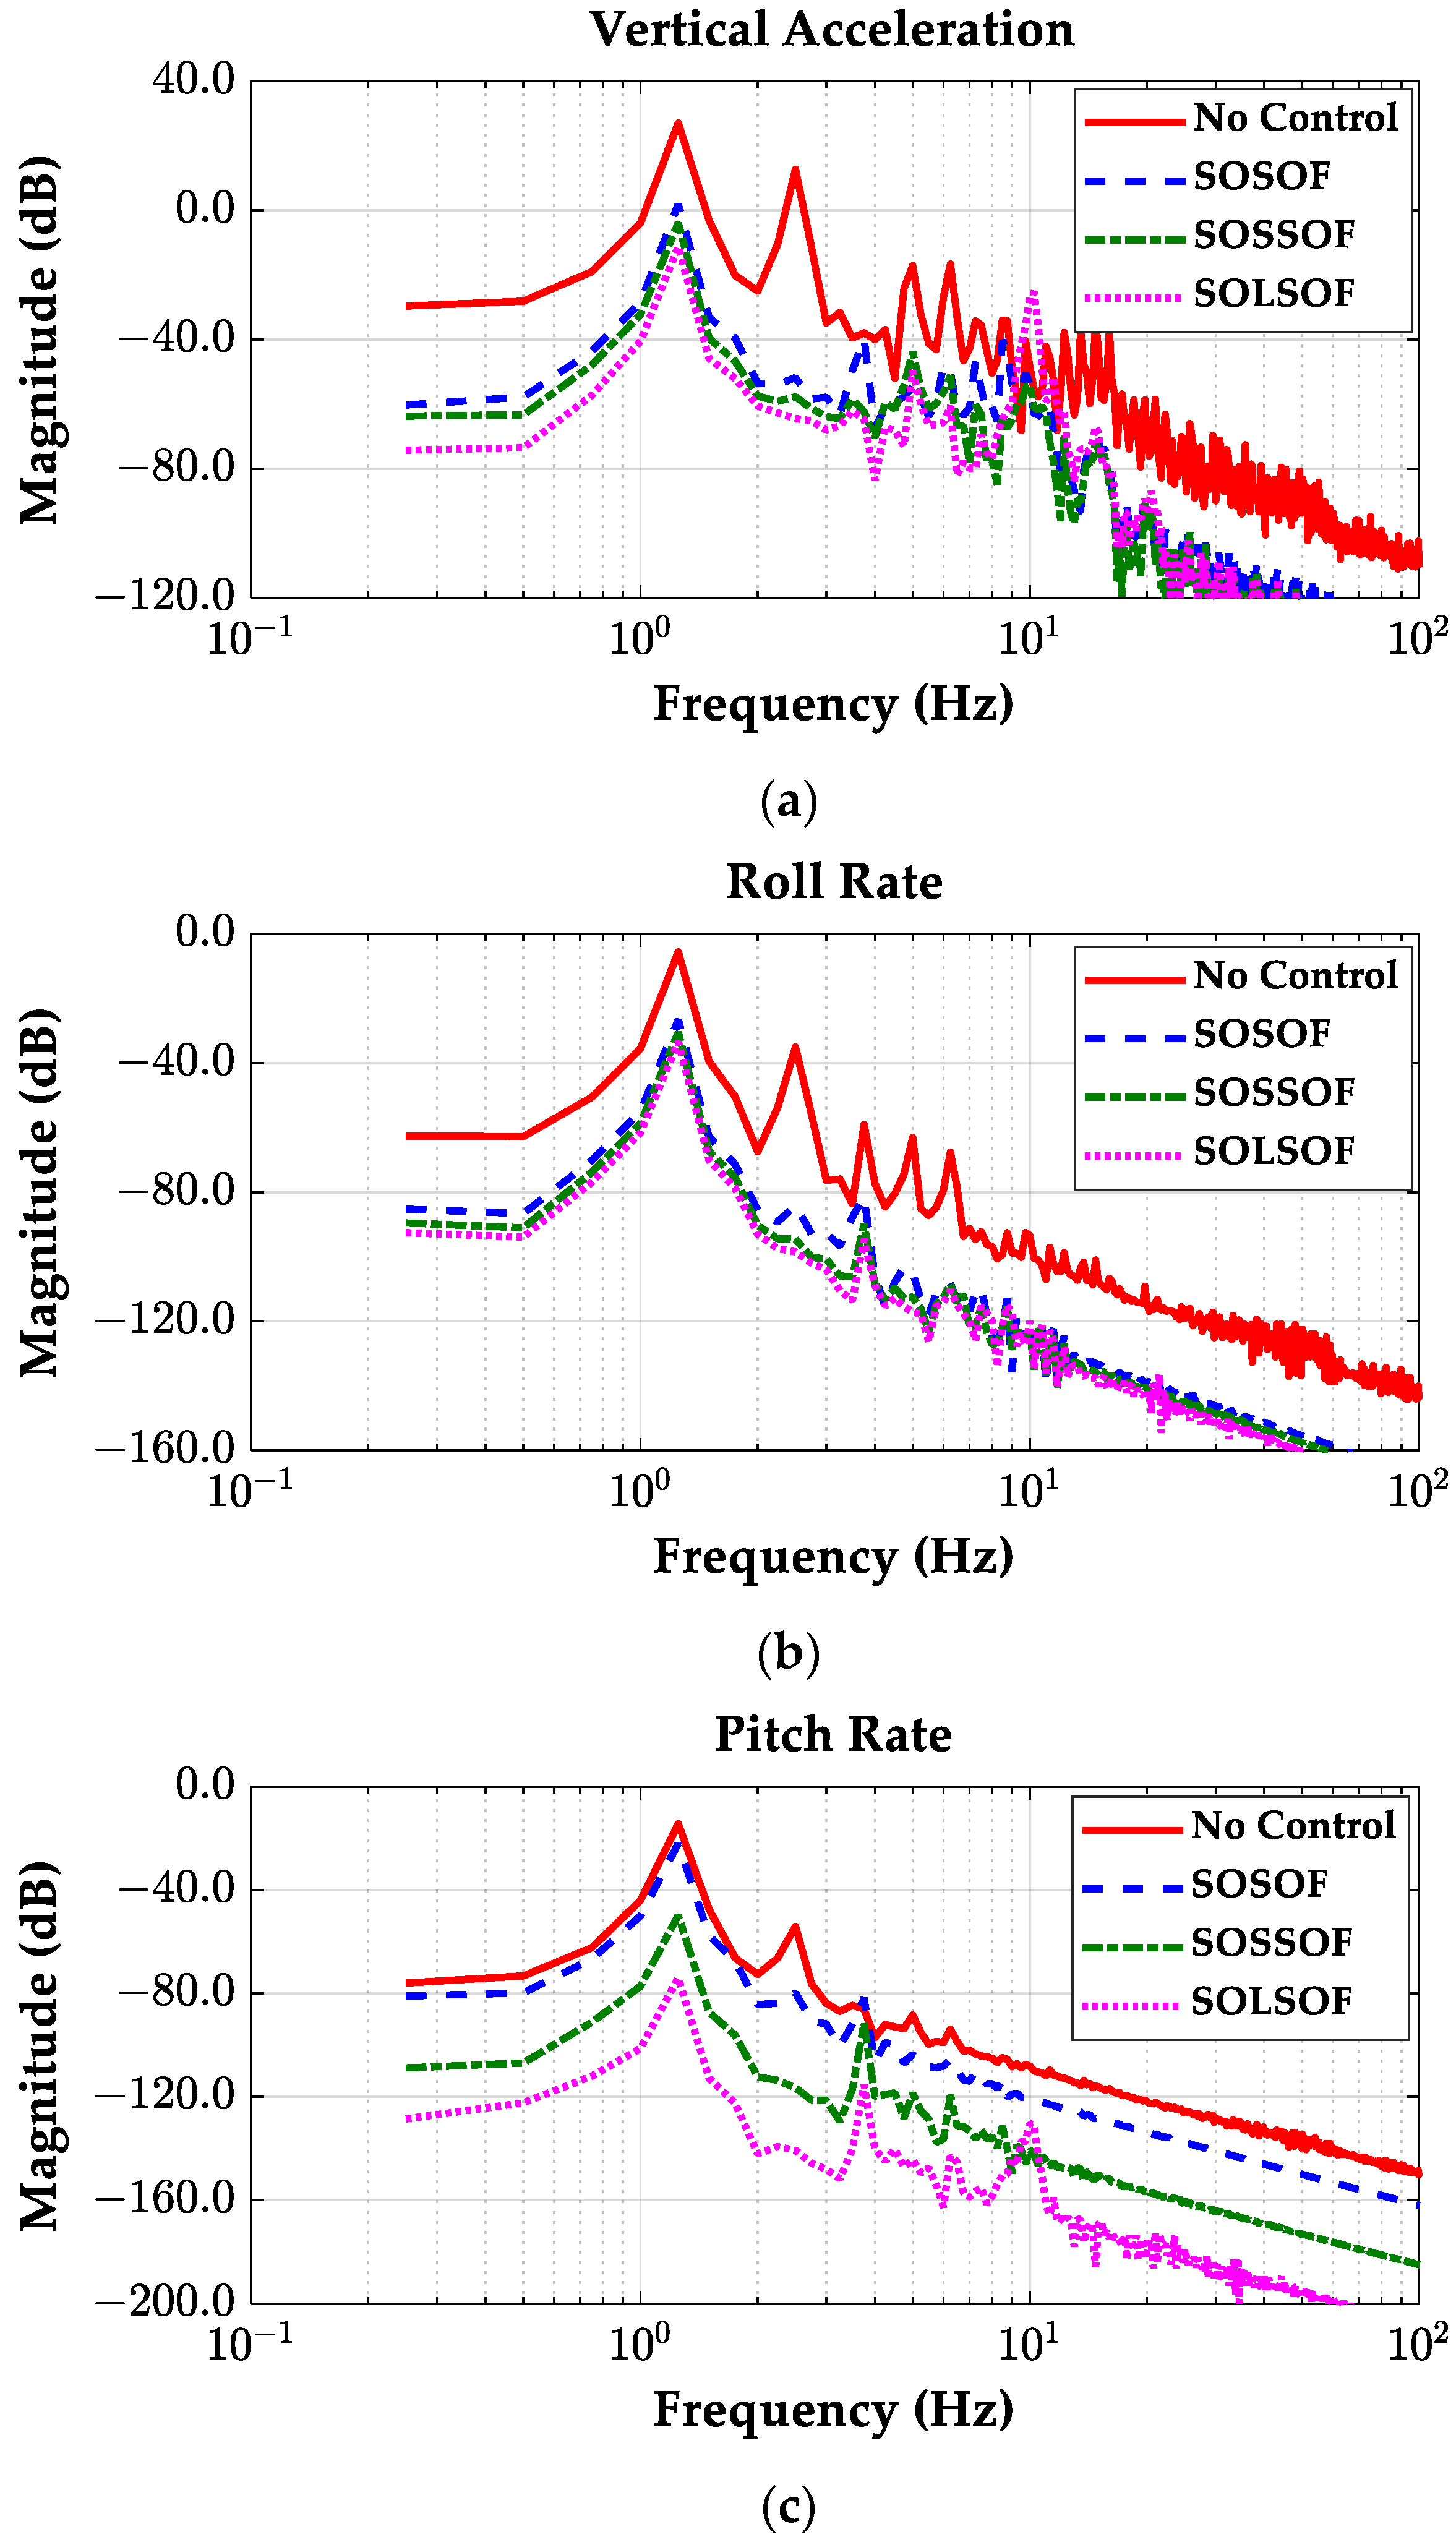
| No Control | 6.9 | 40.3 | 23.4 |
| SOSOF | 1.4 | 9.8 | 13.3 |
| SOSSOF | 1.3 | 8.2 | 2.8 |
| SOLSOF | 1.9 | 7.0 | 0.9 |
Disclaimer/Publisher’s Note: The statements, opinions and data contained in all publications are solely those of the individual author(s) and contributor(s) and not of MDPI and/or the editor(s). MDPI and/or the editor(s) disclaim responsibility for any injury to people or property resulting from any ideas, methods, instructions or products referred to in the content. |
© 2024 by the authors. Licensee MDPI, Basel, Switzerland. This article is an open access article distributed under the terms and conditions of the Creative Commons Attribution (CC BY) license (https://creativecommons.org/licenses/by/4.0/).
Share and Cite
Kim, J.; Yim, S. Design of Static Output Feedback Suspension Controllers for Ride Comfort Improvement and Motion Sickness Reduction. Processes 2024, 12, 968. https://doi.org/10.3390/pr12050968
Kim J, Yim S. Design of Static Output Feedback Suspension Controllers for Ride Comfort Improvement and Motion Sickness Reduction. Processes. 2024; 12(5):968. https://doi.org/10.3390/pr12050968
Chicago/Turabian StyleKim, Jinwoo, and Seongjin Yim. 2024. "Design of Static Output Feedback Suspension Controllers for Ride Comfort Improvement and Motion Sickness Reduction" Processes 12, no. 5: 968. https://doi.org/10.3390/pr12050968
APA StyleKim, J., & Yim, S. (2024). Design of Static Output Feedback Suspension Controllers for Ride Comfort Improvement and Motion Sickness Reduction. Processes, 12(5), 968. https://doi.org/10.3390/pr12050968


