
Open-Circuit Voltage Variation in LiCoO2 Battery Cycled in Different States of Charge Regions

1
Department of Electronics, Information and Bioengineering, Politecnico di Milano, 20133 Milan, Italy
2
Department of Generation Technologies and Material, Ricerca sul Sistema Energetico S.p.A., 20134 Milan, Italy
*
Author to whom correspondence should be addressed.
Energies 2024, 17(10), 2364; https://doi.org/10.3390/en17102364
Submission received: 29 April 2024
/
Revised: 8 May 2024
/
Accepted: 9 May 2024
/
Published: 14 May 2024
(This article belongs to the Section D2: Electrochem: Batteries, Fuel Cells, Capacitors)
Abstract
:Currently, the urgent needs of sustainable mobility and green energy generation are driving governments and researchers to explore innovative energy storage systems. Concurrently, lithium-ion batteries are one of the most extensively employed technologies. The challenges of battery modeling and parameter estimation are crucial for building reliable battery management systems that ensure optimal battery performance. State of charge (SOC) estimation is particularly critical for predicting the available capacity in the battery. Many methods for SOC estimation rely on the knowledge of the open-circuit voltage (OCV) curve. Another significant consideration is understanding how these curves evolve with battery degradation. In the literature, the effect of cycle aging on the OCV is primarily addressed through the look-up tables and correction factors applied to the OCV curve for fresh cells. However, the variation law of the OCV curve as a function of the battery cycling is not well-characterized. Building upon a simple analytical function with five parameters proposed in the prior research to model the OCV as a function of the absolute state of discharge, this study investigates the dependency of these parameters on the moved charge, serving as an indicator of the cycling level. Specifically, the analysis focuses on the impact of cycle aging in the low-, medium-, and high-SOC regions. Three different cycle aging tests were conducted in these SOC intervals, followed by the extensive experimental verification of the proposed model. The results were promising, with mean relative errors lower than 0.2% for the low- and high-SOC cycling regions and 0.34% for the medium-SOC cycling region. Finally, capacity estimation was enabled by the model, achieving relative error values lower than 1% for all the tests.
1. Introduction
Energy storage systems (ESSs) play a pivotal role in modern energy management by storing the excess energy during the low-demand periods and releasing it during the peak demand times. ESSs can be classified into several types based on the mechanism used to store and release the energy, such as mechanical, thermal, electrical, and electrochemical storage devices [1]. Mechanical storage devices include, among others, pumped hydro storage, where energy is stored by pumping water to a higher elevation and released by allowing it to flow downhill through turbines to generate electricity [2,3]; gravity energy storage, where water is used to lift and drop a certain mass moving a turbine [4,5]; and flywheels, where kinetic energy is stored in a rotating mass and released as electricity when needed [6]. Thermal energy storage includes, among others, sensible heat storage, where thermal energy is stored or released by changing the temperature of a material without undergoing phase change, and latent heat storage, where energy is stored or released by changing the phase of a material (e.g., solid to liquid) without changing its temperature [7]. Electrical energy storage includes capacitors, where electrical energy is stored in an electric field in a dielectric material between two conductive plates, providing rapid energy release but lower energy density [8]; supercapacitors, where energy is stored electrostatically at the interface between electrodes and electrolytes based on the double-layer capacitance effect, offering high power density and rapid charging/discharging [9]; and superconducting magnetic energy storage, where energy is stored in a magnetic field generated by superconducting coils, offering high efficiency and fast response times [10,11]. Electrochemical energy storage mainly includes rechargeable batteries, where chemical energy is stored and converted into electrical energy through chemical reactions [12], and redox flow batteries, where the electrochemical cells store energy in liquid electrolytes contained in separate tanks, allowing for scalable and long-duration storage [13].
Rechargeable batteries are among the most commonly used electrochemical storage devices in various applications. Batteries are available in a variety of types, each with its own unique chemistry and characteristics. Nickel–cadmium batteries, for instance, offer moderate energy density but are prone to memory effects. Historically used in portable electronics, their use has declined due to environmental concerns regarding cadmium. However, they are still found in some applications requiring ruggedness and reliability, such as emergency lighting and backup power systems [14]. Nickel–metal hydride batteries offer moderate energy density and good cycle life. They are commonly used in consumer electronics, hybrid vehicles, and power tools. Moreover, they are less susceptible to memory effects compared to nickel–cadmium batteries [15]. Lead–acid batteries, on the other hand, have relatively low energy density but are robust and cost-effective. They are used in automotive starting batteries and backup power systems. The variants include flooded lead–acid, valve-regulated lead–acid, and absorbed glass mat batteries [16].
In particular, the current need of innovative technologies for green energy production and sustainable transportation acts as a stimulus for governments to redirect their incentives toward supporting research in novel energy storage systems with high power and energy density, high efficiency, and long lifetimes. To meet these requirements, lithium-ion batteries (LiBs) represent one of the latest technologies, among the rechargeable batteries, currently under continuous development and study, offering good performance. They are widely used in portable electronic devices, electric vehicles, and renewable energy storage systems. Various types include lithium cobalt oxide (LCO), lithium manganese oxide, lithium nickel manganese cobalt oxide (NMC), lithium nickel cobalt aluminum oxide (NCA), lithium iron phosphate (LFP), and lithium titanate oxide.
However, LiBs are susceptible to aging due to different degradation mechanisms that result in the loss of lithium inventory and the loss of active material. The causes are mainly related to the storage and working conditions, dependent on factors such as the temperature, state of charge (SOC), voltage limits, and current rate. The resulting effects are reflected in a decrease in the battery capacity, leading to a reduction in the stored energy and an increase in the battery’s internal resistance, resulting in a decrease in the power exchange [17,18,19,20]. According to the latter, the state of health (SOH) of an LiB is often associated with either a decrease in capacity or an increase in battery resistance.
To better understand these degradation phenomena and make the battery work under optimal conditions, which can increase its efficiency and mitigate aging, it is very important to develop battery models that are accurate yet easy to implement in battery management systems (BMSs). In this way, BMSs can forecast the battery behavior by estimating its parameters and adequately controlling the operating conditions [21,22,23].
The SOH and SOC are two important parameters among others. Indeed, achieving accurate estimations for the SOH and SOC is essential to operate within the safe and operational limits [24], and to assess the remaining capacity and lifespan of the battery. Moreover, the SOH and SOC are interconnected. As a matter of fact, the accurate estimation of the SOC depends on the current value of the battery capacity, which, in turn, is linked to the SOH.
In the literature, it is possible to find many works proposing different techniques for SOC evaluation, which can be split into non-model- and model-based approaches [25]. Among the former, the coulomb counting method is one of the first techniques used. It simply involves integrating the battery current. While it is simple and imposes a low computational burden, its accuracy is related to the precision of the knowledge of its initial value, and it is susceptible to cumulative errors [26]. The most employed methods among the model-based approaches are those that can be linked to physical models or equivalent circuit models [27]. The physical models are highly accurate but demand a high computational burden due to the involvement of numerous partial differential equations. In contrast, the equivalent circuit models, while less accurate than the former, are considerably simpler as they are described by algebraic and ordinary differential equations [28]. Nonetheless, these methods necessitate the precise identification of the battery open-circuit voltage (OCV) curve as a function of the SOC. Furthermore, the OCV–SOC relationship undergoes variation with aging and temperature [29]. Thus, an accurate understanding of the OCV–SOC relationship, coupled with its dependency on aging and temperature, is crucial for a correct SOC estimation. This work specifically focuses on investigating the cycle aging effect on the OCV curve at a fixed temperature.
In the literature, many studies have proposed different methods for modeling the relationship between the OCV and SOC. These approaches can be broadly categorized into table-based and analytical approaches. The former approaches use look-up tables to represent the OCV–SOC curve [30]. While this approach demands a minimal computational burden, it may require substantial memory, depending on the required precision. Thus, characterizing the curves at different conditions, such as temperature and aging, may necessitate the use of many experimental points. The analytical approaches use mathematical expressions with a certain number of parameters for modeling the OCV–SOC curve. According to the type of analytical function, the parameters can be found through linear or nonlinear regression methods, such as linear or nonlinear least squares (LS) methods. Many analytical functions can be found in the literature. The polynomial functions are widely employed, and they can be of different degrees depending on the desired accuracy [31,32,33]. The higher the degree, the greater the accuracy, but it also leads to an increase in the number of parameters that need to be tuned. Logarithmic functions [34,35,36] and exponential functions [37] are other widely employed functions. The former have only three parameters to be found and exhibit good accuracy, but they cannot approach the limit values of the SOC, i.e., zero and one. Another solution is to model the OCV–SOC curve using a combination of the above-mentioned functions [38,39]. These combined models tend to be more accurate. In [40], the authors modeled the OCV–SOC curve using a combination of exponential and polynomial functions. They obtained an accurate model but with twelve parameters. A solution that reconciles good accuracy and low complexity is proposed in [37]. In this case, the OCV–SOC curve was modeled through two exponential terms and one square root term with only five parameters.
Nevertheless, all the above works did not consider how the battery aging can change the OCV–SOC relationship. In [41], for an LFP battery, the authors corrected the SOC with the current capacity value. In this way, they obtained that the different OCV–SOC curves related to different aging levels were quite coincident. On the other hand, in [42], the authors linked the OCV–SOC curves at the different aging levels to the one of the fresh cell by adding an opportune value. In [43], for another LFP battery, the authors used the SOH information for correcting the OCV–SOC relationship considering aging.
However, these works did not provide a comprehensive variation law of the parameters of OCV–SOC curves with aging. For this reason, the authors of the present work proposed in [44] a simple analytical function for modeling the relationship between the OCV and the absolute state of discharge, q. This function consists of one constant term and two exponentials, with a total of five parameters to be tuned. Specifically, the proposed analytical function stemmed from our exploration of various aforementioned model forms, including polynomial expressions with different degrees. Through this process, we sought a balance between accuracy and complexity, ultimately finding that the double exponential expression provided the best tradeoff, specifically using the coefficient of determination and parameter interpretability. In particular, one exponential term is used to model the convex part of the OCV-q curve, while the other term captures the concave part. Finally, under fixed temperature conditions, the variation in these parameters with cycle aging was assessed. On the other hand, cycle aging was performed only within the linear zone of the OCV-q curve, specifically in the medium SOC between 20 and 80%, with the battery voltage limited between 3.45 V and 4.05 V, lacking the behavior outside those limits. Extending the same results to batteries cycled outside that region is not trivial or obvious a priori.
In light of the above, in the present work, the analysis performed in [44] was conducted to perform cycle aging exploited in three different SOC regions. In particular, using battery cells of the same type as in [44], three different cycle aging tests in low-, medium-, and high-SOC regions were performed, and the proposed model was then verified through an extensive experimental investigation.
2. Battery Model
Given our focus on evaluating the discharge OCV curve, we adopted the simple zero-order Thevenin electric circuit model. In fact, the various dynamic behaviors of the battery do not need to be considered. This model is composed of a q-controlled voltage source and a series resistor, as depicted in Figure 1. The q-controlled voltage source, vocv(q), imposes the OCV voltage as a function of the absolute state of discharge, q, considering the OCV-q relationship of the LiB, while the series resistor, Rbat, models the battery’s internal resistance. The latter considers various phenomena, including the ohmic resistance of the different materials composing the battery (electrodes, current collectors, and electrolyte), the solid electrolyte interface film resistance, and the resistance that takes into account the overpotentials due to chemical phenomena (charge transfer and diffusion processes).
The absolute state of discharge, q, is evaluated as follows:
where q(0) represents the initial value of the state of discharge. Thus, the SOC can be linked to q and the actual battery capacity, Ca, using the following equation:
According to the equivalent electric circuit of Figure 1, the total voltage developed by the battery at its terminals, vbat, is related to the battery current, ibat, and OCV voltage, vocv, according to Kirchhoff’s voltage law:
The vocv(q) curve modeling the relationship between the OCV and absolute state of discharge was defined as
where parameters p1, p2, p3, λ1, and λ2 are characteristics of the LiB and have to be found, as will be discussed later.
To expedite the experimental tests, the discharge vocv(q) experimental curves were obtained by fully discharging the LiB at 1C. Consequently, the battery resistance causes the output voltage of LiB to deviate from the OCV due to the related voltage drop. Assuming the battery resistance remains relatively constant with the SOC, as in [44], it was estimated and subtracted from the output battery voltage. Starting from the battery being fully charged, the estimation of the battery resistance was conducted by considering that, when the battery starts to discharge, it undergoes an electric transient related to different chemical phenomena. Considering the proper time interval, following the procedure reported in [45], the resistance of the battery was estimated as the ratio between the voltage variation during this time interval and current step, as reported in Figure 2. Then, the vocv(q) curve was obtained, and the section of the vocv(q) curve related to the that time interval was removed.
Since we are interested in analyzing how the cycle aging, exploited in different SOC cycling regions, affects the vocv(q) relationship, it is possible that parameters p1, p2, p3, λ1, and λ2 may be varying as a function of the cycle aging itself. Therefore, to quantify the level of cycle aging, the total moved charge, Q, of the LiB exchanges was used. It is defined as follows:
In this way, considering (5), the parameters of (4) can become dependent on Q.
3. Test Procedure and Setup
For the present analysis, three LCO battery cells manufactured by General Electronics Battery Co., Ltd. (Shenzhen, China), were cycled across three different SOC intervals to analyze the influence of the mean SOC in the low-, medium-, and high-SOC regions during aging cycles on the vocv(q) curve. These batteries are 8,773,160 K pouch cells (10 Ah, 2.75–4.2 V) of the same production batch.
3.1. Experimental Setup
The experimental setup used for the tests is depicted in Figure 3, and the details are provided below.
It comprises a potentiostat (SP-150) and a 100 A booster (VMP3B-100), both manufactured by Biologic Science Instrument. These instruments were interfaced with a PC via an ethernet cable and controlled using the EC-Lab (v11.34) software. The 100 A booster was linked to the LiB cell under test through a power cable. The LiB cell configuration included a heatsink, two fans, three Peltier cells, a DC voltage source, a temperature probe, and a Texas Instrument DRV8303 inverter managed by an F28069M controller board.
The three Peltier cells were connected in series and powered by a DC voltage source. They were positioned between the LiB cell under test and the heatsink and properly controlled by the control board through the inverter to maintain a uniform temperature of 25 °C throughout the aging cycles and discharge voltage curve measurements. This helped to minimize temperature-induced variations in the vocv(q) curve.
3.2. Experimental Procedure
The experimental procedure, whose flow chart is reported in Figure 4, encompassed two stages: the reference characterization stage and the cycle aging stage. In both stages, the temperature was kept constant at 25 °C. The first stage was conducted at the beginning of the batteries’ life and after each cycle aging stage, which involved moving approximately 500 Ah.
The reference characterization stage involved the constant current–constant voltage protocol (CC–CV). Specifically, LiBs were fully charged at 10 A (1C) up to reaching the maximum cutoff voltage of 4.2 V. Subsequently, this voltage was maintained until the current decayed below 500 mA (0.05C). After the batteries were fully charged, they underwent discharge with a current of 10 A (1C) up to reaching the minimum cutoff voltage of 2.75 V. After this stage was completed, the LiBs cycled in the low- and medium-SOC regions were charged at 10 A (1C) moving 1 Ah and 5.2 Ah, which correspond to 10% and 52% of the nominal capacity, respectively. Instead, the LiB cycled in the high-SOC region was fully charged again through the CC–CV protocol and then discharged at 10 A (1C) moving 1 Ah, which corresponds to 90% of the nominal capacity. It is important to highlight that, as the battery cells age, their actual capacity decreases. Consequently, moved charges of 1 Ah and 5.2 Ah may correspond to different percentages of SOC, that, however, are minimal (approximately 5%) and did not alter the mean values of the SOC regions at which the three batteries were cycled.
The cycle aging stage consisted of charging and discharging the three LiBs at 20 A (2C) around the three related mean SOCs, limiting these variations according to two factors: the maximum SOC variation and the voltage limits. These limits varied for the tests performed in the three SOC regions. In particular, for the LiB cycled in the low-SOC region, the limits were −0.4 Ah and +0.4 Ah (±4% of nominal capacity), and 2.75 V and 3.65 V; for the tests performed in the medium-SOC region, the limits were −0.4 Ah and +0.4 Ah, and 3.60 V and 3.95 V; for the tests performed in the high-SOC region, the limits were +0.4 Ah and −0.4 Ah, and 3.90 V and 4.20 V. It is important to highlight that, in cases where voltage limits were reached before the maximum SOC variation limits, the charge moved in one cycle would vary based on aging. Nevertheless, findings from [46] indicate that, at least in the linear zone of the OCV curve between 20% and 80% of SOC and fixed temperature, battery aging is independent of the SOC interval and cycle shape. Moreover, in [47], it was proven that, under the same conditions, the charging/discharging current rate did not affect cycle aging. In [19], the authors showed that, for the same SOC interval, cycle aging depends on the mean SOC value. Taking these aspects into consideration, we can assume that the battery is solely dependent on the total moved charge Q for each mean SOC value.
4. Discussion
The experimental tests conducted through the procedure reported in the previous section resulted in 29 discharge output battery voltage curves for each of the three battery cells cycled in the low-, medium-, and high-SOC regions at different moved charge Q values, i.e., cycling levels, up to about 17–20 kAh. According to [45], the time interval used for calculating the battery resistance was chosen to be equal to 50 s for all the tests. Then, for each output battery voltage curve, the associated voltage drop was eliminated, along with the related interval of the curve, to obtain the discharge vocv(q) experimental curves.
4.1. Model Characterization
During the reference characterization stage, in all the tests, the batteries started discharging from fully charged conditions, corresponding to a voltage of 4.2 V. The assurance of this voltage level was accomplished using the CC–CV protocol. Consequently, it is reasonable to consider that, for all the tests, vocv(0) = 4.2 V. Therefore, parameter p3 of (4) can be linked to parameters p1 and p2, reducing the number of the total parameters to be tuned to four, as follows:
Considering (6), the proposed model (4) was used to fit the experimental vocv(q) curves employing the nonlinear LS technique and finding the other four parameters. The fitting procedure used the “fit” function available in the Matlab (v2022b) software using the Levenberg–Marquardt algorithm. Moreover, the coefficients of determination (R2) were calculated.
To characterize the model, seven vocv(q) curves were chosen for each battery cell cycled in the low-, medium-, and high-SOC regions. Figure 5 reports such experimental curves together with the modeled ones for the characterization subset of the tests. From the figure, it can be asserted that the proposed model fits the experimental data very well for all the tests of the three SOC cycling regions. Figure 6 shows the corresponding R2 values, all of which are greater than 0.994 for all the tests.
Figure 7 presents the parameters of (4) as a function of Q, through which it is possible to recognize that, for each SOC cycling region, all the parameters exhibit similar trends, although they are not well defined. This suggests that the changes in the vocv(q) relationship due to cycle aging affect the shape in a manner that causes the parameters to vary similarly; i.e., the OCV curves change in a homogenous way. Therefore, fewer parameters may be regarded as a function of the cycling level. Furthermore, from a mathematical standpoint, it is possible to recognize that parameters p1 and p2 cause the two exponentials to shift along the q-axis and vocv-axis in a manner that the vocv(q) function intersection with the vocv-axis remains 4.2. Meanwhile, the other two parameters, λ1 and λ2, influence the rate of change of the exponentials. Moreover, parameters p1, λ1, and λ2 remain relatively constant with the cycling level. Thus, we attempted to fit (4) while keeping these three parameters constant at their mean values obtained from the initial nonlinear LS fitting procedure. In this scenario, the fitting function became linear in its parameters, and the linear LS method was then applied to determine these parameters. Unfortunately, this procedure resulted in poor fitting. Thus, the fitting procedure was performed again, considering only parameters λ1 and λ2 as constant, resulting in better fitting. Table 1 lists the values of parameters λ1 and λ2.
Figure 8 illustrates the comparison between the experimental and modeled vocv(q) curves, with parameters λ1 and λ2 fixed, for the characterization subset of tests within the three SOC cycling regions. In Figure 9, the corresponding R2 values were reported. Even in this case, for all the SOC cycling regions, the proposed model fits the experimental data very well, and all the R2 values are still greater than 0.994. Furthermore, parameters p1 and p2 assumed a better-defined trend, and it was possible to model their dependency on Q. Thus, parameters p1 and p2 were fitted using the following analytical functions:
where the coefficients of parameter p1 and p2 are reported in Table 2. The trends of these two parameters compared with their fitting functions are depicted in Figure 10.
The presented procedure allowed us to derive a simple vocv(q) model with a total of four parameters to be tuned, with only two of them depending on Q. It is interesting to note that parameters λ1 and λ2 are very similar for the three SOC cycling regions. This can represent a very intriguing result, suggesting that the two parameters λ1 and λ2 inherently characterize the type of batteries. According to the specific values of parameters p1 and p2, the following observations can be made: when p1 increases, the shift of the curve along the q-axis is very slight, but the entire curve lowers. Conversely, a decrease in parameter p2 causes the curve to shift to the left along the q-axis with a minimal effect on the vocv-axis. Therefore, it changes the value of q, corresponding to the minimum cutoff voltage of 2.75 V.
4.2. Model Validation
The proposed model was validated using all the experimental vocv(q) curves at different cycling levels and for each SOC cycling region comparing them with the corresponding modeled curves. To quantify the goodness of fit, the absolute and relative errors of the vocv(q) prediction were assessed. In particular, they were defined as follows:
where represents the values of the experimental data, and represents the related values of the modeled ones.
Figure 11 and Figure 12 present the maximum and mean values of both the absolute and relative vocv(q) prediction errors for each cycling level, Q. From Figure 11, it is possible to recognize that the maximum relative errors are not higher than 6.4%, 3.5%, and 5.2% for the low-, medium-, and high-SOC cycling regions, respectively, while the mean relative errors are not higher than 0.2% for the low- and high-SOC cycling regions and 0.4% for the medium-SOC cycling region.
The vocv(q) value exhibits significant variation with the absolute state of discharge in LiBs. Consequently, the relative error may have more significance at high states of discharge. For this reason, Figure 12 shows the maximum and mean values of the absolute error. From this figure, it is evident that the maximum absolute errors are not higher than 180 mV, 110 mV, and 150 mV for the low-, medium-, and high-SOC cycling regions, respectively. Similarly, it is possible to recognize that the mean absolute errors are not higher than 7 mV for the low- and high-SOC cycling regions and 14 mV for the medium-SOC cycling region.
Finally, to provide a comprehensive indication of the goodness of fit, the R2 values were also evaluated and are reported in Figure 13. They are greater than 0.993 for the low-SOC cycling region, 0.991 for the medium-SOC cycling region, and 0.994 for the high-SOC cycling region, confirming the good accuracy of the proposed model along with cycle aging for all the SOC regions.
4.3. Actual Capacity Estimation of the Battery
The proposed model enables the prediction of the actual battery capacity, Ca. Through this, it becomes possible to estimate the SOH related to the capacity fade and correct the SOC according to (2). In particular, this is achievable by solving (4) with respect to Ca, by setting the minimum cutoff voltage vocv,min as the output battery voltage. In fact, according to (4) and (1), when the vocv(q) reaches the latter voltage, the absolute state of discharge, q, assumes the value of Ca. To assess the accuracy of predicting the latter, the capacity relative error was defined as follows:
where qmod(vocv,min) and qexp(vocv,min) are the predicted and experimental actual battery capacities, respectively. In our case, the value of the minimum cutoff voltage is 2.75 V. However, during the characterization procedure, the voltage drop over the battery resistance was eliminated, and then the actual minimum voltage was dependent on the amplitude of such voltage drop, resulting in slightly higher than 2.75 V. In any case, the difference is negligible; therefore, the last experimental vocv point was considered as the minimum one, and the corresponding actual battery capacity was evaluated and compared with the predicted one. The relative errors of the battery capacity are presented in Figure 14 for the three SOC cycling regions. Analyzing that figure, the maximum capacity relative error is about 1% for the low- and high-SOC cycling tests and 0.5% for the medium-SOC cycling tests.
After predicting the actual battery capacity, it becomes possible to calculate the SOH in terms of the capacity fade as follows:
where Ci is the initial value of the battery capacity for Q = 0.
Figure 15 shows the capacity fade for the three batteries cycled in the low-, medium-, and high-SOC regions. It is worth noting that, for cycle levels up to about 5 kAh, the higher the SOC cycling region, the faster the capacity fade occurs. On the other hand, for cycling levels greater than 5 kAh, the battery cycled in the medium-SOC region experienced the highest capacity fade. Specifically, considering the maximum common cycling level of about 16 kAh, the battery cycled in the medium-SOC region presented a capacity fade of about 4.3%. Conversely, the battery cycled in the low-SOC region experienced the lowest capacity fade, approximately 1.8%, while the battery cycled in the high-SOC region exhibited a capacity fade of about 2.7%. Regarding this, there are few works [19,48,49,50,51] in the literature that analyze how the SOC region can affect the cycle aging of LiBs, and they present conflicting results. In [19,48], the authors cycled different NMC batteries in various SOC regions at the same temperature and current rate. The results indicated that, for the same number of cycles, the batteries aged faster in higher-SOC regions. Similar findings were reported in [49], for LMO/NMC batteries, and in [52] for LCO batteries. On the other hand, in [50], for NMC batteries, the authors demonstrated that, at the same temperature and current rate, the battery aged faster in low- and high-SOC regions, while the minimum degradation occurred for the battery cycled around 50% of SOC. Similar results were reported in [51] for NMC/NCA batteries. Conversely, in [53], the authors showed that, for NCA batteries, the aging rate increased as the SOC regions shifted towards higher values, peaking in the medium/high-SOC region (65–85% of SOC). However, beyond this point, the aging rate decreased again. The variations in the results may stem from differences in battery chemistry, as well as in the test procedures and protocols employed. In our case, we ensured that the three LCO batteries were from the same production batch, and, before testing, they were stored under identical conditions. Moreover, during the tests, we not only restricted the SOC regions but also imposed limits on the battery voltage, preventing overlap between the different voltage regions associated with the different tests. Therefore, careful attention should be paid to the analysis of cycle aging in LiBs, and to be cautious when claiming that batteries can age faster or slower based on specific SOC cycling regions.
5. Conclusions
In this study, the proposed vocv(q) model with five parameters, as reported in [44] to account for the cycle aging effects in the SOC region between 20% and 80% at a fixed temperature for an LCO battery, was extended for different SOC regions (low, medium, and high regions). Additionally, for the model validation, a series of experimental tests involving several vocv(q) curves at various cycling levels for each SOC region were conducted.
Seven vocv(q) curves, for the battery cells cycled in low-, medium-, and high-SOC regions, were selected for model characterization. Assuming the batteries started from a fully charged condition, parameter p3 was constrained considering the same initial voltage of 4.2 V for all the vocv(q) curves, obtaining just four parameters to be tuned. Although the results of the fitting were satisfactory, the other parameters of equation (4), for each SOC cycling region, exhibited similar trends as a function of Q. This suggested that changes in the vocv(q) relationship due to cycle aging could be modeled with fewer parameters considered as a function of the cycling level. Furthermore, parameters p1, λ1, and λ2 remained relatively constant with the cycling level.
Therefore, the model was fitted again, keeping λ1 and λ2 constant at their mean values of the initial fitting, demonstrating a good match with the experimental values. Moreover, the fact that these parameters are quite similar across the three SOC cycling regions hints at the possibility that λ1, and λ2 may inherently capture the distinctive characteristics of the battery type.
Subsequently, parameters p1 and p2 were individually fitted for the three SOC cycling regions using simple analytical functions, leading to the derivation of the vocv(q) curve model.
All the experimental vocv(q) curves were used to prove the accuracy of the proposed model. The absolute and relative error of the vocv(q) prediction, together with the R2 value, were calculated to quantify the goodness of fit. The results yielded favorable outcomes, with mean relative errors lower than 0.2% for the low- and high-SOC cycling regions and 0.4% for the medium-SOC cycling region. To confirm the good accuracy of the proposed model, the R2 values were found to be greater than 0.993 for the low-SOC cycling region, 0.991 for the medium-SOC cycling region, and 0.994 for the high-SOC cycling region.
Furthermore, the proposed model allows us to estimate the actual battery capacity. The relative error in capacity remained below 1% for all the aging conditions. With knowledge of the actual battery capacity, it becomes feasible to accurately estimate the SOC, accounting for the capacity fade of the battery. In summary, it is possible to affirm that the proposed model is both straightforward and highly accurate regarding estimating the OCV, SOC, and SOH in terms of the capacity fade and is valid for the cycle aging in different SOC regions. Additionally, the simplicity of the proposed OCV-q model, if coupled with a comprehensive battery model, can facilitate the real-time implementation in BMSs, allowing for rapid and accurate SOH and SOC estimation during battery operation. Overall, the model enhances the capability of BMSs to optimize the battery usage, prolong the lifespan, and ensure reliable performance in various applications.
Additionally, we found that the battery cycled in the medium-SOC region experienced faster capacity fade. However, conflicting results regarding this aspect can be found in the literature, as discussed above. Therefore, it is essential to pay close attention to the analysis of cycle aging in LiBs.
The analysis was carried out for LCO batteries, which are employed in many portable electronic devices, such as smartphones or laptops. In particular, we are confident that, for batteries with cobalt-based cathodes, such as NMC and NCA, which exhibit similar OCV-q curve trends, the proposed analytical function is suitable for modeling the OCV-q curve.
Nevertheless, in future works, it would be interesting to explore and validate the applicability of the same analysis to different types of batteries under the same test conditions to determine whether the same model can be used or if modifications are necessary. Conversely, for the same kind of batteries, the model can be extended to consider different operating temperatures and aging conditions.
Author Contributions
Conceptualization, S.B. and S.C.; methodology, S.B. and S.C.; validation, S.B. and S.C.; formal analysis, S.B. and S.C.; writing—original draft preparation, S.B. and S.C.; writing—review and editing, S.B., L.C., S.C., and L.P.; supervision, L.C. and L.P. All authors have read and agreed to the published version of the manuscript.
Funding
The work of Silvia Colnago has been financed by the Research Fund for the Italian Electrical System under the Three-Year Research Plan 2022–2024 (DM MITE n. 337, 15.09.2022), in compliance with the Decree of 16 April 2018.
Data Availability Statement
The datasets presented in this article are not readily available because the data are part of an ongoing study.
Conflicts of Interest
Author Silvia Colnago was employed by the company Ricerca sul Sistema Energetico S.p.A. Silvia Colnago and the remaining authors declare that the research was conducted in the absence of any commercial or financial relationships that could be construed as a potential conflict of interest.
References
- Mitali, J.; Dhinakaran, S.; Mohamad, A.A. Energy Storage Systems: A Review. Energy Storage Sav. 2022, 1, 166–216. [Google Scholar] [CrossRef]
- Krishan, O.; Suhag, S. An Updated Review of Energy Storage Systems: Classification and Applications in Distributed Generation Power Systems Incorporating Renewable Energy Resources. Int. J. Energy Res. 2019, 43, 6171–6210. [Google Scholar] [CrossRef]
- Rehman, S.; Al-Hadhrami, L.M.; Alam, M.M. Pumped Hydro Energy Storage System: A Technological Review. Renew. Sustain. Energy Rev. 2015, 44, 586–598. [Google Scholar] [CrossRef]
- Aneke, M.; Wang, M. Energy Storage Technologies and Real Life Applications—A State of the Art Review. Appl. Energy 2016, 179, 350–377. [Google Scholar] [CrossRef]
- Berrada, A.; Loudiyi, K.; Zorkani, I. System Design and Economic Performance of Gravity Energy Storage. J. Clean. Prod. 2017, 156, 317–326. [Google Scholar] [CrossRef]
- Hossain, E.; Faruque, H.; Sunny, M.; Mohammad, N.; Nawar, N. A Comprehensive Review on Energy Storage Systems: Types, Comparison, Current Scenario, Applications, Barriers, and Potential Solutions, Policies, and Future Prospects. Energies 2020, 13, 3651. [Google Scholar] [CrossRef]
- Sharma, A.; Tyagi, V.V.; Chen, C.R.; Buddhi, D. Review on Thermal Energy Storage with Phase Change Materials and Applications. Renew. Sustain. Energy Rev. 2009, 13, 318–345. [Google Scholar] [CrossRef]
- Clelland, I.; Price, R.; Sarjeant, W.J. Advances in Capacitor Technology for Modern Power Electronics. In Proceedings of the Conference Record of the 2000 Twenty-Fourth International Power Modulator Symposium, Norfolk, VA, USA, 26–29 June 2000; pp. 145–148. [Google Scholar]
- Luo, X.; Wang, J.; Dooner, M.; Clarke, J. Overview of Current Development in Electrical Energy Storage Technologies and the Application Potential in Power System Operation. Appl. Energy 2015, 137, 511–536. [Google Scholar] [CrossRef]
- Boom, R.; Peterson, H. Superconductive Energy Storage for Power Systems. IEEE Trans. Magn. 1972, 8, 701–703. [Google Scholar] [CrossRef]
- Torre, W.V.; Eckroad, S. Improving Power Delivery through the Application of Superconducting Magnetic Energy Storage (SMES). In Proceedings of the 2001 IEEE Power Engineering Society Winter Meeting. Conference Proceedings (Cat. No.01CH37194), Columbus, OH, USA, 28 January–1 February 2001; Volume 1, pp. 81–87. [Google Scholar]
- Rey, S.O.; Romero, J.A.; Romero, L.T.; Martínez, À.F.; Roger, X.S.; Qamar, M.A.; Domínguez-García, J.L.; Gevorkov, L. Powering the Future: A Comprehensive Review of Battery Energy Storage Systems. Energies 2023, 16, 6344. [Google Scholar] [CrossRef]
- Vazquez, S.; Lukic, S.M.; Galvan, E.; Franquelo, L.G.; Carrasco, J.M. Energy Storage Systems for Transport and Grid Applications. IEEE Trans. Ind. Electron. 2010, 57, 3881–3895. [Google Scholar] [CrossRef]
- Tsais, P.-J.; Chan, L.I. Nickel-Based Batteries: Materials and Chemistry. In Electricity Transmission, Distribution and Storage Systems; Elsevier: Amsterdam, The Netherlands, 2013; pp. 309–397. [Google Scholar]
- Arun, V.; Kannan, R.; Ramesh, S.; Vijayakumar, M.; Raghavendran, P.S.; Siva Ramkumar, M.; Anbarasu, P.; Sundramurthy, V.P. Review on Li-Ion Battery vs Nickel Metal Hydride Battery in EV. Adv. Mater. Sci. Eng. 2022, 2022, 1–7. [Google Scholar] [CrossRef]
- Zhang, C.; Wei, Y.-L.; Cao, P.-F.; Lin, M.-C. Energy Storage System: Current Studies on Batteries and Power Condition System. Renew. Sustain. Energy Rev. 2018, 82, 3091–3106. [Google Scholar] [CrossRef]
- Redondo-Iglesias, E.; Venet, P.; Pelissier, S. Calendar and Cycling Ageing Combination of Batteries in Electric Vehicles. Microelectron. Reliab. 2018, 88–90, 1212–1215. [Google Scholar] [CrossRef]
- Barré, A.; Deguilhem, B.; Grolleau, S.; Gérard, M.; Suard, F.; Riu, D. A Review on Lithium-Ion Battery Ageing Mechanisms and Estimations for Automotive Applications. J. Power Sources 2013, 241, 680–689. [Google Scholar] [CrossRef]
- Gao, Y.; Jiang, J.; Zhang, C.; Zhang, W.; Jiang, Y. Aging Mechanisms under Different State-of-Charge Ranges and the Multi-Indicators System of State-of-Health for Lithium-Ion Battery with Li(NiMnCo)O2 Cathode. J. Power Sources 2018, 400, 641–651. [Google Scholar] [CrossRef]
- Vermeer, W.; Chandra Mouli, G.R.; Bauer, P. A Comprehensive Review on the Characteristics and Modeling of Lithium-Ion Battery Aging. IEEE Trans. Transp. Electrif. 2022, 8, 2205–2232. [Google Scholar] [CrossRef]
- Gabbar, H.; Othman, A.; Abdussami, M. Review of Battery Management Systems (BMS) Development and Industrial Standards. Technologies 2021, 9, 28. [Google Scholar] [CrossRef]
- Lelie, M.; Braun, T.; Knips, M.; Nordmann, H.; Ringbeck, F.; Zappen, H.; Sauer, D. Battery Management System Hardware Concepts: An Overview. Appl. Sci. 2018, 8, 534. [Google Scholar] [CrossRef]
- Luo, X.; Kang, L.; Lu, C.; Linghu, J.; Lin, H.; Hu, B. An Enhanced Multicell-to-Multicell Battery Equalizer Based on Bipolar-Resonant LC Converter. Electronics 2021, 10, 293. [Google Scholar] [CrossRef]
- Zheng, F.; Xing, Y.; Jiang, J.; Sun, B.; Kim, J.; Pecht, M. Influence of Different Open Circuit Voltage Tests on State of Charge Online Estimation for Lithium-Ion Batteries. Appl. Energy 2016, 183, 513–525. [Google Scholar] [CrossRef]
- Yang, F.; Xing, Y.; Wang, D.; Tsui, K.-L. A Comparative Study of Three Model-Based Algorithms for Estimating State-of-Charge of Lithium-Ion Batteries under a New Combined Dynamic Loading Profile. Appl. Energy 2016, 164, 387–399. [Google Scholar] [CrossRef]
- Ren, X.; Liu, S.; Yu, X.; Dong, X. A Method for State-of-Charge Estimation of Lithium-Ion Batteries Based on PSO-LSTM. Energy 2021, 234, 121236. [Google Scholar] [CrossRef]
- Xiong, R.; Yu, Q.; Wang, L.Y.; Lin, C. A Novel Method to Obtain the Open Circuit Voltage for the State of Charge of Lithium Ion Batteries in Electric Vehicles by Using H Infinity Filter. Appl. Energy 2017, 207, 346–353. [Google Scholar] [CrossRef]
- Elmahallawy, M.; Elfouly, T.; Alouani, A.; Massoud, A.M. A Comprehensive Review of Lithium-Ion Batteries Modeling, and State of Health and Remaining Useful Lifetime Prediction. IEEE Access 2022, 10, 119040–119070. [Google Scholar] [CrossRef]
- Lavigne, L.; Sabatier, J.; Francisco, J.M.; Guillemard, F.; Noury, A. Lithium-Ion Open Circuit Voltage (OCV) Curve Modelling and Its Ageing Adjustment. J. Power Sources 2016, 324, 694–703. [Google Scholar] [CrossRef]
- Sundaresan, S.; Devabattini, B.; Kumar, P.; Pattipati, K.; Balasingam, B. Tabular Open Circuit Voltage Modelling of Li-Ion Batteries for Robust SOC Estimation. Energies 2022, 15, 9142. [Google Scholar] [CrossRef]
- He, H.; Xiong, R.; Zhang, X.; Sun, F.; Fan, J. State-of-Charge Estimation of the Lithium-Ion Battery Using an Adaptive Extended Kalman Filter Based on an Improved Thevenin Model. IEEE Trans. Veh. Technol. 2011, 60, 1461–1469. [Google Scholar] [CrossRef]
- Sun, D.; Yu, X.; Wang, C.; Zhang, C.; Huang, R.; Zhou, Q.; Amietszajew, T.; Bhagat, R. State of Charge Estimation for Lithium-Ion Battery Based on an Intelligent Adaptive Extended Kalman Filter with Improved Noise Estimator. Energy 2021, 214, 119025. [Google Scholar] [CrossRef]
- Zhao, S.; Duncan, S.R.; Howey, D.A. Observability Analysis and State Estimation of Lithium-Ion Batteries in the Presence of Sensor Biases. IEEE Trans. Control Syst. Technol. 2017, 25, 326–333. [Google Scholar] [CrossRef]
- Xiong, R.; He, H.; Guo, H.; Ding, Y. Modeling for Lithium-Ion Battery Used in Electric Vehicles. Procedia Eng. 2011, 15, 2869–2874. [Google Scholar] [CrossRef]
- Xiong, R.; He, H.; Sun, F.; Zhao, K. Online Estimation of Peak Power Capability of Li-Ion Batteries in Electric Vehicles by a Hardware-in-Loop Approach. Energies 2012, 5, 1455–1469. [Google Scholar] [CrossRef]
- Ta, K.P.; Newman, J. Proton Intercalation Hysteresis in Charging and Discharging Nickel Hydroxide Electrodes. J. Electrochem. Soc. 1999, 146, 2769–2779. [Google Scholar] [CrossRef]
- Baccouche, I.; Jemmali, S.; Manai, B.; Omar, N.; Amara, N. Improved OCV Model of a Li-Ion NMC Battery for Online SOC Estimation Using the Extended Kalman Filter. Energies 2017, 10, 764. [Google Scholar] [CrossRef]
- Zhang, C.; Jiang, J.; Zhang, L.; Liu, S.; Wang, L.; Loh, P. A Generalized SOC-OCV Model for Lithium-Ion Batteries and the SOC Estimation for LNMCO Battery. Energies 2016, 9, 900. [Google Scholar] [CrossRef]
- Zhang, R.; Xia, B.; Li, B.; Cao, L.; Lai, Y.; Zheng, W.; Wang, H.; Wang, W.; Wang, M. A Study on the Open Circuit Voltage and State of Charge Characterization of High Capacity Lithium-Ion Battery Under Different Temperature. Energies 2018, 11, 2408. [Google Scholar] [CrossRef]
- Weng, C.; Sun, J.; Peng, H. A Unified Open-Circuit-Voltage Model of Lithium-Ion Batteries for State-of-Charge Estimation and State-of-Health Monitoring. J. Power Sources 2014, 258, 228–237. [Google Scholar] [CrossRef]
- Wang, L.; Lu, D.; Liu, Q.; Liu, L.; Zhao, X. State of Charge Estimation for LiFePO4 Battery via Dual Extended Kalman Filter and Charging Voltage Curve. Electrochim. Acta 2019, 296, 1009–1017. [Google Scholar] [CrossRef]
- Klintberg, A.; Klintberg, E.; Fridholm, B.; Kuusisto, H.; Wik, T. Statistical Modeling of OCV-Curves for Aged Battery Cells. IFAC-PapersOnLine 2017, 50, 2164–2168. [Google Scholar] [CrossRef]
- Tong, S.; Klein, M.P.; Park, J.W. On-Line Optimization of Battery Open Circuit Voltage for Improved State-of-Charge and State-of-Health Estimation. J. Power Sources 2015, 293, 416–428. [Google Scholar] [CrossRef]
- Barcellona, S.; Codecasa, L.; Colnago, S.; Piegari, L. Cycle Aging Effect on the Open Circuit Voltage of Lithium-Ion Battery. In Proceedings of the International Conference on Electrical Systems for Aircraft, Railway, Ship Propulsion and Road Vehicles & International Transportation Electrification Conference (ESARS-ITEC), Venice, Italy, 29–31 March 2023; Volume 16, p. 4869. [Google Scholar]
- Barcellona, S.; Grillo, S.; Piegari, L. A Simple Battery Model for EV Range Prediction: Theory and Experimental Validation. In Proceedings of the 2016 International Conference on Electrical Systems for Aircraft, Railway, Ship Propulsion and Road Vehicles & International Transportation Electrification Conference (ESARS-ITEC), Toulouse, France, 2–4 November 2016; pp. 1–7. [Google Scholar]
- Barcellona, S.; Brenna, M.; Foiadelli, F.; Longo, M.; Piegari, L. Analysis of Ageing Effect on Li-Polymer Batteries. Sci. World J. 2015, 2015, 1–8. [Google Scholar] [CrossRef] [PubMed]
- Barcellona, S.; Piegari, L. Effect of Current on Cycle Aging of Lithium Ion Batteries. J. Energy Storage 2020, 29, 101310. [Google Scholar] [CrossRef]
- Zhu, Y.; Yan, F.; Kang, J.; Du, C.; Zhang, C.; Turkson, R.F. Fading Analysis of the Li(NiCoMn)O2 Battery under Different SOC Cycle Intervals. Ionics 2017, 23, 1383–1390. [Google Scholar] [CrossRef]
- Wikner, E.; Björklund, E.; Fridner, J.; Brandell, D.; Thiringer, T. How the Utilised SOC Window in Commercial Li-Ion Pouch Cells Influence Battery Ageing. J. Power Sources Adv. 2021, 8, 100054. [Google Scholar] [CrossRef]
- Ecker, M.; Nieto, N.; Käbitz, S.; Schmalstieg, J.; Blanke, H.; Warnecke, A.; Sauer, D.U. Calendar and Cycle Life Study of Li(NiMnCo)O2-Based 18650 Lithium-Ion Batteries. J. Power Sources 2014, 248, 839–851. [Google Scholar] [CrossRef]
- Zhu, J.; Knapp, M.; Sørensen, D.R.; Heere, M.; Darma, M.S.D.; Müller, M.; Mereacre, L.; Dai, H.; Senyshyn, A.; Wei, X.; et al. Investigation of Capacity Fade for 18650-Type Lithium-Ion Batteries Cycled in Different State of Charge (SoC) Ranges. J. Power Sources 2021, 489, 229422. [Google Scholar] [CrossRef]
- Wang, W.; Yuan, B.; Sun, Q.; Wennersten, R. Analysis and Modeling of Calendar Aging and Cycle Aging of LiCoO2/Graphite Cells. J. Therm. Sci. 2024, 33, 1109–1118. [Google Scholar] [CrossRef]
- Gantenbein, S.; Schönleber, M.; Weiss, M.; Ivers-Tiffée, E. Capacity Fade in Lithium-Ion Batteries and Cyclic Aging over Various State-of-Charge Ranges. Sustainability 2019, 11, 6697. [Google Scholar] [CrossRef]
Figure 1.
Zero-order Thevenin electric circuit model.

Figure 2.
Battery resistance estimation during battery discharge.

Figure 3.
Overview of the experimental setup.

Figure 4.
Flow chart of the experimental procedure.

Figure 5.
Experimental and modelled vocv(q) curves using nonlinear LS for the characterization subset of tests for each SOC cycling region.
Figure 5.
Experimental and modelled vocv(q) curves using nonlinear LS for the characterization subset of tests for each SOC cycling region.

Figure 6.
R2 calculated for the subset of tests used in model characterization for each SOC cycling region.
Figure 6.
R2 calculated for the subset of tests used in model characterization for each SOC cycling region.

Figure 7.
Trends of parameters of (4) as a function of Q using nonlinear LS for the characterization subset of tests for each SOC cycling region.
Figure 7.
Trends of parameters of (4) as a function of Q using nonlinear LS for the characterization subset of tests for each SOC cycling region.

Figure 8.
Experimental and modelled vocv(q) curves using linear LS with λ1 and λ2 fixed for the characterization subset of tests for each SOC cycling region.
Figure 8.
Experimental and modelled vocv(q) curves using linear LS with λ1 and λ2 fixed for the characterization subset of tests for each SOC cycling region.
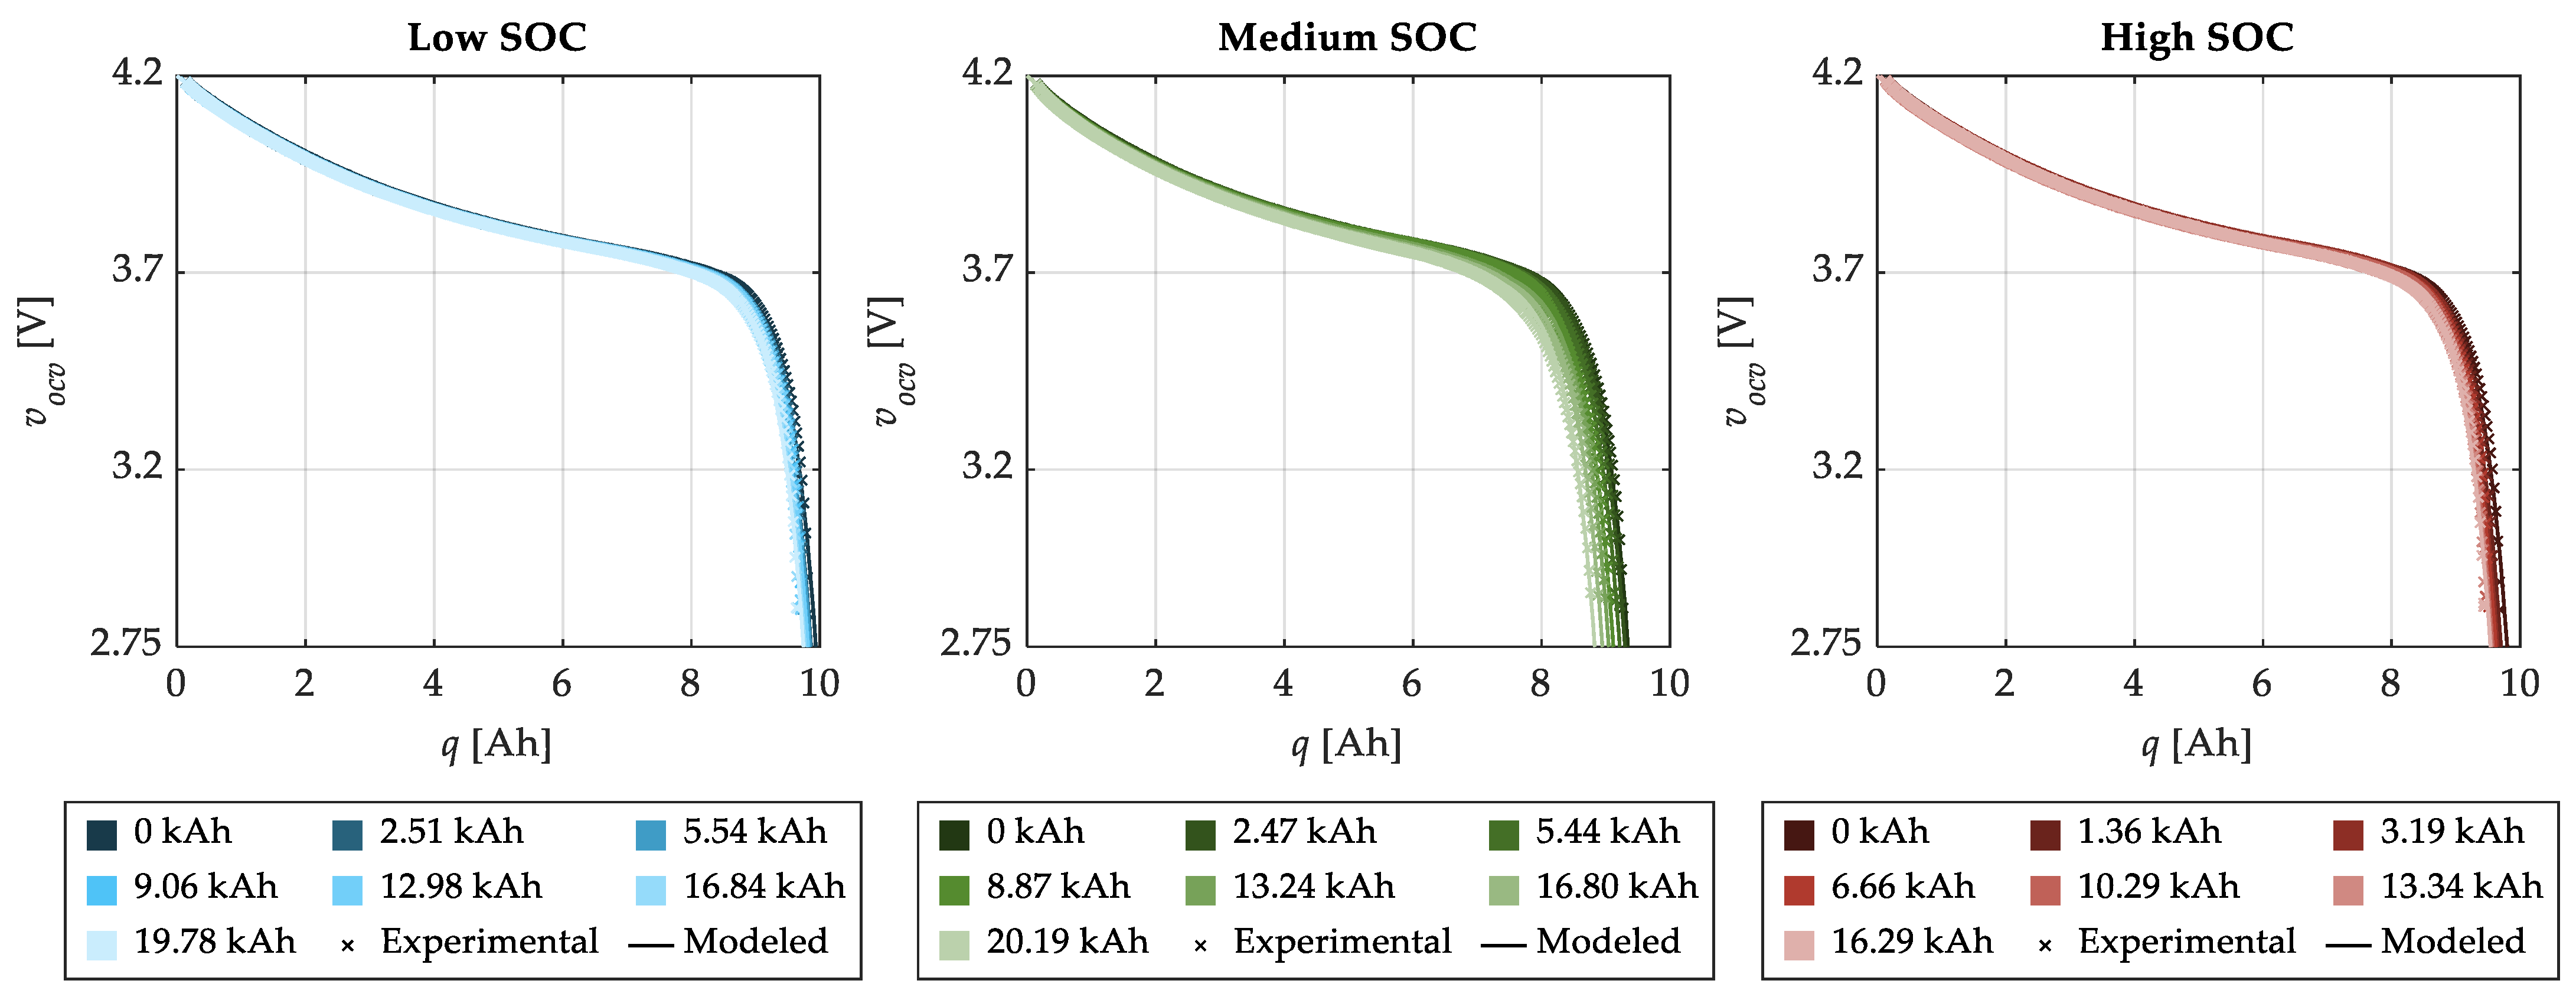
Figure 9.
R2 calculated with parameters λ1 and λ2 fixed for the subset of tests used in model characterization for each SOC cycling region.
Figure 9.
R2 calculated with parameters λ1 and λ2 fixed for the subset of tests used in model characterization for each SOC cycling region.

Figure 10.
Trend of parameters p1 and p2 as a function of Q obtained using linear LS with λ1 and λ2 fixed and their fitting functions for the characterization subset for each SOC cycling region.
Figure 10.
Trend of parameters p1 and p2 as a function of Q obtained using linear LS with λ1 and λ2 fixed and their fitting functions for the characterization subset for each SOC cycling region.

Figure 11.
Maximum and mean relative errors of the vocv(q) estimation.

Figure 12.
Maximum and mean absolute errors of the vocv(q) estimation.

Figure 13.
R2 calculated for all cycling levels and SOC cycling regions.

Figure 14.
Relative error of Ca estimation.

Figure 15.
Capacity fade (SOH) as a function of Q.


Table 1.
Values of parameters λ1 and λ2.
| SOC Level | Low SOC | Medium SOC | High SOC |
|---|---|---|---|
| λ1 [1/Ah] | −0.2413 | −0.2407 | −0.2464 |
| λ2 [1/Ah] | 2.451 | 2.454 | 2.457 |
Table 2.
Values of the coefficients of λ1 and λ2.
| SOC Region | Low SOC | Medium SOC | High SOC |
|---|---|---|---|
| [V/Ah] | 2.479 × 10⁻⁷ | 1.872 × 10⁻⁶ | 4.05 × 10⁻⁷ |
| [V] | 0.5485 | 0.5629 | 0.5446 |
| [V/Ah0.5] | −1.39 × 10⁻¹³ | −5.408 × 10⁻¹³ | −2.831 × 10⁻¹³ |
| [V/Ah2] | −3.537 × 10⁻²⁰ | −5.997 × 10⁻¹⁹ | −1.519 × 10⁻²⁰ |
| [V/Ah] | 9.251 × 10⁻¹⁶ | 3.569 × 10⁻¹⁵ | 6.185 × 10⁻¹⁶ |
| [V] | −2.514 × 10⁻¹¹ | −1.014 × 10⁻¹⁰ | −3.348 × 10⁻¹¹ |
Disclaimer/Publisher’s Note: The statements, opinions and data contained in all publications are solely those of the individual author(s) and contributor(s) and not of MDPI and/or the editor(s). MDPI and/or the editor(s) disclaim responsibility for any injury to people or property resulting from any ideas, methods, instructions or products referred to in the content. |
© 2024 by the authors. Licensee MDPI, Basel, Switzerland. This article is an open access article distributed under the terms and conditions of the Creative Commons Attribution (CC BY) license (https://creativecommons.org/licenses/by/4.0/).
Share and Cite
MDPI and ACS Style
Barcellona, S.; Codecasa, L.; Colnago, S.; Piegari, L. Open-Circuit Voltage Variation in LiCoO2 Battery Cycled in Different States of Charge Regions. Energies 2024, 17, 2364. https://doi.org/10.3390/en17102364
AMA Style
Barcellona S, Codecasa L, Colnago S, Piegari L. Open-Circuit Voltage Variation in LiCoO2 Battery Cycled in Different States of Charge Regions. Energies. 2024; 17(10):2364. https://doi.org/10.3390/en17102364
Chicago/Turabian StyleBarcellona, Simone, Lorenzo Codecasa, Silvia Colnago, and Luigi Piegari. 2024. "Open-Circuit Voltage Variation in LiCoO2 Battery Cycled in Different States of Charge Regions" Energies 17, no. 10: 2364. https://doi.org/10.3390/en17102364
Note that from the first issue of 2016, this journal uses article numbers instead of page numbers. See further details here.