
Carbon Mineralization Dynamics of Switchgrass (Panicum virgatum) Biochar in a Northern Florida Soil

Center for Water Resources, College of Agriculture and Food Sciences, Florida A&M University, Tallahassee, FL 32307, USA
*
Author to whom correspondence should be addressed.
Sustainability 2024, 16(10), 4060; https://doi.org/10.3390/su16104060
Submission received: 22 February 2024
/
Revised: 20 April 2024
/
Accepted: 7 May 2024
/
Published: 13 May 2024
(This article belongs to the Special Issue Fuels and Chemicals from Thermal Conversion of Renewable Carbon Sources)
Abstract
:Biochar has been considered one of the viable solutions for atmospheric carbon sequestration because of its resistance to mineralization in soils. However, our knowledge of the mineralization rates of biochar in soils is still inconclusive due to the drawbacks of either the study methods or insufficient characterization of the studied materials or both. The objectives of this study were (1) to characterize switchgrass (SG) biochar by multi-element scanning thermal analysis (MESTA), and (2) to determine the mineralization rates of the SG biochar carbon (BC) in soil by the 13C tracer method. The results indicated that the 400 °C and the 600 °C SG biochars were not significantly different in chemical composition or thermal stability. A MESTA thermogram of the SG feedstock can predict the yield and thermal stability of the resulting biochar. The 13C tracer determined the mineralization rates and deduced the corresponding mean residence times (MRTs) of the BC, SG-C, and native SOC to be 347 years, 4 years, and 65 years, respectively. The MRT of BC should be a minimal estimate because of the limited incubation period. Even so, the MRT was already two orders of magnitude greater than that of the SG feedstock indicating the carbon sequestration potential of the biochar in soil.
1. Introduction
Biochar is a pyrolysis product of biomass, such as plant residues or solid wastes, in which organic carbon is condensed into a porous “charcoal” form during heating under limited oxygen conditions. Biochar has been produced throughout human history, but only in the last few decades have we realized its potential to improve soil productivity, reduce soil nutrient loss and leaching pollution, and sequester atmospheric carbon [1]. Biochar is a heterogeneous material exhibiting a range of properties [2]. The source of feedstocks and pyrolysis conditions can influence the chemical and physical characteristics of the biochar [3,4]. For example, elemental contents in the original feedstock influenced the chemical composition of the resulting biochar [5], and the pyrolysis conditions influenced the biodegradability of the charred products [6]. Higher pyrolysis temperatures often result in increased nutrient content and a higher pH, but reduce the cation exchange capacity [7].
Biochar can have different effects in a soil environment depending on the soil type and climatic conditions. Applying biochar to soils has been shown to improve soil quality by increasing the pH of highly acidic soils [7,8], increasing water-holding capacity [9], and improving nutrient retention and cation exchange capacity [10,11]. Biochar-amended soils generally have positive impacts on plant growth, but the effects vary depending on the cropping system [4,12,13,14]. Soil structure, texture, and porosity were altered, and water movement and soil aeration were changed by biochar incorporation [2]. The highly porous structure of biochar appears to be beneficial to microbial populations and mycorrhizal fungi, providing unique habitat niches and enhancing the growth of soil biota [12,15].
Biochar, in general, is considered a highly recalcitrant form of carbon. Its persistence in soils largely depends on its chemical structure and environmental factors. The stability of biochar in soils, however, still has not been conclusively quantified. Most studies on the stability of biochar have used the incubation and modeling approach to estimate the mean residence time (MRT) [16,17,18,19,20]. The incubation and modeling approach could not clearly conclude the stability of biochar, most likely due to the relatively short incubation time (less than a few years) in comparison to the speculated MRT (hundreds or thousands of years) of biochar carbon (BC) [19,21]. Leng et al. [19] suggested that the uncertainty of biochar stability in soils may be best resolved by utilizing an isotopic tracer approach.
There is also much debate about the priming effect of biochar application on native soil organic carbon (SOC) degradation [22,23]. An increase in the decomposition rate of native SOC could potentially negate the carbon sequestration gained by incorporating biochar into soils. However, these incubation studies often have very conflicting conclusions due to the variation in biochar and soil properties, as well as the methods used to analyze soil respiration [22,23,24]. Therefore, more investigation into the biodegradation behavior of biochar in a soil system is warranted.
Biochar has been analyzed by elemental analysis, thermogravimetric analysis (TGA), differential scanning calorimetry (DSC), infrared spectroscopy [25], solid-state nuclear magnetic resonance spectroscopy [26,27,28,29], and multi-element scanning thermal analysis (MESTA) [25,26]. Since biochar may exhibit a range of properties, it is important to characterize biochar sufficiently in order to compare the results among various studies. The common indices that characterize the stability of biochar in soils have been the H/C and O/C ratios [19,30,31,32].
The objectives of this study were (1) to characterize the chemical and thermochemical properties of switchgrass (SG) biochar, its SG feedstock, and the native soil organic carbon (SOC) by MESTA, and (2) to investigate the mineralization rates of the biochar, the SG feedstock, and the native SOC in soil using the 13C tracer technique.
2. Materials and Methods
2.1. Biochar Production and Characterization
Switchgrass (Panicum virgatum) was harvested from the Florida Agricultural and Mechanical University Research and Extension Center (FAMU-REC, 30.6564° N, 84.6055° W, Quincy, FL, USA), air-dried, and then cut into 2–4 cm pieces. SG biochars were produced in small batches via slow pyrolysis in a Thermcraft muffle furnace (Winston-Salem, NC, USA) using a 2 cm diameter quartz tube fitted with airtight connectors and purged with nitrogen during either 400 °C or 600 °C pyrolysis processes. After pyrolysis, the quartz tube was cooled outside the furnace under continuous nitrogen gas flow.
The SG feedstock and its biochars were characterized by MESTA [33] to determine their C, N, and H thermograms and the total C, N, and H contents. MESTA was performed from 40 °C to 750 °C at a 50 °C/minute rate under 33% oxygen in helium carrier gas. The standard curves of C, N, and H were generated using cystine, arginine, and potassium hydrogen phthalate standards. All samples for MESTA were finely ground and mixed with pre-baked talc powder in a 1:5 ratio. Biochar pH was determined in a 1:20 deionized water ratio. Loss on ignition (LOI) and ash content were determined at 750 °C for 4 h. The oxygen content was deduced by the difference between the LOI and the sum of C, N, and H contents. The carbon isotopic signatures (δ13C) of the SG feedstock and its biochars were determined by an elemental analysis–mass spectrometry (EA–MS) at the FSU National High Magnetic Field Laboratory (Tallahassee, FL, USA).
2.2. Soil Characterization and the Biochar-Amended Soil Incubation
Orangeburg soil to a depth of 15 cm (Thermic Typic Kandiudult) [34] was collected from the FAMU-REC, air-dried, and then sieved through a 2 mm mesh. The soil was a loamy sand with a pH of 4.16 and an LOI of 5.36%. The soil organic matter was also characterized by MESTA, the same as the SG and its biochars.
The soil amendment incubation experiment was conducted in the laboratory at a relatively constant temperature (22 ± 2 °C) for one year. The treatments of the incubation experiment were 1% and 3% (w/w) 400° C biochar amendments, 4% SG feedstock amendment, and the control (un-amended soil). The biochar and SG feedstock were roughly ground (<2 mm) and mixed with 100 g of the air-dried soil in each treatment. The incubations were carried out in 250 mL round bottom distillation bottles (302 mL actual total volume) with three replicates (n = 3). Distilled water was added to obtain a soil moisture content of 15%. The incubation flasks were covered with perforated parafilm to prevent excess moisture loss. Water losses were compensated with distilled water periodically throughout the experiment.
2.3. CO2 Sample Collection and 13CO2 Analysis
CO2 respiration rates and their 13CO2 signatures were determined periodically (10 times) over the course of incubation. Each time, the respired CO2 samples were collected by the following procedure: The incubation flasks were first capped with rubber stoppers fitted with dual airtight gas connectors. The headspace of each flask was flushed with CO2-free air and then closed for incubation between 96 and 120 h, depending on the projected respiration rates. After the 96 to 120 h incubation, a 1 L Tedlar airbag fitted with an air-tight connector (Tedlar bag, Environmental Sampling Supply) was filled with 500 mL of CO2-free air using a large air-tight syringe. The Tedlar bag was then attached to one of the gas connectors of the incubation bottle. A 140 mL syringe was attached to the other connector of the incubation bottle. The CO2-free air in the Tedlar bag and the headspace air of the incubation bottle were homogenized by gently pumping the syringe back and forth. The Tedlar bag was then detached from the incubation bottle and the collected air was analyzed for CO2 concentration and 13C/12C isotopic ratio using a Finnigan Mat Delta V isotope ratio mass spectrometer coupled to a gas chromatograph [35]. The analytical uncertainty based on repeated measurements of a standard was <0.15‰ for δ13C-CO2 and <5% for CO2 concentrations [36]. Delta 13C values were calibrated relative to a reference CO2 gas and based on the Vienna Pee Dee Belemnite (VPDB) standard [36].
The total respiration rate (RRtotal, μg CO2 C/g soil/day) was calculated using the total volume of the Tedlar bag (500 mL) and the headspace of the incubation bottle (247 mL), the measured CO2 concentration and the weight of the soil. Since the 13C signatures of the SG (a C4 plant) biochar and the native SOC (mainly derived from C3 plants) were distinguishable, the respiration rates of the native SOC in the biochar-amended soils could be obtained using a simple two-end member linear mixing model:
where 13CO2 Soil is the δ13C signature of the control soil and δ13CO2 BC is the δ13C signature of the biochar carbon (BC). The mineralization rate of BC was calculated as:
RRSOC = RRtotal × (δ13CO2 Sample − δ13CO2 BC)/(δ13CO2 SOC − δ13CO2 BC)
RRBC = RRtotal − RRSOC
The total amount of carbon mineralized during the incubations was obtained by integrating the respiration rate curve over the incubation time. The MRT (years) of the SOC, BC-C, and SG-C were estimated by the reciprocal of mean annual mineralization rates (MR, μg CO2 C/g C/year).
MRT (years) = 1/MR (μg CO2 C/g C/year)
2.4. Experimental Design and Statistics
The soil incubation experiment was a factorial block design with time and soil treatment as the two factors. A general linear model (GLM) using a repeated measures analysis of variance (ANOVA) procedure and Tukey’s multiple comparisons test was used to compare the mean respiration rate among treatments [37]. A two-sample t-test was used to compare the mean carbon mineralized from the biochar treatments and paired t-tests [38] to compare the mean carbon mineralized during and after the priming period.
3. Results
3.1. Characterization of SG Feedstock and Its Biochars by MESTA
The conversion of SG to the 400 °C biochar and the 600 °C biochar lost on average 76% and 77.3% in mass, respectively. In the 400 °C process, 72.2% of the C, 75% of the N, 94.2% of the H, and 84% of the O were lost from the SG feedstock. In the 600 °C biochar process, 72.4% of the C, 77.8% of the N, 95.4% of the H, and 88% of the O were lost from the SG feedstock. The pH of the 400 °C biochar was 10.3, and that of the 600 °C biochar was 10.5. The chemical compositions of the two biochars were not significantly different (p > 0.01, Table 1). Both the 400 °C and 600 °C biochars had the δ13C signature of −14.47 ± 0.15‰, which is slightly heavier than that of the SG feedstock (−14.95 ± 0.16‰). The native SOC had the δ13C signature of −26.78 ± 0.18‰, a mainly C3 plant source.
The MESTA carbon thermograms of the SG feedstock and its 400 °C and 600 °C biochars are presented in Figure 1. The SG feedstock thermogram had two peaks, one at 325 °C, and the other at 470 °C. The thermograms of the 400 °C biochar and the 600 °C biochar had only one peak at 470 °C. The thermograms of the two biochars were almost identical. A previous study indicated that the thermally stable carbon beyond 420 °C in MESTA can be considered “black carbon” [39]. The 470 °C thermogram peak in the SG feedstock represents the “charred” portion of the carbon during the MESTA process. It is interesting to notice that this “charred” carbon of the SG feedstock during the MESTA coincided with those of the 400 °C or 600 °C biochars both in quantity and thermal stability (Figure 1). Those results suggest that the so-called “volatile carbon” and “fixed carbon” in the biochar production process [27,40] could be predicted by the low thermally stable and high thermally stable portions, respectively, of the SG feedstock thermogram.
A comparison of the carbon thermograms between the control (un-amended soil) and those of the amended treatments (Figure 2) indicated that they were quantitatively additive. For example, both the thermochemical properties and quantity of biochar in the amended soil can be deduced by subtracting the carbon thermogram of the control soil from that of the amended soil after they are scaled to an equal dried soil weight basis. This quantitatively additive nature of the carbon thermograms between the biochar and the native SOC was consistently observed throughout the incubation experiment indicating that the BC did not interact with the native SOC chemically or microbiologically. Figure 2 also shows that the mineralizable carbon in the amended soils mainly occurred in the low thermally stable carbon of the MESTA thermogram.
3.2. Carbon Mineralization Rates of the 400 °C Biochar in Soil
The mineralization rates of the native SOC, the 400 °C BC (both in the 1% and 3% biochar-amended soils), and the SG-C are presented in Figure 3. The biochar amendments did not significantly affect the mineralization rates of the native SOC (Figure 3, top). The mineralization rates of the BC, on a per gram of BC basis, between the 1% and 3% biochar-amended soils were not significantly different except during the “priming period” (Figure 3, bottom).
During the priming period, the mineralization rates of the BC, on a per gram of BC basis, in the 1% biochar-amended soil were significantly higher than those in the 3% biochar-amended soil. The priming period of the BC occurred mainly in the first 83 days of incubation. After the priming period, the BC mineralization rates declined very gradually and apparently stabilized after 225 days of incubation. The mean mineralization rates of the BC, native SOC, and the SG-C during the 225–351-day period are listed in Table 2. The mineralization rates of the BC in the 1% and 3% biochar-amended soils were much lower than those of the SOC or SG-C during the same period of time. Based on these mineralization rates and using the one-pool model, the corresponding estimated MRT of the carbon during the 225–365-days incubation period were 435 ± 184 years, 288 ± 96 years, 64 ± 10 years, and 4 ± 1 years, respectively, for the BC in the 1% biochar-amended soil, the BC in the 3% biochar-amended soil, the native SOC, and the SG-C in the 4% SG-amended soil. Due to the extremely low mineralization rates of the BC after 225 days of incubation, only 4 out of 12 in the 1% amended soil and 10 out of 12 in the 3% amended soil could be determined. Since the mineralization rates of the BC in the two biochar ratios were not significantly different (p > 0.01) on a per g of BC basis, the weighted mean of the combined mineralization rates was 7.9 ± 2.7 µg C/g BC/d (n = 14), and the corresponding MRT was 347 ± 131 years for the BC in the soil. This should be considered a minimal estimate of the MRT for the remaining BC in the soil because the mineralization rate would be expected to continually decline, and the corresponding MRT continually increase, if the incubation were prolonged beyond one year. The MRT of the BC in the soil, therefore, was at least two orders of magnitude greater than that of the raw SG-C in the soil.
The 1% and 3% biochar-amended soils lost on average 15.8 mg/g BC during the 351 days of incubation, in which 14.7 mg/g BC was lost during the first 225 days of incubation. The BC, therefore, consisted of 1.47% of the labile carbon, and the rest of the BC (98.53%) can be considered recalcitrant. In comparison, the native SOC lost 19.1 mg/g SOC, and the SG-C lost 284.4 mg/g SG-C after 351 days of incubation. A total of 98.1% of the native SOC and 71.6% of the SG-C remained in the soil after 351 days of incubation. The remaining native SOC and SG-C cannot be considered recalcitrant because of the much shorter MRTs (65 years and 4 years, respectively).
4. Discussion
In a review of biochars made from various feedstocks, Spokas [21] noticed that the reported yield of biochar declined rapidly when the pyrolysis temperature increased from 150 °C to 400 °C. But when the pyrolysis temperature increased from 400 °C to 600 °C, the reported yield of biochar decreased insignificantly. This study confirms that not only the yields but also the chemical and thermal stability properties of the SG biochar stayed similar after the 400 °C and the 600 °C pyrolysis. Producing a 400 °C biochar, however, is much more economical than producing a 600 °C biochar.
This study showed that analyzing biochar by MESTA provides not only quantitative C, N, and H information, but also the thermochemical information that predicted the yield and the thermal stability of the biochar (Figure 1). If further studies prove this to be true in general, then MESTA would be a powerful analytical tool for biochar research. Combined with the LOI information, MESTA can also determine the O content of biochar by mass balance because C, N, H, and O comprise 99% of the ash-free biochar. The ratios of H/C and O/C have often been used as the thermal stability indices of biochar [40,41,42]. The H/C and O/C ratios of the 400 °C and the 600 °C biochars (Table 1) were not significantly different and their values were within the highly condensed charcoal region of the van Krevelen plot [31,32].
This study also showed that the MESTA thermograms of the BC and the native SOC were quantitatively additive. The quantity and quality of the BC in amended soil, therefore, could be deduced from the MESTA thermograms of biochar-amended and un-amended control soil. MESTA proved to be a convenient tool to assess the changes of BC in amended soil during various stages of an incubation experiment.
The 13C tracer showed that biochar did not affect the mineralization of the native SOC during the incubation periods. This result does not align with some previous studies that reported that biochar had an impact on the mineralization of the native SOC [19,43,44,45]. The partition of mineralization rates between the BC and native SOC in this study showed that although the biochar-amended soil elevated mineralization rates during the priming period (Figure 3), the elevated mineralization was solely accounted for by the BC alone. The biochar did not affect the mineralization of the native SOC (Figure 3, top).
The priming effect of the BC indicated that there was a labile portion of the BC that had much greater mineralization rates than the rest of the BC. This labile portion of the BC accounted for less than 1.5% of the total BC. More than 98.5% of the BC was relatively recalcitrant in the soil with an estimated MRT of at least 347 ± 131 years. The large uncertainty (CV = 36%) of the estimates was due to the extremely low mineralization rates of the BC towards the end of the incubation experiment, which almost reached the detection limit of the 13C tracer technique. A strategy to increase the accuracy of detecting the BC mineralization rate by the 13C tracer technique would be to increase the sample size of the incubation experiment.
The MRT of the BC determined in this study was at least 347 years, which is already two orders of magnitude greater than that of the raw SG feedstock (4 years). According to the SOC formation theory [46], BC accumulation in soils can be calculated by the annual application rate A (tons BC/ha/year) and the MRT following Equation (4), where t is the time lapsed in years since the annual BC application:
BC accumulation (tons C/ha) = A × MRT × (1 − exp−t/MRT)
The relationship between BC accumulation and the time lapsed t is non-linear. However, with the MRT at 347 years, the BC accumulation in the first 100 years can be approximated by a linear equation (r2 = 0.999). If the BC application rate is 6.82 tons C/ha (or 10 tons biochar/ha/year), the linear approximation equation would be:
BC accumulation (tons/ha) = 6.0 × t (years)
That is, if the annual application rate (A) is 6.82 tons BC/ha/year (or 10 tons biochar/ha/year), then after 20 years of continuous application, the BC accumulation in the soil would be 120 tons/ha (or 60 mg BC/g soil in the surface 15 cm), more than 200–300% of the original native SOC. The global SOC pool is about twice that of the atmospheric C pool. The two pools are in a mutually connected cycle. A 10% increase in the global SOC pool would result in a 20% decrease in the atmospheric C pool. This suggests that if 5% of the global soils could be continuously applied with a biochar that has a similar MRT and with a similar rate (6.82 tons BC/ha/year), then after 20 years, the global SOC pool would be increased by 10% to 15%, which implies that the atmospheric carbon pool would be decreased by 20% to 30%.
5. Conclusions
This study showed that the 400 °C and the 600 °C SG biochars had similar chemical and thermal stability properties. Analyzing biochar by MESTA has at least two advantages: (1) it can determine the chemical and thermal stability properties of biochar in one analytical procedure, and (2) the MESTA thermogram of the SG feedstock can predict the yield and thermochemical properties of the biochar.
We showed that although the BC had a very significant priming effect, it did not significantly affect the native SOC mineralization throughout the 351-day incubation. The priming effect of the BC indicated that it had a labile portion consisting of less than 1.5% of the total BC. The MRT of the rest of the BC in the soil was determined to be at least 347 years, two orders of magnitude greater than that of the SG feedstock in the soil. This implies that large-scale application of biochar to soil has a very significant potential to sequester CO2 from the atmosphere. We demonstrated that the 13C tracer technique is a powerful tool for studying the dynamics of BC mineralization in soils.
Author Contributions
Conceptualization, Y.-P.H.; methodology, Y.-P.H.; validation, Y.-P.H. and K.H., formal analysis, K.H.; investigation, K.H.; resources, Y.-P.H.; data curation, K.H.; writing—original draft preparation, Y.-P.H.; writing—review and editing, K.H.; funding acquisition, Y.-P.H. All authors have read and agreed to the published version of the manuscript.
Funding
This study was partially supported by the NIFA/USDA Evans-Allen Program #003083 to the College of Agriculture and Food Sciences, Florida A&M University.
Institutional Review Board Statement
Not applicable.
Informed Consent Statement
Not applicable.
Data Availability Statement
Data are contained within the article.
Acknowledgments
We thank the assistance of Glynnis Bugna and Djanan Nemours in the experimental work of this study.
Conflicts of Interest
The authors declare no conflicts of interest.
References
- Laird, D. The Charcoal Vision: A Win–Win–Win scenario for simultaneously producing bioenergy, permanently sequestering carbon, while improving soil and water quality. Agron. J. 2008, 100, 178–181. [Google Scholar] [CrossRef]
- Atkinson, C.J.; Fitzgerald, J.D.; Hipps, N.A. Potential mechanisms for achieving agricultural benefits from biochar application to temperate soils: A review. Plant Soil 2010, 337, 1–18. [Google Scholar] [CrossRef]
- Amonette, J.E.; Joseph, S. Characteristics of biochar: Microchemical properties. In Biochar for Environmental Management: Science and Technology; Lehmann, J., Joseph, S., Eds.; Routledge Taylor & Francis Group: New York, NY, USA, 2012; pp. 65–84. [Google Scholar]
- Rajkovich, S.; Enders, A.; Hanley, K.; Hyland, C.; Zimmerman, A.R.; Lehmann, J. Corn growth and nitrogen nutrition after additions of biochars with varying properties to a temperate soil. Biol. Fertil. Soils 2011, 48, 271–284. [Google Scholar] [CrossRef]
- Gaskin, J.W.; Steiner, C.; Harris, K.; Das, K.C.; Bibens, B. Effects of low-temperature pyrolysis conditions on biochar for agricultural use. Am. Soc. Agric. Biol. Eng. 2008, 51, 2061–2069. [Google Scholar]
- Hilscher, A.; Heister, K.; Siewert, C.; Knicker, H. Mineralization and structural changes during the initial phase of microbial degradation of pyrogenic plant residues in soil. Org. Geochem. 2009, 40, 332–342. [Google Scholar] [CrossRef]
- Novak, J.M.; Lima, I.; Xing, B.; Gaskin, J.W.; Steiner, C.; Sas, K.C.; Ahmedna, M.; Rehrah, D.; Watts, D.W.; Busscher, W.J.; et al. Characterization of designer biochar produced at different temperatures and their effects on a loamy sand. Ann. Environ. Sci. 2009, 3, 195–206. [Google Scholar]
- Novak, J.M.; Busscher, W.J.; Laird, D.L.; Ahmedna, M.; Watts, D.W.; Niandou, M.A. Impact of biochar amendment of fertility of a southeastern coastal plain soil. Soil Sci. 2009, 174, 105–112. [Google Scholar] [CrossRef]
- Karhu, K.; Mattila, T.; Bergström, I.; Regina, K. Biochar addition to agricultural soil increased CH4 uptake and water holding capacity—Results from a short-term pilot field study. Agric. Ecosyst. Environ. 2011, 140, 309–313. [Google Scholar] [CrossRef]
- Cheng, C.; Lehmann, J.; Thies, J.E.; Burton, S.D.; Engelhard, M.H. Oxidation of black carbon by biotic and abiotic processes. Org. Geochem. 2006, 37, 1477–1488. [Google Scholar] [CrossRef]
- Yuan, J.H.; Xu, R.K. The amelioration effects of low temperature biochar generated from nine crop residues on an acidic Ultisol. Soil Use Manag. 2011, 27, 110–115. [Google Scholar] [CrossRef]
- Jones, D.L.; Rousk, J.; Edwards-Jones, G.; DeLuca, T.H.; Murphy, D.V. Biochar-mediated changes in soil quality and plant growth in a three year field trial. Soil Biol. Biochem. 2012, 45, 113–124. [Google Scholar] [CrossRef]
- Gaskin, J.W.; Speir, R.A.; Harris, K.; Das, K.C.; Lee, R.D.; Morris, A.; Fisher, D.S. Effects of peanut hull and pine chip biochar on soil nutrients, corn nutrient status, and yield. Agron. J. 2010, 102, 623–633. [Google Scholar] [CrossRef]
- Van Zwieten, L.; Kimber, S.; Morris, S.; Chan, K.Y.; Downie, A.; Rust, J.; Joseph, S.; Cowie, A. Effects of biochar from slow pyrolysis of papermill waste on agronomic performance and soil fertility. Plant Soil 2010, 327, 235–246. [Google Scholar] [CrossRef]
- Thies, J.E.; Rillig, M.C. Characteristics of biochar: Biological properties. In Biochar for Environmental Management: Science and Technology; Lehmann, J., Joseph, S., Eds.; Routledge Taylor & Francis Group: New York, NY, USA, 2012; pp. 117–138. [Google Scholar]
- Singh, B.P.; Fang, Y.; Boersma, M.; Collins, D.; Van Zwieten, L.; Macdonald, L.M. In situ persistence and migration of biochar carbon and its impact on native carbon emission in contrasting soils under managed temperate pastures. PLoS ONE 2015, 10, e0141560. [Google Scholar] [CrossRef] [PubMed]
- Wang, J.; Xiong, Z.; Kuzyakov, Y. Biochar stability in soil: Meta-analysis of decomposition and priming effects. GCB Bioenergy 2016, 8, 512–523. [Google Scholar] [CrossRef]
- Rasse, D.P.; Budai, A.; O’Toole, A.; Ma, X.; Rumpel, C.; Abiven, S. Persistence in soil of Miscanthus biochar in laboratory and field conditions. PLoS ONE 2017, 12, e0184383. [Google Scholar] [CrossRef] [PubMed]
- Leng, L.; Xu, X.; Wei, L.; Fan, L.; Huang, H.; Li, J.; Lu, Q.; Li, J.; Zhou, W. Biochar stability assessment by incubation and modelling: Methods, drawbacks and recommendations. Sci. Total Environ. 2019, 664, 11–23. [Google Scholar] [CrossRef] [PubMed]
- Jindo, K.; Sonoki, T. Comparative assessment of biochar stability using multiple indicators. Agronomy 2019, 9, 254. [Google Scholar] [CrossRef]
- Spokas, K.A. Review of the stability of biochar in soils: Predictability of O:C molar ratios. Carbon Manag. 2010, 1, 289–303. [Google Scholar] [CrossRef]
- Luo, Y.; Durenkamp, M.; De Nobili, M.; Lin, Q.; Brookes, P.C. Short-term soil priming effects and the mineralization of biochar following its incorporation to soils of different pH. Soil Biol. Biochem. 2011, 43, 2304–2314. [Google Scholar] [CrossRef]
- Zimmerman, A.R.; Gao, B.; Ahn, M.Y. Positive and negative carbon mineralization priming effects among a variety of biochar-amended soils. Soil Biol. Biochem. 2011, 43, 1169–1179. [Google Scholar] [CrossRef]
- Cross, A.; Sohi, S.P. The priming potential of biochar products in relation to labile carbon contents and soil organic matter status. Soil Biol. Biochem. 2011, 43, 2127–2134. [Google Scholar] [CrossRef]
- Li, S.; Chen, G. Thermogravimetric, thermochemical, and infrared spectral characterization of feedstocks and biochar derived at different pyrolysis temperatures. Waste Manag. 2018, 78, 198–207. [Google Scholar] [CrossRef] [PubMed]
- Ngatia, L.W.; Hsieh, Y.P.; Nemours, D.; Fu, R.; Taylor, R.W. Potential phosphorus eutrophication mitigation strategy: Biochar carbon composition, thermal stability, and pH influence phosphorus sorption. Chemosphere 2017, 180, 201–211. [Google Scholar] [CrossRef] [PubMed]
- Ahmed, A.; Bakar, M.S.A.; Hamdani, R.; Park, Y.-K.; Lam, S.S.; Sukri, R.S.; Hussain, M.; Majeed, K.; Phusunti, N.; Jamil, F. Valorization of underutilized waste biomass from invasive species to produce biochar for energy and other value-added applications. Environ. Res. 2020, 186, 109596. [Google Scholar] [CrossRef] [PubMed]
- Wang, R.; Duan, X.; Wang, S.; Ren, N.-Q.; Ho, S.-H. Production, properties, and catalytic applications of sludge derived biochar for environmental remediation. Water Res. 2020, 187, 116390. [Google Scholar]
- Dai, Z.; Xiong, X.; Zhu, H.; Xu, H.; Leng, P.; Li, J.; Tang, C.; Xu, J. Association of biochar properties with changes in soil bacterial, fungal and fauna communities and nutrient cycling processes. Biochar 2021, 3, 239–254. [Google Scholar] [CrossRef]
- Han, L.; Ro, K.S.; Wang, Y.; Sun, K.; Sun, H.; Libra, J.A.; Xing, B. Oxidation resistance of biochars as a function of feedstock and pyrolysis condition. Sci. Total Environ. 2018, 616, 335–344. [Google Scholar] [CrossRef]
- Xu, Z.; He, M.; Xu, X.; Cao, X.; Tsang, D.C. Impacts of different activation processes on the carbon stability of biochar for oxidation resistance. Bioresour. Technol. 2021, 338, 125555. [Google Scholar] [CrossRef]
- Li, S.; Tasnady, D. Biochar for soil carbon sequestration: Current knowledge, mechanisms, and future perspectives. C 2023, 9, 67. [Google Scholar] [CrossRef]
- Hsieh, Y.P. A novel multi-elemental scanning thermal analysis (MESTA) for the identification and characterization of solid substances. J. AOAC Int. 2007, 90, 54–59. [Google Scholar] [PubMed]
- Natural Resources Conservation Service (NRCS). Soil Survey of Gadsden County; Natural Resources Conservation Service (NRCS): Washington, DC, USA, 2009. Available online: http://soils.usda.gov/survey/printed_surveys/ (accessed on 1 October 2009).
- Merritt, D.A.; Hayes, J.M.; Des Marais, D.J. Carbon isotopic analysis of atmospheric methane by isotope-ratio-monitoring gas-chromatography mass-spectrometry. J. Geophys. Res. 1995, 100, 1317–1326. [Google Scholar] [CrossRef] [PubMed]
- Holmes, M.E.; Chanton, J.P.; Tfaily, M.M.; Ogram, A. CO2 and CH4 isotope compositions and production pathways in a tropical peatland. Glob. Biogeochem. Cycles 2015, 29, 1–18. [Google Scholar] [CrossRef]
- Minitab 16 Statistical Software; Minitab, Inc.: State College, PA, USA, 2010. Available online: www.minitab.com (accessed on 15 May 2010).
- Microsoft Office Software—Excel; Microsoft: Redmond, WA, USA, 2010.
- Hsieh, Y.P.; Bugna, G.C. Analysis of black carbon in sediments and soils using multi-element scanning thermal analysis (MESTA). Org. Geochem. 2008, 39, 1562–1571. [Google Scholar] [CrossRef]
- Al-Wabel, M.I.; Al-Omran, A.; El-Naggar, A.H.; Nadeem, M.; Usman, A.R.A. Pyrolysis temperature induced changes in characteristics and chemical composition of biochar produced from conocarpus wastes. Bioresour. Technol. 2013, 131, 374–379. [Google Scholar] [CrossRef]
- Takaya, C.A.; Fletcher, L.A.; Singh, S.; Anyikude, K.U.; Ross, A.B. Phosphate and ammonium sorption capacity of biochar and hydrochar from different wastes. Chemosphere 2016, 145, 518–527. [Google Scholar] [CrossRef] [PubMed]
- Almutairi, A.A.; Ahmad, M.; Rafique, M.I.; Al-Wabel, M.I. Variations in composition and stability of biochars derived from different feedstock types at varying pyrolysis temperature. J. Saudi Soc. Agric. Sci. 2023, 22, 25–34. [Google Scholar] [CrossRef]
- Palansooriya, K.N.; Wong, J.T.F.; Hashimoto, Y.; Huang, L.; Rinklebe, J.; Chang, S.X.; Bolan, N.; Wang, H.; Ok, Y.S. Response of microbial communities to biochar-amended soils: A critical review. Biochar 2019, 1, 3–22. [Google Scholar] [CrossRef]
- Lorenz, K.; Lal, R. Biochar application to soil for climate change mitigation by soil organic carbon sequestration. J. Plant Nutr. Soil Sci. 2014, 177, 651–670. [Google Scholar] [CrossRef]
- Jatav, H.S.; Rajput, V.D.; Minkina, T.; Singh, S.K.; Chejara, S.; Gorovtsov, A.; Barakhov, A.; Bauer, T.; Sushkova, S.; Mandzhieva, S. Sustainable approach and safe use of biochar and its possible consequences. Sustainability 2021, 13, 10362. [Google Scholar] [CrossRef]
- Hsieh, Y.P. Dynamics of soil organic matter formation in croplands—Conceptual analysis. Sci. Total Environ. 1989, 81/82, 381–390. [Google Scholar] [CrossRef]
Figure 1.
The MESTA carbon thermograms of the switchgrass feedstock, the 400 °C, and the 600 °C biochars. The thermograms were normalized to the biochar/switchgrass yield ratio (w/w) for comparison.
Figure 1.
The MESTA carbon thermograms of the switchgrass feedstock, the 400 °C, and the 600 °C biochars. The thermograms were normalized to the biochar/switchgrass yield ratio (w/w) for comparison.
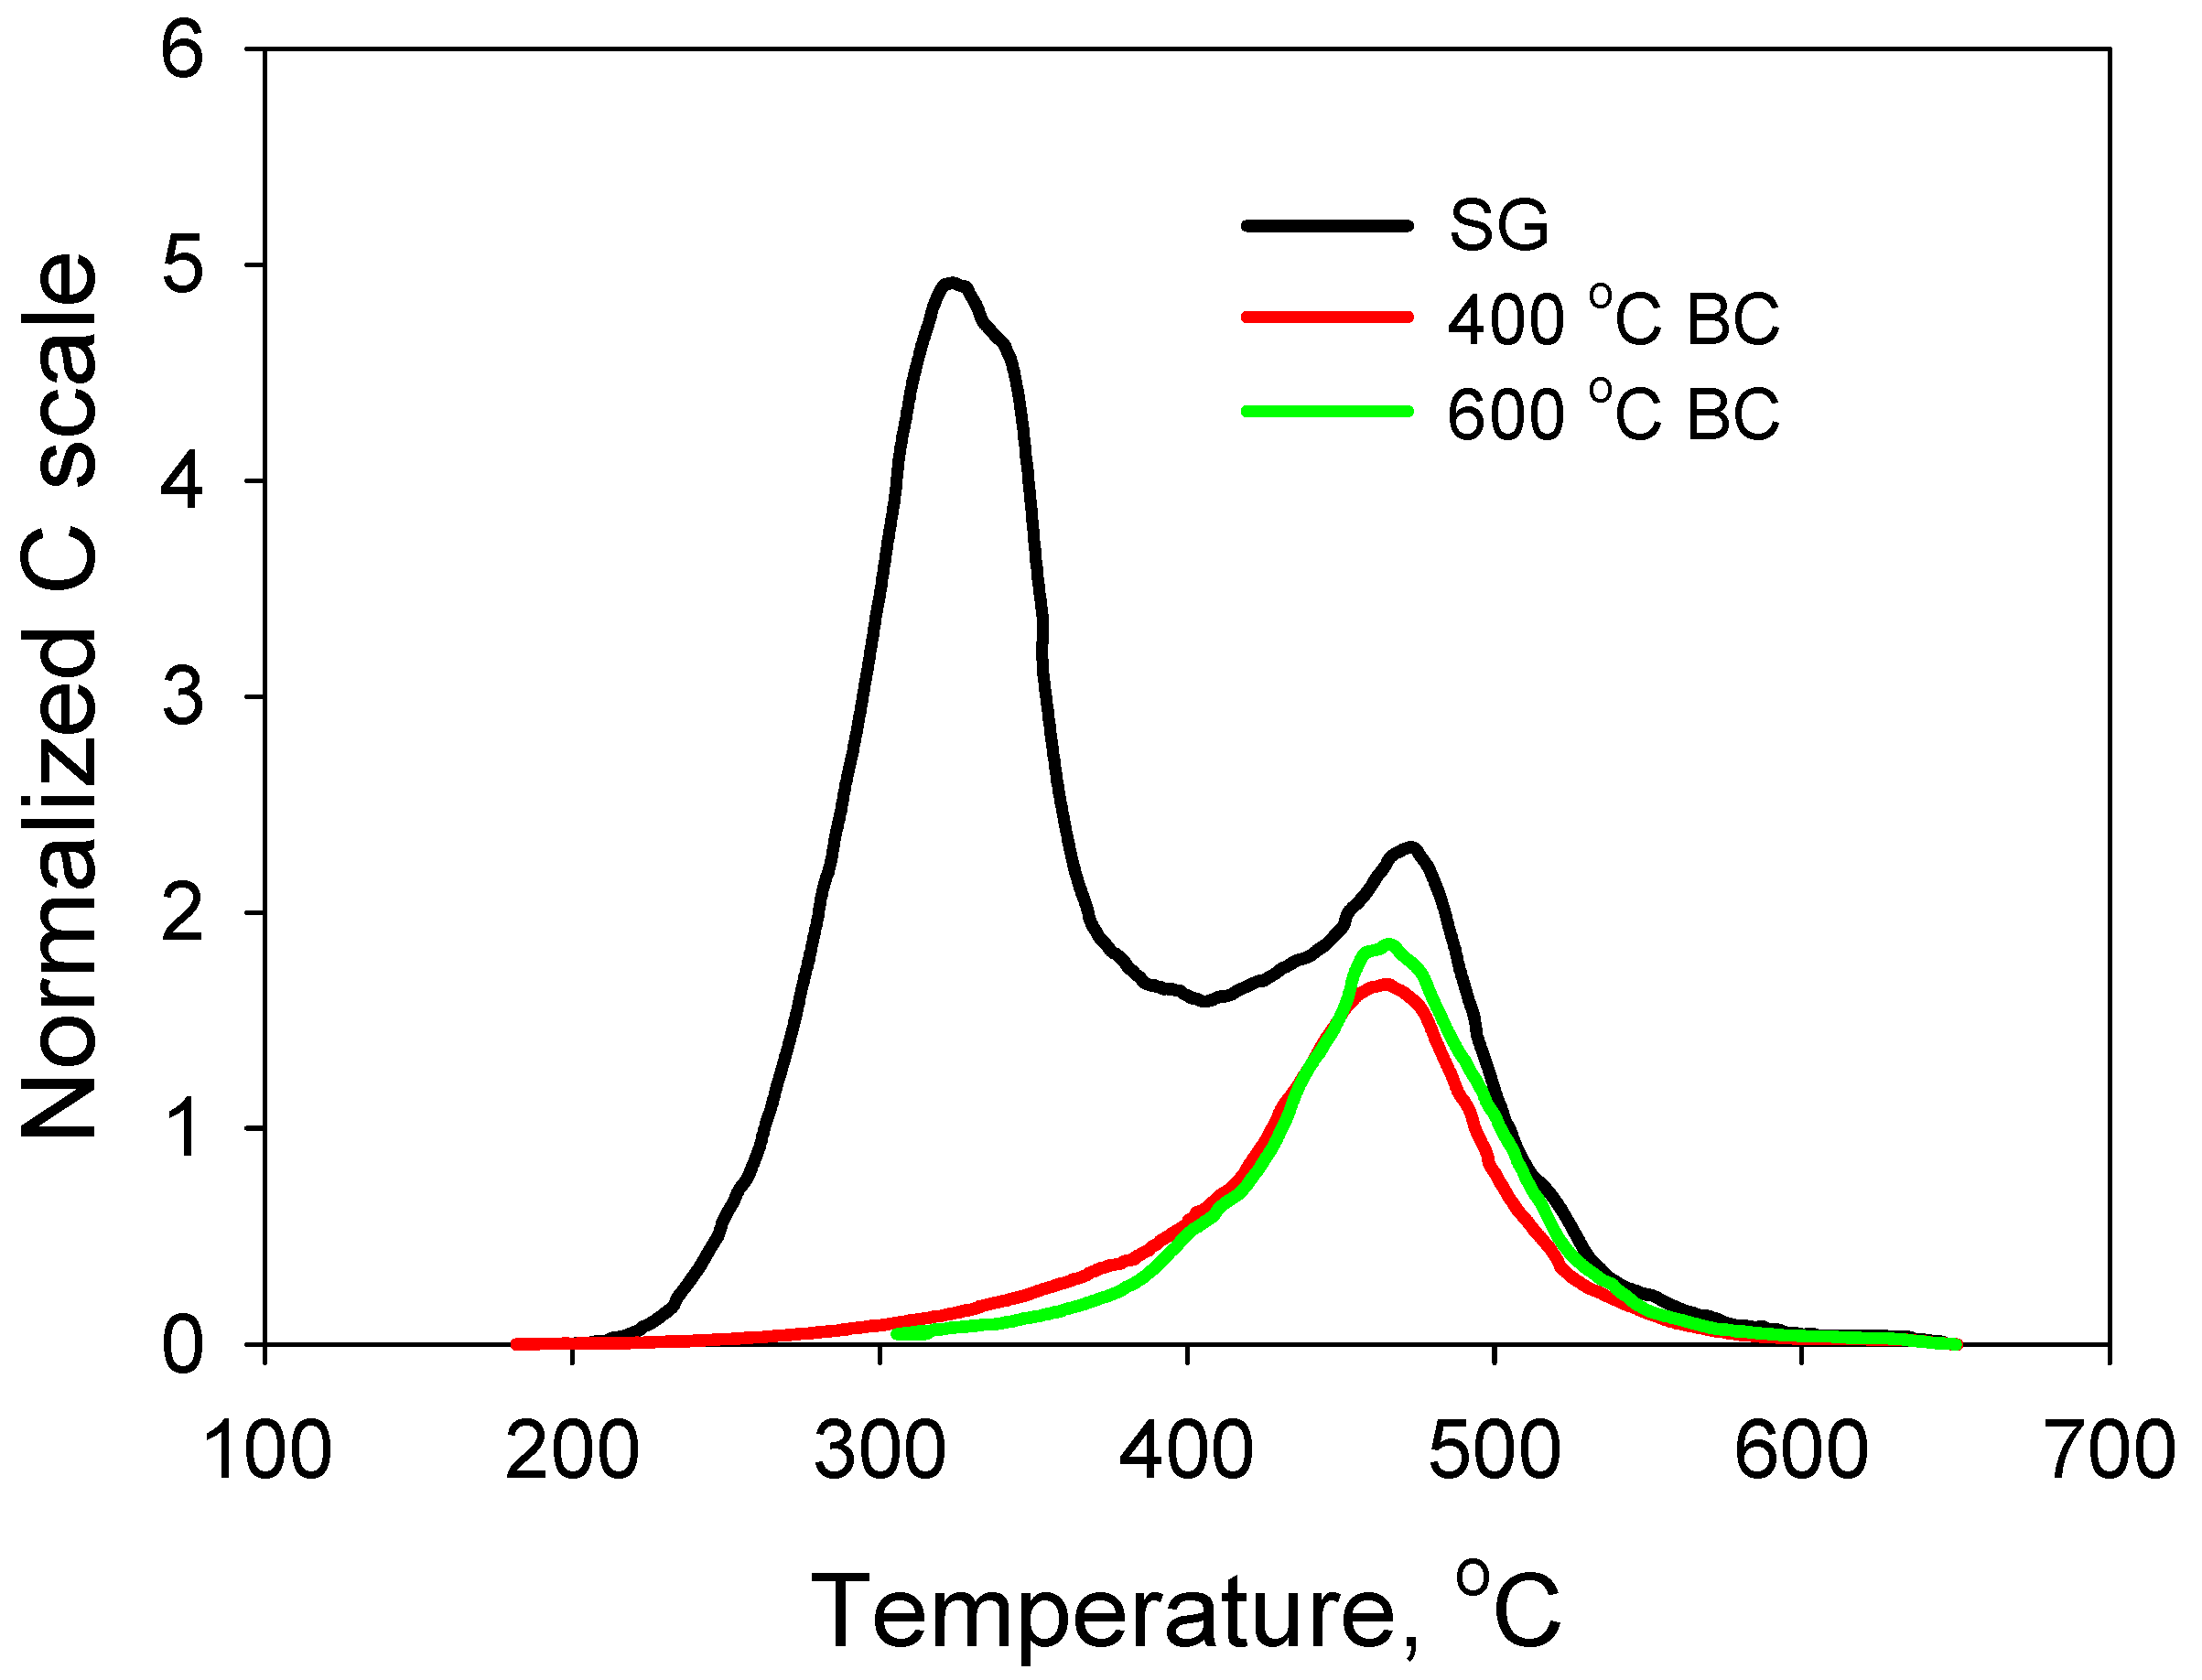
Figure 2.
The carbon thermograms of the amended soils and the control in the incubation experiment: start of the incubation (left) and after one year of incubation (right). The thermograms were normalized to an equal dried soil weight basis.
Figure 2.
The carbon thermograms of the amended soils and the control in the incubation experiment: start of the incubation (left) and after one year of incubation (right). The thermograms were normalized to an equal dried soil weight basis.

Figure 3.
The mineralization rates of the native SOC (top) and the BC (bottom) in the incubation experiment.
Figure 3.
The mineralization rates of the native SOC (top) and the BC (bottom) in the incubation experiment.


Table 1.
Chemical composition of the switchgrass feedstock and its biochars on a dry weight basis (n = 3).
Table 1.
Chemical composition of the switchgrass feedstock and its biochars on a dry weight basis (n = 3).
| C, % | N, % | H, % | LOI, % | O, % | H/C | O/C | |
|---|---|---|---|---|---|---|---|
| SG | 58.8 ± 0.9 | 0.94 ± 0.10 | 6.52 ± 1.15 | 93.5 ± 0.1 | 27.7 ± 1.2 | 1.27 | 0.35 |
| 400 °C char | 68.2 ± 0.7 | 0.98 ± 0.01 | 1.50 ± 0.14 | 78.7 ± 0.2 | 8.2 ± 0.8 | 0.26 | 0.08 |
| 600 °C char | 70.3 ± 0.5 | 0.92 ± 0.02 | 1.25 ± 0.17 | 78.3 ± 0.2 | 4.9 ± 0.6 | 0.21 | 0.06 |
Table 2.
Estimated mean resident times of the carbon pools during the 225–351-day incubation period.
Table 2.
Estimated mean resident times of the carbon pools during the 225–351-day incubation period.
| Treatment | C mineralization Rate | Estimated MRT (Years) | n |
|---|---|---|---|
| 1% biochar-amended soil | 6.3 ± 2.6 µg C/g BC/d | 435 ± 184 | 4 |
| 3% biochar-amended soil | 9.5 ± 3.0 µg C/g BC/d | 288 ± 96 | 10 |
| Combined biochar-amended soil | 7.9 ± 2.7 µg C/g BC/d * | 347 ± 131 | 14 |
| Control (native SOC) | 42.8 ± 16.4 µg C/g SOC/d | 64 ± 10 | 36 |
| Switchgrass-amended soil | 663.8 ± 138 µg C/g SG-C/d | 4 ± 1 | 12 |
* Weighted mean of the combined carbon mineralization rates in the 1% and 3% biochar-amended soils.
Disclaimer/Publisher’s Note: The statements, opinions and data contained in all publications are solely those of the individual author(s) and contributor(s) and not of MDPI and/or the editor(s). MDPI and/or the editor(s) disclaim responsibility for any injury to people or property resulting from any ideas, methods, instructions or products referred to in the content. |
© 2024 by the authors. Licensee MDPI, Basel, Switzerland. This article is an open access article distributed under the terms and conditions of the Creative Commons Attribution (CC BY) license (https://creativecommons.org/licenses/by/4.0/).
Share and Cite
MDPI and ACS Style
Hsieh, Y.-P.; Hatakka, K. Carbon Mineralization Dynamics of Switchgrass (Panicum virgatum) Biochar in a Northern Florida Soil. Sustainability 2024, 16, 4060. https://doi.org/10.3390/su16104060
AMA Style
Hsieh Y-P, Hatakka K. Carbon Mineralization Dynamics of Switchgrass (Panicum virgatum) Biochar in a Northern Florida Soil. Sustainability. 2024; 16(10):4060. https://doi.org/10.3390/su16104060
Chicago/Turabian StyleHsieh, Yuch-Ping, and Kristina Hatakka. 2024. "Carbon Mineralization Dynamics of Switchgrass (Panicum virgatum) Biochar in a Northern Florida Soil" Sustainability 16, no. 10: 4060. https://doi.org/10.3390/su16104060
Note that from the first issue of 2016, this journal uses article numbers instead of page numbers. See further details here.