Article

Environmental, Energy, and Techno-Economic Assessment of Waste-to-Energy Incineration

1
Energy Development Research Institute, China Southern Power Grid, Guangzhou 510663, China
2
School of Environmental Science and Engineering, Shanghai Jiao Tong University, Shanghai 200240, China
3
Planning & Research Center for Power Grid, Yunnan Power Grid Corp., Kunming 650011, China
4
Guangzhou Institute of Energy Conversion, Chinese Academy of Sciences, Guangzhou 510640, China
*
Authors to whom correspondence should be addressed.
Sustainability 2024, 16(10), 4140; https://doi.org/10.3390/su16104140
Submission received: 6 March 2024 / Revised: 9 May 2024 / Accepted: 9 May 2024 / Published: 15 May 2024
(This article belongs to the Section Energy Sustainability)

Abstract

:
Waste-to-energy (WtE) incineration is a feasible way to respond to both the municipal solid waste management and renewable energy challenges, but few studies have been carried out on its environmental and economic impact in fast-developing southeastern Asian countries. To fill such a research gap, this study innovatively conducted a holistic assessment of WtE incineration application potential in Java Island, Indonesia. Here, we have established a life cycle assessment model for WtE incineration in Java, and have estimated the environmental impact, electricity generation potential, and techno-economic feasibility of implementing incineration by 2025. We have revealed that global warming potential, terrestrial ecotoxicity potential, eutrophication potential, and acidification potential are the major environmental impacts stemming from incineration activities. Moreover, we have estimated that promoting incineration in Java could reduce CO2 emissions by 41% on average. The electricity generated from incineration could contribute to 3.72% of Indonesia’s renewable energy target for the electricity grid mix by 2025. The cumulative energy production potential from incineration is estimated to reach 2,316,523 MWh/year in 2025 and will increase by 14.3% in 2050. The techno-economic assessment of incineration implementation in Java cities has been enumerated as feasible. The levelized cost of electricity from incineration (0.044 USD/kWh) is competitive with the current Indonesian electricity price (0.069 USD/kWh). Policies of minimizing incineration pollution, providing financial support guarantees, and overcoming social barriers have been proposed to facilitate the application of WtE incineration.

1. Introduction

With fast urbanization and industrialization, global municipal solid waste (MSW) is estimated to triple in the next 80 years [1]. Thus, MSW management is becoming a great challenge, particularly for fast-developing southeastern Asian countries. Indonesia is a typical representative, with the annual MSW generated reaching 67.8 million tonnes in 2020. However, due to limited MSW infrastructure and services, the dominant MSW treatment approaches in Indonesia only consist of open dumping, unsanitary landfill, sanitary landfill, and improper waste burning, which lead to waste leakage into water bodies, air pollution from waste emissions, and soil contamination [2,3,4]. In addition, energy is another challenge, with domestic energy demand increasing by 7% annually and electricity demand tripling from 2010 to 2030 [5]. Furthermore, 65% of the electricity is derived from coal-fired power plants. To respond to the energy challenge, the energy policy targeted that renewable energy (geothermal, biomass, hydro, solar cell, wind, coal bed methane, etc.) sharing should be 23% of the primary energy mix by 2025. Thus, it is crucial to solve both the MSW challenge and the energy problems in Indonesia. Waste-to-energy (WtE) incineration is a feasible way to tackle both challenges. The Presidential Regulation No. 35/2018 stipulates WtE as an innovation of new and renewable energy and the strategic priorities for the Indonesian government to solve existing MSW issues. However, the potential contribution of WtE to Indonesia’s renewable energy targets and waste reduction goals is still not clarified. It is crucial to propose scientific policy suggestions to guide the practical implementation.
Academically, many studies on WtE incineration have been conducted worldwide, focusing on assessing the life cycle environmental impact [6,7]. Some studies have also investigated the aspect of energy production [8,9] or techno-economic feasibility [10,11]. Several scopes of combination studies have also been investigated. For instance, Samarasinghe et al. (2022) assessed the techno-economic and environmental impact of WtE in Sri Lanka [12]; and Yu and Dong (2020) uncovered the cost–benefit disparity of WtE incineration in China by using the life cycle assessment method [3]. Dastjerdi et al. (2021) analyzed the economic cost and sustainability of residual MSW in Australia [13]. Escamilla-García et al. (2020) studied the technical-economy feasibility of incineration in Mexico [14]. Chen et al. (2023) evaluated the energy, economic, and environmental effect of food waste to renewable energy via anaerobic digestion [15], and Zafar et al. (2024) explored the feasibility of solid waste incineration and implementation in Pakistan [16].
Some studies on incineration in Indonesia have also been conducted. However, Rachim (2017) estimated only the environmental impacts of WtE of the Benowo landfill site in East Java by using six impact indicators through SimaPro software ver. 9.5.2 [17]. Gunamantha et al. (2010) estimated the potential environmental impacts of different WtE options and landfill in the Kartamantul landfills of Yogyakarta using a simplified LCA method [18]. In addition, Sudibyo et al. (2017a) analyzed the general economic aspect of WtE in the Piyungan region of Yogyakarta [19], and Sudibyo et al. (2017b) analyzed the feasibility of MSW treatment in Indonesia [20].
In summary, the existing literature has focused mainly on one particular location/landfill site, without a comprehensive comparison with other regions in Indonesia. To the best of our knowledge, there is also a critical gap in conducting a holistic assessment of the environmental, energy, and techno-economic implications of WtE incineration in Indonesia, particularly in its capital cities. To fill such research gaps, this study aims to conduct a holistic assessment of WtE incineration by taking into consideration multiple aspects, including life cycle environmental impacts, prospective electricity generation potential, and techno-economic feasibility in the capital cities of Java Island, Indonesia. The future MSW policy target is also taken into consideration to forecast its MSW management scenarios in 2025.
This study contributes to the existing literature in two aspects. First, it extends the existing literature by performing a holistic analysis of WtE incineration from multiple perspectives. Different from the existing studies that focus on only the environmental aspect or economic aspect, we incorporate a life cycle environmental assessment, energy recovery estimation, and techno-economic feasibility analysis. This aligns with Indonesia’s MSW policy objectives and contributes to responding to both the MSW management and energy solutions. Second, it extends the existing literature in terms of research content. Few studies have been carried out on the environmental and economic impact in fast-developing southeastern Asia countries. We aim to conduct a comprehensive assessment of the capital cities of Java Island, Indonesia, which will not only extend the existing WtE cases of Asian countries, but also provide valuable insights into other countries or regions facing similar challenges in both MSW management and renewable energy solutions.

2. Method and Data Source

This study focuses on the life cycle environmental impact, energy recovery, and techno-economic feasibility of the WtE incineration in Java Island, Indonesia. Therefore, a brief introduction of Java Island and the calculation methods used for life cycle environmental assessment, energy recovery, and techno-economic assessment are introduced in the following subsections.

2.1. Brief Introduction of Java Island

Java Island is Indonesia’s most densely populated and developed region, emerging as the country’s growth engine. It is composed of six provinces. The total population of Java Island reached 151.65 million by 2020, accounting for 56.1% of Indonesia’s population [21]. The rapid urbanization in these cities has led to increased waste generation, straining the existing waste management infrastructure. The MSW generation of Java Island was 33.32 Mt in 2022, accounting for 59.7% of Indonesia’s total MSW. The composition of the MSW among the six capital cities in Java Island varies significantly, but is dominated by food waste, garden waste, and plastic and paper waste (Table S1 in Supplementary Materials). Moreover, Java Island accounts for 80% of Indonesia’s total energy consumption. Therefore, Java Island is a typical case to study how to respond to both challenges of MSW management and renewable energy solutions in Indonesia. Six capital cities of the provinces in Java Island are selected as representatives for comparison. The specific locations of the six capital cities in Java Island and a satellite image with additional features of estimated waste generation from 2025 to 2050 considering Jakstranas policy are displayed in Figure 1.

2.2. Life Cycle Environmental Assessment and Emission Reduction Potential

The life cycle assessment (LCA) is a method widely used to perform environmental impact analysis. It usually follows the following four steps: define the goals and scope, analyze the inventory, carry out an LCA impact assessment, and interpret the results. We follow this procedure and illustrate it in detail in the following subsections.

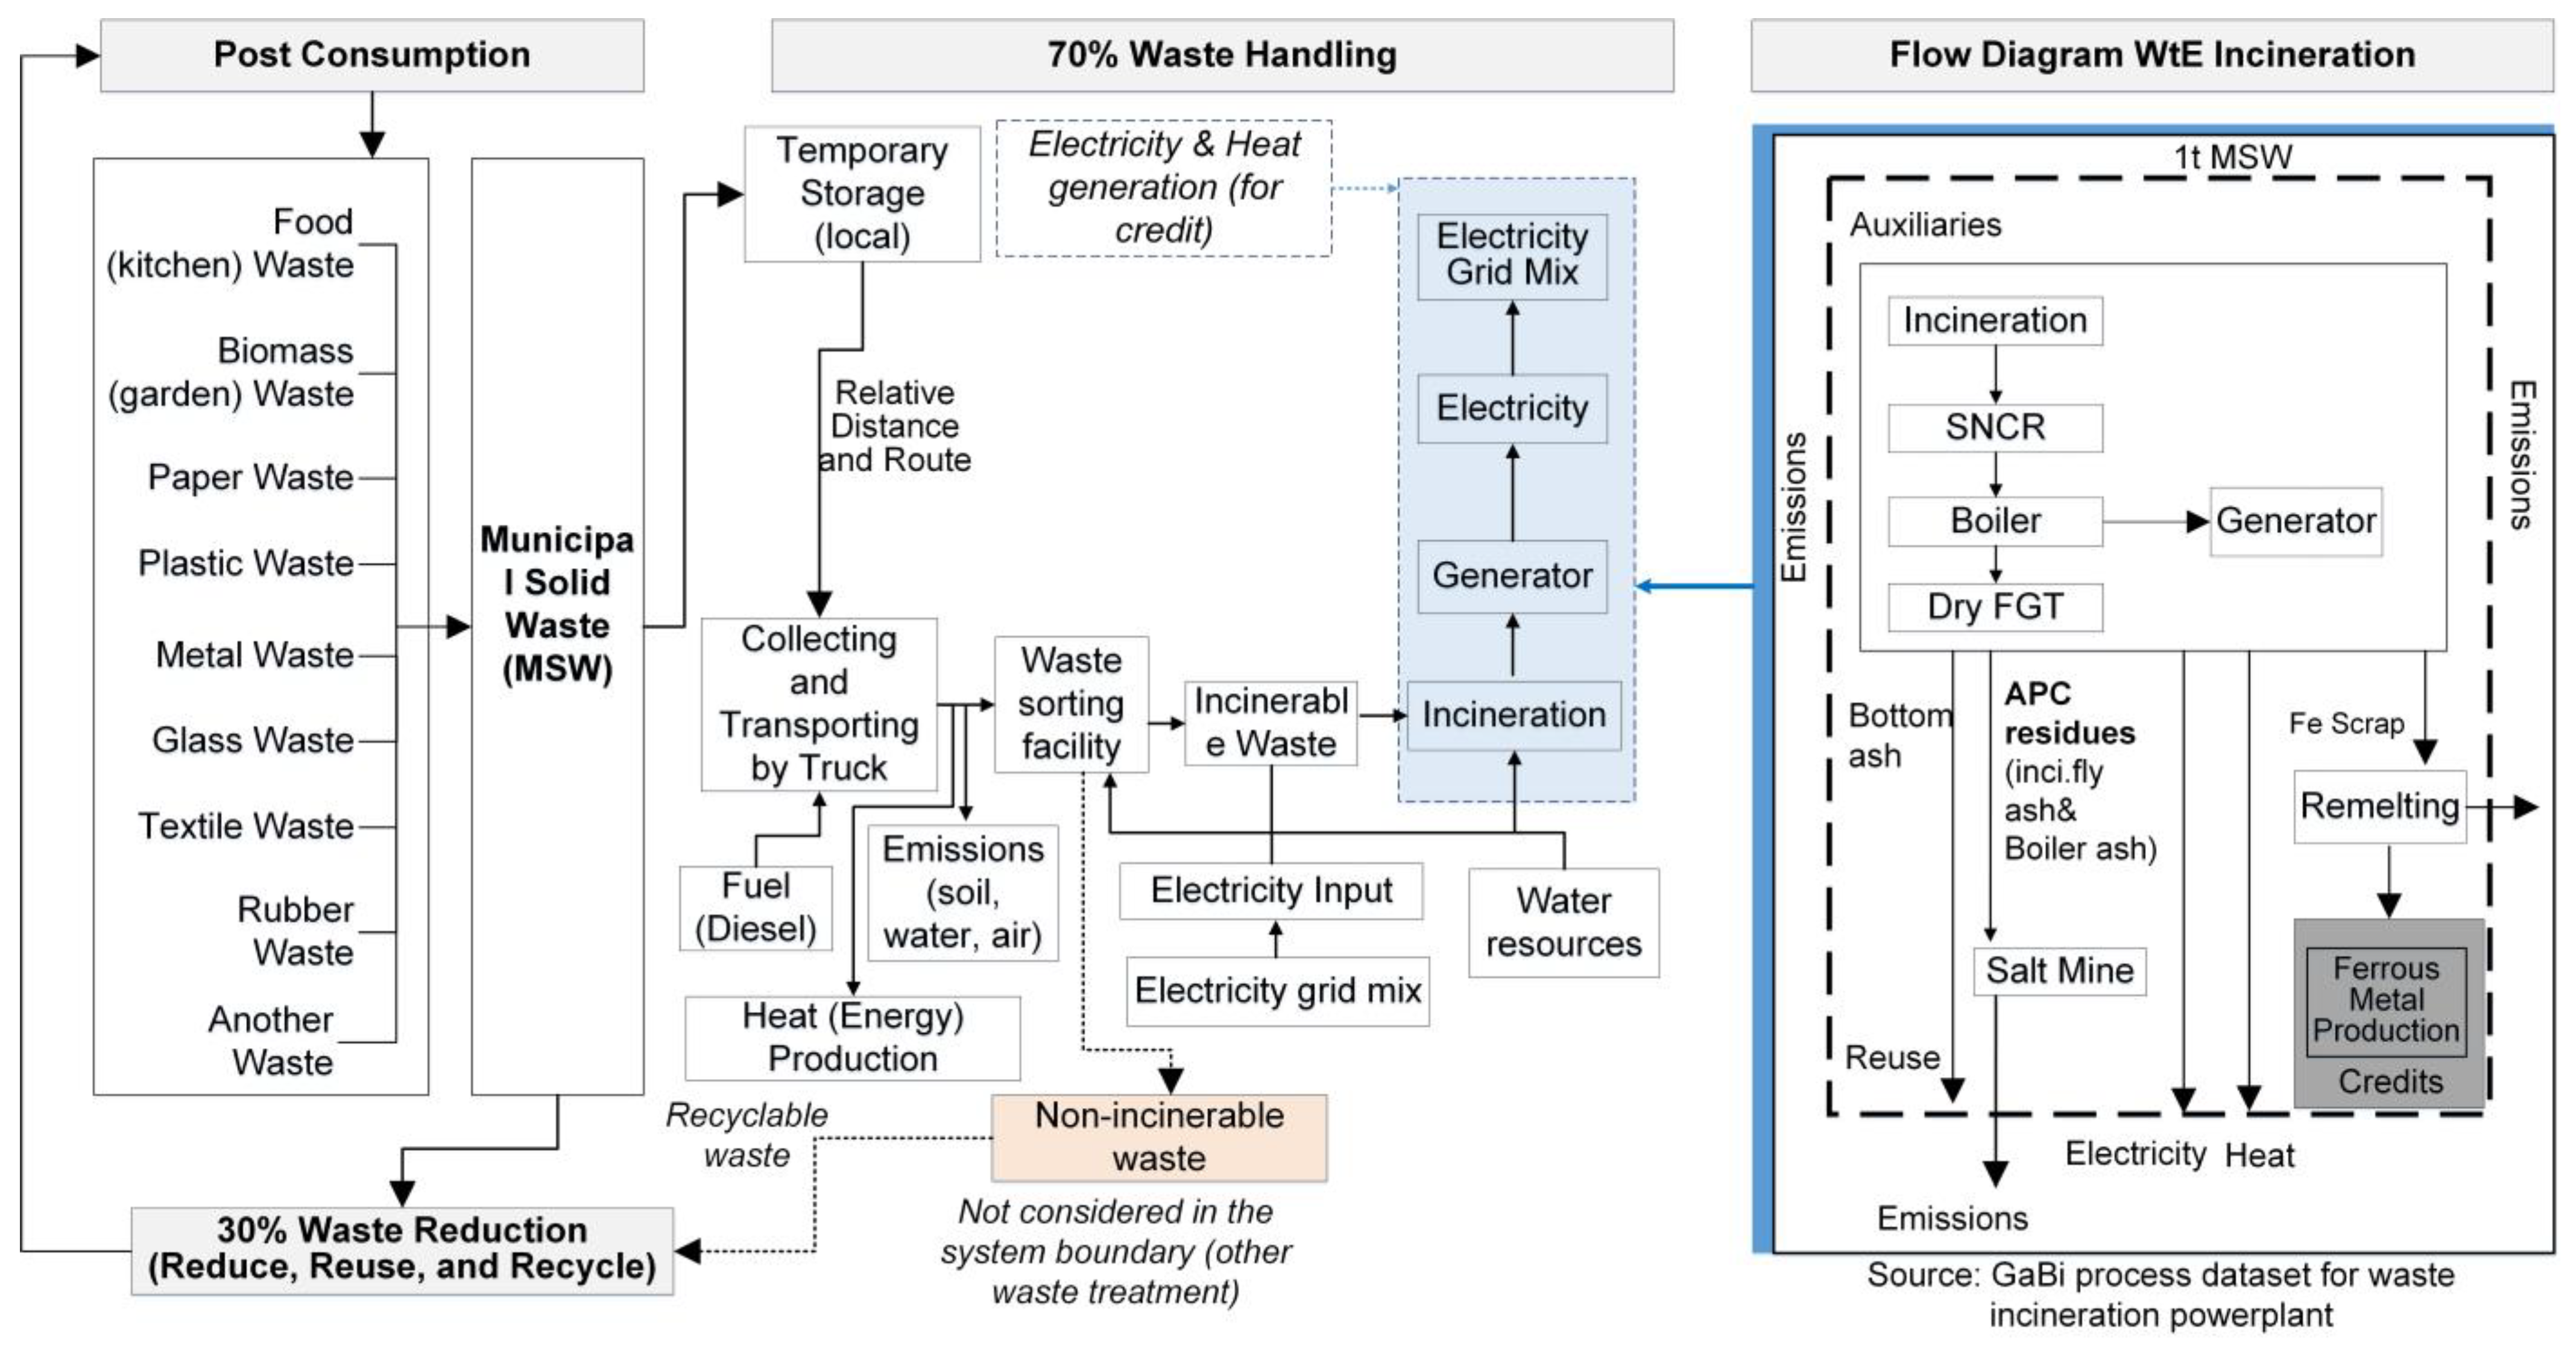
2.2.1. Goals, Functional Unit, and System Boundary

The goal of this study is to evaluate the life cycle environmental impact of WtE incineration in Java Island, Indonesia. The widely used LCA tool GaBi for environmental impact assessment is used to evaluate WtE incineration in this study. The year 2025 is selected as the effective year upon the implementation of Indonesia’s MSW policy, namely, Jakstranas (stipulated in Presidential Regulation No. 97/2017). The waste categories for incineration consist of food (kitchen), biomass (garden), paper, plastic, textile/fabric, and rubber/leather materials [2,22,23]. The system boundary of MSW incineration in Java is gate-to-grave (Figure 2), including the stages of storage, collecting and transporting, sorting, and incinerating the incinerable MSW. Since an incineration plant still does not exist in Java, we used the modeled incineration plant process database embedded in the LCA software GaBi ver. 9.5.2 as an input for the incineration module. The system boundary of the incineration module is shown in the right side of Figure 2. The modeled incineration plant is defined based on the treatment of average municipal solid waste (MSW) in Europe, which is likely to be introduced to Indonesia. The dataset covers all relevant process steps for the thermal treatment and corresponding processes, such as the disposal of air pollution control residues or metal recycling. For example, technologies of dry flue gas cleaning and selective non-catalytic reduction (SNCR) for NOx-removal to meet the legal requirements are adopted. For further detail about the incineration technology and system boundary, you can refer to http://gabi-documentation-2019.gabi-software.com/xml-data/processes/aa364db3-52ce-4bee-89eb-b86426753ec2.xml (Accessed on 6 August 2021). The functional unit in this LCA study is defined as the daily total incinerable waste incinerated.

2.2.2. Life Cycle Inventory and Data Sources

The primary inventories such as waste fraction and waste generation per day, number of trucks and related machinery that support MSW collection and haulage, distance per trip for MSW handling, and fuel for transportation were obtained from government reports, statistics reports (national and regional scale), and relevant scientific reports. Detailed information is available in the Supplementary Materials. The chemical database background of the environment for WtE incineration refers to the GaBi software ver. 9.5.2 database. The module of incineration-type technology, namely, ‘commercial waste incineration plant’, is chosen as the representative module of thermal treatment in incineration plants. The employed incineration module includes the environmental emissions and resource consumption dataset of the waste incinerator. Furthermore, the inventory from a diesel-driven bulk waste truck for urban areas is selected, with a payload capacity of 10 tons, as it is equal to the capacity haulage for typical Indonesian systems.

2.2.3. Life Cycle Impact Assessment

The LCA software GaBi ver. 9.5.2, developed by Thinkstep, Sphera, is used in this study to perform the life cycle environmental impact assessment. The CML method is a commonly used assessment method in GaBi that can reduce the complexity of the LCA model and make it easy to operate. Therefore, the CML method is selected in this study to assess the environmental performance of incineration. The impact parameters of the CML method consist of the following ten indicators: abiotic depletion potential for non-fossil resources (ADP elements); acidification potential (AP); eutrophication potential (EP); freshwater aquatic ecotoxicity potential (FAETP); global warming potential (GWP100); human toxicity potential (HTP); marine aquatic ecotoxicity potential (MAETP); ozone layer depletion potential (ODP); photochemical ozone creation potential (POCP); and terrestrial ecotoxicity potential (TETP). According to, CML methodology is globally valid and available in GaBi software [24].

2.2.4. GHG Emission Reduction Potential from Incineration Compared with Landfill

The approach developed by the Institute for Global Environmental Strategies is employed to measure the greenhouse gas (GHG) emissions from landfills, which is relevant within Indonesian MSW situations [25]. This approach adheres to and incorporates the IPCC (Intergovernmental Panel on Climate Change) 2006 guidelines for estimating GHG emissions from landfill disposal practices. All of the waste fractions available will be considered, assuming that 100% MSW disposal still relies on conventional landfills. The details of these equations are provided in Equations (1)–(11).
D D O C m = D D O C m   ( 0 )   ·   e k t
D D O C m   ( 1 ) = D D O C m   ( 0 )   ·   e k
D D O C m d e c o m p   ( 1 ) = D D O C m   ( 0 )   ·   ( 1 e k )
D D O C m d ( T ) = W ( T )   ·   D O C   ·   D O C f   · M C F
D D O C m r e m ( T ) = D D O C m d ( T )   ·   e ( k   ·   ( 13 M 12 ) )
D D O C m d e c ( T ) = D D O C m d ( T )   ·   [ 1 e ( k   ·   ( 13 M 12 ) )   ]
D D O C m a ( T ) = D D O C m r e m ( T ) + ( D D O C m a ( T 1 )   ·   e k )
D D O C m d e c o m p   ( T ) = D D O C m d e c ( T ) + ( D D O C m a ( T 1 )   · ( 1 e k ) )
C H 4   g e n e r a t e d ( T ) = D D O C m d e c o m p   ( T )   · F ·   16 12
C H 4   g e n e r a t e d   i n   y e a r   T = ( Σ C H 4   g e n e r a t e d ( T ) R ( T ) )   · ( 1 O X ( T ) )
G H G L a n d f i l l = C H 4   per   tonne   of   waste   · GWP   C H 4   + G H G   o p e r a t i o n a l
where D D O C is decomposable degradable organic carbon (anaerobic conditions) (Gg); D D O C m   is the   D D O C   mass at any time (Gg); D D O C m   ( 0 ) is the D D O C at the initial time of reaction, denoted as t = 0 and e k t =1 (Gg); k is a constant reaction; t is the duration time (years); W ( T ) is the deposited amount of MSW in year T (Gg); MCF is the correction factor for methane (MCF); D O C is degradable organic carbon (aerobic conditions) ( D O C ); D O C f is the D O C decomposing (anaerobic conditions) fraction (%); D D O C m d ( T ) is the D D O C mass deposited in year T (Gg); D D O C m r e m ( T ) is the D D O C mass deposited in the inventory year T (remaining and not decomposed at the end period) (Gg); D D O C m d e c ( T ) is the mass of D D O C deposited in year T (Gg); D D O C m a ( T ) is the total mass of the remaining D D O C that has not decomposed at the end of year T (Gg); D D O C m a ( T 1 ) is the total mass of the remaining D D O C that has not decomposed at the end of year T-1 (Gg); D D O C m d e c o m p   ( T ) is the total mass of DDOC decomposed in year T (Gg); C H 4   g e n e r a t e d ( T ) is the methane generated in year T (Gg); F is CH4 fractions by volume in the landfill, with a default value of 0.5, according to the IPCC; 16/12 is a molecular weight ratio of CH4/C (%); R ( T ) is the recovered amounts of CH4 in year T (Gg); O X ( T ) is the oxidation factor in year T (%); k is the constant reaction rate; M is the month of reaction start (month); and OX and other emission factors and specific calculation methods are illustrated based on the IGES GHG calculator (IPCC, 2013). The GWP of CH4 is considered as 28 on a 100-year time horizon, and the GHG operational activities are related to the GHG from machinery and fuel in the MSW systems. More details about the unit and specified values for the parameters are given in Table S8 in the Supplementary Materials.
Concerning the GHG emissions from WtE incineration, we referred to several studies [26,27]. The details of the equations are provided in Equations (12)–(15) by using the method of IPCC 2006 greenhouse gas inventories.
C E = i ( S W i   · d m i   · C F i   · F C F i   · O F i ) ·   44 12
E o p e r a t i o n = ( F C   · N C V F F   · E F C O 2 ) + ( E C   · E F e l )
G H G I n c i n e r a t i o n = C E + E o p e r a t i o n
R E C O 2 = G H G L a n d f i l l G H G I n c i n e r a t i o n
where C E is the emissions from combustion (kg CO2/tonne of waste); S W i is the quantity of the incinerated solid waste material i (wet weight) (kg/tonne of waste); d m i is the dry matter content (partially wet weight) of waste material i incinerated; C F i is the carbon fraction in dry matter (total carbon content); F C F i is the fossil carbon fraction in the total carbon; O F i is the oxidation factor; 44/12 is the conversion factor from carbon to carbon dioxide (CO2); and i is the incinerated waste materials category. Moreover, E o p e r a t i o n is the associated emissions stemming from operation (kg CO2/tonne of combustibles); F C is the consumption of fuel for WtE-related activities (mass or volume/tonne of combustibles); N C V F F is the net calorific value of consumed fossil fuel (MJ/unit mass or volume); E F C O 2 is the CO2 emission factor by the combustion of fossil fuel (kg CO2/MJ); EC is the electricity consumption for WtE activities (MWh/tonne of combustibles); E F e l is the emission factor of country grid electricity production (kg CO2 eq./MWh); G H G I n c i n e r a t i o n is the total GHG emissions produced from incineration (kg CO2 eq./tonne); and R E C O 2 is the amount of CO2 reductions between emissions from landfill and incineration (kg CO2 eq.).

2.3. Energy Recovery with the Dulong Approach

The Indonesian government’s target of 23% renewable energy by 2025 particularly aims at the electricity target from renewable energy sources. To facilitate the quantification of the contribution of WtE incineration, we assume that the national setting of Indonesia’s WtE only evaluates electricity generation. The Dulong formula, a widely employed method used to estimate energy content from MSW [28,29], is applied to determine the thermal energy value from waste by employing general chemical formulations of C, H, O, and S elements. The details of the formulations are provided in Equations (16)–(23).
H V = ( 338 · C ) + ( 1442.8 · ( H O 8 ) ) + ( 94.2 · S )
where HV represents a heating value (kJ/kg) obtained from the elemental parameters in MSW, whereas C, H, O, and S represent the percentage of each element on a dry, ash-free basis (chemical composition fractions of waste material). Typical waste moisture refers to, specifically for organic waste moisture adapted from [30]. Moreover, the typical ultimate and proximate of Indonesian MSW refer to [31]. The calculation for the electricity potential from incineration is elaborated as Equations (17)–(22) [27,32,33].
ω s t e a m = H V   ·   ω e f f   ( % )
where ω s t e a m represents the available energy from steam-boiler incineration (kJ/kg) and ω e f f   ( % ) represents on-site heat energy efficiency from steam-boiler incineration (adapted value 0.7 from the [32]. Correspondingly, the kJ value should be converted to kWh (1 kW equals 3600 kJ/h) as follows:
φ i n p u t = 3600 η
where φ i n p u t represents the heat input requirement (kJ) and η represents the efficiency of energy conversion (electricity recovery) in the incineration process (%), with an adapted value of 0.32 [32], slightly higher than the default value of 0.3 [27].
E g e n e r a t i o n = ω s t e a m φ i n p u t
E P g e n e r a t i o n = E g e n e r a t i o n   ·   G i
C E P = G i   ·   δ
E P n e t = E P g e n e r a t i o n ( C E P + E l o s s )
where E g e n e r a t i o n   represents the electricity generated per mass unit MSW (kWh/kg); E P g e n e r a t i o n represents the electricity generation potential (kWh/day); G i represents the daily amount of waste processed (kg/day); C E P represents the electricity consumed for WtE operation (kWh/day); δ represents the energy amount for incineration operation per mass unit (kWh/kg) (0.078 kWh/kg refers to [34]; E P n e t represents the net electricity value (kWh/day); and E l o s s represents the electricity amount of heat loss (kWh/day), with a loss rate of 7.5%, referring to the Ministry of Public Works and Public Housing of the Republic of Indonesia (2018) [32]. Accordingly, the electricity sharing ratio from incineration to electricity consumed per capital city by 2025 is calculated as follows:
ε y ( 2025 ) = 2025 E P n e t 2025 E P c a p i t a · P
where ε y ( 2025 ) is the energy share from incineration by 2025 in regional settings (%); 2025 E P n e t is the total electricity generation from WtE incineration by 2025 (MWh); P is the population of each city; and 2025 E P c a p i t a is the electricity consumption per capita in each city by 2025 (MWh). The Indonesian per capita energy consumption is 2526.73 kWh [35].

2.4. Techno-Economic Feasibility Analysis

Three aspects of techno-economic analysis were evaluated in this study, namely, the net present value (NPV), internal rate of return (IRR), and levelized cost of electricity (LCoE).
The NPV is defined as the present value equivalent of all cash inflows minus all cash outflows associated with a project [36]. A positive NPV is required for a project to be profitable. The higher the NPV of the project is, the more benefit it will obtain [37]. The equation for calculating the NPV of incineration is as follows [9,14,38]:
N P V = t = 1 n ( E P n e t   · p ) C o & m ( 1 + r ) t   I
where p is the electricity sales price (USD/MWh); C o & m is the average cost of operation and maintenance (USD); r is the country discount rate (%), which is set as 3.5% [39]; n is the lifespan of the incineration plant (years), which is considered as 25 years, with a discount rate of 3% from 2024 onwards; t represents cash flow time; and I is the capital investment of the incineration plant (USD).
The IRR of a project is defined as a discount rate that yields an NPV of zero. A project’s viability is determined by the extent to which the IRR surpasses the cost of capital [40]. The IRR for WtE incineration is calculated by referring to Escamilla-García et al. (2020) [14], as follows:
0 = N P V = t = 1 n C t ( 1 + I R R ) t   I
where C t marks the net cash flow of year t (USD), which is equal to the difference in net electricity sale revenue and the cost ( C o & m ). In addition, the approach of positive and negative NPV disparity can be elaborated to determine the IRR, as follows:
I R R = r 1 + N P V 1 N P V 1 N P V 2   · ( r 2 r 1 )
where r 1 is the discount rate with a positive NPV value (NPV1) and r 2 is the discount rate with a negative NPV value (NPV2).
Furthermore, it is pivotal to analyze the LCoE, as it is a widely used indicator for comparing the cost competitiveness of energy generation technologies [41]. The LCoE is defined as the ratio of the present value of total costs (capital cost, operation cost, and maintenance cost) to the present value of the total revenue (electricity generation sale revenue during its lifetime) [42]. It indicates the average minimum price at which the electricity must be sold for the project. Thus, the proposed technology is deemed successful if the LCoE value exceeds the benchmark price of national electricity. Conversely, if the LCoE value is below the price, the proposed technology is regarded as viable [43]. Two aspects of LCoE, namely, discount and annuitizing, are considered and calculated as follows [44]:
L C o E d i s c o u n t = t = 0 n C o & m t ( 1 + r ) t I t = 0 n EP n e t t ( 1 + r ) t
L C o E a n n u i t i z i n g = ( t = 0 n C t ( 1 + r ) t )   ( r 1 ( 1 + r ) n ) ( t = 1 n EP n e t t ) n
where E P n e t t denotes the net electricity generated (MWh/year) in year t and C o & m t is the annual average cost of operation and maintenance in year t.
Furthermore, carbon reductions from implementing incineration (instead of landfills) can be economically quantified by multiplying the total emission reduction (tonnes CO2 eq.) with Indonesia’s carbon tax value (USD/tCO2 eq.). The calculation equation follows [38] as follows:
C r e v = R E C O 2   · C t a x
where C r e v denotes an economic benefit through carbon reductions (USD); and C t a x denotes the carbon tax value (USD/tCO2 eq.), which is IDR 30 (Indonesia Rupiah) per kg CO2 eq. (equal to 2.11 USD/tCO2 eq.) for Indonesia [45,46,47].

3. Results and Discussion

3.1. Life Cycle Environmental Impact Assessment

The environmental impact of one tonne of incinerated MSW for the capital cities in Java by 2025 is shown in Table 1. The environmental impacts of GWP100, followed by TETP, AP, and EP, are found to be the primary environmental impacts caused by WtE incineration, which are 6.2 × 10⁶ kg CO2 eq.; 1.1 × 10³ kg DCB eq.; 7.5 × 10² kg SO2 eq.; and 1.4 × 10² kg PO4 eq., respectively. By contrast, several environmental impact indicators are pinpointed as environmental credit or benefit (marked by negative value), such as ODP, POCP, FAETP, HTP, and MAETP, which denote −2.5 × 10⁻² kg R11 eq.; −1.0 × 10² kg Ethene eq.; −2.0 × 10³ kg DCB eq.; −6.9 × 10⁴ kg DCB eq.; and −2.4 × 10⁸ kg DCB eq., sequentially. Moreover, a negligible amount is shown by an ADP impact indicator that shares around 7.8 × 10⁻² kg Sb eq. These results align with [34], in that incineration has a notably higher environmental impact in terms of AP, EP, and GWP100.
The magnitude of the primary environmental impacts (per ton of MSW processed) is comparable, as addressed by other studies. The GWP100 in our study resulted in 783 kg CO2 eq., whereas Liamsanguan and Gheewala (2008) tabulated 637–737 kg CO2 eq. in Phuket of Thailand [48], and Toniolo et al. (2014) reported 674 kg CO2 eq. in Italy [49]. Moreover, regarding TETP, our study yielded 0.137 kg DCB eq., whereas other studies denoted 0.133 kg DCB eq. in Europe [50] and 0.02 kg DCB eq. in the UK and Italy [51]. Concerning AP, our study generated 0.096 kg SO2 eq., however, other studies indicated 2.37 kg SO2 eq. in Thailand [52] and 0.466 kg SO2 eq. in the UK [51]. Concerning EP, our study showed 0.018 kg PO4 eq., while other studies reported 0.131 kg PO4 eq. in the UK [51] and 0.354 kg PO4 eq. in Thailand [52]. The disparity of results between these studies is caused by various factors, such as geographical location, MSW management conditions, LCA system boundaries, waste composition, haulage distance, utilized fuel, and so forth.
Figure 3 shows the daily potential life cycle environmental impacts from 100% MSW incineration by 2025 in each capital city of Java. It has been found that the environmental impacts contributed by WtE in Jakarta are the largest, followed by Surabaya, Bandung, Semarang, Serang, and Yogyakarta. At least two cities share almost similar values in environmental impact, with merely negligible disparity. Moreover, in Java’s percentage of total environmental impact values, we show that Jakarta shares 51% of AP and EP impact indicators and holds 50% contribution for ADP, GWP100, MAETP, HTP, ODP, POCP, and TETP impact indicators. Jakarta shares around 49% of the FAETP indicator. The main reason for this is that Jakarta has the highest MSW generation quantity, which leads to enormous incinerable MSW resources for WtE incineration input. Concerning other cities, Surabaya holds a 21% share for all impact indicators in Java, except for the FAETP impact indicator, which denotes 22%. Semarang has contributed 9% of the environmental impact in ADP, GWP100, POCP, and TETP, while it also contributes 8% in AP, EP, FAETP, and HTP, and 7% in ODP. Bandung city accounts for 14% of all impact indicators, except in FAETP and HTP, which are 15%. Additionally, both Serang and Yogyakarta cities have a similar fraction (approximately 3%) for all of the impact indicators in the Java region. The reason that both Serang and Yogyakarta municipalities share an equal impact on the environment is because their MSW quantity generated is also quite similar. Essentially, all of the environmental impact indicators in Java Island are interrelated with MSW generation; therefore, the more incinerable waste available, the higher the impact value from the combustion of incinerable waste.
Figure 4 presents a comparative analysis of GHG emission reduction potential, where incineration is implemented to replace landfill in 2025. By shifting from landfill disposal to WtE incineration, the annual GHG emissions from MSW treatment in Java can be reduced by 56% on average. From the perspective of regional disparity, we depicted that Bandung holds the highest GHG reduction potential, accounting for 67%, followed by Jakarta (64%), Yogyakarta (60%), Semarang (52%), Serang (52%), and Surabaya (39%), respectively. The reason for this is that the absolute reduction potential is closely related to the MSW amounts of different cities, with high MSW generation regions having the highest GHG reduction potentials. While the reason behind the relative reduction potential results is that it is affected by many parameters (as shown in Tables S8 and S9), such as half-life time, methane generation rate, and diesel consumption in landfill. By quantity average, the landfill system in our study generated 1094 kg CO2 eq./tonne, which is relevant and comparable with other studies, such as 1000 kg CO2 eq./tonne [53], 900 kg CO2 eq./tonne [54], and 668 kg CO2 eq./tonne [55]. Whereas the incineration system of this study generated 432.37 kg CO2 eq./tonne of incinerated waste on average. In another study, the emissions from incineration ranged from 250 to 600 kg CO2 eq./tonne [56], 646 kg CO2 eq./tonne [57], and 331 kg CO2 eq./tonne [58].

3.2. Electricity Generation Potential

Figure 5 shows the energy potential from employing 100% incineration of incinerable waste. It can be seen from Figure 5a that the incineration power plant in Jakarta produced the highest amount of electricity in 2025, with approximately 885,551 MWh/year, followed by Surabaya (432,134 MWh/year), Bandung (240,377 MWh/year), Semarang (159,984 MWh/year), Serang (54,833 MWh/year), and Yogyakarta (49,216 MWh/year), respectively. It is forecasted that the electricity generation potential of the six capital cities will generate electricity with an increasing trend from 2025 to 2050. The total electricity generation from incineration in Java Island is estimated to reach 2,316,523 MWh/year in 2025, and 2,704,036 MWh/year in 2050 (Figure 5b). Considering the waste produced and electricity generated, the results imply that the higher the population size in a particular location, the more incinerable waste is obtained, and the greater the potential electricity produced from the incineration. Furthermore, the amount of electricity generated compared to the regional public electricity consumption denotes the electricity share contributions. It has been found that the city with the highest electricity contribution share is Surabaya (4.61%), followed by Yogyakarta (4.24%), Bandung (3.76%), Semarang (3.64%), Jakarta (3.18%), and Serang (2.87%), sequentially. On average, the contribution of electricity from incineration to public energy consumption is 3.72%. Indonesia sets its energy targets for renewable energy as 23% of the primary energy grid mix by 2025. Therefore, incineration electricity can contribute to approximately 16% of the renewable energy target.
The Indonesian electricity power plants in 2018 were mainly dominated by fossil-fuel power plants, with shares of coal, gas, fuel oil, and renewable energy being around 50%, 29%, 7%, and 14%, respectively [59]. Therefore, the electricity derived from incineration could increase the share of renewable energy and reduce the dependency on fossil fuels in Indonesia. Furthermore, by dividing electricity outcomes by MSW input for incineration, the electricity generation rates from incinerating one tonne of MSW are as follows: Jakarta (614 kWh/ton), Surabaya (710 kWh/ton), Semarang (655 kWh/ton), Bandung (577 kWh/ton), Yogyakarta (611 kWh/ton), and Serang (657 kWh/ton). Compared to other incineration-related studies, such as 639 kWh/ton [60], the potential energy estimation from incineration in some Java cities is higher. The reason for this may be that the heating value (kJ/kg) from the Dulong estimation for incineration in Java cities is higher, due to the influence of moderate water moisture content within the MSW. Another reason is that the efficiency of energy conversion used in the incineration power plant is 0.32 (adapted from the Ministry of Public Works and Public Housing of the Republic of Indonesia (2018) [32]), which marks a slightly higher value than other studies on WtE incineration, such as that of 0.3 [14,38].

3.3. Techno-Economic Analysis

Concerning the techno-economic assessment, Table 2 provides economic feasibility in mainstreaming WtE incineration in the capital cities of Java, Indonesia. The NPV exhibits positive values, with Jakarta being the highest (USD 413 million) and Yogyakarta being the lowest (USD 20 million). The positive value of the NPV implies that implementing the incineration project is economically feasible. Regarding the IRR aspects, the highest average IRR value is from Surabaya (56.14%), followed by Serang (45.9%), Semarang (43.82%), Jakarta (36.93%), Bandung (31.1%), and Yogyakarta (29.92%), consecutively. Thus, as the IRR is much higher than the given discount rate (3%), it also demonstrates that all of the proposed WtE incineration projects in Java are economically profitable. However, the comparison of NPV and IRR shows that Jakarta holds the highest NPV value but not the highest IRR. It is critical to emphasize that investment-profitability decisions require us to consider both NPV and IRR [61]. According to The World Bank (2007) [62], it is appropriate to rank project feasibility by considering the NPV. Therefore, considering the NPV value of WtE project implementation in different cities, it has been found that Jakarta has the most significant net benefit, followed by Surabaya, Bandung, Semarang, Serang, and Yogyakarta, consecutively.
Furthermore, LCoE analysis of WtE incineration using two indicators (discounting and annuitizing) resulted in an approximately equal value, indicating that LCoE enumeration is reliable. On average, the highest LCoE value (USD/kWh) is from Yogyakarta (0.050), followed by Bandung (0.049), Jakarta (0.046), Semarang (0.043), Serang (0.041), and Surabaya (0.036), sequentially. The average LCoE value from these cities is 0.044 USD/kWh. Moreover, compared with the Indonesian electricity price of 0.069 USD/kWh, and the price assumption at the end of the WtE lifetime of 0.079 USD/kWh, the LCoE from the incineration is economically beneficial. Compared with relevant reports on LCoE in Indonesia [63], the LCoE of fossil-fuel power plants is higher than the LCoE provided by WtE incineration in this study. Thus, the LCoE of incineration power plant development in this study is competitive. However, compared with renewable electricity, such as PV and wind, their LCoE is smaller than that provided by WtE incineration in this study. If subsidies are given to support the initial investment, it can bolster the economic viability of the incineration project. Conversely, lower electricity prices or inadequate subsidies may diminish the appeal of WtE projects. Waste composition also affects the techno-economic results, but it will not significantly change, according to our experience, and thus will not affect the economic viability too much.
Additionally, concerning the economic evaluation from carbon emission reduction avoided from landfills, Jakarta municipality attained the highest economic benefit, totaling about USD 2 million by 2025. This value holds around 60% of Java’s carbon reduction economic potential. Following this, Bandung, Surabaya, Semarang, Yogyakarta, and Serang attained USD 0.7, 0.27, 0.25, 0.1, and 0.07 million, respectively. Therefore, the higher the quantity of MSW incinerated, the greater the economic benefit of carbon emission mitigation potential. If carbon tax policies were implemented in Indonesia in the future, the revenue from WtE incineration will be even higher, and the incineration project will be more competitive.

3.4. Sensitivity Analysis

The materials cellulose (fibers), waste for incineration with energy recovery (waste recovery), and radioactive tailings, which are mainly consumed and produced in the incineration process, were selected as the parameters for environmental sensitivity analysis (Table S11). The confidence intervals were set to 95% to evaluate the impact of fluctuation change in the three main input parameters at ±10% on the environmental performance. The results showed that cellulose (fibers) have the greatest environmental impact in the six cities, followed by waste recovery. The radioactive tailings have almost no impact on environmental changes. Yogyakarta city is the most sensitive to indicator GWP, and the other five cities are sensitive to ADP and HTP. The ADP and HTP in these five cities are most sensitive to changes in cellulose (fibers), and GWP is most sensitive to changes in waste recovery consumption.
Investment, electricity price, operation and maintenance cost, and discount rate are selected as parameters for economic sensitivity analysis of the NPV, IRR, and LCoE. The fluctuation of the main input parameters at 10% on the economic indicators is investigated (Table S12 in Supplementary Materials). The results showed that the electricity price shows the largest impact on the NPV in the six cities, with the largest NPV variation being 33.64% in Yogyakarta. Following this is the operation and maintenance fee. In terms of IRR, it is also most sensitive to changes in the electricity price, with Yogyakarta being 30.54%, followed by Bandung (28.52%), Jakarta (26.11%), Semarang (23.48%), Serang (22.29%), and Surabaya (19.73%). It is worth noting that the 10% reduction in investment, management maintenance fee, discount rate, and power parameters has the same impact on the LCoE in the six cities. With regards to the LCoE, it is less sensitive to the three parameters in the six cities, which may be related to the original data setting.

4. Policy Implications

Based on the results, the following policy implications are proposed to facilitate WtE incineration application by the local government.
First, the government is suggested to take the leading role in minimizing the potential environmental side effects, while facilitating WtE development. We have found that incineration will aggravate environmental emissions such as dioxin, SO2, eutrophication, and carbon emissions. Therefore, the Indonesian government should establish a strict environmental regulation mechanism for incinerator plants to reduce corresponding environmental risk, such as establishing an accessible environmental impact monitoring system, implementing a strict incineration emission standard, and performing strict supervision. Furthermore, incineration plant organizers should ensure compliance with the environmental mechanism.
Second, it is recommended to implement more feasible financial and encouraging polices to foster incineration projects in Indonesia. Although our results show that incineration is economically feasible, the initial investment of incineration plants is still huge. Solving the capital investment issue will be a great challenge if 100% incineration is planned. The Indonesian government needs to establish proper policy systems. For example, to put into force some advocating policies to encourage companies participating the incineration plants, such as a tax free, loan priority, subsidy. It is also crucial to guarantee the connection of incineration electricity to the grid and properly set the feed-in tariffs to ensure the economic benefit from incineration. Essentially, a high level of collaboration between the government and private sectors can lead to a successful incineration operation. The proper arrangements of public–private partnership schemes (including procurement and contracting options) will strengthen the financial viability of incineration projects in Indonesia. To achieve this, Indonesian policymakers should establish relevant regulations to support the dynamics of collaboration from any parties (stakeholders) involved in the WtE incineration development.
Finally, appropriate countermeasures to conquer social barriers should be considered. Social barriers such as public opposition and the “not in my backyard” effect may appear because of the environmental pollution caused by the incineration plants. To conquer these social barriers, it is recommended that the government build incineration plants far away from downtown areas and involve the community in the planning and decision-making process in order to foster trust. Establishing a robust real-time monitoring system and providing transparent access to environmental monitoring results can help to alleviate public health concerns. Moreover, effective communication with society and highlighting the benefits of WtE incineration implementation through campaigns or mass media are also essential ways to reduce the social barriers.

5. Conclusions

WtE incineration is a promising way for Indonesia to tackle both the challenges of MSW treatment and renewable energy transition. However, few studies have investigated this issue. This study assesses the life cycle environmental impacts, electricity generation potential, and techno-financial feasibility of incineration in six capital cities of Java, Indonesia, by 2025. The GWP, TETP, AP, and EP have been found to be the primary environmental impacts of incineration. Moreover, the transition from landfills to WtE incineration can contribute to a potential reduction in carbon emissions by approximately 41% (1.646 × 10⁹ kg of CO2 eq.). Regarding energy potential, if 100% of incinerable waste were incinerated in 2025, the electricity generated from incineration will reach 1,822,094 kWh, accounting for about 3.72% of domestic electricity consumption. Concerning economic feasibility, all WtE power plants in Java have been marked as economically viable, with positive NPV values. The average value of the levelized cost (LCoE) of incineration electricity is 0.044 USD/kWh, which is competitive compared to 0.069 USD/kWh of current fossil fuel electricity price in the Java region. To further foster the establishment of incineration plants in Indonesia, it is recommended to take actions to solve the issues of pollution control, financial support, and social barriers.
To the best of our knowledge, this study is the first to produce a holistic assessment of WtE incineration application in Indonesia by integrating multiple perspectives, including the environmental impact, energy generation, and economic feasibility. It contributes to existing studies by not only extending the methods, but also expanding the research target to Indonesia. The findings offer valuable insights into the environmental, energy, and techno-economic aspects of WtE incineration in not only Indonesia, but also other fast-developing cities and countries that face similar challenges in MSW and renewable energy. However, certain limitations also exist. For example, the benefits of job creation, waste management cost saving, and eco-cost saving due to environmental impact mitigation, etc., are not considered here, due to the lack of data and methods. Furthermore, the MSW composition and per capita energy consumption may change in the future, while we assumed the same value as the latest historical year due to the lack of future data. Although the MSW composition would not significantly change, according to our experience, this may cause uncertainty for forecasting future electricity generation and consumption. Future research can further address the above limitations and explore more accurate and deeper forecasts.

Supplementary Materials

The following supporting information can be downloaded at: https://www.mdpi.com/article/10.3390/su16104140/s1, Table S1: Waste composition in Java Island; Table S2: MSW quantity and category in the capital cities in Java by 2025; Table S3: Waste quantity (tons/day) in Java Island (2008–2050); Table S4:Quantity of incinerable waste after calculation of Jakstranas policy implementation (70% of handling MSW) in Java Island; Table S5: Population per capital city of provinces in Java Island (2008–2050); Table S6:Municipal solid waste management support systems per capital city of provinces in Java Island; Table S7: Life cycle impact analysis results from Waste-to-Energy Incineration in Java Island; Table S8: Input for greenhouse gas (GHG) analysis of landfill open dumping system in six capital cities of Java provinces; Table S9: GHG emissions generated from landfills in 2025; Table S10:Estimation of elemental mass for the input of the dulong calculation (energy recovery) waste incineration; Table S11: Sensitivity analysis for life cycle environmental assessment; Table S12: Economic Sensitivity analysis results. References [64,65] are cited in supplementary materials.

Author Contributions

J.Z.: Conceptualization, Writing—original draft, Writing—review and editing, and Project administration. A.B.M.: Methodology, Data curation, Writing—original draft, Investigation, and Software. M.L.: Writing—review and editing. G.H.: Writing—review and editing. N.S.: Writing—review and editing. X.L.: Writing—review and editing. K.W.: Writing—review and editing. P.W.: Writing—review and editing, Formal analysis, and Project administration. H.D.: Conceptualization, Supervision, Writing—original draft, Writing—review and editing, Formal analysis, and Funding acquisition. All authors have read and agreed to the published version of the manuscript.

Funding

This study is supported by the National Natural Science Foundation of China (71974126, 72061127004).

Institutional Review Board Statement

Not applicable.

Informed Consent Statement

Not applicable.

Data Availability Statement

All data that support the findings of this study are included within the article (and any Supplementary Files). Other related data associated with this study could be available if the readers raise such a request.

Acknowledgments

We would like to thank David Evers, Gloria Ripaldi, Ritesh Agrawal, and Ludwig Sommerer for their valuable insights and suggestions about the operational use of the GaBi software. In addition, we also thank the local government staff (environmental officers) in the capital cities in Java (Indonesia) for assisting with information related to MSW activities and developments.

Conflicts of Interest

Author Minwei Liu was employed by the company Power Grid Corp. The remaining authors declare that the research was conducted in the absence of any commercial or financial relationships that could be construed as a potential conflict of interest.

Abbreviation

WtEWaste-to-energy
MSWMunicipal solid waste
LCALife cycle assessment
LCIALife cycle impact assessment
ADPAbiotic depletion potential
APAcidification potential
EPEutrophication potential
FAETPFreshwater aquatic ecotoxicity potential
GWP100Global warming potential, 100 years
HTPHuman toxicity potential
MAETPMarine aquatic ecotoxicity potential
ODPOzone layer depletion potential
POCPPhotochemical ozone creation potential
TETPTerrestrial ecotoxicity potential
GHGGreenhouse gas
DDOCDecomposable degradable organic carbon
MCFCorrection factor for methane
DOCDegradable organic carbon (aerobic conditions)
OXOxidation factor
CEEmissions from combustion
SWQuantity of incinerated solid waste
DMDry matter content (partially wet weight) of waste
CFCarbon fraction in dry matter (total carbon content)
FCFFossil carbon fraction
OFOxidation factor
FCConsumption of fuel
NCVNet calorific value
EFEmission factor
ECElectricity consumption for WtE
REReductions between emissions from landfill and incineration
HVHeating value
EPnetNet electricity generated potential
EPcapitaElectricity consumption per capita
NPVNet present value
IRRInternal rate of return
LCoELevelized cost of electricity
rDiscount rate

References

  1. Zhang, C.; Dong, H.; Geng, Y.; Liang, H.; Liu, X. Machine learning based prediction for China’s municipal solid waste under the shared socioeconomic pathways. J. Environ. Manag. 2022, 312, 114918. [Google Scholar] [CrossRef]
  2. Dastjerdi, B.; Strezov, V.; Kumar, R.; He, J.; Behnia, M. Comparative life cycle assessment of system solution scenarios for residual municipal solid waste management in NSW, Australia. Sci. Total Environ. 2021, 767, 144355. [Google Scholar] [CrossRef] [PubMed]
  3. Yu, S.; Dong, H. Uncover Cost-Benefit Disparity of Municipal Solid Waste Incineration in Chinese Provinces. Sustainability 2020, 12, 697. [Google Scholar] [CrossRef]
  4. IPCC User Manual Estimation Tool for Greenhouse Gas (GHG). Emissions from Municipal Solid Waste (MSW) Management in a Life Cycle Perspective; IGES: Hayama, Japan, 2013. [Google Scholar]
  5. Asian Development Bank. Summary of Indonesia’s Energy Sector Assessment; Asian Development Bank: Manila, Philippines, 2015. [Google Scholar]
  6. Cudjoe, D.; Acquah, P.M. Environmental impact analysis of municipal solid waste incineration in African countries. Chemosphere 2021, 265, 129186. [Google Scholar] [CrossRef]
  7. Liu, D.; Wang, S.; Xue, R.; Gao, G.; Zhang, R. Life cycle assessment of environmental impact on municipal solid waste incineration power generation. Environ. Sci. Pollut. Res. 2021, 28, 65435–65446. [Google Scholar] [CrossRef]
  8. Sebastian, R.M.; Kumar, D.; Alappat, B.J. A technique to quantify incinerability of municipal solid waste. Resour. Conserv. Recycl. 2019, 140, 286–296. [Google Scholar] [CrossRef]
  9. Silva, L.J.d.V.B.d.; dos Santos, I.F.S.; Mensah, J.H.R.; Goncalves, A.T.T.; Barros, R.M. Incineration of municipal solid waste in Brazil: An analysis of the economically viable energy potential. Renew. Energy 2020, 149, 1386–1394. [Google Scholar] [CrossRef]
  10. Haraguchi, M.; Siddiqi, A.; Narayanamurti, V. Stochastic cost-benefit analysis of urban waste-to-energy systems. J. Clean. Prod. 2019, 224, 751–765. [Google Scholar] [CrossRef]
  11. Siddiqi, A.; Haraguchi, M.; Narayanamurti, V. Urban waste to energy recovery assessment simulations for developing countries. World Dev. 2020, 131, 104949. [Google Scholar] [CrossRef]
  12. Samarasinghe, K.; Wijayatunga, P.D.C. Techno-economic feasibility and environmental sustainability of waste-to-energy in a circular economy: Sri Lanka case study. Energy Sustain. Dev. 2022, 68, 308–317. [Google Scholar] [CrossRef]
  13. Dastjerdi, B.H.; Strezov, V.; Kumar, R.; Behnia, M. Economic feasibility and sustainability assessment of residual municipal solid waste management scenarios in NSW, Australia. Sustainability 2021, 13, 8972. [Google Scholar] [CrossRef]
  14. Escamilla-García, P.E.; Camarillo-López, R.H.; Carrasco-Hernández, R.; Fernández-Rodríguez, E.; Legal-Hernández, J.M. Technical and economic analysis of energy generation from waste incineration in Mexico. Energy Strateg. Rev. 2020, 31, 100542. [Google Scholar] [CrossRef]
  15. Chen, Y.; Pinegar, L.; Immonen, J.; Powell, K.M. Conversion of food waste to renewable energy: A techno-economic and environmental assessment. J. Clean. Prod. 2023, 385, 135741. [Google Scholar] [CrossRef]
  16. Zafar, A.M.; Shahid, S.; Nawaz, M.I.; Mustafa, J.; Iftekhar, S.; Ahmed, I.; Tabraiz, S.; Bontempi, E.; Assad, M.; Ghafoor, F.; et al. Waste to energy feasibility, challenges, and perspective in municipal solid waste incineration and implementation: A case study for Pakistan. Chem. Eng. J. Adv. 2024, 18, 100595. [Google Scholar] [CrossRef]
  17. Rachim, T.A. Life Cycle Assessment (LCA) Pengolahan Sampah Secara Termal (Studi Kasus: TPA Benowo, Kota Surabaya). Inst. Teknol. Sepuluh Nop. 2017, 144, 141581. Available online: https://repository.its.ac.id/43075/1/3313100063-Undergraduate_Theses.pdf (accessed on 5 March 2024).
  18. Gunamantha, M.; Fandeli, C.; Tandjung, S.D.; Sarto, S. Life cycle assessment of solid waste management options: Case study of the Kartamantul regions, D.I.Yogyakarta province. J. Mns. Lingkung. 2010, 17, 78–88. [Google Scholar]
  19. Sudibyo, H.; Majid, A.I.; Pradana, Y.S.; Budhijanto, W.; Deendarlianto; Budiman, A. Technological evaluation of municipal solid waste management system in Indonesia. Energy Procedia 2017, 105, 263–269. [Google Scholar] [CrossRef]
  20. Sudibyo, H.; Pradana, Y.S.; Budiman, A.; Budhijanto, W. Municipal solid waste management in Indonesia—A study about selection of proper solid waste reduction method in, D.I. Yogyakarta Province. Energy Procedia 2017, 143, 494–499. [Google Scholar] [CrossRef]
  21. Statistics Indonesia. Total Population Projection Result by Province and Gender (Thousand People), 2018–2020; Statistics Indonesia: Jakarta, Indonesia, 2021.
  22. Sharma, A.; Ganguly, R.; Gupta, A.K. Life cycle assessment of municipal solid waste generated from hilly cities in India—A case study. Heliyon 2023, 9, e21575. [Google Scholar] [CrossRef]
  23. Xayachak, T.; Haque, N.; Lau, D.; Emami, N.; Hood, L.; Tait, H.; Foley, A.; Pramanik, B.K. White spill: Life cycle assessment approach to managing marine EPS litter from flood-released pontoons. Chemosphere 2023, 337, 139400. [Google Scholar] [CrossRef]
  24. Fan, Z.; Dong, H.; Geng, Y.; Fujii, M. Life cycle cost–benefit efficiency of food waste treatment technologies in China. Environ. Dev. Sustain. 2023, 25, 4935–4956. [Google Scholar] [CrossRef]
  25. Menikpura, N.; Sang-Arun, J. User Manual Estimation Tool for Greenhouse Gas (GHG) Emissions from Municipal Solid Waste (MSW) Management in a Life Cycle Perspective, 2nd ed.; Institute for Global Environmental Strategies: Kanagawa, Japan, 2013. [Google Scholar]
  26. Menikpura, S.N.M.; Sang-Arun, J.; Bengtsson, M. Assessment of environmental and economic performance of Waste-to-Energy facilities in Thai cities. Renew. Energy 2016, 86, 576–584. [Google Scholar] [CrossRef]
  27. Abdallah, M.; Hamdan, S.; Shabib, A. Development of a dynamic optimization framework for waste management systems. MethodsX 2021, 8, 101203. [Google Scholar] [CrossRef] [PubMed]
  28. Ibikunle, R.A.; Titiladunayo, I.F.; Akinnuli, B.O.; Dahunsi, S.; Olayanju, T. Estimation of power generation from municipal solid wastes: A case Study of Ilorin metropolis, Nigeria. Energy Rep. 2019, 5, 126–135. [Google Scholar] [CrossRef]
  29. Ibikunle, R.A.; Titiladunayo, I.F.; Lukman, A.F.; Dahunsi, S.; Akeju, E. Municipal solid waste sampling, quantification and seasonal characterization for power evaluation: Energy potential and statistical modelling. Fuel 2020, 277, 118122. [Google Scholar] [CrossRef]
  30. Zahra, F.; Damanhuri, T.P. Kajian komposisi, karakteristik, dan potensi daur ulang sampah di TPA Cipayung, Depok. J. Tek. Lingkung. 2011, 17, 56–59. [Google Scholar] [CrossRef]
  31. Pasek, A.D.; Gultom, K.W.; Suwono, A. Feasibility of recovering energy from municipal solid waste to generate electricity. J. Eng. Technol. Sci. 2013, 45, 241–256. [Google Scholar] [CrossRef]
  32. Ministry of Public Works and Public Housing of the Republic of Indonesia. WtE Thermal Technology Based Combustion (Incineration) Process. Badan Pengembangan Sumber Daya Manusia; Kementerian Pekerjaan Umum dan Perumahan Rakyat: Bandung, Indonesia, 2018.
  33. Abdallah, M.; Arab, M.; Shabib, A.; El-Sherbiny, R.; El-Sheltawy, S. Characterization and sustainable management strategies of municipal solid waste in Egypt. Clean. Technol. Environ. Policy 2020, 22, 1371–1383. [Google Scholar] [CrossRef]
  34. Zaman, A.U. Comparative study of municipal solid waste treatment technologies using life cycle assessment method. Int. J. Environ. Sci. Technol. 2010, 7, 225–234. [Google Scholar] [CrossRef]
  35. Sartika Wibowo, A.P. Pemodelan Kebutuhan Listrik Indonesia Terkait Pencapaian Sasaran Kebijakan Energi Nasional. J. Politeknosains 2017, 16, 50–60. Available online: http://download.garuda.kemdikbud.go.id/article.php?article=3318285&val=29117&title=Pemodelan%20Kebutuhan%20Listrik%20Indonesia%20Terkait%20Pencapaian%20Sasaran%20Kebijakan%20Energi%20Nasional (accessed on 5 March 2024).
  36. Andersson, E.R. Economic Evaluation of Ergonomic Solutions: Part I-Guidelines for the Practitioner; Elsevier Science Ltd.: Amsterdam, The Netherlands, 2000. [Google Scholar]
  37. Ebrahimi, M.; Keshavarz, A. CCHP Evaluation Criteria. In Combined Cooling, Heating and Power—Decision-Making, Design and Optimization; Elsevier Ltd.: Amsterdam, The Netherlands, 2015; pp. 93–102. [Google Scholar]
  38. Abdallah, M.; Shanableh, A.; Shabib, A.; Adghim, M. Financial feasibility of waste to energy strategies in the United Arab Emirates. Waste Manag. 2018, 82, 207–219. [Google Scholar] [CrossRef] [PubMed]
  39. Statistics Indonesia. BI Rate 2021; Badan Pusat Statistik: Jakarta, Indonesia, 2021.
  40. Cook, M. Project cash flow. In Developments in Petroleum Science; Elsevier: Amsterdam, The Netherlands, 2021; pp. 133–205. [Google Scholar]
  41. Timilsina, G.R. Demystifying the Costs of Electricity Generation Technologies; The World Bank: Washington, DC, USA, 2020. [Google Scholar]
  42. Ragheb, M. A Handbook for Onshore and Offshore Wind Turbines. In Wind Energy Engineering; Elsevier Inc.: London, UK, 2017; pp. 537–555. [Google Scholar]
  43. Mai, T.; Mowers, M.; Eurek, K. Competitiveness Metrics for Electricity System Technologies; National Renewable Energy Lab.: Golden, CO, USA, 2021. [Google Scholar]
  44. Lai, C.S.; McCulloch, M.D. Levelized cost of electricity for solar photovoltaic and electrical energy storage. Appl. Energy 2017, 190, 191–203. [Google Scholar] [CrossRef]
  45. Ministry of Finance. Carbon Tax as an Instrument for Controlling Climate Change; Ministry of Finance: Jakarta, Indonesia, 2021.
  46. Ministry of Finance. Committed to Overcoming Climate Change, Law on Harmonization of Tax Regulations (RUU HPP) Regulates the Imposition of Carbon Tax; Ministry of Finance: Jakarta, Indonesia, 2021.
  47. The Indonesia Directorate General of Taxes. Pajak Karbon dan Pigouvian Tax. Available online: https://www.pajak.go.id/id/artikel/pajak-karbon-dan-pigouvian-tax (accessed on 15 August 2021).
  48. Liamsanguan, C.; Gheewala, S.H. LCA: A decision support tool for environmental assessment of MSW management systems. J. Environ. Manag. 2008, 87, 132–138. [Google Scholar] [CrossRef] [PubMed]
  49. Toniolo, S.; Mazzi, A.; Garato, V.G.; Aguiari, F.; Scipioni, A. Assessing the “design paradox” with life cycle assessment: A case study of a municipal solid waste incineration plant. Resour. Conserv. Recycl. 2014, 91, 109–116. [Google Scholar] [CrossRef]
  50. Ramos, A.; Teixeira, C.A.; Rouboa, A. Environmental analysis of waste-to-energy-a Portuguese case study. Energies 2018, 11, 548. [Google Scholar] [CrossRef]
  51. Jeswani, H.K.; Azapagic, A. Assessing the environmental sustainability of energy recovery from municipal solid waste in the, U.K. Waste Manag. 2016, 50, 346–363. [Google Scholar] [CrossRef] [PubMed]
  52. Chaya, W.; Gheewala, S.H. Life cycle assessment of MSW-to-energy schemes in Thailand. J. Clean. Prod. 2007, 15, 1463–1468. [Google Scholar] [CrossRef]
  53. Manfredi, S.; Tonini, D.; Christensen, T.H.; Scharff, H. Landfilling of waste: Accounting of greenhouse gases and global warming contributions. Waste Manag. Res. 2009, 27, 825–836. [Google Scholar] [CrossRef] [PubMed]
  54. Mendes, M.R.; Aramaki, T.; Hanaki, K. Comparison of the environmental impact of incineration landfilling in São Paulo City as determined by, L.C.A. Resour. Conserv. Recycl. 2004, 41, 47–63. [Google Scholar] [CrossRef]
  55. Broun, R.; Sattler, M. A comparison of greenhouse gas emissions and potential electricity recovery from conventional and bioreactor landfills. J. Clean. Prod. 2016, 112, 2664–2673. [Google Scholar] [CrossRef]
  56. Christensen, T.H.; Damgaard, A.; Astrup, T.F. Waste to Energy: The carbon perspective. Waste Manag. World 2015, 24–28. Available online: https://orbit.dtu.dk/files/127630218/2015_Christensen_et_al_Waste_to_energy_the_carbon_perspective_postprint.pdf (accessed on 1 January 2015).
  57. Malakahmad, A.; Abualqumboz, M.S.; Kutty, S.R.M.; Abunama, T.J. Assessment of carbon footprint emissions and environmental concerns of solid waste treatment and disposal techniques; case study of Malaysia. Waste Manag. 2017, 70, 282–292. [Google Scholar] [CrossRef] [PubMed]
  58. Aracil, C.; Haro, P.; Fuentes-Cano, D.; Gómez-Barea, A. Implementation of waste-to-energy options in landfill-dominated countries: Economic evaluation and GHG impact. Waste Manag. 2018, 76, 443–456. [Google Scholar] [CrossRef] [PubMed]
  59. Ministry of Energy and Mineral Resources. Indonesia Energy Outlook; Ministry of Energy and Mineral Resources: Jakarta, Indonesia, 2019.
  60. Abd Kadir, S.A.S.; Yin, C.Y.; Rosli Sulaiman, M.; Chen, X.; El-Harbawi, M. Incineration of municipal solid waste in Malaysia: Salient issues, policies and waste-to-energy initiatives. Renew. Sustain. Energy Rev. 2013, 24, 181–186. [Google Scholar] [CrossRef]
  61. Juhász, L. Comparing Net Present Value and Internal Rate of Return. Econ. Sociol. 2011, 4, 46–53. [Google Scholar] [CrossRef]
  62. The World Bank. Cost-Benefit Analysis: Evaluation Criteria (Or: “Stay Away from the IRR”); The World Bank: Washington, DC, USA, 2007. [Google Scholar]
  63. Ministry of Energy and Mineral Resources. Kajian Penyediaan dan Pemanfaatan Migas, Batubara, EBT dan Listrik (Study on Supply and Utilization of Oil and Gas, Coal, Electricity, and Renewable Energy); Center for Energy and Mineral Resources Data and Information Technology, Ministry of Energy and Mineral Resources: Jakarta, Indonesia, 2017.
  64. Indonesia Statistics. Indonesia Population Projection 2015–2045 Result of SUPAS 2015 (Revised Edition); Indonesia Statistics: Jakarta, Indonesia, 2018.
  65. Statistic Indonesia. Environment Statistics of Indonesia: Water and Environment; Badan Pusat Statistik Republik Indonesia: Jakarta, Indonesia, 2020.
Figure 1. Java Island cities and their waste generation potential from 2025 to 2050.
Sustainability 16 04140 g001
Figure 2. LCA system boundary of incineration.
Sustainability 16 04140 g002
Figure 3. Potential daily life cycle environmental impact of 100% MSW incineration for capital cities in Java, 2025.
Sustainability 16 04140 g003
Figure 4. Carbon reduction potential from implementing incineration compared with landfills in 2025. Note: A negative percentage denotes the emission reduction when replacing landfills with incineration.
Sustainability 16 04140 g004
Figure 5. Contribution percentage of incineration electricity to public electricity consumption in 2025 (a) and long-term incineration electricity generation potential from 2025 to 2050 in Java cities (b). Note: With regard to the forecast of future electricity generation, we assume the same incineration technology and MSW composition, since it is difficult to forecast future MSW composition and technological trends.
Sustainability 16 04140 g005
Table 1. Life cycle environmental impact of 100% incineration in Java, Indonesia, by 2025.
ADP Elements (kg Sb eq.)AP (kg SO2 eq.)EP (kg Phosphate eq.)FAETP (kg DCB eq.)GWP100 (kg CO2 eq.)
Total MSW in Java7.8 × 10−27.5 × 1021.4 × 102−2.0 × 1036.2 × 106
1 ton of MSW9.9 × 10−69.6 × 10−21.8 × 10−2−2.5 × 10−17.8 × 102
HTP (kg DCB eq.)MAETP (kg DCB eq.)ODP (kg R11 eq.)POCP (kg Ethene eq.)TETP (kg DCB eq.)
Total MSW in Java−6.9 × 10⁴−2.4 × 10⁸−2.5 × 10⁻⁸−1.0 × 1021.1 × 103
1 ton of MSW−8.7 × 100−3.0 × 10⁴−3.1 × 10⁻¹²−1.3 × 10−21.4 × 10−1
Table 2. The financial aspects of WtE incineration in the capital cities of Java, Indonesia.
ParametersJakarta Surabaya Semarang Bandung Yogyakarta Serang
Investment (USD)61,248,526 25,871,957 10,370,912 17,683,719 3,363,300 3,545,005
Operation and maintenance costs (USD/Year)39,743,488 16,788,025 6,729,570 11,474,769 2,517,241 2,300,314
Revenues average (USD/Year)28,704,337 20,594,349 5,920,753 7,241,727 1,437,873 2,215,221
NPV (USD)412,713,825 314,367,028 87,425,059 100,810,802 19,964,096 32,986,878
IRR (%) *36.6155.9143.5430.6829.9245.62
IRR (%) **37.2556.3744.0931.5329.9246.19
LCoE (USD/kWh) ***0.0470.0360.0430.0490.0510.041
LCoE (USD/kWh) ****0.0460.0360.0420.0490.0500.041
GHG reduction economical value (USD/Year) *****2,069,037267,584254,636701,211103,74470,121
* means IRR with trial discount rate until NPV equals zero. ** means IRR with formulation of NPV positive and NPV negative disparity. *** means LCoE with discounting method. **** means LCoE with annuitizing method. ***** means the potential economic benefit from GHG emission reduction between landfills and incineration in 2025, when carbon emissions is quantified economically based on carbon tax.
Disclaimer/Publisher’s Note: The statements, opinions and data contained in all publications are solely those of the individual author(s) and contributor(s) and not of MDPI and/or the editor(s). MDPI and/or the editor(s) disclaim responsibility for any injury to people or property resulting from any ideas, methods, instructions or products referred to in the content.

