
Analysis and Reflection on the Green, Low-Carbon, and Energy-Saving Design of the Super High-Rise Building


1
Welsh School of Architecture, Cardiff University, Cardiff CF10 3NB, UK
2
School of Architecture & Urban Planning, Shenzhen University, Shenzhen 518060, China
3
School of Materials Science and Engineering, Hainan University, Haikou 570228, China
4
College of Architecture and Urban Planning, Tongji University, Shanghai 200092, China
*
Authors to whom correspondence should be addressed.
Sustainability 2024, 16(10), 4146; https://doi.org/10.3390/su16104146
Submission received: 10 April 2024
/
Revised: 12 May 2024
/
Accepted: 13 May 2024
/
Published: 15 May 2024
Abstract
:Shanghai Tower has become a new landmark of Shanghai. In the current trend advocating green building and energy efficiency, considerations of wind loads and thermal characteristics of the perimeter structure of Shanghai Tower are crucial. This paper conducts comparative simulation studies on the wind environment of Shanghai Tower using Ecotect software, and stress analyses and thermal simulations of the perimeter structure using ANSYS software. The study compared three buildings’ surface wind pressure distributions using models with equal-volume and circular cross-sections. We found that the unique exterior design of the Shanghai Tower results in a more regular and uniform distribution of wind pressure on its surface compared to both circular and square planar models, with a lower average wind pressure value. In addition, the stress analysis results indicate significant differences in deformation and stress distribution between the windward and leeward sides. Enhancing the bending moment detection of the peripheral structure and optimizing the layout of detection points are recommended. Thermal simulation results show excessive heat conduction flux in winter conditions, suggesting optimization using passive energy-saving methods such as light-sensitive thermal insulation materials during winter. This research is a reference for designing other super-tall buildings prioritizing low-carbon energy efficiency and structural safety.
1. Introduction
As urbanization continues to progress, more and more high-rise buildings are emerging, and there is a growing emphasis on the energy efficiency of tall structures. With increasing building heights, a host of challenges also arise. As the height of buildings increases, a host of challenges arise. With taller buildings, it becomes crucial to address the significant increase in wind loads, coupled with the escalating energy consumption of buildings. Effective architectural design, characterized by streamlined shapes, can help reduce wind pressure and wind loads. It also promotes airflow inside and outside the building, facilitating natural ventilation and achieving energy-saving objectives. For relatively low-rise buildings, in addition to the consideration of high-rise buildings and building energy efficiency, the architectural shape of a city is also essential [1,2].
High-rise buildings generate significant carbon emissions during construction and operation, posing severe environmental and human health threats. Building material production, transportation, and construction phases consume large amounts of energy, releasing substantial greenhouse gases that exacerbate global climate change, leading to rising temperatures and increased extreme weather events. Additionally, pollutants emitted during construction, such as nitrogen oxides and particulate matter, pollute the air and impact the health of surrounding residents. Improper waste disposal also contributes to additional carbon emissions and environmental pollution. The high energy consumption and emissions from high-rise buildings further contribute to global energy shortages, driving unsustainable energy extraction and utilization practices [3,4]. Therefore, reducing carbon emissions from high-rise buildings is critically important. Measures such as using low-carbon materials, adopting energy-efficient technologies, and implementing carbon offsetting initiatives are essential to steer the construction industry towards a more environmentally friendly and sustainable path, safeguarding the Earth and human well-being.
Considering the importance of wind loads in the design of high-rise buildings holds significant implications for urban sustainability. Given the height and scale of high-rise structures, they are particularly susceptible to wind forces, making wind load a critical factor that must be carefully addressed. Thoroughly considering wind loads can enhance a building’s resilience and safety, ensuring stable operation during extreme weather conditions, reducing disaster risks, and safeguarding urban residents [5,6]. Additionally, scientifically designing building facades and ventilation systems contributes to optimizing energy usage, improving building efficiency, and promoting environmental sustainability in cities. The rational application of wind load principles also guides the selection of appropriate building materials and structural forms, enhancing a building’s wind resistance and durability, lowering maintenance costs, and elevating the overall quality and sustainability of urban architecture [7,8]. Therefore, giving due consideration to wind loads is essential in the design of high-rise buildings, with positive impacts on urban safety, energy efficiency, environmental conservation, and sustainable development.
The energy-efficient design of the external envelope structure of high-rise buildings is critical in reducing energy consumption and improving building efficiency. Energy loss can be minimized by controlling thermal bridging effects and using high-quality insulation materials and layers. Optimizing external wall insulation design and using energy-saving glass curtain walls effectively reduces heating in winter and cooling loads in summer, thereby reducing energy consumption. Additionally, integrating solar energy utilization systems and intelligent control systems and optimizing building form and orientation contribute to improving energy utilization efficiency and reducing energy consumption. By comprehensively applying these design measures, the energy consumption of the external envelope structure of high-rise buildings can be effectively reduced, promoting the development of buildings in a more sustainable direction [9,10].
The Shanghai Tower features a distinctive design with a continuous spiral appearance, which is unique and eye-catching. The building utilizes a double-layer curtain wall structure with built-in and air insulation layers to reduce energy consumption. Multiple wind tunnel tests were conducted during the design phase to optimize the structural design and ensure stability in high wind conditions. Advanced seismic dampening technology has been implemented to enhance earthquake resistance. Intelligent systems, including bright lighting, air conditioning, and energy management systems, have improved building comfort and energy efficiency. Overall, the Shanghai Tower embodies modern skyscrapers’ innovative and sustainable development principles. Previous research on the Shanghai Tower has mainly focused on its green and low-carbon design concept [11,12], structural seismic resistance [13,14], and intelligent operation and maintenance [15,16]. This study first employs numerical simulation to compare the form of the Shanghai Tower and assess its unique shape’s advantages in handling wind conditions. Additionally, stress analysis and heat transfer simulations of the Shanghai Tower’s external envelope structure are conducted to provide recommendations for structural maintenance and improvements of the curtain wall system from a low-carbon and sustainability perspective.
2. Material and Methods
2.1. Shanghai Tower
The Shanghai Tower is the tallest building in Shanghai, situated amidst the high-rises of the Lujiazui Financial Center. It occupies a total area of 433,954 square meters. With five basement floors, the tower rises to 128 floors, reaching a height of 632 m with a structural height of 580 m [17]. Vertically divided into nine zones, each zone features an atrium at its basement level. The floors serve various functions, including commercial complexes, offices, hotels, and observation decks. The construction took 9.5 years to complete and launched on 27 April 2016 [18] (Figure 1 and Figure 2). Its versatile design serves various functions, including offices, hotels, observation decks, and retail spaces. The tower’s structural integrity is fortified through a sophisticated system comprising a mega-frame core, exterior enclosure structure, and diagonal trusses, meticulously designed to maximize resistance against horizontal loads such as wind and seismic forces.
Multiple design departments submitted a design program, including the SOM architectural design firm from the United States, The KPF Architects, and the Shanghai Modern Architectural Design Group. The “dragon” program from the United States Gensler architectural design firm and the “steeple” program from the British Foster Construction Services were finalists [19]. After the selection, the “dragon” program won. The building details of the deepening of the design took the “dragon” program as a concept scheme, and the Tongji Architectural Design and Research Institute completed the construction map.
2.1.1. Shape Analysis
Shanghai Tower’s building geometry is divided into datum plane forming and actual elevation plane forming, and datum plane and plane grid forming is divided into the following steps (Figure 3):
- (1)
- Select WP1 on the plane, draw a 47,565 mm line from WP1 to determine the point WP2. Respectively, two rays are drawn from the two points WP1 and WP2, with an angle of 60 ° and 23.3°, and the intersection point is the point WP3;
- (2)
- Take point WP2 as the center and draw a 46.6° arc with a radius of 88,380 mm, and then take WP1 as the center and rotate the circular section 120° clockwise and counterclockwise to form three arcs;
- (3)
- Take the point WP3 as the center, and take R2 as the radius of the arc segment to determine the three small arcs and connect them to the large arc to form a triangular plane;
- (4)
- Take one-third of the radius from the midpoint of the arc, and make an angle of 95° symmetrically around the radius from the obtained point. Cut the small arc with the two sides of the angle to form a “V” mouth;
- (5)
- The complete reference plane profile is determined as shown in Figure 3.
As is shown in Figure 3, the overall geometrical form of the Tower Building in Shanghai Tower can be simply described via the following four control points (Figure 4):
- (1)
- Determine the dimensions of the four datum planes. According to the positioning principles and parameters given by the building, determine the ±0 m, 45 m, 605 m and 632 m elevation of the typical plane shape [20];
- (2)
- To determine the starting direction of the building rotation, rotate the “V” mouth of the ±0 m plane 50° clockwise from the south direction;
- (3)
- Determine the rotation angle. The total height of 632 m equals 632,000 copies, and each unit height of the building rotates at an angle of 120/605,000 = 0.000214286°, after which the overall rotation of the building itself is 135.429°. The rotation angle corresponds to elevation Z R = Z × 0.000214286°, as is shown in Figure 4.
2.1.2. Overview of Exterior Enclosure Structure
With the rapid development of architectural technology, the design of high-rise buildings has become increasingly complex, placing higher demands on materials and structures. The glass curtain wall support system of the Shanghai Tower is an excellent case study of an exterior enclosure structure, demonstrating how engineering design meets these requirements through innovation (Figure 5). We conducted a detailed study of its structural performance through theoretical derivation and assistance from ANSYS 2021R1 software, aiming to offer guidance and inspiration for the future design of similar structures.
The project adopts a double-skin curtain wall system as the main exterior enclosure structure. The double-skin curtain wall forms a buffer zone of approximately 60 m in each zone (14 floors), providing both a courtyard landscape for indoor users while reducing the impact of the outdoor environment on the indoor environment, thus reducing the load on air conditioning and heating [21] (Figure 6).
Consisting of inner and outer glass facades, the structure features a circular inner layer surrounded by a triangular outer layer. The spacing between the glass facades spans from 3 feet to 33 feet, providing space for the atrium while serving as an insulating layer akin to a thermos, diminishing the heating and cooling requirements of the total building [22] (Figure 7).
The first structural system: A 90 feet × 90 feet (approximately 27 m × 27 m) core column, constructed of reinforced concrete, offers vertical support.
The second structural system: A steel “mega-columns” ring encircles the reinforced concrete core column. These steel columns, connected to the ring via steel bearing brackets, support the building and resist lateral forces.
The third structural system: On every 14 floors, a two-story-high belt truss encircles the entire building, with each truss band marking the start of a new zone.
2.2. Methodology
In our study of the structural and environmental performance of the Shanghai Tower, we utilized three main simulation techniques: wind simulation, stress simulation, and heat transfer simulation. These simulations were conducted using numerical analysis methods known as Finite Element Analysis (FEM), allowing us to precisely predict and analyze the building’s behavior under various environmental and operational conditions.
Firstly, the wind simulation employed Computational Fluid Dynamics (CFD) technology, which is used to simulate the flow of fluids (such as air) around objects (like buildings). With the Autodesk Ecotect 2011 software, we conducted detailed analyses of wind pressure and velocity distribution on the surfaces of the Shanghai Tower. This simulation considered the unique geometric features of the building, including its height, corners, and curved surfaces, which significantly influence local wind patterns’ and pressure distribution. Through this analysis, we could predict the aerodynamic performance of the building under strong wind conditions, guiding architectural design to reduce wind loads and optimize ventilation [23].
Next, stress simulation was conducted using ANSYS software, applying finite element methods to assess structural stress responses under physical loads. This involved detailed inputs of material properties, such as elastic modulus, Poisson’s ratio, and actual loads like gravity and wind pressure. The stress simulation helped us identify stress distribution in critical structural components and potential weaknesses, ensuring structural safety and durability in design [24].
Lastly, heat transfer simulation, also utilizing ANSYS software, focused on the thermal performance of the building, particularly concerning its double-layer curtain wall system. By simulating various indoor and outdoor temperature conditions, we analyzed heat flow, temperature distribution, and heat transfer efficiency to evaluate the building’s energy performance. Heat transfer simulation is essential for optimizing the configuration of heating, ventilation, and air conditioning (HVAC) systems in buildings, particularly in extreme climate conditions, to reduce energy consumption and enhance comfort in living and working environments [25].
2.2.1. Analytical Modeling
During the wind simulation process for the Shanghai Tower, we first used Rhino 7.0 software to accurately construct a three-dimensional model of the building, ensuring it included all key external shapes and structural features. After simplifying and optimizing the model to meet the requirements of Computational Fluid Dynamics (CFD) analysis, it was imported into Ecotect software for detailed analysis of wind pressure and velocity distribution. By setting different wind directions and speeds, this simulation helped us assess and optimize the building design to reduce wind loads and improve its environmental adaptability.
For stress and heat transfer simulations, we directly built the model using ANSYS software, inputting the building’s basic geometric shape and structural dimensions. By defining detailed material properties and loading boundary conditions, the model was prepared for accurate finite element analysis (Figure 8). Following detailed meshing, the stress simulation helped us evaluate the structure’s safety and stability, while the heat transfer simulation provided insights into the building’s thermal efficiency and energy performance, which are essential factors in optimizing architectural design.
2.2.2. Material Components
The primary materials used in this study are glass, aluminum alloy, and steel. Each material possesses specific physical and mechanical properties crucial in model construction and simulation.
Glass: Glass is a brittle material known for its transparency and heat resistance. The glass used in the model is highly transparent and is primarily employed in the building’s curtain wall system. Its mechanical properties include compressive strength, tensile strength, and elastic modulus. Additionally, factors such as the thermal conductivity and coefficient of thermal expansion of glass were carefully considered during the simulation. The composition and structural design of the glass adhere to relevant architectural standards and regulations to ensure model accuracy [26].
Aluminum alloy: Aluminum alloy is widely used in building structures due to its lightweight nature, high strength, and corrosion resistance. This study primarily uses aluminum alloy for curtain wall supports and connectors. Its characteristics include high elastic modulus and low density, contributing to the model’s light weight and stability. The composition and mechanical properties of the aluminum alloy were calibrated according to current building codes to ensure simulation accuracy [27].
Steel: Steel is a high-strength material commonly used in building structures for frames and support systems. The steel used in the model exhibits high tensile strength and toughness, enabling the model to withstand significant loads. Considerations for steel’s thermal conductivity and coefficient of thermal expansion were also incorporated into the simulation. The mechanical properties of steel directly influence the structural stability and durability of the model during simulation [28].
2.2.3. Simulation Method and Mesh Size
- Wind Simulation
The study primarily focused on simulating the wind environment around the Shanghai Tower, analyzing parameters such as wind speed and pressure to assess the building’s performance under different wind directions and speeds. This simulation approach helps understand the high-rise building’s behavior in wind conditions and aids in optimizing architectural design.
The grid size used for wind simulation was set at 0.5 m × 0.5 m. This grid size is commonly employed when simulating wind environments around large-scale buildings. The larger mesh size ensures computational efficiency while providing sufficient detail to analyze wind speed and pressure distribution.
- Heat Transfer Simulation
The study employed steady-state heat transfer analysis, focusing primarily on heat transfer and temperature distribution under indoor and outdoor conditions. Steady-state heat transfer simulation is characterized by high computational efficiency and model stability. It explicitly examines the building’s heat transfer and temperature distribution under given temperature conditions without considering time variations. This approach is commonly used in heat transfer simulations, particularly for analyzing the thermal properties of buildings.
The reason for using steady-state heat transfer simulation is its applicability in assessing the long-term thermal performance of building designs under specific environmental conditions. The system assumes a constant thermal state in steady-state heat transfer analysis, indicating that heat transfer reaches equilibrium with no time-varying heat flow. This assumption is particularly suitable for analyzing buildings’ thermal resistance and efficiency because these systems are typically designed to achieve thermal balance under unchanging environmental conditions. Therefore, this study adopts steady-state heat transfer simulation. Steady-state simulation is computationally more straightforward and faster, which is especially important for large-scale projects such as the Shanghai Tower, where a wide range of structures and systems require evaluation. By reducing computational resources and time, steady-state simulation enables us to assess the thermal performance of design schemes more efficiently, thereby optimizing building energy use and indoor comfort [29,30].
The grid size for the heat transfer simulation was set at 0.1 m × 0.1 m. This relatively smaller mesh size allows for more precise simulation results, aiding in capturing detailed heat transfer and temperature distribution. Smaller mesh sizes enhance computational accuracy, especially when simulating heat transfer processes in complex structures.
3. Simulation Analysis
3.1. Analysis of Wind Environment
3.1.1. Program Comparison
As the Shanghai Tower is unique in shape, it can reduce the wind pressure on the building surface [31]. In this paper, the actual building model of Shanghai Tower is set as Program A, and the cylindrical model of the square cross-section is set as Program B. Program C is a cylindrical model with a circular cross-section. As is shown in Figure 9, the three programs are equal in terms of cross-sectional area at any height. This ensures that the model volumes of the three programs are consistent. Figure 10 shows an axonometric diagram of the three scenario models.
Due to the symmetry of Program A, when considering its ventilation, only the positive wind direction and diagonal wind direction, that is, the southerly and southeasterly wind, need to be considered, as is shown in Figure 11. The arrows in the diagram mean the wind direction.
In Program B, the model’s cross-sectional shape is circular and symmetrical, and only one wind direction needs to be considered. Therefore, as shown in Figure 12, only the southerly wind is considered.
Taking into account that the outline of Program C is unique in the course of comparative research, in order to avoid the significant difference that may occur due to the differences in the shape, different directions (See Figure 13, the direction of the blue arrow is the wind direction) are considered in ventilation performance [32,33].
3.1.2. Simulation Results
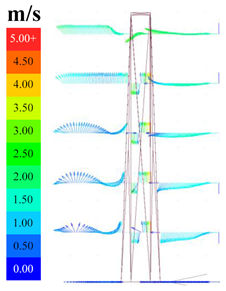
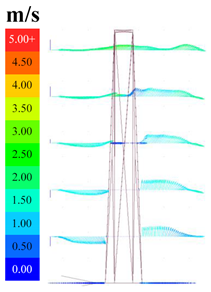
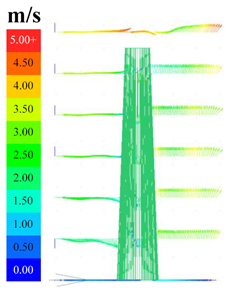
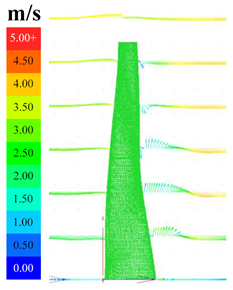
Regarding the outcomes of the wind simulation, we analyze the wind speed distribution and wind pressure distribution from different heights of horizontal sections and side views [34]. For Model A, the distribution of wind speeds at heights of 100 m, 200 m, 300 m, 400 m, 500 m, and 600 m is shown in the figures. At each height, the wind speed close to the building is comparatively low, and an area with slower winds forms on the leeward side. The larger the section, the larger the area of low wind speed.
As shown in Table 2, Table 3, Table 4, Table 5, Table 6, Table 7, Table 8, Table 9, Table 10, Table 11, Table 12, Table 13, Table 14, Table 15 and Table 16, for both southerly and southeasterly wind directions, all three models demonstrate that with increasing height, the overall wind speed and wind pressure continue to grow; meanwhile, the cross-sectional area of the buildings decreases, resulting in reduced obstruction to the wind.
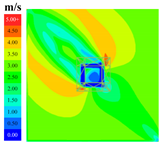
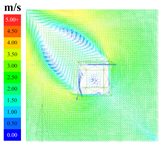
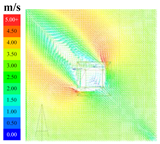
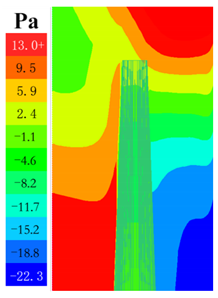
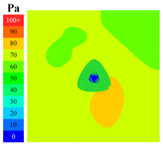
Table 2, Table 3 and Table 4 show that in the southerly wind direction, Model A exhibits a relatively small elliptical area of lower wind speed and lower wind pressure on the leeward side. A circular area of higher wind pressure is seen on the windward side with a square cross-section. Naturally, as the height increases, the windward area of the building decreases, and the area of higher wind speed also decreases. Additionally, on either side of the windward face, two triangular regions of higher wind speed are generated [35,36].
In Table 5, Table 6 and Table 7, Model A features a windward face corresponding to a corner of the square cross-section for the southeasterly wind direction, with the negative pressure area on the leeward side divided into two elongated segments. A circular area of higher wind pressure is also seen on the windward face. As with the southerly wind direction, the windward area of the building decreases with increasing height, resulting in a reduction in the area of higher wind speed. Similarly, two triangular regions of higher wind speed are generated on either side of the windward face [37].
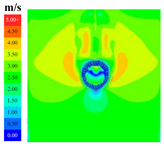
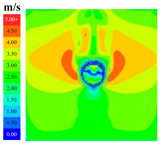
As shown in Table 8, Table 9 and Table 10, two curved regions with reduced wind velocities are found on the sheltered side of the circular cross-section. Furthermore, a circular zone with elevated wind pressure is observed on the windward side. With increasing height, the windward area and the region of higher wind speeds decrease. Two triangular areas with higher wind speeds are generated on both sides of the windward side [38,39].
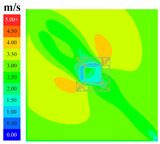
As shown in Table 11, Table 12 and Table 13, for Model C in the southerly wind direction, there is a small area of lower wind speed in the triangular cross-section, with a smaller area than the other two models. On the windward face, there is also a circular area of higher wind pressure, which is more minor in area compared to the other two models. Additionally, two triangular regions of higher wind speed are generated on either side of the windward face [40,41].
In Table 14, Table 15 and Table 16, the windward face corresponds to a corner of the triangular cross-section for the southeast wind direction, with the negative pressure area on the leeward side divided into two narrow segments. However, this area is smaller than the negative pressure area of the square cross-section. A circular area of higher wind pressure is also seen on the windward face. Naturally, as the height increases, the windward area of the building decreases, resulting in a reduction in the area of higher wind speed. Similarly, two triangular regions of higher wind speed are generated on either side of the windward face [42,43].
3.2. Analysis of Exterior Enclosure Structure
To analyze the stress situation of the glass curtain wall support system, the following assumptions were made:
- (1)
- Geometric simplification of the curtain wall support system. The entire curtain wall support system is simplified to a circular ring structure with a radius of 50 m. This ring represents the centerline of the ring beam, which is the main structure supporting the curtain wall;
- (2)
- Distribution of structural supports. Structural supports, both vertical and radial, are considered to be evenly spread across the entirety of the ring structure. A horizontal radial steel pipe support is set every 8 to 10 m along the circumferential direction, and a total of 25 radial supports connect the curtain wall to the main floor structure [44,45];
- (3)
- Material properties. The entirety of the support structure is constructed from steel, featuring a modulus of elasticity measuring 206 GPa and a coefficient of thermal expansion of 12 × 10−6/°C [46];
- (4)
- Types of loads. Wind loads are considered uniformly distributed loads. Wind tunnel test results show that the maximum negative wind pressure reaches 6.5 kN/m². In addition, the weight of the glass curtain wall is also considered, with a plate weight of 1.2 kN/m² [47];
- (5)
- Connection method. All connections are assumed to be fixed, meaning that the interaction between support structures can transmit forces and moments.
We used ANSYS software to establish the geometric model, set material parameters, and divide the mesh. After setting reasonable constraints and loads, we obtained calculation results regarding deformation and stress. There are three main operating conditions: static wind state, wind pressure of 60 kN/m², and wind pressure of 120 kN/m². The parameters of interest include deformation, strain, stress, and support axial force, and for the critical radial supports, the distribution of bending moments along the axis is also provided [48,49].
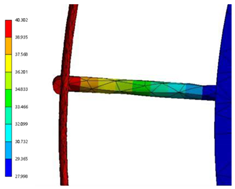
As shown in Table 17 and Table 18, the numerical simulation shows that the maximum displacement occurs at the ring beam, measuring 2 cm. The maximum stress appears at the inner fixed end of the radial support, measuring 69 MPa, which is below the yield stress of the structural steel, indicating that the structural form is safe.
After applying horizontal wind loads, a difference in deformation between the windward and leeward sides is observed. Taking the condition with a wind pressure of 60 kN/m² as an example, the deformation of the support system corresponding to the leeward side (affected by negative wind pressure) is more significant, reaching a maximum of 2.2 cm. Conversely, the deformation observed in the support system on the windward side (influenced by positive wind pressure) is comparatively minor, reaching a maximum of 1.8 cm. The stress situation remains, with the maximum stress occurring at the fixed end of the radial support, measuring 72 MPa, which is still within the normal range of structural steel usage.
Likewise, for the condition with a wind pressure of 120 kN/m², the deformation of the support system corresponding to the leeward side (affected by negative wind pressure) is more significant, reaching a maximum of 2.35 cm. Meanwhile, the support system’s deformation on the windward side (influenced by positive wind pressure) is lower, reaching a maximum of 2.09 cm. The stress situation remains, with the maximum stress occurring at the fixed end of the radial support, measuring 75 MPa, which is still within the normal range of structural steel usage [50,51].
An analysis of bending moments’ distribution along their axial direction is conducted for the critical radial supports. Measurement points are arranged on a particular radial support, with a spacing of 1 m, to analyze the internal force situation of each cross-section. This approach is utilized to examine the stress state of the radial supports meticulously. The locations of the measurement points are illustrated in Figure 14.
The data presented in Table 19 show the distribution of axial force and bending moments of radial supports under different scenarios. These data can be utilized to optimize the structure, as the distribution of internal forces along the axial direction varies, and their fatigue states under load conditions also differ. More economically efficient judgments can be made during subsequent maintenance and monitoring processes, focusing on regions with higher internal forces. Figure 15 provides a graphical representation of the data from Table 19. It is noteworthy that even with the application of wind loads, the distribution of internal forces remains essentially unchanged compared to the static wind condition. The three curves in the graph almost overlap, indicating minimal change. To highlight these variations, Figure 15b,d illustrate the rate of change. It can be observed that the rate of increase in internal force due to wind loads is 0.59% for axial force, with similar increments across different wind pressures within the considered range. For bending moment, the rates of increase are 0.84% and 1.24%, respectively, indicating varying degrees of increase under different wind pressures. This suggests that wind loads have minimal impact on the distribution of internal forces in the glass curtain wall support system, with gravitational loads being the primary influence. Moreover, bending moment is more sensitive to variations in wind pressure than axial force, emphasizing the need to carefully monitor bending moment changes during subsequent inspections [52,53].
In practice, it is advisable to monitor the internal forces of radial supports, particularly focusing on monitoring changes in bending moment to prevent unexpected deformations or defects in regions with higher bending moments near the fixed ends. The detailed simulation of bending moments presented in this study can assist in reducing the total number of monitoring points and lowering maintenance costs [54,55].
Regarding the axial force distribution of the vertical supports illustrated in Figure 16, it becomes apparent that the farther down the position, the higher the axial force. This conclusion can guide the subsequent inspection process, emphasizing the connection points between the vertical supports and the ring beam. In contrast, the influence of wind loads on the vertical supports is insignificant. It remains crucial to monitor any alterations in the load-bearing condition of the support system amidst extreme weather conditions [56,57].
The XY-axis diagram mentioned can be interpreted as follows: the X-direction represents the outward radial direction, while the Y-direction represents the tangential direction. It illustrates that under the influence of the glass curtain wall and wind loads, the vertical supports’ bending moment distribution is more complex than the radial supports’. Therefore, special attention is required during monitoring (Figure 17 and Figure 18) [58].
3.3. Heat Transfer Simulation
For the glass curtain wall support system of the Shanghai Tower, due to the considerable distance between the inner and outer layers, there may be a temperature difference between the interior and exterior curtain walls, resulting in heat transfer processes that can affect the support system [59]. This section utilizes the steady-state heat analysis of the CFD fluid simulation module in ANSYS to conduct detailed thermal conductivity simulations of the support system.
This simulation utilizes steady-state heat transfer analysis, focusing exclusively on temperature distribution and heat transfer processes within a glass curtain wall system under varying indoor and outdoor temperatures, without considering time-dependent factors. The choice of this method is based on its computational efficiency, model stability, and the ability to control model complexity effectively. Compared to dynamic heat transfer analysis, steady-state heat transfer analysis offers advantages in computational speed and model stability, making it the optimal approach for studying the thermal characteristics of the Shanghai Tower’s glass curtain wall (Table 20).
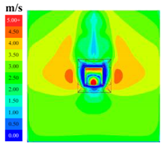
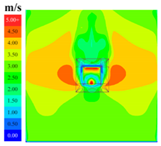
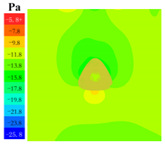
The results of steady-state heat transfer analysis can be employed to optimize building design. The research findings can guide the building’s energy efficiency and temperature control by simulating heat transfer under indoor and outdoor conditions. For example, during winter, the simulation results indicate a significant increase in heat flow due to conduction, suggesting additional energy-saving measures are needed. In contrast, heat flow through conduction is relatively lower during summer, indicating easier temperature control. Through steady-state heat transfer analysis, researchers can accurately assess the building’s performance under diverse temperature conditions and provide optimization recommendations.
For the climatic conditions corresponding to the Shanghai Tower’s geographical location, the outdoor temperature is maintained at 5 °C, while the indoor temperature is set to 28 °C. In contrast, during summer, the outdoor temperature is adjusted to 40.3 °C, while the indoor temperature remains constant at 28 °C [60].
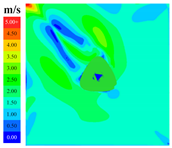
As shown in Table 21, the heat flux conductivity in winter conditions is significantly higher, close to twice that of summer conditions. Therefore, more energy-saving measures are needed in winter. Meanwhile, the difference in heat conduction in the radial support section is insignificant, so only considering heat exchange with the air environment is sufficient [61].
Through thermal simulation under different environmental conditions, the glass curtain wall design can be optimized. When environmental factors change, the material parameters of the glass can be adjusted accordingly. For the existing Shanghai Tower glass curtain wall system, considering the high heat exchange in winter, photosensitive heat-insulating materials can be installed on the inner wall surface of the glass curtain wall to improve the overall green and low-carbon characteristics of the building through passive energy-saving methods [62,63].
4. Limitations of the Study and Future Research
In our simulation study of the Shanghai Tower structure, certain limitations could affect the accuracy and comprehensiveness of the results: The simulation may not fully account for initial material defects such as micro-cracks, stress concentrations, and other material imperfections, which could impact the accuracy of the results. The focus of the study primarily revolves around the glass curtain wall system of the high-rise building without encompassing the entire structure. In some instances, expanding the scope of the study may be necessary in order to include other parts of the building.
In response to the mentioned limitations, future research can delve deeper into exploration in the following areas: Firstly, there could be a more detailed analysis of materials. Future studies can thoroughly analyze and test the microstructural characteristics of building materials, such as using advanced microscopy techniques to identify and quantify material defects like microcracks and voids. This will aid in more accurately assessing material behavior, especially under extreme loading conditions. Secondly, comprehensive structural simulations could be expanded. Research directions should not only focus on glass curtain wall systems, but should encompass all critical structural components of the entire building. Through holistic structural simulations, the overall performance and safety of the building can be more comprehensively evaluated, ensuring design reliability and durability.
5. Conclusions
This study compares the energy performance of the Shanghai Tower with a circular cross-section model of equal area. Programs A, B, and C were developed using the tower’s volume and height, accounting for potential environmental conditions using meteorological data and field conditions in Shanghai. Computational Fluid Dynamics software Ecotect was employed to simulate various wind scenarios encountered by the model.
The analysis of wind pressure distributions across different models reveals distinct characteristics in airflow patterns. Conversely, Program A shows more regular distributions, especially under southerly and southeasterly winds, signifying varied ventilation in different wind environments. Program B, with solid symmetry, maintains consistent wind environments in all directions, featuring regular pressure distributions. Model C exhibits irregular surface wind pressure distribution due to its unique shape, although the distributions across different directions are similar.
Considering the ventilation performance of three programs in different wind directions, the average positive wind pressure of Program B is 3.670159768 Pa, and the average positive wind pressure of Program C is 3.677149244 Pa. The average positive wind pressure of the two programs is close to only 0.19%. The two programs are likely to have the same performance. The average positive wind pressure of program B is 4.147715 Pa. In comparison, Program C’s average positive wind pressure is lower than Program A’s by 11.35%, which means that the Shanghai Tower adopts the average stream-lined shape. The positive wind pressure and the average positive wind pressure of the circular cross-section model with equal cross-sectional area are almost the same, and are 11.35% lower than the average positive wind pressure of the square cross-section model with equal cross-sectional area.
The analysis and thermal simulation results conducted using ANSYS software show that the peripheral support system of the Shanghai Tower’s glass curtain wall maintains structural integrity and stability under maximum wind pressure. Maximum displacements and stresses are within safe limits, ensuring structural safety. Deformation and stress distribution analyses reveal significant differences between the windward and leeward sides, especially at radial support points. It is recommended that the variation of bending moments at these points be monitored to prevent unexpected deformations or defects in the structure. Additionally, optimizing the placement of monitoring points is advised to reduce maintenance costs.
The thermal simulation reveals that heat flux conductivity during winter significantly exceeds that of summer, indicating the necessity for additional energy-saving measures. For the existing Shanghai Tower, it is recommended to implement passive energy-saving techniques like photochromic insulation materials during winter to enhance the building’s green and low-carbon attributes. These analyses and simulations offer valuable insights for optimizing the energy performance of high-rise buildings, demonstrating a design ethos that prioritizes structural safety and energy efficiency.
Author Contributions
Conceptualization, P.Y. and L.Y.; methodology, Y.L. and H.C.; software, Y.L. and H.C.; formal analysis, Y.L. and H.C.; investigation, Y.L. and H.C.; resources, P.Y. and L.Y.; data curation, P.Y. and L.Y.; writing—original draft preparation, Y.L. and H.C.; writing—review and editing, P.Y. and L.Y.; visualization, Y.L. and H.C.; supervision, P.Y. and L.Y.; project administration, P.Y. and L.Y. All authors have read and agreed to the published version of the manuscript.
Funding
This research received no external funding.
Institutional Review Board Statement
Not applicable.
Informed Consent Statement
Not applicable.
Data Availability Statement
Data are contained within the article.
Conflicts of Interest
The authors declare no conflicts of interest.
References
- Sha, H.; Qi, D. A review of high-rise ventilation for energy efficiency and safety. Sustain. Cities Soc. 2020, 54, 101971. [Google Scholar] [CrossRef]
- Chen, H.; Yang, L. Spatio-Temporal Experience of Tour Routes in the Humble Administrator’s Garden Based on Isovist Analysis. Sustainability 2023, 15, 12570. [Google Scholar] [CrossRef]
- Mostafavi, F.; Tahsildoost, M.; Zomorodian, Z. Energy efficiency and carbon emission in high-rise buildings: A review (2005–2020). Build. Environ. 2021, 206, 108329. [Google Scholar] [CrossRef]
- Pan, W.; Pan, M. A dialectical system framework of zero carbon emission building policy for high-rise high-density cities: Perspectives from Hong Kong. J. Clean. Prod. 2018, 205, 1–13. [Google Scholar] [CrossRef]
- Gerasimidis, S.; Ellingwood, B. Twenty years of advances in disproportionate collapse research and best practices since 9/11/2001. J. Struct. Eng. 2023, 149, 02022002. [Google Scholar] [CrossRef]
- Meng, B.; Xiong, Y.; Zhong, W.; Duan, S.; Li, H. Progressive collapse behaviour of composite substructure with large rectangular beam-web openings. Eng. Struct. 2023, 295, 116861. [Google Scholar] [CrossRef]
- Madenci, E.; Fayed, S.; Mansour, W.; Özkılıç, Y.O. Buckling performance of pultruded glass fiber reinforced polymer profiles infilled with waste steel fiber reinforced concrete under axial compression. Steel Compos. Struct. Int. J. 2022, 45, 653–663. [Google Scholar]
- Fayed, S.; Badr el-din, A.; Basha, A.; Mansour, W. Shear behavior of RC pile cap beams strengthened using ultra-high performance concrete reinforced with steel mesh fabric. Case Stud. Constr. Mater. 2022, 17, e01532. [Google Scholar] [CrossRef]
- Mirrahimi, S.; Mohamed, M.F.; Haw, L.C.; Ibrahim NL, N.; Yusoff WF, M.; Aflaki, A. The effect of building envelope on the thermal comfort and energy saving for high-rise buildings in hot–humid climate. Renew. Sustain. Energy Rev. 2016, 53, 1508–1519. [Google Scholar] [CrossRef]
- Saroglou, S.; Meir, I.A.; Theodosiou, T. Energy Efficiency of a High-Rise Office Building in the Mediterranean Climate with the Use of Different Envelope Scenarios. In Smart and Sustainable Cities and Buildings; Springer: Berlin/Heidelberg, Germany, 2020; pp. 651–661. [Google Scholar]
- Zhang, H.; Zhou, X.F. Application of green building technology in Shanghai Tower. Sichuan Archit. Sci. Res. 2014, 40, 277–278. [Google Scholar]
- Gu, J.P. Shanghai Tower, ultra-high green building. Constr. Technol. Dev. 2015, 42, 19–21. [Google Scholar]
- Qi, X.Y.; Zhao, X.; Zhang, P.P.; Ding, J.M.; Nao, S. Study on vertical deformation effect of Shanghai Tower structure. J. Build. Struct. 2011, 32, 15–21. [Google Scholar]
- Wu, Z.K.; Zhao, L.; Zhu, L.D. Observational analysis of the environmental wind characteristics of the Shanghai, World Financial Center Project site. Struct. Eng. 2009, 25, 98–103. [Google Scholar]
- Tang, Y.; Zhao, X. 121-story Shanghai Center Tower foundation re-analysis using a compensated pile foundation theory. Struct. Des. Tall Spec. Build. 2014, 23, 854–879. [Google Scholar] [CrossRef]
- Wang, W.D.; Li, Y.H.; Wu, J.B. Field loading tests on large diameter and super-long bored piles of Shanghai Center Tower. Chin. J. Geotech. Eng. 2011, 33, 1817–1826. [Google Scholar]
- Gong, J.; Zhou, H. Key Technology of Structural Construction of Shanghai Tower. Construction 2014, 36, 91–101. [Google Scholar]
- Wu, J.; Xu, H.; Zhang, Q. Dynamic performance evaluation of Shanghai Tower under winds based on full-scale data. Struct. Des. Tall Spec. Build. 2019, 28, e1611. [Google Scholar] [CrossRef]
- Zhang, Y.; Altan, H. A comparison of the occupant comfort in a conventional high-rise office block and a contemporary environmentally-concerned building. Build. Environ. 2011, 46, 535–545. [Google Scholar] [CrossRef]
- Tang, Q. New Civil Building Energy Efficiency Assessment Method Research. Ph.D. Thesis, Wuhan University of Science and Technology, Wuhan, China, 2013. [Google Scholar]
- Ding, D.M.; Nao, S.; Zhao, X.; Wu, H.L. Some key problems in the structural analysis of Shanghai Tower. J. Build. Struct. 2010, 31, 122–131. [Google Scholar]
- Zhao, X.; Ding, J.M.; Sun, H.H.; Nao, S. Structural wind resistance design of Shanghai Tower. J. Build. Struct. 2011, 32, 1–7. [Google Scholar]
- Tominaga, Y. Flow around a high-rise building using steady and unsteady RANS CFD: Effect of large-scale fluctuations on the velocity statistics. J. Wind. Eng. Ind. Aerodyn. 2015, 142, 93–103. [Google Scholar] [CrossRef]
- Feng, C.; Gu, M. Numerical simulation of wind veering effects on square-section super high-rise buildings under various wind directions. J. Build. Eng. 2021, 44, 102954. [Google Scholar] [CrossRef]
- Das, A.; Maity, D.; Bhattacharyya, S.K. Investigation on the efficiency of deep liquid tanks in controlling dynamic response of high-rise buildings: A computational framework. Structures 2022, 37, 1129–1141. [Google Scholar] [CrossRef]
- Li, S.; Chen, S. Field monitoring and prediction on temperature distribution of glass curtain walls of a super high-rise building. Eng. Struct. 2022, 250, 113405. [Google Scholar] [CrossRef]
- Xie, J. Research on characteristics and quality defects of aluminum molds in high-rise buildings. In Structural Seismic and Civil Engineering Research; CRC Press: Boca Raton, FL, USA, 2023; pp. 417–423. [Google Scholar]
- Gong, J.; Fang, T.; Zuo, J. A review of key technologies development of super high-rise building construction in China. Adv. Civ. Eng. 2022, 2022, 5438917. [Google Scholar] [CrossRef]
- Ahmadi, J.; Mahdavinejad, M.; Larsen, O.K.; Zhang, C.; Zarkesh, A.; Asadi, S. Evaluating the different boundary conditions to simulate airflow and heat transfer in Double-Skin Facade. In Building Simulation; Tsinghua University Press: Beijing, China, 2022; pp. 1–17. [Google Scholar]
- Jiru, T.E.; Tao, Y.X.; Haghighat, F. Airflow and heat transfer in double skin facades. Energy Build. 2011, 43, 2760–2766. [Google Scholar] [CrossRef]
- Yang, L.; Li, Y. Low-carbon city in China. Sustain. Cities Soc. 2013, 9, 62–66. [Google Scholar] [CrossRef]
- Vakili-Ardebili, A.; Boussabaine, A.H. Ecological building design determinants. Archit. Eng. Des. Manag. 2010, 6, 111–131. [Google Scholar] [CrossRef]
- Dong, J.G.; Yan, Z.F.; Cao, J.J. The level and change of indoor and outdoor particulate concentration in Xi’an high-rise apartment. Sci. Technol. Rev. 2012, 6, 42–45. [Google Scholar]
- Yang, L.; Liu, X.; Qian, F. Research on water thermal effect on surrounding environment in summer. Energy Build. 2020, 207, 109613. [Google Scholar] [CrossRef]
- Iqbal, Q.M.Z.; Chan, A.L.S. Pedestrian level wind environment assessment around group of high-rise cross-shaped buildings: Effect of building shape, separation and orientation. Build. Environ. 2016, 101, 45–63. [Google Scholar] [CrossRef] [PubMed]
- Wang, H.; Li, X.J.; Han, H. Numerical analysis of the influence of plane layout on wind environment of high-rise buildings. Architecture 2011, s1, 1423–1426. [Google Scholar]
- Li, Y.; Chen, L. Study on the influence of voids on high-rise building on the wind environment. Build. Simul. 2020, 13, 419–438. [Google Scholar] [CrossRef]
- Li, W.; Xie, L.; He, X.; Li, J.; Tu, K.; Wei, L.; Wu, J.; Guo, Y.; Ma, X.; Zhang, P.; et al. Diagnostic and prognostic implications of microRNAs in human hepatocellular carcinoma. Int. J. Cancer 2008, 123, 1616–1622. [Google Scholar] [CrossRef] [PubMed]
- Chau, C.K.; Tse, M.S.; Chung, K.Y. A choice experiment to estimate the effect of green experience on preferences and willingness-to-pay for green building attributes. Build. Environ. 2010, 45, 2553–2561. [Google Scholar] [CrossRef]
- Sun, D.; Xu, J.; Zhao, J.; Zhang, D.; Chen, K. Study on a new model for urban residential quarter of 21st century. J. Univ. Shanghai Sci. Technol. 2000, 22, 347–351. [Google Scholar]
- Kelly, D.; Poon, D.; Irwin, P.; Xie, J. Wind engineering of the Shanghai center tower. In Advances in Hurricane Engineering: Learning from Our Past; ASCE: Reston, VA, USA, 2013; pp. 426–436. [Google Scholar]
- Qian, F. The potential of a retractable roof of the natatorium on the indoor environmental improvement: Taking Jiading natatorium of Tongji University as an example. Indoor Built Environ. 2023, 32, 1505–1515. [Google Scholar] [CrossRef]
- Zeng, R.; Wang, X.; Di, H.; Jiang, F.; Zhang, Y. New concepts and approach for developing energy efficient buildings: Ideal specific heat for building internal thermal mass. Energy Build. 2011, 43, 1081–1090. [Google Scholar] [CrossRef]
- Zhang, F.L.; Xiong, H.B.; Shi, W.X.; Ou, X. Structural health monitoring of Shanghai Tower during different stages using a Bayesian approach. Struct. Control Health Monit. 2016, 23, 1366–1384. [Google Scholar] [CrossRef]
- Li, Y.; Chen, L. A study on the database of modular façade retrofitting building envelope. Energy Build. 2020, 214, 109826. [Google Scholar] [CrossRef]
- Su, J.Z.; Xia, Y.; Chen, L.; Zhao, X.; Zhang, Q.L.; Xu, Y.L.; Ding, J.M.; Xiong, H.B.; Ma, R.J.; Lv, X.L.; et al. Long-term structural performance monitoring system for the Shanghai Tower. J. Civ. Struct. Health Monit. 2013, 3, 49–61. [Google Scholar] [CrossRef]
- Pan, Y.; Ventura, C.E.; Xiong, H.; Zhang, F.L. Model updating and seismic response of a super tall building in Shanghai. Comput. Struct. 2020, 239, 106285. [Google Scholar] [CrossRef]
- Albadrani, A.M.; Almutairi, D.A. Studying the Compressed Mechanical Characteristics of a Novel Carbon-Free Plaster Using ANSYS Software. Buildings 2023, 13, 2871. [Google Scholar] [CrossRef]
- Yaylacı, M.; Öner, E.; Birinci, A. Comparison between analytical and ANSYS calculations for a receding contact problem. J. Eng. Mech. 2014, 140, 04014070. [Google Scholar] [CrossRef]
- Şentürk, A.; Işık, H.; Evci, C. Thermo-mechanically coupled thermal and stress analysis of interior ballistics problem. Int. J. Therm. Sci. 2016, 104, 39–53. [Google Scholar] [CrossRef]
- Punarselvam, E.; Sikkandar, M.Y.; Bakouri, M.; Prakash, N.B.; Jayasankar, T.; Sudhakar, S. Different loading condition and angle measurement of human lumbar spine MRI image using ANSYS. J. Ambient. Intell. Humaniz. Comput. 2021, 12, 4991–5004. [Google Scholar] [CrossRef]
- Wu, Y.; Sheng, Y.; Wang, Y.; Jin, H.; Chen, W. Stresses and deformations in a buried oil pipeline subject to differential frost heave in permafrost regions. Cold Reg. Sci. Technol. 2010, 64, 56–261. [Google Scholar] [CrossRef]
- Taskaya, S.; Taskaya, S. Mapping of Stress Distributions of Hangar Roof Systems in Ansys Software. Int. J. Adv. Eng. Res. Dev. 2019, 6, 82–89. [Google Scholar]
- Shokrieh, M.M.; Rezaei, D. Analysis and optimization of a composite leaf spring. Compos. Struct. 2003, 60, 317–325. [Google Scholar] [CrossRef]
- Gavryushin, S.S.; Skvortsov, P.A. Evaluation of output signal nonlinearity for semiconductor strain gage with ANSYS software. Solid State Phenom. 2017, 269, 60–70. [Google Scholar] [CrossRef]
- Toparli, M.; Sen, F.; Culha, O.; Celik, E. Thermal stress analysis of HVOF sprayed WC–Co/NiAl multilayer coatings on stainless steel substrate using finite element methods. J. Mater. Process. Technol. 2007, 190, 26–32. [Google Scholar] [CrossRef]
- Wu, J.; Hu, N.; Dong, Y.; Zhang, Q.; Yang, B. Wind characteristics atop Shanghai Tower during typhoon Jongdari using field monitoring data. J. Build. Eng. 2021, 33, 101815. [Google Scholar] [CrossRef]
- Zhang, T.; Cao, D. Simulation study on the influence of fire partition on curtain wall temperature in super high-rise buildings in China. Complexity 2021, 2021, 4124049. [Google Scholar] [CrossRef]
- Yin, R.; Xu, P.; Shen, P. Case study: Energy savings from solar window film in two commercial buildings in Shanghai. Energy Build. 2012, 45, 132–140. [Google Scholar] [CrossRef]
- El Nakla, M. Forced convection heat transfer in two-dimensional ribbed channels with varying heat flux profiles using ANSYS’ software and modeling. Arab. J. Sci. Eng. 2014, 39, 2157–2164. [Google Scholar] [CrossRef]
- Liang, J.Z.; Li, F.H. Simulation of heat transfer in hollow-glass-bead-filled polypropylene composites by finite element method. Polym. Test. 2007, 26, 419–424. [Google Scholar] [CrossRef]
- Steiner, T.R. High temperature steady-state experiment for computational radiative heat transfer validation using COMSOL and ANSYS. Results Eng. 2022, 13, 100354. [Google Scholar] [CrossRef]
- Zhu, Q.; Wu, W.; Yang, Y.; Han, Z.; Bao, Y. Finite element analysis of heat transfer performance of vacuum glazing with low-emittance coatings by using ANSYS. Energy Build. 2020, 206, 109584. [Google Scholar] [CrossRef]
Figure 1.
Site plan of Shanghai Tower.

Figure 2.
Shanghai Tower renderings.

Figure 3.
Shanghai Tower shape formation.

Figure 4.
Architectural shape zoom and rotation process changes from the top view.
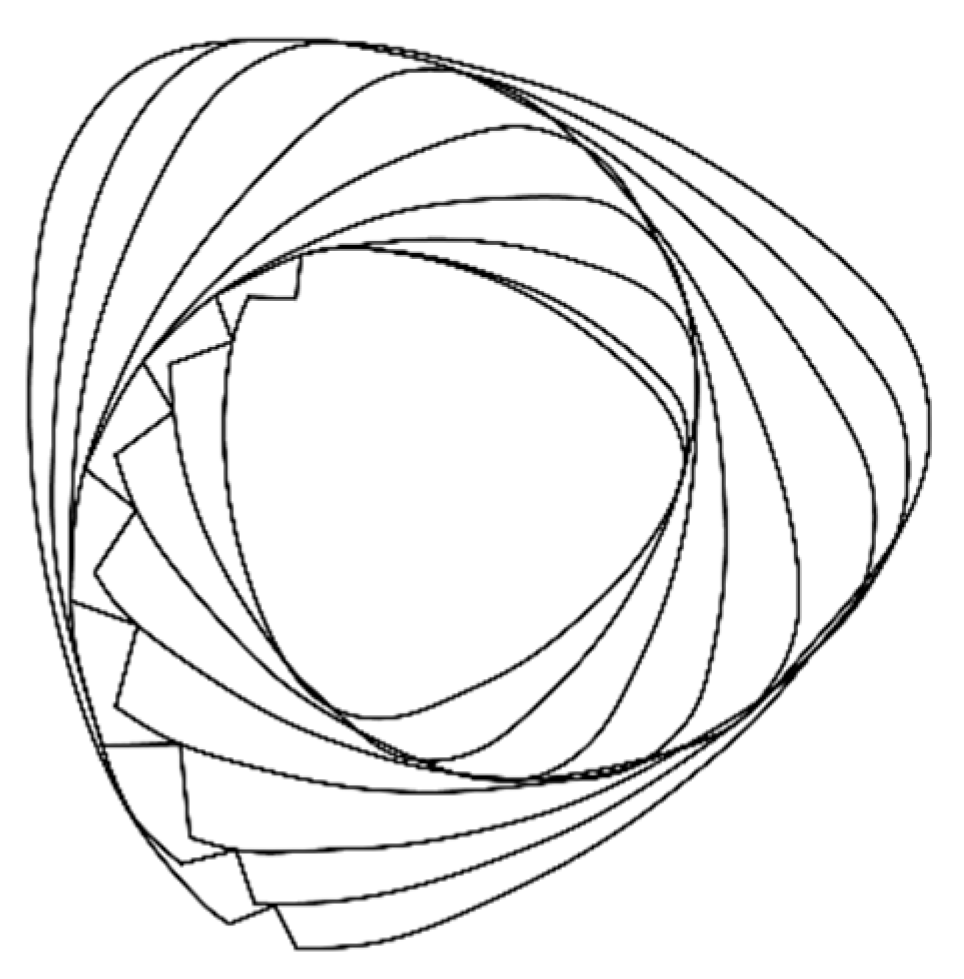
Figure 5.
Support system analysis framework.
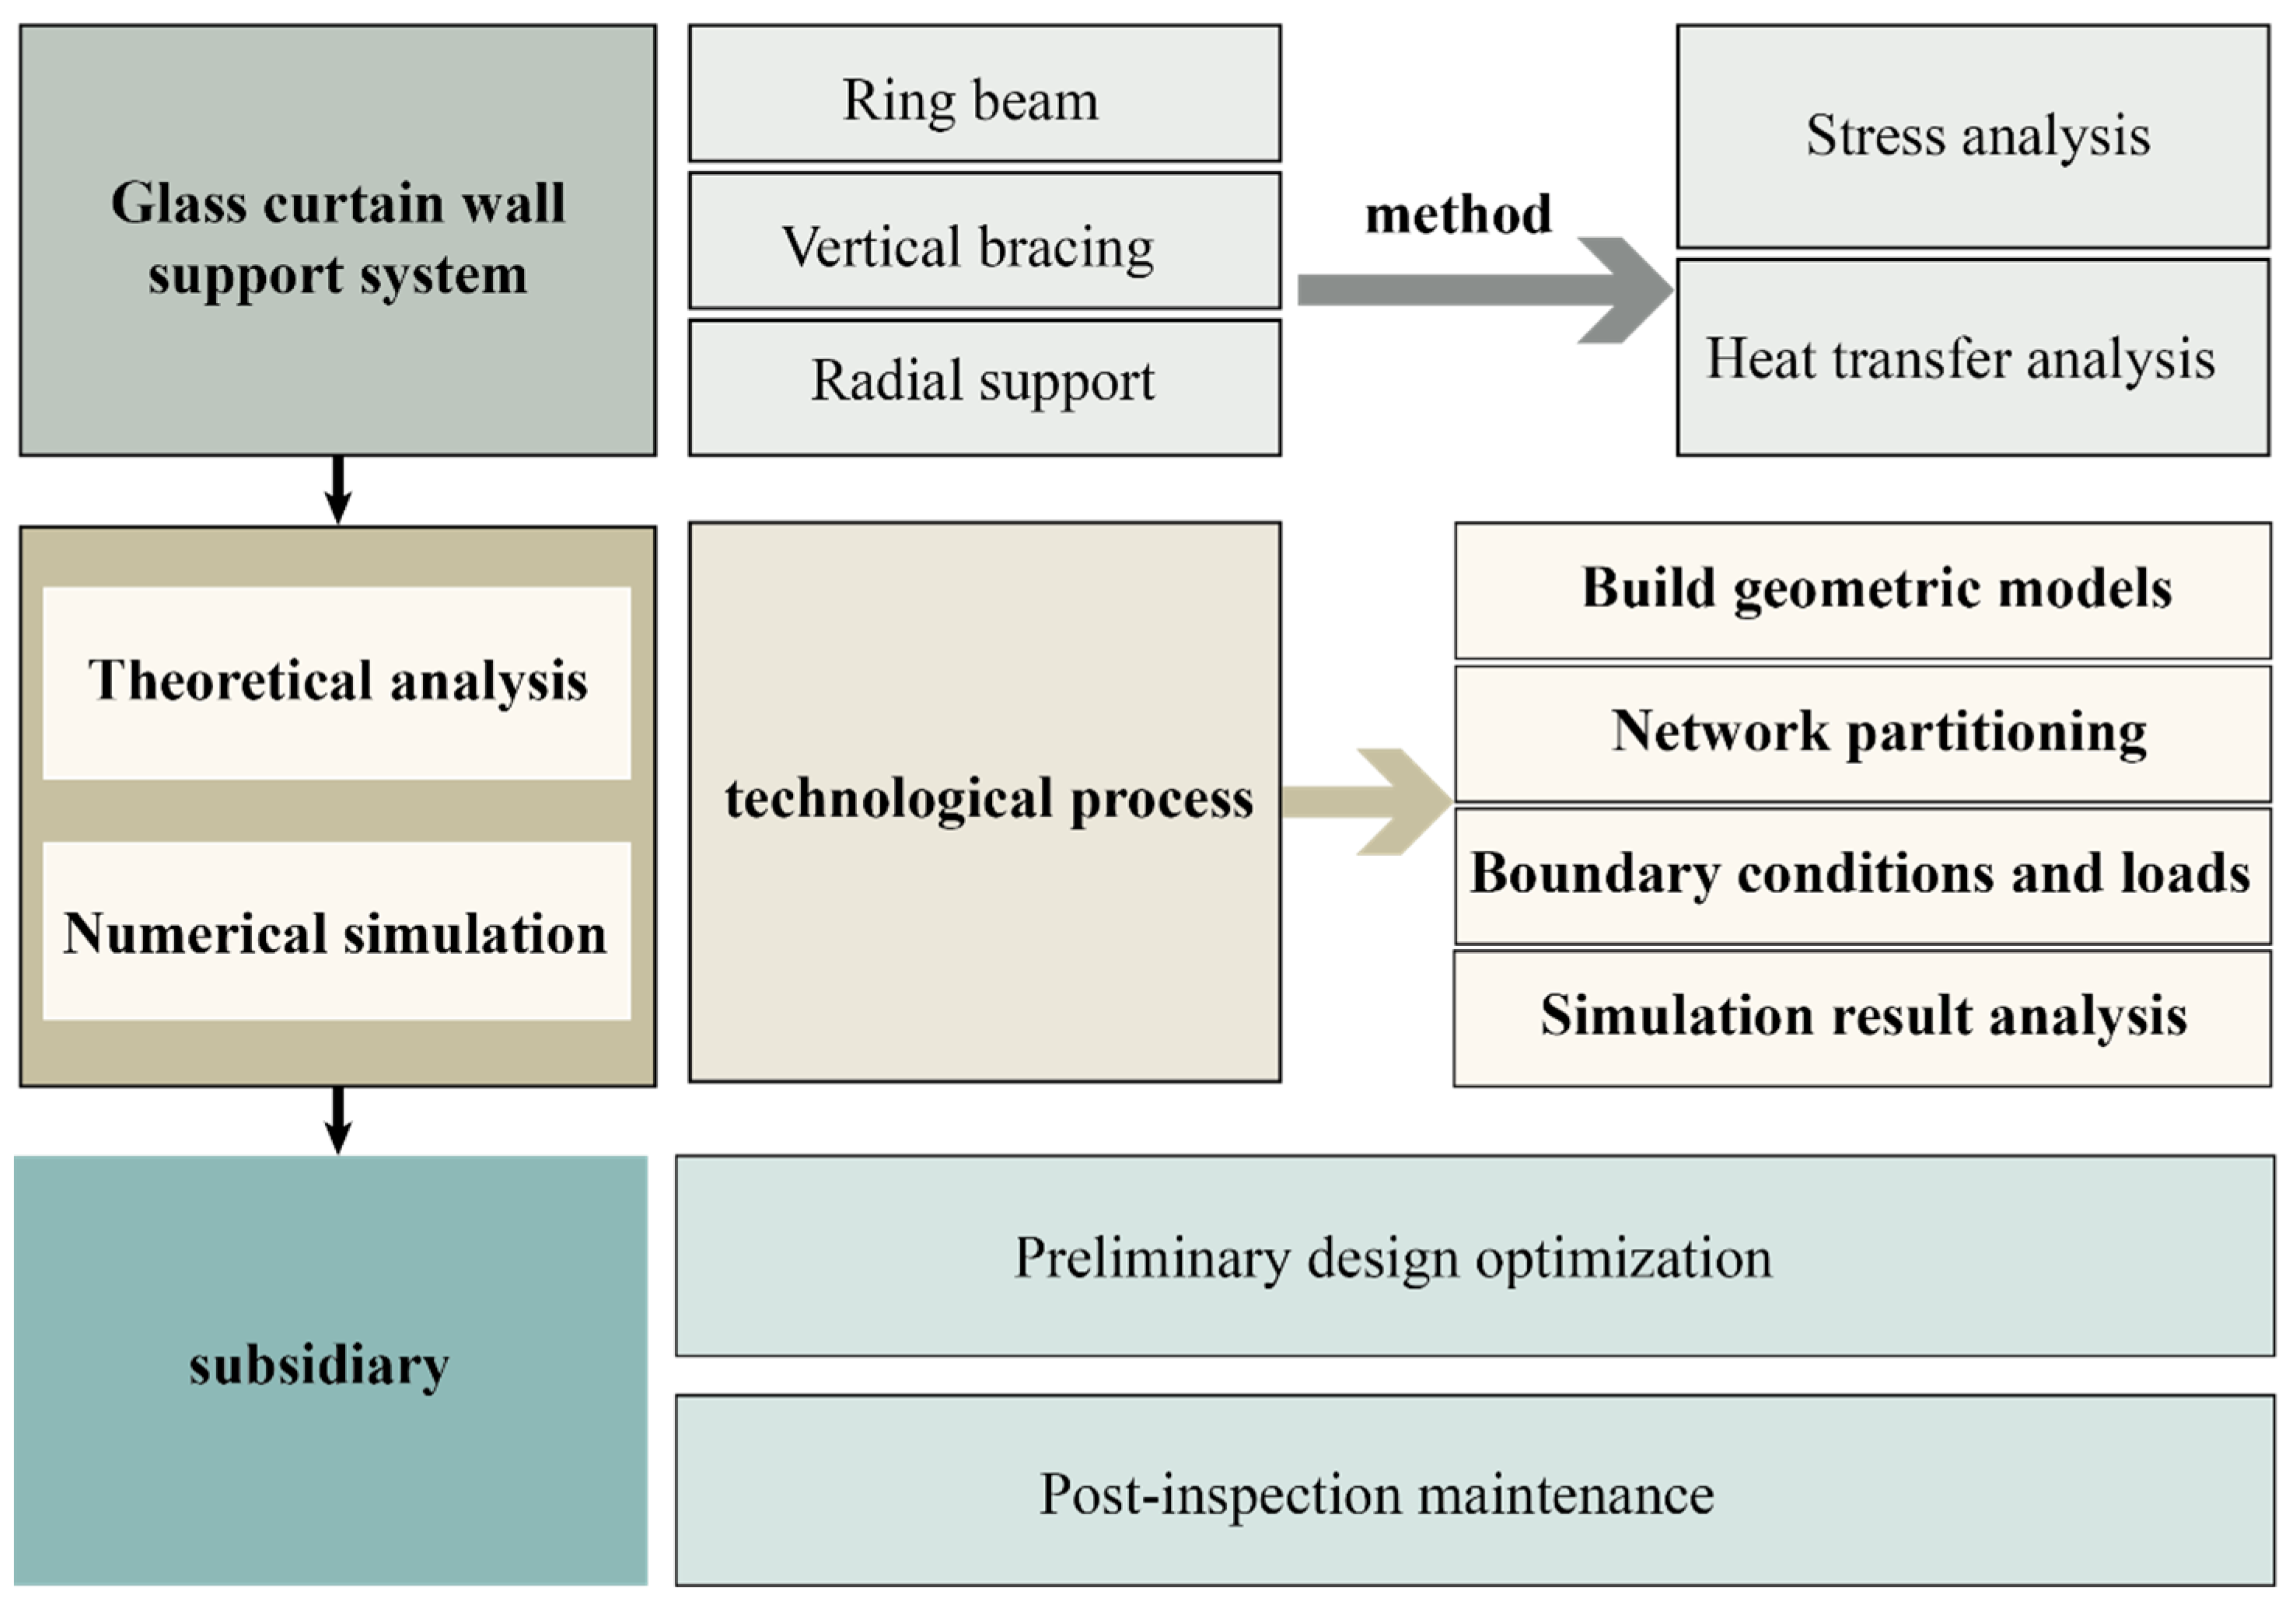
Figure 6.
Actual scene photos of double-skin enclosure structure.

Figure 7.
Schematic diagram of double-skin glass curtain wall.

Figure 8.
Analytical modeling of ANSYS.

Figure 9.
The three programs have equal cross-sectional area at any (same) height.

Figure 10.
(A–C) The three models of the model axis mapping.

Figure 11.
Program A of the four conditions (a,b) (top view).

Figure 12.
Program B (top view).

Figure 13.
Program C of the four conditions (a–d) (top view).

Figure 14.
Layout of measurement points for radial support internal force analysis.

Figure 15.
(a) Radial support axial force distribution. (b) Rate of change of axial force under dynamic and static wind conditions. (c) Radial support bending moment distribution. (d) Rate of change of bending moment under dynamic and static wind conditions.
Figure 15.
(a) Radial support axial force distribution. (b) Rate of change of axial force under dynamic and static wind conditions. (c) Radial support bending moment distribution. (d) Rate of change of bending moment under dynamic and static wind conditions.

Figure 16.
Axial force distribution of vertical supports.

Figure 17.
Bending moment distribution in two directions of vertical supports.

Figure 18.
Schematic diagram of bending moment direction in vertical supports.


Table 1.
Building shape scaling.
| Height | 0 | 45 | 100 | 200 | 300 | 400 | 500 | 600 | 605 | 632 |
| Rotation angle | 0 | 8.92562 | 19.8347 | 39.6694 | 59.5041 | 79.3388 | 99.1735 | 119.008 | 120 | 125.355 |
Table 2.
Wind speed distribution of Model A in southerly wind direction.
| Horizontal Cross-Section | Side Cross-Section | ||
|---|---|---|---|
 |  |  |  |
| 100 m | 200 m | 300 m | |
 |  |  | |
| 400 m | 500 m | 600 m | |
Table 3.
Wind pressure distribution of Shanghai Tower Model A in southerly wind direction.
| Horizontal Cross-Section | Side Cross-Section | ||
|---|---|---|---|
 |  |  |  |
| 100 m | 200 m | 300 m | |
 |  |  | |
| 400 m | 500 m | 600 m | |
Table 4.
Wind vector distribution of Shanghai Tower Model A in southerly wind direction.
| Horizontal Cross-Section | Side Cross-Section | ||
|---|---|---|---|
 |  |  |  |
| 100 m | 200 m | 300 m | |
 |  |  | |
| 400 m | 500 m | 600 m | |
Table 5.
Wind speed distribution of Shanghai Tower Model A in southeasterly wind direction.
| Horizontal Cross-Section | Side Cross-Section | ||
|---|---|---|---|
 |  |  |  |
| 100 m | 200 m | 300 m | |
 |  |  | |
| 400 m | 500 m | 600 m | |
Table 6.
Wind pressure distribution of Shanghai Tower Model A in southeasterly wind direction.
| Horizontal Cross-Section | Side Cross-Section | ||
|---|---|---|---|
 |  |  |  |
| 100 m | 200 m | 300 m | |
 |  |  | |
| 400 m | 500 m | 600 m | |
Table 7.
Wind vector distribution of Shanghai Tower Model A in southeasterly wind direction.
| Horizontal Cross-Section | Side Cross-Section | ||
|---|---|---|---|
 |  |  |  |
| 100 m | 200 m | 300 m | |
 |  |  | |
| 400 m | 500 m | 600 m | |
Table 8.
Wind speed distribution of Shanghai Tower Model B in south windward direction.
| Horizontal Cross-Section | Side Cross-Section | ||
|---|---|---|---|
 |  |  |  |
| 100 m | 200 m | 300 m | |
 |  |  | |
| 400 m | 500 m | 600 m | |
Table 9.
Wind pressure distribution of Shanghai Tower Model B in southerly windward direction.
| Horizontal Cross-Section | Side Cross-Section | ||
|---|---|---|---|
 |  |  |  |
| 100 m | 200 m | 300 m | |
 |  |  | |
| 400 m | 500 m | 600 m | |
Table 10.
Wind vector distribution of Shanghai Tower Model B in southerly windward direction.
| Horizontal Cross-Section | Side Cross-Section | ||
|---|---|---|---|
 |  |  |  |
| 100 m | 200 m | 300 m | |
 |  |  | |
| 400 m | 500 m | 600 m | |
Table 11.
Wind speed distribution of Shanghai Tower Model C in southerly windward direction.
| Horizontal Cross-Section | Side Cross-Section | ||
|---|---|---|---|
 |  |  |  |
| 100 m | 200 m | 300 m | |
 |  |  | |
| 400 m | 500 m | 600 m | |
Table 12.
Wind pressure distribution of Shanghai Tower Model C in southerly windward direction.
| Horizontal Cross-Section | Side Cross-Section | ||
|---|---|---|---|
 |  |  |  |
| 100 m | 200 m | 300 m | |
 |  |  | |
| 400 m | 500 m | 600 m | |
Table 13.
Wind vector distribution of Shanghai Tower Model C in southerly windward direction.
| Horizontal Cross-Section | Side Cross-Section | ||
|---|---|---|---|
 |  |  |  |
| 100 m | 200 m | 300 m | |
 |  |  | |
| 400 m | 500 m | 600 m | |
Table 14.
Wind speed distribution of shanghai Tower Model C in southeasterly windward direction.
| Horizontal Cross-Section | Side Cross-Section | ||
|---|---|---|---|
 |  |  |  |
| 100 m | 200 m | 300 m | |
 |  |  | |
| 400 m | 500 m | 600 m | |
Table 15.
Wind pressure distribution of Shanghai Tower Model C in southeasterly windward direction.
| Horizontal Cross-Section | Side Cross-Section | ||
|---|---|---|---|
 |  |  |  |
| 100 m | 200 m | 300 m | |
 |  |  | |
| 400 m | 500 m | 600 m | |
Table 16.
Wind vector distribution of Shanghai Tower Model C in southeasterly windward direction.
| Horizontal Cross-Section | Side Cross-Section | ||
|---|---|---|---|
 |  |  |  |
| 100 m | 200 m | 300 m | |
 |  |  | |
| 400 m | 500 m | 600 m | |
Table 17.
Simulation of curtain wall support forces under different working conditions.
| Vertical support simulation cloud diagram | Condition 1 | Condition 2 | Condition 3 |
 |  |  | |
| Static wind condition | Wind pressure 60 KN/m2 | Wind pressure 120 KN/m2 | |
| Radial support simulation cloud diagram | Condition 1 | Condition 2 | Condition 3 |
 |  |  | |
| Static wind condition | Wind pressure 60 KN/m2 | Wind pressure 120 KN/m2 |
Table 18.
Summarization of the numerical results for three operational conditions.
| Operational Condition | Static Wind State | Wind Pressure 6 kN/m2 | Wind Pressure 12 kN/m2 | |
|---|---|---|---|---|
| Deformation | Maximum Deformation (cm) | 2.18 | 2.2 | 2.35 |
| Location of Maximum Deformation | Mid-span of Ring Beam | Mid-span of Ring Beam on Windward Side | Mid-span of Ring Beam on Windward Side | |
| Strain | Maximum Equivalent Strain (μ) | 405.5 | 417.2 | 432.85 |
| Location of Maximum Equivalent Strain | Radial Support at Fixed End | Radial Support at Fixed End | Radial Support at Fixed End | |
| Stress | Maximum Equivalent Stress (MPa) | 69.86 | 72.22 | 75.09 |
| Location of Maximum Equivalent Stress | Radial Support at Fixed End | Radial Support at Fixed End | Radial Support at Fixed End | |
| Support axial force | Radial Support Axial Force (kN) | 5630 (Pressure) | 5600 (Pressure) | 5600 (Pressure) |
| Vertical Support Axial Force (kN) | −2002.7 (Pressure) | −1767.1 (Pressure) | −2316.9 (Pressure) | |
| Bending moment | Fixed End Bending Moment (kNm) | 1455.4 | 1504.6 | 1564.4 |
Table 19.
Internal force distribution of radial supports for three scenarios.
| Distance from Fixed End (m) | Static Wind Axial Force (103 kN) | Axial Force Due to 60 kN Wind Pressure (103 kN) | Axial Force Due to 120 kN Wind Pressure (103 kN) | Static Wind Bending Moment (103 kN/m) | Bending Moment Due to 60 kN Wind Pressure (103 kN) | Bending Moment Due to 120 kN Wind Pressure (103 kN) |
|---|---|---|---|---|---|---|
| 1 | −5.63 | −0.056 | −0.056 | 257.9 | 255.7 | 254.7 |
| 2 | −5.2 | −0.0518 | −0.0518 | 240.5 | 238.4 | 237.4 |
| 3 | −4.69 | −0.0467 | −0.0467 | 218.9 | 216.9 | 216.1 |
| 4 | −3.76 | −0.0374 | −0.0374 | 178.8 | 177.1 | 176.3 |
| 5 | −3.36 | −0.0334 | −0.0334 | 161.2 | 159.6 | 158.9 |
| 6 | −3.08 | −0.0306 | −0.0306 | 148.4 | 147 | 146.3 |
| 7 | −2.58 | −0.0257 | −0.0257 | 125.7 | 124.5 | 123.9 |
| 8 | −2.09 | −0.0208 | −0.0208 | 102.6 | 101.5 | 101.1 |
| 9 | −1.11 | −0.011 | −0.011 | 55.1 | 54.5 | 54.2 |
| 10 | −0.26 | −0.0026 | −0.0026 | 13.2 | 13.1 | 13.1 |
Table 20.
Material parameters of the glass curtain wall.
| Parameter Type | Description | Numeric Values | Unit |
|---|---|---|---|
| Thermal Conductivity (K Value) | The ability to measure the material’s conduction of heat energy | 1.0 | W/(m·K) |
| Density | The ratio of mass to volume of the material | 2500 | kg/m³ |
| Specific Heat Capacity | The amount of heat absorbed or released by the material per unit mass to change its temperature by 1 °C | 750 | J/(kg·K) |
| Coefficient of Thermal Expansion | The degree of volume or length change of the material under temperature variation | 9 × 10⁻⁶ | 1/K |
| Light Transmittance | The degree to which the material allows light to pass through | Low-E variable, depending on the Low-E coating | % |
| U Value | The overall heat transfer coefficient of the entire window assembly, including the frame and glass | 1.8 | W/(m²·K) |
Table 21.
Temperature distribution and heat transfer diagrams.
| Temperature distribution map (°C) | Winter | Summer |
 |  | |
| Outdoor 5 °C | Outdoor 40.3 °C | |
| Heat flux conduction diagram | Winter | Summer |
 |  | |
| Outdoor 5 °C | Outdoor 40.3 °C |
Disclaimer/Publisher’s Note: The statements, opinions and data contained in all publications are solely those of the individual author(s) and contributor(s) and not of MDPI and/or the editor(s). MDPI and/or the editor(s) disclaim responsibility for any injury to people or property resulting from any ideas, methods, instructions or products referred to in the content. |
© 2024 by the authors. Licensee MDPI, Basel, Switzerland. This article is an open access article distributed under the terms and conditions of the Creative Commons Attribution (CC BY) license (https://creativecommons.org/licenses/by/4.0/).
Share and Cite
MDPI and ACS Style
Li, Y.; Chen, H.; Yu, P.; Yang, L. Analysis and Reflection on the Green, Low-Carbon, and Energy-Saving Design of the Super High-Rise Building. Sustainability 2024, 16, 4146. https://doi.org/10.3390/su16104146
AMA Style
Li Y, Chen H, Yu P, Yang L. Analysis and Reflection on the Green, Low-Carbon, and Energy-Saving Design of the Super High-Rise Building. Sustainability. 2024; 16(10):4146. https://doi.org/10.3390/su16104146
Chicago/Turabian StyleLi, Yangluxi, Huishu Chen, Peijun Yu, and Li Yang. 2024. "Analysis and Reflection on the Green, Low-Carbon, and Energy-Saving Design of the Super High-Rise Building" Sustainability 16, no. 10: 4146. https://doi.org/10.3390/su16104146
Note that from the first issue of 2016, this journal uses article numbers instead of page numbers. See further details here.