Article

Hydrological Factor and Land Use/Land Cover Change Explain the Vegetation Browning in the Dosso Reserve, Niger

1
Key Laboratory of Remote Sensing and Digital Earth, Aerospace Information Research Institute, Chinese Academy of Sciences, Beijing 100101, China
2
International Research Center of Big Data for Sustainable Development Goals, Beijing 100094, China
3
University of Chinese Academy of Sciences, Beijing 100049, China
4
Faculty of Civil Engineering and Geosciences, Delft University of Technology, Stevinweg 1, 2825 CN Delft, The Netherlands
*
Author to whom correspondence should be addressed.
Remote Sens. 2024, 16(10), 1728; https://doi.org/10.3390/rs16101728
Submission received: 5 March 2024 / Revised: 27 April 2024 / Accepted: 9 May 2024 / Published: 13 May 2024
(This article belongs to the Special Issue Remote Sensing Applications in Monitoring of Protected Areas II)

Abstract

:
The West Sahel is facing significant threats to its vegetation and wildlife due to the land degradation and habitat fragmentation. It is crucial to assess the regional vegetation greenness dynamics in order to comprehensively evaluate the effectiveness of protection in the natural reserves. This study analyzes the vegetation greenness trends and the driving factors in the Dosso Partial Faunal Reserve in Niger and nearby unprotected regions—one of the most important habitats for endemic African fauna—using satellite time series data from 2001 to 2020. An overall vegetation browning trend was observed throughout the entire region with significant spatial variability. Vegetation browning dominated in the Dosso Reserve with 17.7% of the area showing a significant trend, while the area with significant greening was 6.8%. In a comparison, the nearby unprotected regions to the north and the east were found to be dominated by vegetation browning and greening, respectively. These results suggest that the vegetation protection practice was not fully effective throughout the Dosso Reserve. The dominant drivers were also diagnosed using the Random Forest model-based method and the Partial Dependence Plot tool, showing that water availability (expressed as soil moisture) and land use/land cover change were the most critical factors affecting vegetation greenness in the study region. Specifically, soil moisture stress and specific land management practices associated with logging, grazing, and land clearing appeared to dominate vegetation browning in the Dosso Reserve. In contrast, the vegetation greening in the central Dosso Reserve and the nearby unprotected region to the east was probably caused by the increase in shrubland/forest, which was related to the effective implementation of protection. These findings improve our understanding of how regional vegetation greenness dynamics respond to environmental changes in the Dosso Reserve and also highlight the need for more effective conservation planning and implementation to ensure sustainable socio-ecological development in the West Sahel.

Graphical Abstract

1. Introduction

Protected areas are essential for biodiversity conservation and contribute significantly to the achievement of the United Nations Sustainable Development Goals (SDGs) [1]. Vegetation is a critical component of the terrestrial ecosystems and plays a vital role in protected areas by providing food, habitat, and maintaining biodiversity and ecological balance [2], particularly in ecologically sensitive and vulnerable areas such as the Sahel-Sudan region of Africa. However, the vegetation dynamics in the Sahel region are vulnerable to climatic anomalies and human activities, and land degradation is widely reported as a result of the severe Sahel droughts in the 20th century, especially in the 1970s and 1980s [3,4,5,6]. Several large protected areas have been established in the Sahel-Sudan region to promote vegetation restoration, protect animals, and mitigate the impacts of climate change, such as the W National Park in West Africa [2,7,8].
The topic of vegetation dynamics has been explored previously in the Sahel-Sudan region, but most studies focus on vegetation greenness changes at the sub-continental scale [9,10,11,12,13,14,15,16], lacking detailed analyses of the specific protected areas. Recent studies have highlighted significant land use/land cover changes and vegetation browning in the Sahel region of West Africa [14,17,18], strongly linked to human activities, resulting in extensive loss and fragmentation of protected areas and surrounding habitats [19,20]. These changes pose a severe threat to rare wildlife and plants dependent on these protected areas for survival [21,22,23]. With the continuous population growth in the Sahel-Sudan region, the trend of natural habitat transformation is likely to increase. Therefore, continuous monitoring of vegetation dynamics and drivers inside and outside protected areas is of great significance for understanding the conservation effects in a natural reserve, and supports evidence-based decision-making in protected area management.
The Dosso Partial Faunal Reserve in Niger (hereinafter referred to as “the Dosso Reserve”), as an functional zone of the W National Park, is a typical Sahelian-Sudano savanna ecosystem that provides essential habitat for a wide range of wildlife species, both resident and migratory [24]. Land degradation and habitat fragmentation linked to climate change and human activities pose a significant challenge to wildlife populations in the Dosso Reserve [25]. In the context of regional environmental change, it is important to continuously and thoroughly investigate the vegetation dynamics and potential drivers in the protected areas and their adjacent regions. However, recent and up-to-date assessments of vegetation greenness change in the Dosso Reserve are largely lacking. Previous studies have mainly focused on the regional vegetation dynamics and changes based on satellite remote sensing data with low spatial resolution [9,10,11,12]. Few studies have addressed the significant differences between the protected area and the surrounding unprotected areas to reveal the conservation effects of a natural reserve and provide useful information for natural resource management.
Vegetation greenness, generally captured by remote sensing vegetation indices (e.g., Normalized Difference Vegetation Index, NDVI), can effectively characterize the growth status and structural composition of vegetation [9,26]. A decline in vegetation greenness indicates limited plant growth and varying degrees of degradation of the vegetation cover, which hinders habitats’ functionality [27,28,29]. Several factors explain the trends of regional vegetation greenness, and the main drivers and mechanisms of the vegetation greenness in the Sahel are still under debate. Precipitation is considered a key climatic factor influencing vegetation dynamics in the Sahel-Sudan region, but recent studies have shown that its role is weakening [14,16]. Even in water-limited drylands, precipitation only explains vegetation greenness trends in less than half of the region [16]. In addition to precipitation, other climate–hydrological factors, such as air temperature, solar radiation, atmospheric vapor pressure deficit (VPD), and soil moisture, also play important roles in influencing the spatial heterogeneity of vegetation dynamics through their regulation of plant biophysical processes [30,31,32]. Several studies have clearly documented the negative effects of water stress caused by warming, increasing atmospheric VPD, and decreasing soil moisture on vegetation greenness and productivity [30,33,34,35,36,37]. In addition, changes in land use/land cover (LULC) associated with human activities, such as urbanization, overgrazing, afforestation, and agricultural land management, also affect vegetation dynamics at multiple spatial and temporal scales. Recent studies have highlighted the importance of local LULC changes and their impacts on vegetation in the Sahel region [13,14,16,38,39,40]. Therefore, it is necessary to further investigate the impacts of multiple factors on vegetation greenness.
The relationship between observed vegetation dynamics and driving factors is complex due to the nonlinear response of vegetation greenness to multiple factors. However, the mechanism of this nonlinearity is not well understood, and conventional statistical methods fail to reflect this complex nonlinear problem. The development of machine learning advances our tools for solving nonlinear problems. Random Forest (RF) is a powerful machine learning algorithm that is widely used in driver analyses [14,41] because it can produce reliable predictions and extract nonlinear relationships between feature and target variables [42]. In addition, the Partial Dependence Plot (PDP) [43], an extension of machine learning, can help diagnose the nonlinear influence of a feature variable on the target variable.
This study aims to investigate the vegetation greenness dynamics in the Dosso Reserve during 2001–2020 based on a time series dataset of satellite observations. The specific objectives are to: (1) investigate the difference in vegetation greenness dynamics between protected and unprotected areas; (2) assess the relative contributions of various factors to vegetation greenness dynamics; and (3) investigate the responses of vegetation greenness to dominant drivers.

2. Data Sources and Methods
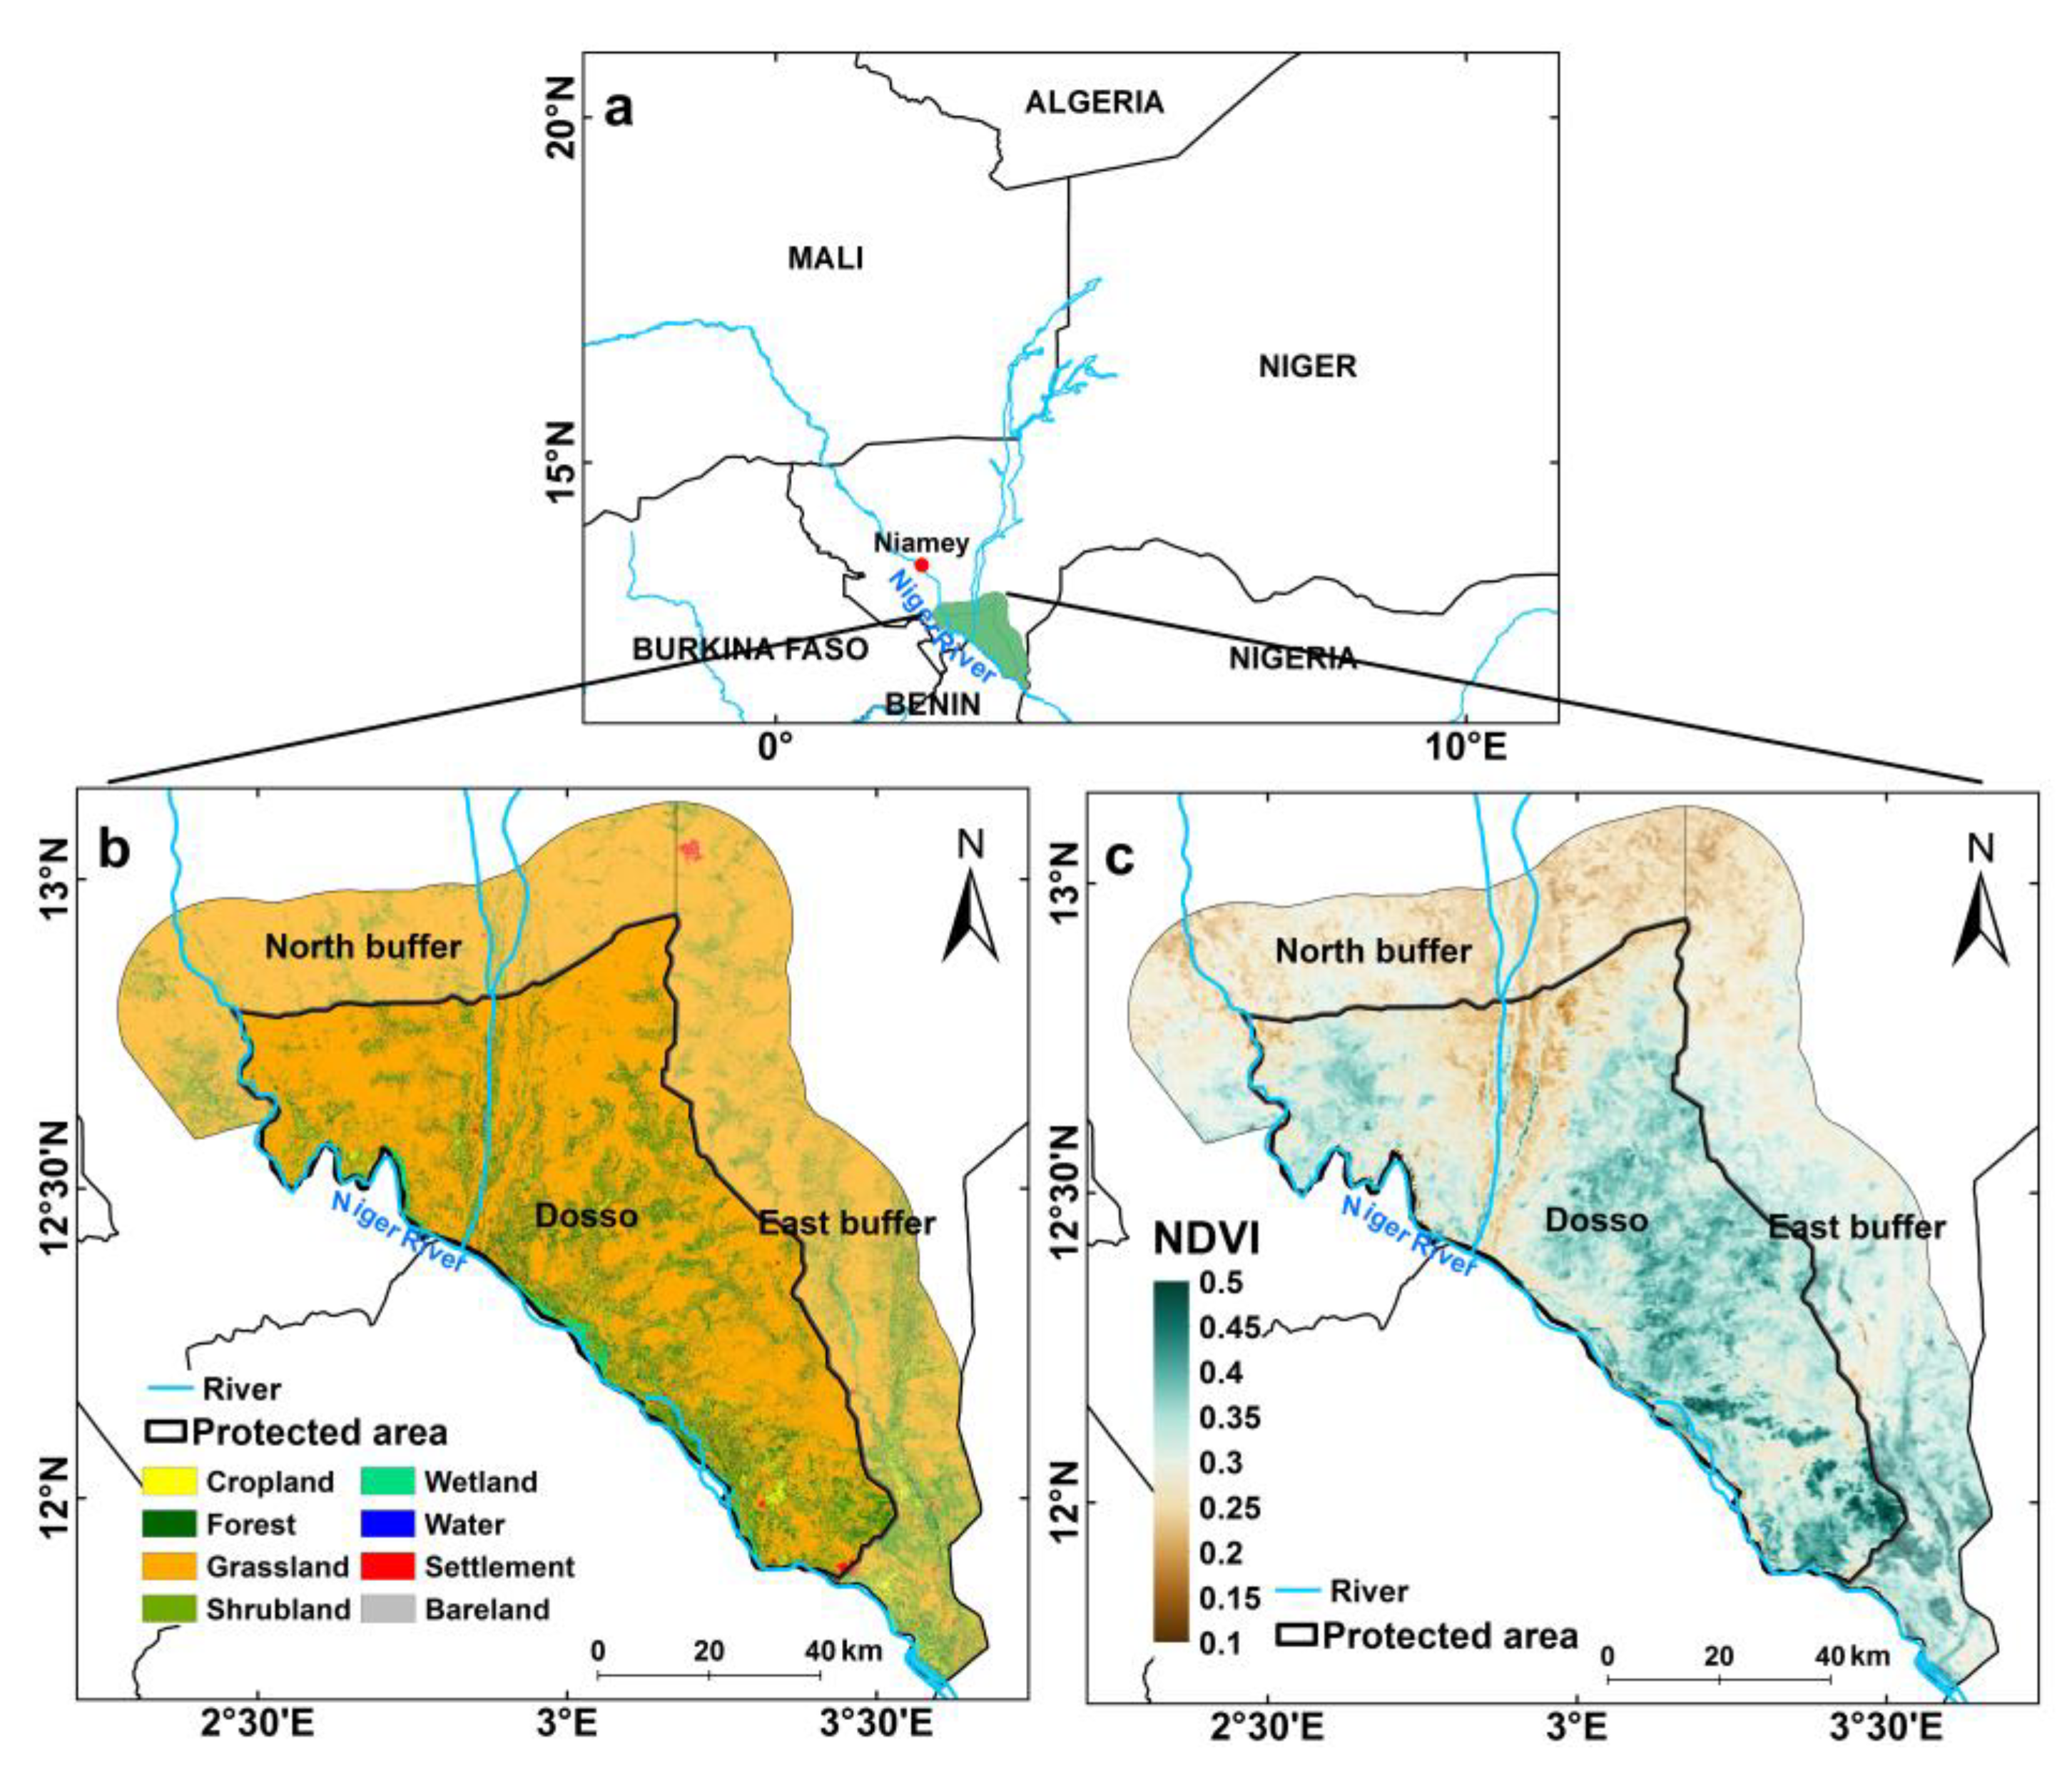
2.1. Study Area

The Dosso Reserve is located in the southwestern border of Niger (11.8–12.9°N, 2.5–3.5°E), covering approximately 306,000 ha (Figure 1). The western Dosso Reserve is crossed by the Niger River, close to the Niger River valley and Niamey, the capital city of Niger. The Dosso Reserve was established in 1962 and protects a wide range of wildlife species and habitats from the W National Park and adjacent areas [8,25]. This area is the center of the Sahel-Sudan region with a typical tropical climate condition. This region has a significant climate gradient from north to south, with average annual precipitation ranging from less than 500 mm in the northern areas to more than 800 mm in the southern areas. The main vegetation cover types in this region are grass, shrub, tiger bush (a typical banded vegetation pattern of trees and bushes), and savanna [25].
The boundary of the Dosso Reserve was obtained from the World Database on Protected Areas (WDPA, https://www.protectedplanet.net/11652, accessed on 31 January 2024). To analyze and demonstrate the impact of the conservation practices within the Dosso Reserve region on the vegetation greenness dynamics, we established a 20 km buffer region to represent the surrounding unprotected areas for comparison. We restricted the buffer region within Niger, which does not overlap with other protected areas, and divided it into a norther buffer region (North buffer) and an eastern buffer region (East buffer) (Figure 1).

2.2. Data Sources and Pre-Processing

We used NDVI as a proxy for vegetation greenness for the period 2001–2020. The NDVI is derived from the Moderate Resolution Imagery Spectroradiometer (MODIS) 8-day composite surface reflectance product (MOD09Q1, Collection 6.1) at 250 m spatial resolution (https://e4ftl01.cr.usgs.gov/MOLT/MOD09Q1.061/, accessed on 16 June 2023). The improved Harmonic ANalysis of Time Series (iHANTS) algorithm [44,45] was used to remove the outliers and reconstruct the NDVI time series. The iHANTS method is an updated tool that improves the original HANTS [46,47] for time series reconstruction, which applies the Fourier transform theory with several parameter settings, including inter-annual harmonic components, dynamic fitting error tolerance (FET) scheme, and dynamic update of weights to remove the outliers and fill the gaps in a time series. Global assessments [44,45] and a performance test in the Sahel-Sudano-Guinean region [15] showed a good performance in the reconstruction of NDVI time series. The reconstructed 8-day NDVI time series were further averaged to obtain annual mean NDVI images. The pixels with multiple-year mean NDVI < 0.1 were masked out to exclude non-vegetated or too sparsely vegetated areas.
In this study, we selected climate–hydrological factors, LULC, and population to identify the potential drivers of vegetation greenness changes (Table 1). Several climate–hydrological variables related to water, heat, and energy were evaluated to investigate their impacts on vegetation greenness, including air temperature (Tem), precipitation (P), solar radiation (Rad), vapor pressure deficit (VPD), and soil moisture (SM). Monthly precipitation data with a spatial resolution of 0.05° for the period 2001–2020 were obtained from the Climate Hazards Group InfraRed Precipitation with Station (CHIRPS, Version 2.0, https://data.chc.ucsb.edu/products/CHIRPS-2.0/, accessed on 20 June 2023). Monthly air temperature, dew point temperature (Td), solar radiation flux density, and soil moisture (volumetric soil water content at 0–7 cm, 7–28 cm, and 28–100 cm depths) data with a spatial resolution of 0.1° were obtained from the European Centre for Medium-Range Weather Forecasts (ECMWF) Reanalysis v5 Land (ERA5-Land, https://doi.org/10.24381/cds.68d2bb30, accessed on 20 June 2023) dataset. In this study, the air temperature and dew point temperature were used to calculate vapor pressure deficit (VPD) [35]. The weighted average soil moisture for the whole layer between 0 and 1 m depth was obtained by taking the weights as the thicknesses of the soil layers, following a previous study [41]. Monthly Tem, P, Rad, VPD, and SM data were resampled from the original spatial resolution to 250 m using the cubic spline method [48], and then annual means (Tem, VPD, and SM) and annual sums (P and Rad) were calculated for the period 2001–2020.
The LULC data at 30 m spatial resolution for the period 1985–2022 were obtained from the GLC_FCS30D product (https://zenodo.org/records/8239305, accessed on 18 February 2024). This dataset has an overall accuracy of 80.88% (±0.27%) globally for the basic classification system of 10 major land cover types [49], i.e., cropland, forest, shrubland, grassland, wetland, water, tundra, impervious surface, bare areas, and permanent ice and snow. In this study, the 35 original LULC classes were reclassified into 10 classes according to Table 2, and we obtained 8 LULC classes for the region, i.e., cropland, forest, grassland, shrubland, wetland, water, settlement, and bare land (Figure 1). The fractional abundance of each class within each 250 m pixel was then calculated using the GLC_FCS30D data, denoted as Crop, Forest, Grass, Shrub, Wetland, Water, Settlement, and Bare. In addition, the “no change” LULC types and paired LULC change types during 2001–2020 were identified based on the total change of each LULC fraction in each pixel, following our previous paper [16]. Here, if the total changes of fractions in all LULC classes in a 250 m pixel during 2001–2020 fell within a range of ±5% (to reduce classification error), then “no change” type in that pixel was defined, and the class with the maximum fraction was assigned as the main LULC class of that pixel; otherwise, a paired LULC change type was defined according to the maximum gain (maximum positive total change value) and the maximum loss (minimum negative total change value).
We used the yearly total number of population (Pop) to examine the social pressure on vegetation greenness. Population data at 100 m spatial resolution for the period 2000–2020 were collected from the WorldPop dataset (https://www.worldpop.org/, accessed on 24 June 2023) and processed to 250 m spatial resolution using the summation method.

2.3. Methods

This study involved three main elements:
  • NDVI trend analysis to detect where the vegetation was greening or browning. We used the Theil–Sen method to detect the temporal trends in annual mean NDVI both inside and outside the protected area in the Dosso Reserve at the pixel scale and the regional scale.
  • Driving factor analysis to determine how environmental variables influence the vegetation greenness change. We performed a regional RF model-based method to assess the relative contributions of different factors, i.e., air temperature (Tem), precipitation (P), solar radiation (Rad), vapor pressure deficit (VPD), soil moisture (SM), LULC fractions (Crop, Forest, Grass, Shrub, Wetland, Water, Settlement, and Bare), and population (Pop) to vegetation browning and greening, respectively.
  • Investigation of the response of NDVI to dominant drivers. After identifying the dominant drivers, we explored the response of vegetation greenness to the dominant drivers using the PDP tool.

2.3.1. Theil–Sen Trend Analysis Approach

The Theil–Sen trend approach, which is widely used as a robust linear trend estimator to detect long-term trends in the time series of ecological and climatic variables [15,16,50,51], was used to estimate linear trends of NDVI in this study. The Yue–Pilon pre-whitening Mann–Kendall test [52] was used to assess whether there were monotonic increasing or decreasing trends in the NDVI time series, and the trends were considered significant if the confidence level was greater than 95% (p < 0.05).

2.3.2. Random Forest Model-Based Driver Analysis

The RF algorithm is widely used to predict and classify different variables due to its robust accuracy based on the construction of multiple mutually independent basic learners through a bootstrap aggregation strategy [42]. Moreover, it allows to establish a nonlinear relationship between the target variable and the predictors without any statistical hypothesis and can isolate the relative influence of each predictor on the target variable [14,42].
In this study, the RF model was driven by all influencing factors (listed in Table 1) changing over time to simulate the variation in NDVI and diagnose their contributions to browning/greening in the Dosso Reserve, the North buffer region, and the East buffer region. Before performing the regional RF analysis, we tuned the hyper-parameter settings (Table 3) of the RF model according to the grid search method [41] to obtain high-accuracy predictions using the R package “ranger” [53]. The main steps were as follows:
(1)
Randomly select 1000 points (samples) in the entire study area and extract the NDVI (dependent variable) and a total of 14 influencing factors (independent variables) at each point over the period 2001–2020.
(2)
Implement an RF configuration with 5-fold cross-validation and ntree = 500 to determine the optimal hyper-parameters according to the grid search method with varied hyper-parameters (Table 3) for all points. The coefficient of determination (R2) and the root-mean-squared error (RMSE) of the cross-validation were calculated.
(3)
The optimal hyper-parameter setting was determined by the minimum RMSE criterion (0.032) with an R2 value of 0.715. The optimized parameters are shown in Table 3.
To efficiently capture the differences in the relationship between NDVI trends and drivers among the three sub-regions, we constructed separate RF models of significant browning/greening trends for the Dosso Reserve region and the two unprotected (buffer) regions. This resulted in six scenarios (Table 4), and we constructed six RF models accordingly. For each regional RF analysis, we used 70% of the total samples for training and 30% for testing. The R2 and RMSE of the test sample set were used to evaluate the performance of the RFs.
The relative importance of each driving factor in the RF model was then assessed using the impurity method [53]. For a Random Forest Regression, the impurity method measures the importance of a particular feature by evaluating the reduction in variance of the predicted target variable before and after introducing that feature at each node split. A large reduction in variance indicates a high level of feature importance. In this study, the impurity importance of a given factor ( R i ) was scaled as 0–100%:
R i = x i i = 1 n x i × 100 %
where x i is the impurity importance of the i-th factor, and n is the number of factors in total (14 in this study). The factors with the highest Ri were selected as the dominant factors.

2.3.3. Partial Dependence Plot to Analyze the Response of NDVI to Dominant Drivers

The Partial Dependence Plot (PDP) was used to analyze the relationship between NDVI and dominant drivers. The PDP is a powerful visualization tool that analyzes the relationship between an explanatory variable and the target variable while holding all other explanatory variables constant in machine learning models [43]. It fixes the values of the other features and observes the impact of a particular feature on the predicted outcome, thereby showing the isolated effect of that feature, i.e., the marginal effect. Partial Dependence ( f ^ S ) is defined as:
f ^ S x S = 1 n i = 1 n f ^ ( x S , x C ( i ) )
where x S is the feature for which the partial dependence function should be plotted, n is the number of instances in the training data, and x C ( i ) are observed feature values from the training data for the features without x S in the machine learning model f ^ .
In this study, the partial dependence plot is also a quantitative method to assess the sensitivity of vegetation greenness to influencing factors (e.g., soil moisture). By comparing the steepness and magnitude of the partial dependence curves in a given range of a specific influencing factor, we can quantify the difference in sensitivity between regions. We used the Theil–Sen method to calculate the steepness and magnitude.

3. Results

3.1. Vegetation Greenness Change by the NDVI Trend Analysis

The pixel-wise annual NDVI trend during 2001–2020 and the area proportions with different trend scenarios (i.e., greening or browning) are shown in Figure 2. Spatially, the vegetation browning was clustered in the north and the west of the study area. Within the Dosso Reserve, vegetation browning concentrated along the Niger river and low-lying Niger Valley on the western border, and the intensity of vegetation browning increased further north. The vegetation greening was mainly distributed in the central areas of the Dosso Reserve and East buffer region.
In the Dosso Reserve, the vegetation browning area (58.6%) was larger than the greening area (41.4%) (Figure 2a,b). Considering only the trend with a significant level p < 0.05, the proportion of significant browning area was 17.7%, approximately twice the proportion of significant greening area (7.1%) (Figure 2c,d). The browning trend dominated the North buffer region, with 26.8% of the area as significant browning and 1.1% of the area as significant greening (Figure 2c,d). In the East buffer region, the proportion of area with significant greening (10.7%) and significant browning (10.1%) were comparable.
Figure 3 presents the time series and overall trends of the annual mean NDVI for the period 2001–2020 in different regions. Annual NDVI both inside and outside the Dosso Reserve showed a decreasing trend, with an insignificant rate of decrease (p = 0.08) of −0.24% (ratio of the Theil–Sen slope to the multiple-year averaged NDVI) in the Dosso Reserve, indicating the vegetation browning over 2001–2020 (Figure 3a). Of all the regions, only the trend in the North buffer region was significant (p = 0.01) and had the highest rate of decline (−0.4%) (Figure 3b). The browning trend in the Dosso Reserve and the East buffer region for the period 2001–2020 being not significant might be due to the long-term variability and inter-annual fluctuations, which determined a large variance around the overall trend.

3.2. The Importance of Different Drivers

In this study, the RF models were performed to simulate the relationships between NDVI and 14 influencing factors for six scenarios defined in Table 4. The validation metrics of the RF models showed good agreements between the predicted NDVI and the satellite-observed NDVI (Table 4). The R2 of all models varied between 0.71 and 0.89, with a mean of 0.78, and all the RMSE values were relatively low. This suggested that the relationships established using the RF model were reliable and that it was appropriate to diagnose the contributions of different influencing factors and to identify the dominant drivers.
Figure 4 shows the estimated relative importance based on the method described in Section 2.3.2. Soil moisture was found to be the most important factor controlling the variations in NDVI in the Dosso Reserve, contributing 15.4% to browning and 15.5% to greening, respectively (Figure 4a,b). Other important factors, such as precipitation, temperature, solar radiation, vapor pressure deficit, fraction of forest cover, fraction of grassland cover, and fraction of shrubland cover, also played important roles in the vegetation browning/greening in the Dosso Reserve. The grassland fraction had a greater impact on browning (10.0%) than on greening (5.9%), while the shrubland fraction played a more important role in greening (12.1%) than in browning (7.2%). Overall, the LULC factors appeared to contribute more (40.5%) than climate factors (35.0%) to browning in the Dosso Reserve, whereas climate factors contributed more (45.4%) than LULC factors (35%) to greening.
For the unprotected North buffer region, the results of the relative importance of the influencing factors were somewhat different (Figure 4c,d). Soil moisture (15.5%) was the most important factor contributing to browning, while fraction of forest cover (19.1%) was the most important factor contributing to greening. In contrast to the Dosso Reserve, in the North buffer region, the climate factor (51.5%) contributed more to browning than the LULC factor (29.4%), while the climate factor (34.7%) contributed less to greening than the LULC factor (50.1%). The most important factor controlling the variations in NDVI in the unprotected East buffer region was soil moisture, but its contribution to greening (29%) was much greater than that to browning (15.5%) (Figure 4e,f). Overall, the climate factor had a slightly larger impact than the LULC factor on both browning and greening in the East buffer region.

3.3. Response of NDVI to Dominant Drivers

To demonstrate the relationship between NDVI and the main drivers, we analyzed the partial dependence of NDVI on the top three driving factors for each regional RF model. In the Dosso Reserve, in both the browning and greening areas NDVI increased rapidly as soil moisture increased around 0.10–0.17 m3/m3, but the NDVI value occasionally reached saturation or decreased after 0.17 m3/m3 (Figure 5). In the browning area, NDVI increased rapidly as precipitation increased from 600 mm to 800 mm, but the NDVI value became insensitive to further precipitation increases after 800 mm. These results indicated that water supply, expressed by soil moisture and precipitation, was the primary driver of vegetation growth in this dryland ecosystem. In the browning area, as the grassland fraction increased, the NDVI value continuously decreased. In the greening area, NDVI value decreased with the increase in solar radiation and increased with the increase in shrubland fraction.
Similar to the Dosso Reserve, an increase in soil moisture and precipitation in the North buffer region (Figure 6) and the East buffer region (Figure 7) would significantly increase the NDVI value. In the browning area of the North buffer region, the NDVI had a narrower range of rapid response to soil moisture (around 0.10–0.15 m3/m3) and precipitation (around 550–700 mm) than that in the Dosso Reserve. In addition, the partial dependence curve for the browning area of the Dosso Reserve in a given soil moisture range (e.g., 0.10–0.17 m3/m3) exhibited the steepest slope and largest amplitude (0.67 NDVI unit per m3/m3), followed by the North buffer region (0.48 NDVI unit per m3/m3) and East buffer region (0.24 NDVI unit per m3/m3). This suggested that the vegetation browning in the Dosso Reserve was more sensitive to small-scale soil moisture changes than in both the North and East buffer regions. We also found that NDVI decreased with increasing temperature in the browning area in the North buffer region, with a trough when air temperatures were in the range of 29–29.5 °C. In the greening area, NDVI was positively correlated with the fraction of forest cover, while it was negatively correlated with the fraction of grassland.

4. Discussion

4.1. Trends in Vegetation Greenness inside and outside the Protected Area

Studies generally show a positive trend in vegetation greenness over the recent decades for most of western Sahel, based on either satellite or field data [9,10,26,54,55,56,57]. However, this “re-greening” of the Sahel is accompanied by challenges such as land degradation, density, and species decline, etc. [6,14,16]. Although several national parks have been established, the conservation effect has not been as effective as expected [2,58,59], which was also found in this study in the Dosso Partial Faunal Reserve. Our study clearly shows that the vegetation browning was dominant in the Dosso Reserve during the last two decades. The results are consistent with previous studies showing that vegetation browning is clustered in central West Africa and is spatially heterogeneous [15,16]. These results suggest the need to improve the conservation practices of protected areas in the Dosso Reserve, also in the West Africa.
The difference between the protected and unprotected regions is clearly observed in this study, which also demonstrates the spatial variation in vegetation dynamics in the Dosso Reserve and the surrounding unprotected regions. There was a general vegetation browning in the Dosso Reserve, with even more severe browning in the nearby unprotected area in the north. In contrast, the nearby unprotected regions in the east showed a larger area with vegetation greening trend. These differences in vegetation greenness between the protected and unprotected regions are highly related to the driving mechanism of the vegetation greenness dynamics, which is critical for decision-makers to improve the conservation practices.

4.2. Drivers of Vegetation Greenness Dynamics

We found that water availability, especially soil moisture, was the main factor controlling the NDVI variation in the Dosso Reserve and adjacent regions. Previous studies have also shown that soil moisture limitation has a significant impact on semi-arid ecosystems [30]. Insufficient soil moisture can directly stress the vegetation vitality and even lead to vegetation death [30,60]. Precipitation is an important water resource for vegetation growth in arid areas [5,6,26], but its contribution to vegetation greenness was outweighed by that of soil moisture in the Dosso Reserve and adjacent regions (Figure 4). This is likely because soil moisture is the direct water resource for plants and determines the amount of water that can be extracted by plant roots. Factors such as soil texture, water retention capacity, and water infiltration could limit restrict vegetation growth by causing water scarcity [61,62]. The soil texture in most of the Dosso Reserve and surrounding region is characterized by a high sand fraction, resulting in high water infiltration rates and low water retention [63]. Notably, the NDVI varied rapidly over a certain range of soil moisture (e.g., 0.10–0.17 m3/m3 for the Dosso Reserve), and the vegetation browning in the Dosso Reserve was more sensitive to small-scale soil moisture changes than in the other two regions.
LULC change was also a significant factor affecting the dynamics of vegetation greenness in the Dosso Reserve and adjacent regions. Our study revealed not only a fragmented landscape outside the protected area but also a pattern of large LULC changes within the protected area, particularly in the low-lying Niger Valley on the western border of the Dosso Reserve (Figure 8). Among all LULC change types, changes in the fractions of grassland, shrubland and forest contributed most to the NDVI variation in the Dosso Reserve, regardless of whether the areas were protected or not (Figure 4). In general, an increase in grassland fraction and a decrease in fractions of shrubland and forest would reduce NDVI values. In the Dosso Reserve and surrounding areas, agriculture and grazing are the main productive activities to meet the increasing demands of population growth, which led to the widespread conversion of grassland, shrubs, and forests into cropland and pastures [14,18,25,64]. In addition, the Dosso Reserve is the main source of firewood supply and medicinal materials for the surrounding areas, and unsustainable wood extraction led to its degradation [65,66,67]. Overall, frequent land clearing for crop fields and pastures, overgrazing by livestock, and overexploitation of woody vegetation for fuel and medicinal materials reduced the fractional abundance of natural vegetation in a long-term period and resulted in vegetation browning. In contrast, the increases (gains) in forest and shrubland covers in the central part of the Dosso Reserve and the East buffer region may be related to the implementation of the land restoration project and appropriate protection [68,69], resulting in the vegetation greening in these areas. The Farmer-Managed Natural Regeneration (FMNR) project is a well-known land restoration project widely used in the West Sahel region of Africa [70,71,72]. This project encourages local farmers to reforest their croplands or pastures, with a focus on protecting and promoting the regeneration of small and medium-sized trees and shrubs in the fields. Other LULC changes, such as settlement expansion, also affected vegetation greenness variation, but their contributions were relatively small. In addition, forest cover in the North buffer region seemed to be the most important driver of greening, while grassland cover had a greater impact on browning in the Dosso Reserve. The potential ecological explanation of these contrasting observations might be that forest cover is less vulnerable to drought because of the deeper root system, which can smooth out dry periods [73,74], while grassland cover is more vulnerable to drought due to the shallow root system [75,76].
Our results also revealed that vegetation greenness trends to be negatively correlated with temperature and solar radiation in the regions. In the greening areas of the Dosso Reserve, for example, there seemed to be a negative relationship between NDVI and solar radiation (Figure 5b). It might be due to an increase in solar radiation causing a higher potential evapotranspiration and water demand, which implies a higher risk of drought given water availability. In this arid/semi-arid region, vegetation consists mainly of grasslands and low shrubs, which are highly sensitive to water availability. An increase in temperature or solar radiation often leads to an increase in potential evapotranspiration and VPD, which can exacerbate vegetation water stress and negatively affect vegetation growth [35,77,78,79]. Furthermore, increased VPD is expected to limit vegetation photosynthesis at the leaf scale by decreasing stomatal conductance and increasing non-photochemical quenching [35,80,81].
This study suggested that beneficial protection effects in the Dosso Reserve were limited. The results showed that the overall vegetation browning trends and drivers were rather similar inside and outside the Dosso Reserve (Figure 4). This might be related to the limited effectiveness of protection in the Dosso Reserve, coupled with shared arid climate conditions, similar water supply stress, and comparable anthropogenic pressures in both protected and unprotected areas. It is reported that the Dosso Reserve has existed only in name in recent decades [8,25]. The Dosso Reserve faces prominent issues such as relaxed management practices, inadequate long-term planning, and infrequent monitoring. These factors hinder the effective implementation of conservation protocols. Furthermore, the increasing population exerts additional pressure on the reserve. Widespread vegetation loss and land degradation caused by unsustainable agricultural expansion, deforestation, and grazing activities are common within the reserve, particularly in the west of the Dosso Reserve. It is worth noting that in recent years, with the rise and popularity of land restoration projects (e.g., Farmer-Managed Natural Regeneration project) in the West African region, restoration and rehabilitation of damaged ecosystems in protected areas have been targeted with some success [68,69]. A series of positive measures, such as constructing enclosure areas, rehabilitating soil, and planting live fences and densifying trees (e.g., local and exotic fruit trees) on anti-erosion strips, have mitigated the problem of vegetation loss under the pressure of human activities [68,69].
Overall, the applied method successfully provides evidence of the relative contributions of different drivers to vegetation greenness changes in this study. It is worth noting that reliable predictions from machine learning methods should maintain biophysical consistency. Assessing the physical consistency of identified relationships is challenging due to the complex nature of human–environment interactions and the lack of the reliable observations required for attribution. Establishing a benchmark for assessing physical consistency is complicated by the differences between satellite remote sensing data, reanalysis data, and field observations data. The RF model can capture the nonlinear relationships between NDVI and influencing factors, but caution is required in interpreting the results as these relationships may not be consistent with the underlying biophysical processes. In addition, the shortcomings of Random Forest algorithm in determining the direction of influence limit a better understanding of the driving mechanisms. In the future, it is important to explore the direction of influence further by explainable machine learning methods, or combining additional statistical methods like structural equation modeling, and to establish benchmarks for evaluating the interpretability of explanatory machine learning [82].

4.3. Implications for Social–Ecological Sustainability

Vegetation browning in the Dosso Reserve, driven by soil moisture stress and LULC change, is very likely to have some negative impacts on the protected ecosystems and wildlife. Vegetation browning, indicated by a decrease in leaf greenness, is generally associated with weakened plant photosynthesis, reduced productivity, and even plant death and destructive removal of the entire vegetation landscape [27,29]. This reduction in vegetation productivity and cover can lead to habitat fragmentation, which in turn can reduce populations of plant-feeding wildlife and lead to biodiversity loss [1,27,29,65]. This would threaten the fauna in the Dosso Reserve, particularly in the Niger Valley along the western border of the reserve, which serves as a water resource and important migratory route for many species. These impacts are consistent with documented cases of significant declines in wildlife populations [65,83,84].
In response to these impacts, the managers of the Dosso Reserve and the local government in the surrounding areas urgently need to implement effective conservation measures to promote sustainable social-ecological–environmental development. These interventions should include, but not be limited to, the following:
(1)
Land management strategies should be improved and strengthened in the Dosso Reserve. The issue of relaxed management practices should be addressed by implementing stricter and more effective management strategies within the Dosso Reserve. This includes enhancing enforcement of regulations, improving surveillance, and employing trained personnel to ensure proper protection and conservation efforts. Establishing comprehensive and well-structured long-term planning for the Dosso Reserve should involve setting clear conservation goals, defining strategies for achieving those goals, and outlining specific actions to be taken over an extended period. Regular assessments of the ecological health, biodiversity, and the effectiveness of protective measures in the reserve will enable better decision-making and the timely identification of emerging threats.
(2)
The issue of inadequate water supply, especially soil moisture stress, and implementing strategies to ensure sustainable use of water resources should be addressed. Possible management responses to the widespread water-holding capacity limitations include improving irrigation infrastructure, measures to increase soil organic matter, and using drought-tolerant or drought-avoiding crop varieties.
(3)
Sustainable land use practices should be improved and promoted to protect habitats. Encourage sustainable agricultural practices and discourage unsustainable activities such as expansion of agriculture, deforestation, and excessive grazing within the Dosso Reserve. This can be achieved through awareness campaigns, capacity-building programs, and providing incentives for adopting environmentally friendly practices.
(4)
Local implementation of vegetation restoration strategies, such as reforestation, grassland restoration, and soil conservation, is crucial to promote vegetation recovery and ecosystem health. Specific measures to address vegetation loss and land degradation in areas most affected should be deployed, particularly in the western region of the Dosso Reserve. In particular, it is necessary to provide local communities with the skills and tools they need to restore the land and generate income from tree products (e.g., fruits and nuts), rather than expanding farmland through extensive land clearance and shrub removal.
(5)
Protected area managers should collaborate with neighboring communities and the government to develop transboundary conservation and sustainable development strategies. To ensure the long-term sustainability of the ecosystem in the region, it is important that they work together to address both environmental and livelihood challenges.

5. Conclusions

In this study, we investigated the vegetation greenness dynamics in the Dosso Partial Faunal Reserve and adjacent regions of Niger during 2001–2020 using satellite time series. The different contributions of influencing factors to browning/greening were also diagnosed, and the responses of vegetation greenness to dominant drivers were revealed using the combination of the RF model and the PDP tool. The study found an overall vegetation browning trend in the Dosso Reserve and adjacent regions, with rather similar characteristics inside and outside the protected area. The significant browning trend dominated both in the Dosso Reserve (17.7%) and North buffer region (26.8%), while the East buffer region had a comparable extension of a significant browning trend (10.1%) and a significant greening trend (10.7%). Vegetation browning was clustered along the Niger Valley on the western border of the Dosso Reserve and North buffer region, while vegetation greening was mainly distributed in the central areas of the Dosso Reserve and East buffer region. It suggested that beneficial protection effects in the Dosso Reserve were limited. Furthermore, the results of the driver analysis showed that water supply (especially soil moisture supply) and LULC changes were the most important drivers controlling the NDVI variations in the Dosso Reserve and adjacent regions. Specifically, soil moisture stress and specific land management practices associated with extensive agricultural production activities appeared to dominate vegetation browning in the Dosso Reserve. In general, gain in grassland cover and loss in shrubland/forest cover associated with logging, grazing, and land clearing appeared to decrease NDVI values. In contrast, the gain in shrubland/forest in the central Dosso Reserve and the East buffer region was related to the implementation of protection and would increase NDVI values. These findings advanced our understanding of the dynamics of vegetation greenness in response to environmental changes both inside and outside the protected areas, highlighting the urgent need for more effective conservation planning and implementation for sustainable social-environmental development in this region.

Author Contributions

Conceptualization, Y.Z., L.J. and M.J.; methodology, Y.Z., L.J., M.M., M.J. and C.Z.; software, Y.Z.; validation, L.J., M.J. and C.Z.; formal analysis, Y.Z.; investigation, A.B. and Y.Z.; resources, L.J. and M.M.; data curation, Y.Z.; writing—original draft preparation, Y.Z.; writing—review and editing, Y.Z., L.J., M.J., C.Z., M.M., A.B. and Y.L.; visualization, Y.Z., L.J., M.J., C.Z., M.M., A.B. and Y.L.; supervision, L.J. and M.M.; project administration, L.J.; funding acquisition, L.J. and M.M. All authors have read and agreed to the published version of the manuscript.

Funding

This work was jointly supported by the projects funded by the Key Collaborative Research Program of the Alliance of International Science Organizations (Grant No. ANSO-CR-KP-2022-02), the Open Research Program of the International Research Center of Big Data for Sustainable Development Goals (Grant No. CBAS2023ORP05), the MOST High Level Foreign Expert program (Grant No. G2022055010L), and the Chinese Academy of Sciences President’s International Fellowship Initiative (Grant No. 2020VTA0001).

Data Availability Statement

Data are available upon request from the authors.

Conflicts of Interest

The authors declare no conflicts of interest.

References

  1. IPBES. Global Assessment Report on Biodiversity and Ecosystem Services of the Intergovernmental Science-Policy Platform on Biodiversity and Ecosystem Services; IPBES Secretariat: Bonn, Germany, 2019. [Google Scholar]
  2. Carvalho, F.P. Conservation of the last savannah animals in West Africa: Challenges and call for action. Int. J. Environ. Stud. 2020, 77, 1024–1043. [Google Scholar] [CrossRef]
  3. Fu, B.; Stafford-Smith, M.; Wang, Y.; Wu, B.; Yu, X.; Lv, N.; Ojima, D.S.; Lv, Y.; Fu, C.; Liu, Y.; et al. The Global-DEP conceptual framework-research on dryland ecosystems to promote sustainability. Curr. Opin. Env. Sust. 2021, 48, 17–28. [Google Scholar] [CrossRef]
  4. Milas, S. Population crisis and desertification in the Sudano-Sahelian Region. Environ. Conserv. 1984, 11, 167–169. [Google Scholar] [CrossRef] [PubMed]
  5. Fensholt, R.; Mbow, C.; Brandt, M.; Rasmussen, K. Desertification and Re-Greening of the Sahel. In Oxford Research Encyclopedia of Climate Science; Oxford University: Oxford, UK, 2017. [Google Scholar]
  6. Kusserow, H. Desertification, resilience, and re-greening in the African Sahel—A matter of the observation period? Earth Syst. Dynam 2017, 8, 1141–1170. [Google Scholar] [CrossRef]
  7. Fishpool, L.D.; Evans, M.I. Important Bird Areas in Africa and Associated Islands: Priority Sites for Conservation; BirdLife International Cambridge: Cambridge, UK, 2001. [Google Scholar]
  8. IUCN. Protected Areas of the World: A Review of National Systems. In Afrotropical; IUCN: Gland, Switzerland; Cambridge, UK, 1992; Volume 3. [Google Scholar]
  9. Dardel, C.; Kergoat, L.; Hiernaux, P.; Mougin, E.; Grippa, M.; Tucker, C.J. Re-greening Sahel: 30 years of remote sensing data and field observations (Mali, Niger). Remote Sens. Environ. 2014, 140, 350–364. [Google Scholar] [CrossRef]
  10. Kaptué, A.T.; Prihodko, L.; Hanan, N.P. On regreening and degradation in Sahelian watersheds. Proc. Natl. Acad. Sci. USA 2015, 112, 12133–12138. [Google Scholar] [CrossRef] [PubMed]
  11. Rasmussen, K.; D’Haen, S.; Fensholt, R.; Fog, B.; Horion, S.; Ostergaard Nielsen, J.; Vang Rasmussen, L.; Reenberg, A. Environmental change in the Sahel: Reconciling contrasting evidence and interpretations. Reg. Environ. Chang. 2016, 16, 673–680. [Google Scholar] [CrossRef]
  12. Ogutu, B.O.; D’Adamo, F.; Dash, J. Impact of vegetation greening on carbon and water cycle in the African Sahel-Sudano-Guinean region. Glob. Planet. Chang. 2021, 202, 103524. [Google Scholar] [CrossRef]
  13. Leroux, L.; Bégué, A.; Lo Seen, D. Regional analysis of crop and natural vegetation in West Africa based on NDVI metrics. In Proceedings of the IEEE Geoscience and Remote Sensing Symposium, Quebec, QC, Canada, 13–18 July 2014; pp. 5107–5110. [Google Scholar]
  14. Leroux, L.; Bégué, A.; Lo Seen, D.; Jolivot, A.; Kayitakire, F. Driving forces of recent vegetation changes in the Sahel: Lessons learned from regional and local level analyses. Remote Sens. Environ. 2017, 191, 38–54. [Google Scholar] [CrossRef]
  15. Jiang, M.; Jia, L.; Menenti, M.; Zeng, Y. Understanding spatial patterns in the drivers of greenness trends in the Sahel-Sudano-Guinean region. Big Earth Data 2022, 7, 298–317. [Google Scholar] [CrossRef]
  16. Zeng, Y.; Jia, L.; Menenti, M.; Jiang, M.; Barnieh, B.A.; Bennour, A.; Lv, Y. Changes in vegetation greenness related to climatic and non-climatic factors in the Sudano-Sahelian region. Reg. Environ. Chang. 2023, 23, 92. [Google Scholar] [CrossRef]
  17. Cotillon, S.E.; Tappan, G.G. Landscapes of West Africa: A Window on a Changing World; United States Geological Survey: Garretson, SD, USA, 2016. [Google Scholar]
  18. Herrmann, S.M.; Brandt, M.; Rasmussen, K.; Fensholt, R. Accelerating land cover change in West Africa over four decades as population pressure increased. Commun. Earth Environ. 2020, 1, 53. [Google Scholar] [CrossRef]
  19. Clerici, N.; Bodini, A.; Eva, H.; Grégoire, J.-M.; Dulieu, D.; Paolini, C. Increased isolation of two Biosphere Reserves and surrounding protected areas (WAP ecological complex, West Africa). J. Nat. Conserv. 2007, 15, 26–40. [Google Scholar] [CrossRef]
  20. Tang, X.; Adesina, J.A. Biodiversity conservation of national parks and nature-protected areas in West Africa: The case of Kainji National Park, Nigeria. Sustainability 2022, 14, 7322. [Google Scholar] [CrossRef]
  21. Henschel, P.; Coad, L.; Burton, C.; Chataigner, B.; Dunn, A.; MacDonald, D.; Saidu, Y.; Hunter, L.T. The lion in West Africa is critically endangered. PLoS ONE 2014, 9, e83500. [Google Scholar] [CrossRef] [PubMed]
  22. Gašparová, K.; Fennessy, J.; Moussa Zabeirou, A.R.; Abagana, A.L.; Rabeil, T.; Brandlová, K. Saving the last West African Giraffe population: A review of its conservation status and management. Animals 2024, 14, 702. [Google Scholar] [CrossRef] [PubMed]
  23. Houehanou, T.D.; Assogbadjo, A.E.; Kakaï, R.G.; Kyndt, T.; Houinato, M.; Sinsin, B. How far a protected area contributes to conserve habitat species composition and population structure of endangered African tree species (Benin, West Africa). Ecol. Complex. 2013, 13, 60–68. [Google Scholar] [CrossRef]
  24. Garba, H.H.M.; Di Silvestre, I. Conflicts between large carnivores and domestic livestock in the peripheral zone of the W transboundary Park in Niger. In Proceedings of the Management and Conservation of Large Carnivores in West and Central Africa, Maroua, Cameroon, 15–16 November 2006; pp. 133–144. [Google Scholar]
  25. Abdou, I.K.; Abasse, T.; Massaoudou, M.; Rabiou, H.; Soumana, I.; Bogaert, J. Influence des pressions anthropiques sur la dynamique paysagère de la Reserve Partielle de Faune de Dosso (Niger). Int. J. Biol. Chem. Sci. 2019, 13, 1094–1108. [Google Scholar] [CrossRef]
  26. Fensholt, R.; Rasmussen, K. Analysis of trends in the Sahelian ‘rain-use efficiency’ using GIMMS NDVI, RFE and GPCP rainfall data. Remote Sens. Environ. 2011, 115, 438–451. [Google Scholar] [CrossRef]
  27. Pettorelli, N.; Chauvenet, A.L.; Duffy, J.P.; Cornforth, W.A.; Meillere, A.; Baillie, J.E. Tracking the effect of climate change on ecosystem functioning using protected areas: Africa as a case study. Ecol. Indic. 2012, 20, 269–276. [Google Scholar] [CrossRef]
  28. Mishra, N.B.; Crews, K.A.; Neeti, N.; Meyer, T.; Young, K.R. MODIS derived vegetation greenness trends in African Savanna: Deconstructing and localizing the role of changing moisture availability, fire regime and anthropogenic impact. Remote Sens. Environ. 2015, 169, 192–204. [Google Scholar] [CrossRef]
  29. Hua, T.; Zhao, W.; Cherubini, F.; Hu, X.; Pereira, P. Effectiveness of protected areas edges on vegetation greenness, cover and productivity on the Tibetan Plateau, China. Landscape Urban. Plan. 2022, 224, 104421. [Google Scholar] [CrossRef]
  30. Liu, L.; Gudmundsson, L.; Hauser, M.; Qin, D.; Li, S.; Seneviratne, S.I. Soil moisture dominates dryness stress on ecosystem production globally. Nat. Commun. 2020, 11, 4892. [Google Scholar] [CrossRef] [PubMed]
  31. Piao, S.; Wang, X.; Park, T.; Chen, C.; Lian, X.; He, Y.; Bjerke, J.W.; Chen, A.; Ciais, P.; Tømmervik, H.; et al. Characteristics, drivers and feedbacks of global greening. Nat. Rev. Earth Environ. 2020, 1, 14–27. [Google Scholar] [CrossRef]
  32. Tagesson, T.; Tian, F.; Schurgers, G.; Horion, S.; Scholes, R.; Ahlström, A.; Ardö, J.; Moreno, A.; Madani, N.; Olin, S.; et al. A physiology-based Earth observation model indicates stagnation in the global gross primary production during recent decades. Glob. Chang. Biol. 2021, 27, 836–854. [Google Scholar] [CrossRef]
  33. Zhang, Z.; Ju, W.; Zhou, Y.; Li, X. Revisiting the cumulative effects of drought on global gross primary productivity based on new long-term series data (1982–2018). Glob. Chang. Biol. 2022, 28, 3620–3635. [Google Scholar] [CrossRef]
  34. Epule, E.T.; Peng, C.; Lepage, L.; Chen, Z. The causes, effects and challenges of Sahelian droughts: A critical review. Reg. Environ. Chang. 2014, 14, 145–156. [Google Scholar] [CrossRef]
  35. Yuan, W.; Zheng, Y.; Piao, S.; Ciais, P.; Lombardozzi, D.; Wang, Y.; Ryu, Y.; Chen, G.; Dong, W.; Hu, Z.; et al. Increased atmospheric vapor pressure deficit reduces global vegetation growth. Sci. Adv. 2019, 5, eaax1396. [Google Scholar] [CrossRef]
  36. Abdi, A.M.; Boke-Olén, N.; Tenenbaum, D.E.; Tagesson, T.; Cappelaere, B.; Ardö, J. Evaluating water controls on vegetation growth in the semi-arid Sahel using field and Earth observation data. Remote Sens. 2017, 9, 294. [Google Scholar] [CrossRef]
  37. Wei, F.; Wang, S.; Fu, B.; Wang, L.; Liu, Y.Y.; Li, Y. African dryland ecosystem changes controlled by soil water. Land. Degrad. Dev. 2019, 30, 1564–1573. [Google Scholar] [CrossRef]
  38. Rasmussen, K.; Fensholt, R.; Fog, B.; Vang Rasmussen, L.; Yanogo, I. Explaining NDVI trends in northern Burkina Faso. Geogr. Tidsskr.-Dan. J. Geogr. 2014, 114, 17–24. [Google Scholar] [CrossRef]
  39. Tappan, G.G.; Sall, M.; Wood, E.C.; Cushing, M. Ecoregions and land cover trends in Senegal. J. Arid. Environ. 2004, 59, 427–462. [Google Scholar] [CrossRef]
  40. Tong, X.; Brandt, M.; Hiernaux, P.; Herrmann, S.M.; Tian, F.; Prishchepov, A.V.; Fensholt, R. Revisiting the coupling between NDVI trends and cropland changes in the Sahel drylands: A case study in western Niger. Remote Sens. Environ. 2017, 191, 286–296. [Google Scholar] [CrossRef]
  41. Li, W.; Migliavacca, M.; Forkel, M.; Denissen, J.M.C.; Reichstein, M.; Yang, H.; Duveiller, G.; Weber, U.; Orth, R. Widespread increasing vegetation sensitivity to soil moisture. Nat. Commun. 2022, 13, 3959. [Google Scholar] [CrossRef]
  42. Breiman, L. Random forests. Mach. Learn. 2001, 45, 5–32. [Google Scholar] [CrossRef]
  43. Friedman, J.H. Greedy function approximation: A gradient boosting machine. Ann. Stat. 2001, 29, 1189–1232. [Google Scholar] [CrossRef]
  44. Zhou, J.; Jia, L.; Menenti, M.; Liu, X. Optimal estimate of global biome-specific parameter settings to reconstruct NDVI time series with the harmonic analysis of time series (HANTS) method. Remote Sens. 2021, 13, 4251. [Google Scholar] [CrossRef]
  45. Zhou, J.; Jia, L.; van Hoek, M.; Menenti, M.; Lu, J.; Hu, G. An optimization of parameter settings in HANTS for global NDVI time series reconstruction. In Proceedings of the 2016 IEEE International Geoscience and Remote Sensing Symposium (IGARRS), Beijing, China, 10–15 July 2016; pp. 3422–3425. [Google Scholar]
  46. Menenti, M.; Azzali, S.; Verhoef, W.; Vanswol, R. Mapping agroecological zones and time lag in vegetation growth by means of fourier analysis of time series of NDVI images. Adv. Space Res. 1993, 13, 233–237. [Google Scholar] [CrossRef]
  47. Verhoef, W.; Menenti, M.; Azzali, S. Cover A colour composite of NOAA-AVHRR-NDVI based on time series analysis (1981–1992). Int. J. Remote Sens. 1996, 17, 231–235. [Google Scholar] [CrossRef]
  48. Keys, R. Cubic convolution interpolation for digital image processing. IEEE Trans. Acoust. Speech Signal Process. 1981, 29, 1153–1160. [Google Scholar] [CrossRef]
  49. Zhang, X.; Zhao, T.; Xu, H.; Liu, W.; Wang, J.; Chen, X.; Liu, L. GLC_FCS30D: The first global 30 m land-cover dynamics monitoring product with a fine classification system for the period from 1985 to 2022 generated using dense-time-series Landsat imagery and the continuous change-detection method. Earth Syst Sci Data 2024, 16, 1353–1381. [Google Scholar] [CrossRef]
  50. Ahmedou, O.C.A.; Nagasawa, R.; Osman, A.E.; Hattori, K. Rainfall variability and vegetation dynamics in the Mauritanian Sahel. Clim. Res. 2008, 38, 75–81. [Google Scholar] [CrossRef]
  51. Chen, C.; Park, T.; Wang, X.; Piao, S.; Xu, B.; Chaturvedi, R.K.; Fuchs, R.; Brovkin, V.; Ciais, P.; Fensholt, R.; et al. China and India lead in greening of the world through land-use management. Nat. Sustain. 2019, 2, 122–129. [Google Scholar] [CrossRef] [PubMed]
  52. Yue, S.; Pilon, P.; Phinney, B.; Cavadias, G. The influence of autocorrelation on the ability to detect trend in hydrological series. Hydrol. Process 2002, 16, 1807–1829. [Google Scholar] [CrossRef]
  53. Wright, M.N.; Ziegler, A. ranger: A fast implementation of random forests for high dimensional data in C++ and R. J. Stat. Softw. 2015, 77, 1–17. [Google Scholar] [CrossRef]
  54. Olsson, L.; Eklundh, L.; Ardö, J. A recent greening of the Sahel—Trends, patterns and potential causes. J. Arid. Environ. 2005, 63, 556–566. [Google Scholar] [CrossRef]
  55. Hickler, T.; Eklundh, L.; Seaquist, J.W.; Smith, B.; Ardö, J.; Olsson, L.; Sykes, M.T.; Sjöström, M. Precipitation controls Sahel greening trend. Geophys. Res. Lett. 2005, 32, L21415. [Google Scholar] [CrossRef]
  56. Herrmann, S.M.; Anyamba, A.; Tucker, C.J. Recent trends in vegetation dynamics in the African Sahel and their relationship to climate. Glob. Environ. Chang. 2005, 15, 394–404. [Google Scholar] [CrossRef]
  57. Dardel, C.; Kergoat, L.; Hiernaux, P.; Grippa, M.; Mougin, E.; Ciais, P.; Nguyen, C.-C. Rain-use-efficiency: What it tells us about the conflicting Sahel greening and Sahelian paradox. Remote Sens. 2014, 6, 3446–3474. [Google Scholar] [CrossRef]
  58. Avakoudjo, J.; Mama, A.; Toko, I.; Kindomihou, V.; Sinsin, B. Dynamics of land use in the W National Park and its surrounding northwest of Benin. Int. J. Biol. Chem. Sci. 2014, 8, 2608–2625. [Google Scholar] [CrossRef]
  59. Janssens, I.; de Bisthoven, L.J.; Rochette, A.-J.; Kakaï, R.G.; Akpona, J.D.T.; Dahdouh-Guebas, F.; Hugé, J. Conservation conflict following a management shift in Pendjari National Park (Benin). Biol. Conserv. 2022, 272, 109598. [Google Scholar] [CrossRef]
  60. Fu, Z.; Ciais, P.; Prentice, I.C.; Gentine, P.; Makowski, D.; Bastos, A.; Luo, X.; Green, J.K.; Stoy, P.C.; Yang, H.; et al. Atmospheric dryness reduces photosynthesis along a large range of soil water deficits. Nat. Commun. 2022, 13, 989. [Google Scholar] [CrossRef]
  61. Suzuki, R.; Higuchi, A. Vegetation response to soil moisture and groundwater in west-central Africa revealed by satellite observations. Hydrol. Sci. J. 2022, 67, 1153–1164. [Google Scholar] [CrossRef]
  62. Yao, Y.; Liu, Y.; Zhou, S.; Song, J.; Fu, B. Soil moisture determines the recovery time of ecosystems from drought. Glob. Chang. Biol. 2023, 29, 3562–3574. [Google Scholar] [CrossRef] [PubMed]
  63. Ippolito, T.A.; Herrick, J.E.; Dossa, E.L.; Garba, M.; Ouattara, M.; Singh, U.; Stewart, Z.P.; Prasad, P.V.; Oumarou, I.A.; Neff, J.C. A comparison of approaches to regional land-use capability analysis for agricultural land-planning. Land 2021, 10, 458. [Google Scholar] [CrossRef]
  64. Barnieh, B.A.; Jia, L.; Menenti, M.; Zhou, J.; Zeng, Y. Mapping land use land cover transitions at different spatiotemporal scales in West Africa. Sustainability 2020, 12, 8565. [Google Scholar] [CrossRef]
  65. Kindo, A.I.; Abasse, T.; Soumana, I.; Bogaert, J.; Mahamane, A. Perceptions locales de la dynamique du paysage et de la faune: Cas de la Réserve Partielle de Faune de Dosso, Niger. Afr. Sci. Rev. Int. Sci. Technol. 2019, 15, 250–264. [Google Scholar]
  66. Fiorillo, E.; Maselli, F.; Tarchiani, V.; Vignaroli, P. Analysis of land degradation processes on a tiger bush plateau in South West Niger using MODIS and LANDSAT TM/ETM+ data. Int. J. Appl. Earth Obs. 2017, 62, 56–68. [Google Scholar] [CrossRef]
  67. Hiernaux, P.; Kalilou, A.A.; Kergoat, L.; Brandt, M.; Mougin, E.; Fitts, Y. Woody plant decline in the Sahel of western Niger (1996–2017): Is it driven by climate or land use changes? J. Arid. Environ. 2022, 200, 104719. [Google Scholar] [CrossRef]
  68. Peltier, R.; Akodewou, A.; Palou Madi, O.; Boubacar, A.; Sibelet, N. Agroforestry innovations in dryland area of Africa: Results of 40 years of research-action in North Cameroon and Dallol Dosso in Niger. In Proceedings of the Congrès Mondial d’Agroforesterie, Québec, QC, Canada, 17–20 July 2022. [Google Scholar]
  69. Larwanou, M.; Saadou, M. The role of human interventions in tree dynamics and environmental rehabilitation in the Sahel zone of Niger. J. Arid. Environ. 2011, 75, 194–200. [Google Scholar] [CrossRef]
  70. Reij, C.; Tappan, G.; Smale, M. Agroenvironmental Transformation in the Sahel: Another Kind of “Green Revolution”; International Food Policy Research Institute: Washington, DC, USA, 2009; pp. 7–33. [Google Scholar]
  71. Shono, K.; Cadaweng, E.A.; Durst, P.B. Application of assisted natural regeneration to restore degraded tropical forestlands. Restor. Ecol. 2007, 15, 620–626. [Google Scholar] [CrossRef]
  72. Brandt, M.; Romankiewicz, C.; Spiekermann, R.; Samimi, C. Environmental change in time series—An interdisciplinary study in the Sahel of Mali and Senegal. J. Arid. Environ. 2014, 105, 52–63. [Google Scholar] [CrossRef]
  73. Mainiero, R.; Kazda, M. Depth-related fine root dynamics of Fagus sylvatica during exceptional drought. Forest Ecol. Manag. 2006, 237, 135–142. [Google Scholar] [CrossRef]
  74. Poorter, H.; Niklas, K.J.; Reich, P.B.; Oleksyn, J.; Poot, P.; Mommer, L. Biomass allocation to leaves, stems and roots: Meta-analyses of interspecific variation and environmental control. New Phytol. 2012, 193, 30–50. [Google Scholar] [CrossRef] [PubMed]
  75. Freschet, G.T.; Roumet, C.; Comas, L.H.; Weemstra, M.; Bengough, A.G.; Rewald, B.; Bardgett, R.D.; De Deyn, G.B.; Johnson, D.; Klimešová, J. Root traits as drivers of plant and ecosystem functioning: Current understanding, pitfalls and future research needs. New Phytol. 2021, 232, 1123–1158. [Google Scholar] [CrossRef]
  76. Slette, I.J.; Hoover, D.L.; Smith, M.D.; Knapp, A.K. Repeated extreme droughts decrease root production, but not the potential for post-drought recovery of root production, in a mesic grassland. Oikos 2023, 2023, e08899. [Google Scholar] [CrossRef]
  77. Cheng, S.; Huang, J. Enhanced soil moisture drying in transitional regions under a warming climate. J. Geophys. Res. Atmos. 2016, 121, 2542–2555. [Google Scholar] [CrossRef]
  78. Berg, A.; Sheffield, J. Climate change and drought: The soil moisture perspective. Curr. Clim. Chang. Rep. 2018, 4, 180–191. [Google Scholar] [CrossRef]
  79. Yang, Y.; Roderick, M.L.; Guo, H.; Miralles, D.G.; Zhang, L.; Fatichi, S.; Luo, X.; Zhang, Y.; McVicar, T.R.; Tu, Z. Evapotranspiration on a greening Earth. Nat. Rev. Earth Environ. 2023, 4, 626–641. [Google Scholar] [CrossRef]
  80. Flexas, J.; Escalona, J.M.; Evain, S.; Gulias, J.; Moya, I.; Osmond, C.B.; Medrano, H. Steady-state chlorophyll fluorescence (Fs) measurements as a tool to follow variations of net CO2 assimilation and stomatal conductance during water-stress in C3 plants. Physiol. Plantarum 2002, 114, 231–240. [Google Scholar] [CrossRef]
  81. Hikosaka, K.; Tsujimoto, K. Linking remote sensing parameters to CO2 assimilation rates at a leaf scale. J. Plant Res. 2021, 134, 695–711. [Google Scholar] [CrossRef] [PubMed]
  82. Huang, F.; Zhang, Y.; Zhang, Y.; Nourani, V.; Li, Q.; Li, L.; Shangguan, W. Towards interpreting machine learning models for predicting soil moisture droughts. Environ. Res. Lett. 2023, 18, 074002. [Google Scholar] [CrossRef]
  83. Harris, N.C.; Mills, K.L.; Harissou, Y.; Hema, E.M.; Gnoumou, I.T.; VanZoeren, J.; Abdel-Nasser, Y.I.; Doamba, B. First camera survey in Burkina Faso and Niger reveals human pressures on mammal communities within the largest protected area complex in West Africa. Conserv. Lett. 2019, 12, e12667. [Google Scholar] [CrossRef]
  84. Craigie, I.D.; Baillie, J.E.; Balmford, A.; Carbone, C.; Collen, B.; Green, R.E.; Hutton, J.M. Large mammal population declines in Africa’s protected areas. Biol. Conserv. 2010, 143, 2221–2228. [Google Scholar] [CrossRef]
Figure 1. The location of the Dosso Reserve: (a) the location, (b) land use/land cover (LULC) map in 2020, and (c) mean annual NDVI in 2001–2020. The LULC information was derived and reclassified from the GLC_FCS30D product (see Section 2.2). The NDVI was derived from Moderate Resolution Imagery Spectroradiometer (MODIS) surface reflectance data.
Remotesensing 16 01728 g001
Figure 2. Spatial pattern of the temporal trend of annual NDVI during 2001–2020. (a) Spatial distribution of NDVI trend; (b) area percentages of NDVI trend types in different regions. (c,d) are the same as (a,b) but only with significant trend (p < 0.05).
Remotesensing 16 01728 g002
Figure 3. Overall trends in annual mean NDVI for the period 2001–2020 in different regions: (a) Dosso Reserve, (b) North buffer, (c) East buffer, and (d) Entire study area. The grey shadow indicates the 95% confidence interval of the trend line.
Remotesensing 16 01728 g003
Figure 4. Relative importance of potential influencing drivers on browning/greening for the three regions of Dosso Reserve, North buffer, and East buffer: the left column (a,c,e) is the case of significant browning; the right column (b,d,f) is the case of significant greening.
Remotesensing 16 01728 g004
Figure 5. Partial dependence of NDVI on the top three drivers in (a) significant browning and (b) significant greening areas in the Dosso Reserve, respectively. The grey vertical dashed lines represent the 10% and 90% quantiles of the drivers, respectively.
Remotesensing 16 01728 g005
Figure 6. Partial dependence of NDVI on the top three drivers in (a) significant browning and (b) significant greening areas in the North buffer region, respectively. The grey vertical dashed lines represent the 10% and 90% quantiles of the drivers, respectively.
Remotesensing 16 01728 g006
Figure 7. Partial dependence of NDVI on the top three drivers in (a) significant browning and (b) significant greening areas in the East buffer region, respectively. The grey vertical dashed lines represent the 10% and 90% quantiles of the drivers, respectively.
Remotesensing 16 01728 g007
Figure 8. LULC changes in the Dosso Reserve and the neighboring buffer regions during 2001–2020. Cr: cropland; Fo: forest; Gr: grassland; Sr: shrubland; Se: settlement. The symbols “↑” and “↓” denote gain and loss of a particular land cover type, respectively. The “no change” types were masked out from the map.
Remotesensing 16 01728 g008
Table 1. List of the factors influencing vegetation greenness change in this study.
Variable TypeVariable Name (Unit)DefinitionData Source
ClimateP (mm/yr)Annual sum precipitation CHIRPS
Tem (°C)Annual mean air temperatureERA5-Land
VPD (hPa)Annual mean vapor pressure deficitERA5-Land
Rad (MJ/m2)Annual total incoming shortwave solar radiationERA5-Land
Soil moistureSM (m3/m3)Annual weighted average soil moisture for the whole layer between 0 and 1 m depthsERA5-Land
Land use/land cover changeFraction in LULC (%)Yearly fractional abundance of cropland, forest, grassland, shrubland, wetland, water, settlement, and barelandGLC_FCS30D
PopulationPopYearly total number of populationWorldPop
Table 2. LULC reclassification types derived from the GLC_FCS30D products.
Reclassification Types in This PaperOriginal GLC_FCS30D Types
Cropland10Rainfed cropland
11Herbaceous cover cropland
12Tree or shrub cover (Orchard) cropland
20Irrigated cropland
Forest51Open evergreen broadleaved forest
52Closed evergreen broadleaved forest
61Open deciduous broadleaved forest (0.15 < fc < 0.4)
62Closed deciduous broadleaved forest (fc > 0.4)
71Open evergreen needle-leaved forest (0.15 < fc < 0.4)
72Closed evergreen needle-leaved forest (fc > 0.4)
81Open deciduous needle-leaved forest (0.15 < fc < 0.4)
82Closed deciduous needle-leaved forest (fc > 0.4)
91Open mixed-leaf forest (broadleaved and needle-leaved)
92Closed mixed-leaf forest (broadleaved and needle-leaved)
185Mangrove
Grassland130Grassland
150Sparse vegetation (fc < 0.15)
152Sparse shrubland (fc < 0.15)
153Sparse herbaceous (fc < 0.15)
Shrubland120Shrubland
121Evergreen shrubland
122Deciduous shrubland
Wetland181Swamp
182Marsh
183Flooded flat
184Saline
186Salt marsh
187Tidal flat
Water210Water body
Tundra140Lichens and mosses
Settlement190Impervious surfaces
Bareland200Bare areas
201Consolidated bare areas
202Unconsolidated bare areas
Snow/Ice220Permanent ice and snow
Table 3. Hyper-parameter settings for grid search in the RF models.
Hyper-ParameterMeaningRangeIntervalFinal Decision
mtry The number of randomly selected features to consider for splitting at each node.[1, 14]114
splitrule The criterion used for node splitting.[‘variance’, ‘extratrees’, ‘maxstat’]—— ‘extratrees’
min.node.sizeThe minimum number of samples allowed in a node.[1, 8]11
Table 4. The validation metrics of the six regional RF models.
Scenarios Scenarios SettingR2RMSE
Dosso-Bsignificant browning in the Dosso Reserve0.7160.031
Dosso-Gsignificant greening in the Dosso Reserve0.7460.023
North-Bsignificant browning in the North buffer region0.7590.021
North-Gsignificant greening in the North buffer region0.8000.021
East-Bsignificant browning in the East buffer region0.7850.022
East-Gsignificant greening in the East buffer region0.8920.022
Disclaimer/Publisher’s Note: The statements, opinions and data contained in all publications are solely those of the individual author(s) and contributor(s) and not of MDPI and/or the editor(s). MDPI and/or the editor(s) disclaim responsibility for any injury to people or property resulting from any ideas, methods, instructions or products referred to in the content.

