
Critical Threshold-Based Heat Damage Evolution Monitoring to Tea Plants with Remotely Sensed LST over Mainland China


1
State Key Laboratory of Severe Weather, Chinese Academy of Meteorological Sciences, Beijing 100081, China
2
Collaborative Innovation Center of Meteorological Disaster Forecast, Early-Warning and Assessment, Nanjing University of Information Science & Technology, Nanjing 210044, China
3
Research Institute of Forest Resource Information Techniques, Chinese Academy of Forestry, Beijing 100091, China
*
Author to whom correspondence should be addressed.
Remote Sens. 2024, 16(10), 1784; https://doi.org/10.3390/rs16101784
Submission received: 10 March 2024
/
Revised: 12 May 2024
/
Accepted: 13 May 2024
/
Published: 17 May 2024
(This article belongs to the Special Issue Remote Sensing in Hazards Monitoring and Risk Assessment)
Abstract
:Tea plants (Camellia sinensis (L.) Kuntze) are a cash crop that thrive under warm and moist conditions. However, tea plants are becoming increasingly vulnerable to heat damage (HD) during summer growing seasons due to global climate warming. Because China ranks first in the world in both harvested tea area and total tea production, monitoring and tracking HD to tea plants in a timely manner has become a significant and urgent task for scientists and tea producers in China. In this study, the spatiotemporal characteristics of HD evolution were analyzed, and a tracking method using HD LST-weighted geographical centroids was constructed based on HD pixels identified by the critical LST threshold and daytime MYD11A1 products over the major tea planting regions of mainland China from two typical HD years (2013 and 2022). Results showed that the average number of HD days in 2022 was five more than in 2013. Daily HD extent increased at a rate of 0.66% per day in 2022, which was faster than that in 2013 with a rate of 0.21% per day. In two typical HD years, the tea regions with the greatest HD extent were concentrated south of the Yangtze River (SYR), with average HD pixel ratios of greater than 50%, then north of the Yangtze River (NYR) and southwest China (SWC), with average HD pixel ratios of around 40%. The regions with the least HD extent were in South China (SC), where the HD ratios were less than 40%. The HD LST-weighted geographical centroid trajectories showed that HD to tea plants in 2013 initially moved from southwest to northeast, and then moved west. In 2022, HD moved from northeast to west and south. Daily HD centroids were mainly concentrated at the conjunction of SYR, SWC, and SC in 2013, and in northern SWC in 2022, where they were near to the centroid of the tea planting gardens. The findings in this study confirmed that monitoring HD evolution of tea plants over a large spatial extent based on reconstructed remotely sensed LST values and critical threshold was an effective method benefiting from available MODIS LST products. Moreover, this method can identify and track the spatial distribution characteristics of HD to tea plants in a timely manner, and it will therefore be helpful for taking effective preventative measures to mitigate economic losses resulting from HD.
1. Introduction
Tea (Camellia sinensis (L.) Kuntze) has become a popularly and commonly consumed beverage in modern life as cultivation of tea has grown worldwide. The area of harvested tea plantations reached 5.31 × 10⁶ ha in 2020 with a production of 7.02 × 10⁹ kg [1], values which were 49.2% and 37.4%, respectively, higher than those in 2018 [2]. China ranks first among all countries in the world in terms of both harvested tea area and total production, followed by India and Kenya. Tea plants are grown in 19 provinces and municipalities in mainland China, mainly located in regions north of the Yangtze River (NYR), south of the Yangtze River (SYR), southwest China (SWC), and South China (SC) [3].
Global warming is now recognized as occurring worldwide. The newly released IPCC Sixth Assessment Report states that global surface temperature during the first two decades of the 21st century (2001–2020) was 0.99 [0.84 to 1.10] °C higher than during 1850–1900, and the increase was 1.09 [0.95 to 1.20] °C from 1850–1900 to 2011–2020 [4]. Furthermore, surface temperatures have increased faster over land than over oceans since 1850–1900, with warming during 2011–2020 of 1.59 [1.34 to 1.83] °C over land and 0.88 [0.68 to 1.01] °C over oceans [4]. Previous research has revealed that climate warming has produced negative impacts on most crop yields, such as wheat [5], maize [6,7,8], rice [9], and soybean [10], as well as on grain quality [11,12] across the world.
Tea plants are a cash crop that thrive under warm and moist conditions. However, tea plants are vulnerable to heat damage (HD) during summer growing seasons. Previous studies have predicted that although there have been net positive impacts of climate change on tea yield over China at both the 1.5 °C and 2 °C global warming levels, new areas of yield reduction due to intensified heat extremes may emerge, and the yield losses are estimated to range from 14 to 26% along the Yangtze River and in southern China [13]. The Yearbook of Meteorological Disasters in China [14] reported that high temperatures and drought from 23 July to 18 August 2013 caused disasters to tea trees in Anhui Province, during which more than 2.5 × 10⁴ ha of Huangshan tea gardens were affected, thereby directly affecting spring tea production in the coming year. On 23 July 2017, China National Radio (CNR) reported that some tea gardens in Jiajiang County, Sichuan Province suffered HD due to continuously high temperatures, and that more than 90% of the tea gardens at Guixiang Village suffered from burning and scorching of mature tea leaves, withering of young tea leaves, and death of tea seedlings (http://country.cnr.cn/market/20170723/t20170723_523863565.shtml (last accessed on 12 May 2024)). A published book also recorded that the continuous sunny conditions and high temperatures from 1 July to 18 August 2013 caused nearly 80% of tea gardens in Zhejiang Province to suffer from HD [15]. Therefore, timely monitoring of HD to tea plants has become one of the main tasks of the meteorological department with regard to serving agricultural production, in order to take timely and effective HD prevention measures, such as morning and evening sprinkle irrigation and midday shading, to reduce the temperature and HD impact on tea plants.
Timely monitoring of natural disasters has been widely carried out in various fields. Water-related monitoring has mainly focused on water stresses, such as meteorological drought monitoring based on data from an automatic weather station network [16], surface–air temperature differences [17], and satellite images [18], and soil moisture index monitoring for food security by integrating SMOS (soil moisture and ocean salinity) and SMAP (soil moisture active passive) remote sensing data [19]. Rapid and near real-time monitoring of insect-induced defoliation [20], deforestation [21], and forest disturbance [22,23] have been related to ecosystem functioning. Applications of near real-time monitoring in air pollution studies [24,25] and environmental enforcement [26] have also attracted much attention in recent years. However, there are few reports on the timely monitoring of HD to crops. Moreover, the data used in previous monitoring research have mostly been from multiple sources, such as a variety of ground-based observations [27], multi-resolution satellite remote sensing images [19,28,29], etc., that may have great challenges with regard to data availability, spatiotemporal consistency, and scaling conversion. Therefore, timely monitoring of the evolution characteristics of natural disasters based on a single data source may be a major trend in future research applications.
Currently operational agrometeorological services in China have carried out timely monitoring of temperature-related agricultural disasters based on air temperatures observed by ground-based meteorological stations. Observations of air temperature cannot effectively reflect spatial variations due to the limited extent of the weather station network layout, especially in complex terrain areas. Although some spatial interpolation techniques have been researched over the past decades, different interpolation methods may yield different results in the same region. Therefore, some statistical methods, such as the stepwise linear regression method [30], the temperature–vegetation index method [31], the linear mixed effect method [32], and the random forest machine learning approach [33], have been used to estimate daily maximum air temperature based on remotely sensed land surface temperature (LST). Even so, deviations still exist, with mean absolute error or root mean square error values of 1.7–3.0 °C [30,31,33] for the maximum air temperature between observations and estimations, and these values strongly depend on seasonality and the complexity of the surface energy budget [30,34,35].
Remotely sensed LST is a direct measure of the energy being released by a surface, which is whatever satellite sensors can capture when viewing various surfaces (e.g., snow, building roofs, lawn grass, or vegetation canopy leaves) through the atmosphere [36]. Therefore, satellite-based LST has shown great capabilities in the timely monitoring of natural hazards and disasters due to its high spatial resolution, short revisit period, and wide coverage area. Some examples include monitoring the channel width of the six largest Arctic rivers by using GCOM-C/SGLI [37], identifying coal fires by integrating multitemporal thermal infrared and InSAR remote sensing data [38], monitoring agricultural drought by using LST retrievals and NDVI [29,39], and quantifying the sensitivity of canopy thermal stress by using surface–air temperature differences [17]. However, research on the application of thermal infrared data for identifying and quantifying HD to tea plants at grid scale has not yet been reported.
The main purposes of this study were to investigate how to monitor HD evolution to tea plants based on remotely sensed LST threshold, and further, to reveal the spatiotemporal evolution characteristics of HD during an HD event at the pixel scale over the entire China tea planting region. To achieve this goal, the annual dynamics of the ration of HD pixels to the total pixels of tea gardens in mainland China were initially analyzed from 2002 to 2022. Then, two typical HD years were selected to characterize the spatiotemporal distribution of HD during the tea growing season in summer at three different spatial scales. Daily HD LST-weighted geographical centroids were then extracted, and the HD evolution trajectories were dynamically tracked. Finally, discussion and conclusions were summarized.
2. Study Area
Climate is one of several critical factors that determine where crops are planted. Tea plants can be grown over a wide range of climatic conditions, and can tolerate light snow or frost, as well as tropical and subtropical climates with high humidity. Previous research has delineated the major tea planting regions in mainland China to be between 20° and 37°N and 98° and 121°E [13], covering an area of approximately 2.55 × 10⁶ km2 and accounting for approximately 26.58% of the area of mainland China. It includes all or parts of 17 provinces and two municipalities: Shandong (SD), Henan (HEN), Shaanxi (SN), Gansu (GS), Jiangsu (JS), Anhui (AH), Hubei (HB), Shanghai (SH), Zhejiang (ZJ), Jiangxi (JX), Hunan (HN), Sichuan (SIC), Chongqing (CQ), Yunnan (YN), Guizhou (GZ), Fujian (FJ), Guangdong (GD), Guangxi (GX), and Hainan (HI) [3] (Figure 1).
The climate of the major tea planting regions in mainland China is affected by temperate and subtropical monsoon conditions, with warm and windy springs, hot and rainy summers, cool and sunny autumns, and slightly cold and dry winters. The average annual temperature ranges from 13 to 20 °C, and the annual precipitation is between 800 mm and 2000 mm, decreasing from the south to the north. An anomalous anticyclone in the troposphere during summer usually causes HD events that are characterized by increased solar radiation and decreased rainfall and cloud cover [40,41]. Global warming has also accelerated this anomalous atmospheric circulation. Therefore, HD often seriously affects agricultural and industrial production [41], especially with regard to high-yielding cash crops in China, such as tea plants.
3. Data and Methodology
3.1. Data
3.1.1. MODIS LST Products
MODIS sensors were launched on board the National Aeronautics and Space Administration (NASA) Terra and Aqua satellites in 1999 and 2002, respectively. Terra passes from north to south at about 10:30 a.m. and p.m. local solar time, while Aqua passes from south to north at about 1:30 p.m. and a.m. local solar time on each day. The passing time of Aqua is closer to the observed time of daily maximum air temperature, so the LST products on board the Aqua satellite platform were selected to monitor HD to tea plants in this study.
Daily MODIS LST products were retrieved from the MODIS thermal and middle infrared spectral regions at 1 km pixels by using the generalized split window algorithm that corrects for atmospheric effects [42]. These data are easily available to the public via the Earth Observing System Data and Information System of NASA (https://earthdata.nasa.gov/. Last visited on 26 June 2023). To cover the entire study area, daily MODIS daytime LST products (MYD11A1, version 6) of seven tiles in a 1200 by 1200 grid at 1 km spatial resolution were downloaded from June through August in 2002–2022, including h26v05, h27v05, h28v05, h26v06, h27v06, h28v06, and h28v07. The daily MYD11A1 products for the seven tiles were re-projected to Albers Conical Equal Area projection, and then merged, resized, and mosaicked to obtain a dataset that was exactly consistent with the study area.
3.1.2. Tea Planting Distribution
The MODIS Terra + Aqua Combined Land Cover products (MCD12Q1) were created using a hierarchical classification model that ingested a full year of 8-day MODIS Nadir BRDF-Adjusted Reflectance (NBAR) data [43]. The MCD12Q1 product provides global maps of land cover types at annual time steps and 500 m spatial resolution from 2001 to present. It contains six different land cover classification schemes, including IGBP (International Geosphere-Biosphere Programme), UMD (University of Maryland), LAI (Leaf Area Index), BGC (BIOME Biogeochemical Cycles), PFT (Plant Functional Types), and LCCS (Land Cover Classification System) [43]. In this study, closed shrublands and open shrublands (consisting of woody perennials with more than 10% coverage rate and 1–2 m height) in the IGBP classification scheme were extracted to identify the tea planting gardens in China (the green dots in Figure 1).
3.1.3. Historical HD Descriptions in the Yearbook of Meteorological Disasters
A wide range of high-temperature processes from June through August in 2013 was recorded in the Yearbook of Meteorological Disasters in China (2014) [14]. The records described four high-temperature processes: 15–20 June, 27 June–20 July, 22 July–24 August, and 27–29 August. During 15–20 June, a wide range of high-temperature weather occurred from Huanghuai to South China, especially in central Henan, western Hubei, northeastern Chongqing, southern Shaanxi, and the Sichuan Basin, with extreme maximum temperatures reaching new high values. From July to August in 2013, southern China experienced the strongest high-temperature heat wave since 1951, with 31 high-temperature days in nine provinces, including Shanghai, Zhejiang, Jiangxi, and Hunan in the area south of the Yangtze River; Chongqing and Guizhou in southwest China; and Hubei, Anhui, and Jiangsu along the Yangtze River.
Long-term severe high temperatures can cause heat damage and sunburn disasters in tea gardens. For example, more than 2.5 × 10⁴ ha of Huangshan tea gardens in Anhui Province were affected in 2013, causing potential impacts on the output and quality of Chinese spring tea in the following year [14].
3.1.4. Disaster Reports via Web News
The year 2022 featured an unprecedented hot summer that attracted worldwide attention [44]. Web news services overwhelmingly reported that the summer of 2022 experienced strong high-temperature conditions in the middle and lower reaches of the Yangtze River in China. The maximum temperature values and the number of high-temperature days at many meteorological stations exceeded those observed in 2013, which had been the strongest high-temperature year since 1961. Severe weather with high temperatures, little precipitation, and sunburning produced mild to moderate HD to tea plants over a large spatial extent. Some areas with young tea gardens and vulnerable tea varieties were greatly affected, resulting in severe HD [45].
3.2. Methodology
3.2.1. The Critical LST Threshold for HD to Tea Plants
The box-plot and cumulative frequency distribution (CFD) methods were jointly used to determine the critical LST threshold for HD to tea plants in China. The box-plot method is a graphically-based method of showing the distribution of collected data, such as median, first and third quartile, non-outlying minimum and maximum values, and potential outliers [46]. Nowadays, the boxplot method has commonly been used to identify outliers by quartiles and interquartile ranges [47,48,49] because of its simplicity [50]. The cumulative frequency distribution has also been widely used for distinguishing different mass spectra of intact proteins [51], identifying hotspots in conservation and ecology [52], and discriminating data classes emanating from sensors [53]. Previous research combining box-plot and CFD methods has determined that the critical LST threshold for HD to tea plants in China is 30.1 °C, and this value is applicable over a large spatial extent in different climatic regions for Chinese tea plantations, and is also suitable for different tea varieties [54].
3.2.2. Reconstruction for Gap-Filled MODIS LST Values
MODIS LST products are unavailable when clouds exist during satellite overpassing periods [2]. Cloud contamination, therefore, has strong impacts on the availability and the quality of LST products [55]. A clear-sky MODIS LST reconstruction method (RSDAST) [56] was used in this study to reconstruct gap-filled MODIS LST pixels. Unlike other temperature reconstruction methods, RSDAST requires only one parameter (the MODIS LST product itself), based on the assumption that differences in LST between nearby pixels are relatively stable during a short time period. Reconstructed LST values have good accuracies not only in flat areas, but also in complicated terrain areas. The statistics for mountain areas, with an elevation range from 50 to 5000 m, were R2 of 0.81–0.89, bias of −0.35 to −1.52 k, and RMSE of 1.42–2.24 k [56].
3.2.3. Spatiotemporal Evolution Tracking of HD
Spatiotemporal tracking of HD geographical centroids is an effective way to monitor the evolutionary characteristics of HD to tea plants. It consists of three main steps (Figure 2): (1) identification of HD pixels; (2) LST-weighted location of HD centroids; and (3) spatiotemporal tracking of HD centroids [57].
(1) Identification of HD pixels
All HD pixels in the tea planting gardens of China were identified based on the critical LST threshold for each day from June through August. When the LST value at a certain pixel was above or equal to the critical LST threshold, the LST value was reserved as a weight coefficient (Step 2) to indicate that the cell was experiencing HD; otherwise, the pixel was labeled as HD-free, with a value of 0 [57].
(2) Locating LST-weighted centroids
Based on the identified HD pixels, daily HD geographical centroids were calculated by considering HD intensity [58], denoted by the difference between the LST values at HD pixels and the critical LST threshold:
where (, ) is the geographical LST-weighted centroid of HD on certain days; is the LST value at HD pixel (); and are the longitude and latitude of HD pixel (); and is the critical LST threshold referred to in Section 3.2.1. The subscripts of m and n are the rows and columns of the study area.
(3) Spatiotemporal tracking of HD centroids
Each HD centroid was tracked in time sequence to produce the spatiotemporal tracking path of the HD centroids. The characteristics of HD evolution and direction can be clearly identified by the tracking path [59].
3.2.4. HD Characteristics
HD ratios and HD days were calculated to express HD characteristics in this study. HD ratios were the ratio of identified HD pixels to the total pixels of tea gardens in mainland China on each day. Then, average values of HD ratios at different temporal and spatial scales were calculated to obtain annual HD ratios, provincial HD ratios, or regional HD ratios. HD days were the total days affected by HD at each grid cell in a certain year.
4. Results
4.1. Annual Dynamics of HD Ratios for Tea Plants from 2002 to 2022
The annual HD extent, expressed as HD ratios, from 2002 to 2022 for the entire mainland area of China and the four different tea regions are shown in Figure 3a. For the tea gardens in the entire mainland area of China, nearly half of the 21 years on record had HD ratios between 25% and 33%, and the upper outlier had an HD pixel ratio of 44.94%, appearing in 2022. For the entire mainland area of China, the mean and median HD ratio values were both close to 30%, which meant that approximately 30% of the tea regions were likely to have experienced HD disasters during the past 21 years. From the perspective of comparing the four tea regions, the region with the largest HD ratio and the largest number of years with HD was SYR, followed by NYR, and SWC had the smallest mean HD ratio. It is worth noting that the number of HD years in the SC tea region had two peaks, which occurred around HD pixel ratio values of 28% and 38%, respectively. There was a clear data gap between HD pixel ratio values of 30% and 34% in SC, and the median HD ratio was obviously larger than the mean.
The HD ratios fluctuated from 2002 to 2022, especially in the last decade (Figure 3b). The upper and lower quartiles of the HD ratios were concentrated between 20% and 40% in most years, except the years of 2013, 2018, 2020, and 2022. The three years with the largest HD ratios were 2013, 2018, and 2022, and their median and mean HD ratios were around 40%. In contrast, extremely low HD ratios occurred in 2020, with more than half of HD ratios observed to be between 15% and 21%, and with both the median and mean HD ratios being less than 20%.
The distribution of HD ratios in 2013 and 2018 were similar, but the HD ratios were slightly higher in 2013 than in 2018. Therefore, two years (2013 and 2022) were selected as typical HD years for detailed analysis.
4.2. Temporal Dynamics of HD Ratios for Tea Plants in Two Typical HD Years
4.2.1. Daily Dynamics in Mainland China
Daily dynamics of HD extent, also expressed as HD ratios, from 1 June to 31 August were analyzed using average values of HD ratios over the entire tea planting region of mainland China in two typical HD years (2013 and 2022) (Figure 4). Daily HD extent clearly varied more drastically in 2022 than in 2013.
In 2013, daily HD extent increased linearly at a rate of 0.21% per day (slope was significant at p < 0.01), with a maximum HD ratio of 77.46% on 15 August, and a minimum value of 3.98% on June 6 (Figure 4a). The HD extent in August was the highest, with a monthly average ratio of 48.89%, followed by July with an average of 38.31%, and June with the smallest monthly average HD ratio of 34.35%. In 2022, the HD ratios also increased significantly (p < 0.01) with time as in 2013, but covered a wider range of values and increased at a faster rate. Daily HD ratio significantly increased at a rate of 0.66% per day, with the maximum and minimum values of 89.68% and 1.87% on 25 July and 4 June, respectively (Figure 4b). Monthly average values of HD ratio increased dramatically over time, with August being the highest (64.62%), June being the smallest (20.56%), and July having a value of 48.84%.
4.2.2. Daily Dynamics of HD Extent at Regional Scale
Daily HD extent values in 2013 and 2022 were calculated by taking each tea planting area as a statistical unit, and the dynamics of HD extent are shown in Figure 5. The HD extent for each of the four tea planting areas was quite different. The greatest HD extent appeared at SYR, with average HD ratios of 52.62% and 51.46% from June through August in 2013 and 2022 (Figure 5b), followed by NYR and SWC, with average HD ratios of around 40% (Figure 5a and Figure 5c, respectively). Average HD ratios in SC were less than 40%, with values of 35.02% and 38.34% in 2013 and 2022 (Figure 5d). Except for SYR, the average HD ratios in the other three tea planting areas were greater in 2022 than in 2013, and the difference in these two years was between 3.32 and 7.24%. Daily HD extent showed large fluctuations from day to day, with a minimum HD ratio of 0.00% appearing in SC on 10 June in both 2013 and 2022, and a maximum HD ratio of 99.81% in SYR on 7 August 2013.
4.2.3. Daily Dynamics of HD Extent at Provincial Scale
The daily dynamics of HD extent at the provincial scale from June through August in 2013 and 2022 are shown in Figure 6. Because three provinces (i.e., JS, AH, and HB) spanned the tea planting regions of NYR and SYR, the HD ratios for each of these provinces in the corresponding tea regions were calculated and shown separately.
As in Figure 5, HD in SYR in 2013 was the greatest in terms of both HD duration and HD extent, followed by NYR, and HD in SC and SWC was relatively light (Figure 6a). The HD ratios in all provinces of SYR in 2013 were high from July 8 to August 18, with average and median HD ratios of 76.82% and 91.86%, respectively. The number of days × provinces with HD ratio of 100% was 28. In NYR, the regions with high HD ratios were mainly located in HEN and the northern regions of JS, AH, and HB, where higher HD ratios were observed in early to mid-August with values between 60% and 100%. In SWC, the temporal distribution of HD ratios was completely different from those in SYR and NYR. The higher HD ratios occurred in YN and GZ from June 12 to 19, with an average ratio of 81.27%, and in SIC and CQ from August 12 to 27, with an average ratio of 77.89%. The HD ratios in SC were relatively scattered in time and space, and there was no obvious province or period of concentrated HD.
In 2022, the higher HD ratios mainly occurred in mid-June in NYR and extended over the entire tea planting region of mainland China from late July (Figure 6b). HD in 2022 had a wider extent, a longer duration, and a higher HD pixel ratio than in 2013. From June to August, the total number of days × provinces with HD ratios greater than 40% was 970 in 2022 and 874 in 2013. The maximum number of HD days with daily HD ratios of greater than 40% in 2013 appeared at HN with the number of HD days reaching 62, followed by ZJ and CQ with values of 57 d. The maximum number of HD days in 2022 was close to the number observed in 2013, with a value of 61 d in ZJ. However, the average number of HD days for all provinces in 2022 was five days more than in 2013. The average number of HD days with HD ratios of greater than 40% was the highest in the tea planting region of SYR in both 2013 and 2022, with the number of HD days reaching 48 d and 52 d, respectively. The number of HD days in the other three regions was around 40 d (between 35 d and 42 d), with slightly more HD days in 2022 than in 2013.
4.3. Spatial Characteristics of Number of HD Days for Tea Plants in Typical HD Years
The spatial characteristics of HD intensity, expressed as number of HD days in this study, are shown in Figure 7. Except for the northern part of SWC, the spatial distribution of HD intensity in 2022 was generally similar to 2013. In 2022, the number of HD days in northern SWC exceeded 40 d, while in 2013, the number of HD days was between 20 and 40 days in the same region. The difference in the number of HD days was more than half a month between the two typical HD years.
Areas with more than 40 HD days (denoted by dark red color in Figure 7) occurred mainly along the Yangtze River (i.e., the southeastern parts of the SIC Basin, northern parts of GZ and CQ, southern parts of HB and AH, and central parts of HN, JX, and ZJ) in both 2013 and 2022. The areas with a number of HD days between 20 and 40 d (denoted by light brown) were mainly located in tea planting gardens of central regions of SWC in 2013, and the entire region of SC and western regions of NYR in 2013 and 2022. Regions with numbers of HD days less than 20 d (denoted by light orange) were scattered across the northern and central parts of NYR, the southern parts of SWC, and sporadic areas of SYR. Generally, HD intensity in the tea planting regions of mainland China followed a spatial distribution of greatest along the Yangtze River, less in the south, and least in the north.
4.4. Spatiotemporal Tracking of HD Geographical Centroids in Two Typical HD Years
Daily HD LST-weighted geographical centroids in 2013 and 2022 were located based on the identified HD pixels and their HD intensity in the tea planting regions of China. The spatial distribution of these centroids is shown in Figure 8. Daily geographical centroids in both 2013 and 2022 were concentrated in western SYR, eastern SWC, and northern SC, where the centroids were concentrated around the centroid for the tea planting gardens (the green circle with a cross in Figure 8). Nevertheless, the daily HD geographical centroids for 2013 and 2022 presented completely different trajectories.
In 2013 (Figure 8a), the HD centroid originated in SWC, west of the tea planting gardens centroid, and then gradually moved northeastward until the end of June. After that, the HD centroids slowly moved to northern SC in July. Finally, the HD centroids moved into the central and northern parts of HN and JX in the tea planting gardens of SYR at the end of August. The maximum movement of HD centroids in the north–south direction (9.18°N) was slightly smaller than centroid movement in the east–west direction in 2013 (9.36°E).
In 2022 (Figure 8b), the HD centroids first appeared in the east of the tea planting gardens of SYR and NYR in early June, and then moved west and south. Most of the HD centroids were clustered in the eastern part of SIC and GZ in the tea planting gardens of SWC in July and August. Daily HD geographical centroids showed a spatial distribution similar to a right triangle, with the final centroid located at the right vertex of the triangle in South China.
5. Discussion
5.1. Spatiotemporal Distribution of HD
The major weather-related hazard to tea production during summer is HD caused by high temperature. Spatiotemporal characteristics of HD to tea plants in mainland China were analyzed in two typical HD years (2013 and 2022) in this study. Spatially, HD was concentrated in the tea planting regions of SYR, and this finding was consistent with a long-lasting high-temperature event in the summer of 2013 in a zone extending from North China southward to the south of the lower reaches of the Yangtze River in East China [60,61]. In terms of temporal evolution, HD mainly occurred from mid-to-late July to mid-August, and these occurrences of HD coincided with historical HD descriptions in the Yearbook of Meteorological Disasters [14]. In 2022, the areas with a number of HD days greater than 40 d based on the critical LST threshold were mainly distributed in the SIC Basin and the middle and lower reaches of the Yangtze River, which basically coincided with the occurrences of maximum air temperature [62]. From July to August 2022, there were overwhelming media reports (https://www.capiaccti.org.cn/industrynews/b69f67c062ff3f6311ea7def2d354a2f (last accessed on 12 May 2024); https://www.thepaper.cn/newsDetail_forward_19425033 (last accessed on 12 May 2024); http://www.news.cn/politics/2022-08/22/c_1128933935.htm (last accessed on 12 May 2024)) that tea production in many provinces in China, such as Anhui, Jiangsu, Zhejiang, Sichuan, Hunan, Fujian, etc., had been affected by high temperatures. As a result, the buds and leaves of the tea plants wilted, scorched, and fell off, and the yield of summer and autumn tea decreased, which further affected the production of spring tea in the coming year. The disaster area reported by the media is in good agreement with the regions and provinces of more HD days and higher HD extent in this study. The spatiotemporal characteristics of daily HD geographical centroids were also consistent with previously reported research that showed HD evolution occurring from northeast to southwest in tea planting gardens of SYR and SC in mainland China [45].
5.2. Applicability of the LST-Weighted Centroid Method
Geographical centroids can describe where events of interest gather spatially. Both weighted and unweighted centroid determination methods have been widely used, such as with regard to species distributions based on unweighted centroids [63], metapopulation centroids weighted by population density [64], urban heat island centroids based on the Gaussian volume model [58], and drought tracking based on geometric centroids [57]. To our knowledge, weight-based centroids, fully taking into account the effects of factor contributions, can more objectively locate the geographical location of the centroid. When locating the geographical centroid in this study, the spatial distribution of HD and its intensity for each HD pixel were jointly considered. Thus, the HD centroid can be connected to the pixels with greater HD intensity. The results of the HD geographical centroid were also consistent with an overwhelming number of media reports indicating that the areas suffering HD impacts on tea plants were mainly distributed in the provinces along the Yangtze River Basin.
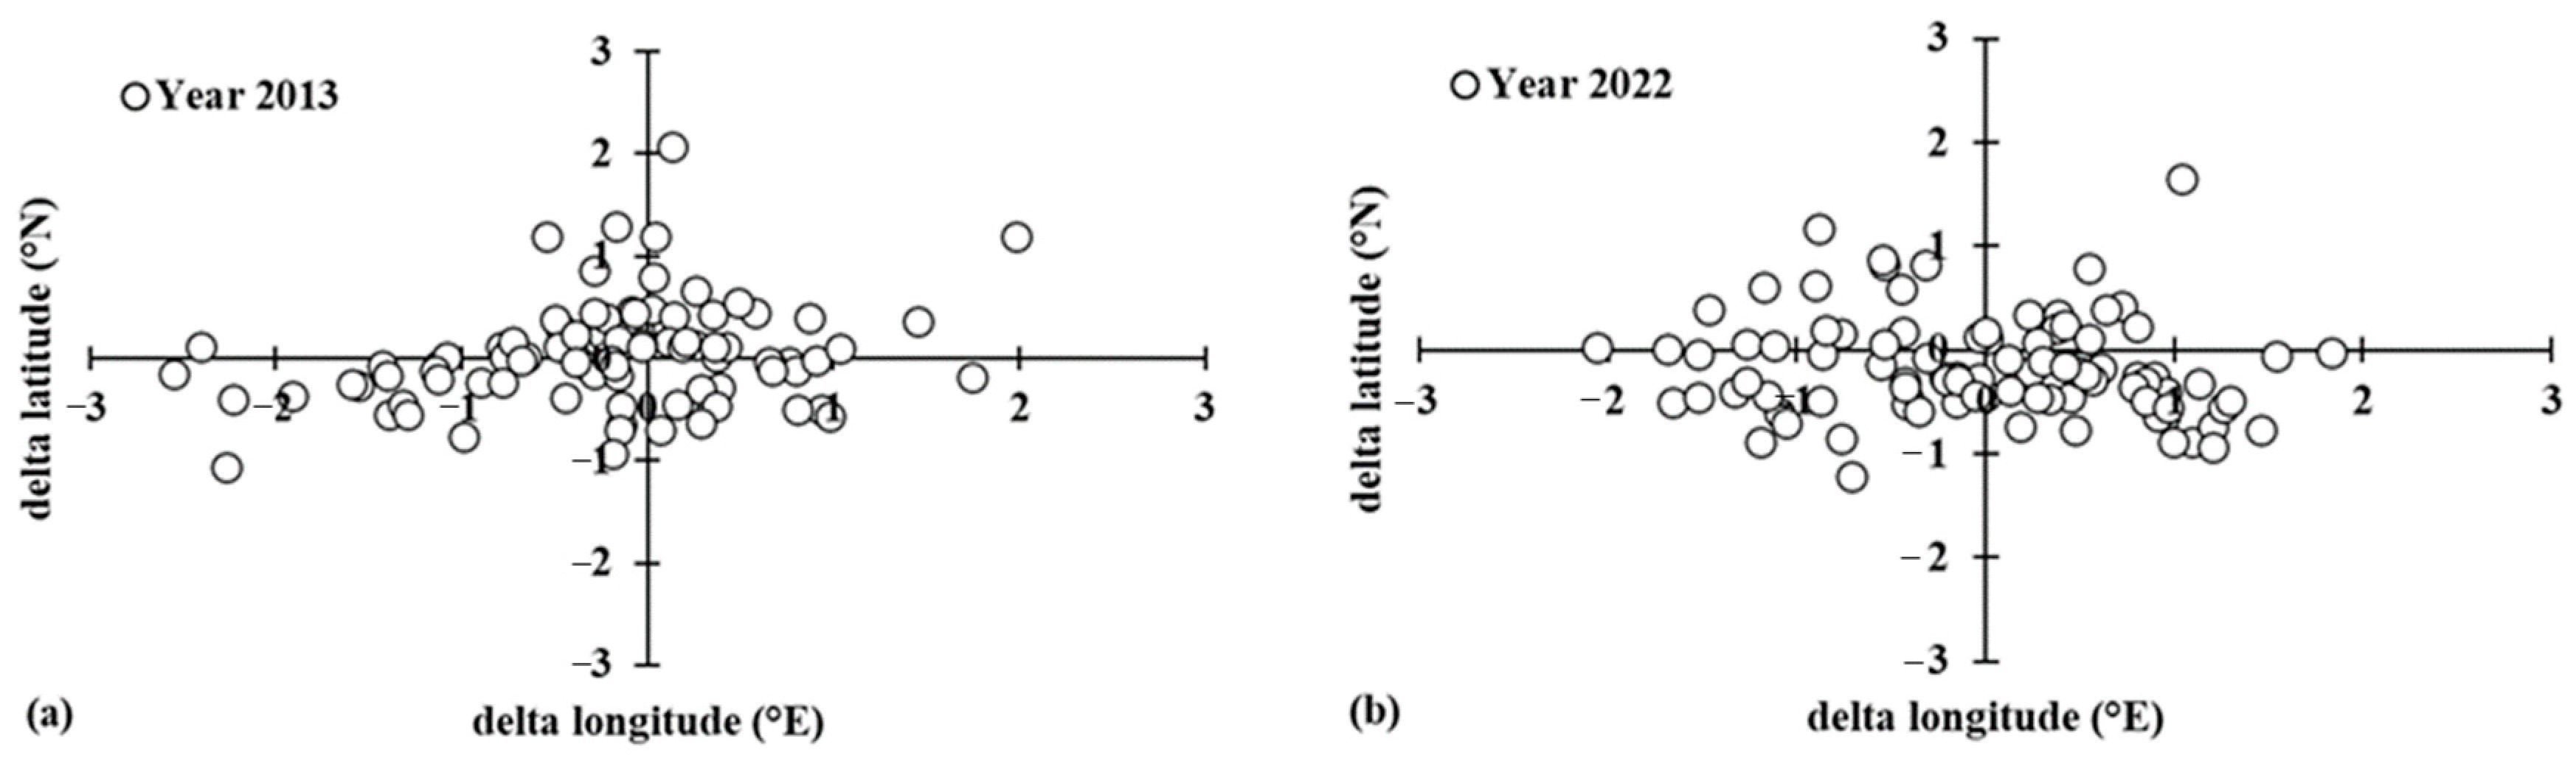
The comparisons of HD geographical centroid deviations (denoted by the differences in longitude and latitude between weight-free and LST-weighted locations) over the tea planting regions of mainland China from June through August in 2013 and 2020 are shown in Figure 9. Theoretically, longitude and latitude locations obtained by the LST-weighted and weight-free methods would be offset due to the difference in weight of HD intensity. Results in Figure 9 also show that the geographical centroids determined by the weight-free method were slightly shifted to the west compared with the LST-weighted method, with the maximum difference being close to −2.6°E in 2013. The deviation in north–south direction was not obvious, and most differences were concentrated between −1°N and 1°N for the two typical HD years.
5.3. Applications of Tracking Method
Timely monitoring and tracking of natural disasters is critical for rapidly assessing and addressing impacts on ecosystem disturbances [22,23,65,66], vegetation anomaly detection [67], crop water deficits or flash droughts [17,18,68], wildfire progressions [69], and so on. Daily HD extent and centroids for tea plants in mainland China for the typical HD years of 2013 and 2022 were monitored and tracked. HD evolution characteristics in the tea planting areas were clearly observed, both spatially and temporally. The HD spatial distribution in 2022 was more concentrated in northern SWC, and this observation was related to the record-breaking high-temperature intensity and duration in SIC province and CQ municipality [44]. Moreover, the HD intensity was greater in August than in July, which was also consistent with the temperature anomalies [60]. However, the HD centroids in 2013 were shifted slightly westward compared with the location of the heat wave [61], which was mainly due to the fact that the tea gardens were more concentrated in the western regions of the Yangtze River.
5.4. Availability of LST Products
Although monitoring HD to tea plants based on remotely sensed LST products is a good way to capture HD occurrence in a timely manner and to exactly track HD evolution, the availability of LST products is a key constraint of this monitoring method. Satellite remote sensing can provide LST products with unprecedented global coverage. However, its spatial resolution is 1 km. When the area of tea plantations is less than one pixel, or the distribution of tea gardens is relatively loose, there will be a certain degree of deviation in the HD monitoring. Furthermore, LST data are unavailable if cloud contamination exists during satellite overpassing periods [70]. In this study, the RSDAST method was introduced to reconstruct the gap-filled MODIS LST values, and thus most LST gaps were effectively filled. However, there were still some pixels that could not be filled objectively [56], which may have produced a certain deviation in the results. Even so, use of this method can still more effectively represent the spatial distribution of HD to tea gardens than using original LST products directly, and this finding represents great progress in monitoring HD disasters based on remote sensing products. Nowadays, reconstructing some remotely sensed products, such as reflectance [70], vegetation index [71,72], LST [56,73], crop evapotranspiration [74], etc., has been widely investigated in monitoring vegetation conditions [75,76], detecting early crop growth stages [75] and end-of-season dates [77], monitoring vineyard water use and stress [78], and irrigation management [79].
Timely monitoring of disasters is the main business of meteorological services. However, the effectiveness of the method is not only limited by technical capabilities, but also depends on the availability of remotely sensed LST data. If the data can be obtained in a timely manner, HD to tea plants can be monitored in a timely manner. Fortunately, the MODIS LST product has achieved quasi-real-time sharing, thereby providing a sufficient guarantee of data availability. In addition, the HD period often relates to weather conditions such as high temperature, low precipitation, and few clouds. Therefore, the influence of cloud contamination can essentially be ignored, which further ensures sufficient availability of satellite-based LST products. Other LST products available from other satellite platforms, such as FY-3 [80] and Himawari-8 [81], are also welcome, and further expand the applicability of the method.
5.5. The Area of Tea Gardens
Although tea trees are widely planted in mainland China, the distribution of tea gardens is still relatively scattered. Previous research had revealed that the area extracted from MODIS Terra + Aqua Combined Land Cover products with closed and open shrublands was almost 4.8 times the actual tea plantation area in SYR [2]. In this study, a proximate relationship between satellite-based area and the actual area of tea gardens was determined at the provincial scale for the entire tea planting region in China. The linear regression coefficient was 4.67. Therefore, the area of shrublands was much larger than the actual area of tea gardens, which may result in some spatial deviation between the HD centroids and the actual disaster area. Additionally, MOD11A1 LST was retrieved based on spectral emissivity values, which is closely related to land cover types [42]. Thus, over-labeling of tea plantations may have a negative impact on HD monitoring results. Therefore, it may be an ideal way to accurately map the spatial distribution of tea plantations over time based on high-resolution remote sensing data in the future.
6. Conclusions
A method of monitoring HD evolution to tea plants was investigated based on the critical LST threshold and reconstructed remotely sensed LST data for two typical HD years (2013 and 2022). Results showed that daily HD extent exhibited similar characteristics from June to August in both 2013 and 2022, with a faster rate of increase (0.66% per day) in 2022 and a slower rate of increase (0.21% per day) in 2013. The average number of HD days for all provinces was five days greater in 2022 than in 2013. Spatially, HD pixel ratios in four tea planting regions also showed similar characteristics across the two years. HD in SYR was the greatest, with average HD pixel ratios of greater than 50%, followed by NYR and SWC, with average HD pixel ratios of around 40%, and the HD pixel ratio was the lowest in SC, with a value of less than 40%. Daily HD geographical centroids of tea plants were concentrated in western SYR, eastern SWC, and northern SC in 2013, while they were located a little more westward in 2022, clustering in northern SWC. The HD centroid tracking results showed that the HD trajectories were completely different in 2013 and 2022. In 2013, the centroids moved from the west of the tea planting gardens of SWC to the northeast first and then to the west, mainly gathering at the junction of SYR, SC, and SWC. In contrast, the HD centroids in 2022 first developed in the northeast and moved westward and southward, remaining in the eastern regions of SWC in July and August.
The results of this study strongly confirmed that monitoring HD evolution to tea plants based on remotely sensed LST products was an effective method due to its ability to correctly characterize both temporal evolution and spatial distribution of HD. Our findings have important implications for meteorological staff, in the timely monitoring of temperature-related disasters and objectively pinpointing their locations; for government agencies, to formulate reasonable disaster relief strategies and to schedule necessary supplies; and for tea farmers in disaster regions, to give greater attention to methods that can reduce economic losses.
Author Contributions
Conceptualization, P.W. and L.P.; methodology, P.W.; software, D.W.; validation, X.L., J.T. and Y.Z.; formal analysis, X.L.; investigation, P.W.; resources, P.W.; data curation, X.L.; writing—original draft preparation, P.W.; writing—review and editing, P.W.; visualization, Y.Z.; supervision, P.W.; project administration, P.W.; funding acquisition, P.W. All authors have read and agreed to the published version of the manuscript.
Funding
This research was funded by the National Key Research and Development Program of China (2022YFD2001003), the National Natural Science Foundation of China (32171916), the Basic Research Fund of CAMS (2023Z014 and 2024Z001), the Science and Technology Development Fund of CAMS (2023KJ025 and 2024KJ010), and the Key innovation team of the China Meteorological Administration (CMA2024ZD02).
Data Availability Statement
Data are available at: Land Surface Temperature and Emissivity–LAADS DAAC (nasa.gov) (Last visited on 12 May 2024).
Acknowledgments
We would like to thank the two reviewers for their constructive comments and suggestions, which have improved the quality of the article.
Conflicts of Interest
The authors declare no conflict of interest.
References
- FAO. FAOSTAT Database; FAO: Rome, Italy, 2022; Available online: http://www.fao.org/faostat/en/#data/QC (accessed on 5 July 2022).
- Wang, P.J.; Ma, Y.P.; Tang, J.X.; Wu, D.R.; Chen, H.; Jin, Z.F.; Huo, Z.G. Spring frost damage to tea plants can be identified with daily minimum air temperatures estimated by MODIS land surface temperature products. Remote Sens. 2021, 13, 1177. [Google Scholar] [CrossRef]
- Tang, J.X.; Wang, P.J.; E, Y.H.; Ma, Y.P.; Wu, D.R.; Huo, Z.G. Climatic suitability zoning of tea planting in Mainland China. J. Appl. Meteorol. Sci. 2021, 32, 397–407. [Google Scholar] [CrossRef]
- Masson-Delmotte, V.; Zhai, P.; Pirani, A.; Connors, S.L.; Péan, C.; Berger, S.; Caud, N.; Chen, Y.; Goldfarb, L.; Gomis, M.I.; et al. IPCC, 2021: Summary for Policymakers. In Climate Change 2021: The Physical Science Basis. Contribution of Working Group I to the Sixth Assessment Report of the Intergovernmental Panel on Climate Change; Cambridge University Press: Cambridge, UK; New York, NY, USA, 2021; pp. 3–32. [Google Scholar] [CrossRef]
- Eyshi Rezaei, E.; Siebert, S.; Manderscheid, R.; Müller, J.; Mahrookashani, A.; Ehrenpfordt, B.; Haensch, J.; Weigdl, H.; Ewert, F. Quantifying the response of wheat yields to heat stress: The role of the experimental setup. Field Crops Res. 2018, 217, 93–103. [Google Scholar] [CrossRef]
- Lobell, D.B.; Bänziger, M.; Magorokosho, C.; Vivek, B. Nonlinear heat effects on African maize as evidenced by historical yield trials. Nat. Clim. Chang. 2011, 1, 42–45. [Google Scholar] [CrossRef]
- Lizaso, J.I.; Ruiz-Ramos, M.; Rodríguez, L.; Gabaldon-Leal, C.; Oliveira, J.A.; Lorite, I.J.; Sánchez, D.; García, E.; Rodríguez, A. Impact of high temperatures in maize: Phenology and yield components. Field Crops Res. 2018, 216, 129–140. [Google Scholar] [CrossRef]
- Dong, X.; Guan, L.; Zhang, P.H.; Liu, X.L.; Li, S.J.; Fu, Z.J.; Tang, L.; Qi, Z.Y.; Qiu, Z.G.; Jin, C.; et al. Responses of maize with different growth periods to heat stress around flowering and early grain filling. Agric. For. Meteorol. 2021, 303, 108378. [Google Scholar] [CrossRef]
- Shi, P.H.; Zhu, Y.; Tang, L.; Chen, J.L.; Sun, T.; Cao, W.X.; Tian, Y.C. Differential effects of temperature and duration of heat stress during anthesis and grain filling stages in rice. Environ. Exp. Bot. 2016, 132, 28–41. [Google Scholar] [CrossRef]
- Deryng, D.; Conway, D.; Ramankutty, N.; Price, J.; Warren, R. Global crop yield response to extreme heat stress under multiple climate change futures. Environ. Res. Lett. 2014, 9, 034011. [Google Scholar] [CrossRef]
- Liu, B.; Asseng, S.; Liu, L.L.; Tang, L.; Cao, W.X.; Zhu, Y. Testing the responses of four wheat crop models to heat stress at anthesis and grain filling. Glob. Chang. Biol. 2016, 22, 1890–1903. [Google Scholar] [CrossRef]
- Osman, R.; Zhu, Y.; Cao, W.X.; Ding, Z.F.; Wang, M.; Liu, L.L.; Tang, L.; Liu, B. Modeling the effects of extreme high-temperature stress at anthesis and grain filling on grain protein in winter wheat. Crop J. 2021, 9, 889–900. [Google Scholar] [CrossRef]
- Yan, Y.L.; Jeong, S.; Park, C.; Mueller, N.D.; Piao, S.L.; Park, H.; Joo, J.; Chen, X.; Wang, X.H.; Liu, J.G.; et al. Effects of extreme temperature on China’s tea production. Environ. Res. Lett. 2021, 16, 044040. [Google Scholar] [CrossRef]
- Song, L.C.; Fan, Y.D. Yearbook of Meteorological Disasters in China (2013); China Meteorological Press: Beijing, China, 2014. [Google Scholar]
- Jin, Z.F.; Yao, Y.P. Research on Key Technique of Meteorological Support for the Tea Production in Regions South of the Yangtze River; China Meteorological Press: Beijing, China, 2017. (In Chinese) [Google Scholar]
- Vicente-Serrano, S.M.; Domínguez-Castro, F.; Reig, F.; Beguería, S.; Tomas-Burguera, M.; Latorre, B.; Peña-Angulo, D.; Noguera, I.; Rabanaque, I.; Luna, Y.; et al. A near real-time drought monitoring system for Spain using automatic weather station network. Atmos. Res. 2022, 271, 106095. [Google Scholar] [CrossRef]
- Seyednasrollah, B.; Domec, J.C.; Clark, J.S. Spatiotemporal sensitivity of thermal stress for monitoring canopy hydrological stress in near real-time. Agric. For. Meteorol. 2019, 269–270, 220–230. [Google Scholar] [CrossRef]
- Yousaf, W.; Awan, W.K.; Kamran, M.; Ahmad, S.R.; Bodla, H.U.; Riaz, M.; Umar, M.; Chohan, K. A paradigm of GIS and remote sensing for crop water deficit assessment in near real time to improve irrigation distribution plan. Agric. Water Manag. 2021, 243, 106443. [Google Scholar] [CrossRef]
- Sadri, S.; Pan, M.; Wada, Y.; Vergopolan, N.; Sheffield, J.; Famiglietti, J.S.; Kerr, Y.; Wood, E. A global near-real-time soil moisture index monitor for food security using integrated SMOS and SMAP. Remote Sens. Environ. 2020, 246, 111864. [Google Scholar] [CrossRef]
- Olsson, P.; Lindström, J.; Eklundh, L. Near real-time monitoring of insect induced defoliation in subalpine birch forests with MODIS derived NDVI. Remote Sens. Environ. 2016, 181, 42–53. [Google Scholar] [CrossRef]
- Reiche, J.; Hamunyela, E.; Verbesselt, J.; Hoekman, D.; Herold, M. Improving near-real time deforestation monitoring in tropical dry forests by combining dense Sentinel-1 time series with Landsat and ALOS-2 PALSAR-2. Remote Sens. Environ. 2018, 204, 147–161. [Google Scholar] [CrossRef]
- Tang, X.J.; Bullock, E.L.; Olofsson, P.; Estel, S.; Woodcock, C.E. Near real-time monitoring of tropical forest disturbance: New algorithms and assessment framework. Remote Sens. Environ. 2019, 224, 202–218. [Google Scholar] [CrossRef]
- Ye, S.; Rogan, J.; Zhu, Z.; Eastman, J.R. A near-real-time approach for monitoring forest disturbance using Landsat time series: Stochastic continuous change detection. Remote Sens. Environ. 2021, 252, 112167. [Google Scholar] [CrossRef]
- Zhang, X.Y.; Kondragunta, S.; Schmidt, C.; Kogan, F. Near real time monitoring of biomass burning particulate emissions (PM2.5) across contiguous United States using multiple satellite instruments. Atmos. Environ. 2008, 42, 6959–6972. [Google Scholar] [CrossRef]
- Xu, Y.Q.; Huang, Z.J.; Qu, J.M.; Jia, G.L.; Wu, L.L.; Liu, H.L.; Lu, M.H.; Fan, M.; Wei, J.; Chen, L.F.; et al. Near-real-time estimation of hourly open biomass burning emissions in China using multiple satellite retrievals. Sci. Total Environ. 2022, 817, 152777. [Google Scholar] [CrossRef]
- Chugg, B.; Anderson, B.; Eicher, S.; Lee, S.; Ho, D.E. Enhancing environmental enforcement with near real-time monitoring: Likelihood-based detection of structural expansion of intensive livestock farms. Int. J. Appl. Earth Obs. Geoinf. 2021, 103, 102463. [Google Scholar] [CrossRef]
- Zhao, Y.; Tian, H.; Han, Q.L.; Gu, J.H.; Zhao, Y.D. Real-time monitoring of water and ice content in plant stem based on latent heat changes. Agric. For. Meteorol. 2021, 307, 108475. [Google Scholar] [CrossRef]
- Gao, F.; Anderson, M.A.; Daughtry, C.D.; Karnieli, A.; Hively, D.; Kustas, W. A within-season approach for detecting early growth stages in corn and soybean using high temporal and spatial resolution imagery. Remote Sens. Environ. 2020, 242, 111752. [Google Scholar] [CrossRef]
- Hu, X.B.; Ren, H.Z.; Tansey, K.; Zheng, Y.T.; Ghent, D.; Liu, X.F.; Yan, L. Agricultural drought monitoring using European Space Agency Sentinel 3A land surface temperature and normalized difference vegetation index imageries. Agric. For. Meteorol. 2019, 279, 107707. [Google Scholar] [CrossRef]
- Lin, S.P.; Moore, N.J.; Messina, J.P.; DeVisser, M.H.; Wu, J.P. Evaluation of estimating daily maximum and minimum air temperature with MODIS data in east Africa. Int. J. Appl. Earth Obs. Geoinf. 2012, 18, 128–140. [Google Scholar] [CrossRef]
- Zhu, W.B.; Lű, A.F.; Jia, S.F. Estimation of daily maximum and minimum air temperature using MODIS land surface temperature products. Remote Sens. Environ. 2013, 130, 62–73. [Google Scholar] [CrossRef]
- Rosenfeld, A.; Dorman, M.; Schwartz, J.; Navack, V.; Just, A.C.; Kloog, T. Estimating daily minimum, maximum, and mean near surface air temperature using hybrid satellite models across Isreal. Environ. Res. 2017, 159, 297–312. [Google Scholar] [CrossRef]
- Yoo, C.; Im, J.; Park, S.; Quackenbush, L.J. Estimation of daily maximum and minimum air temperatures in urban landscapes using MODIS time series satellite data. JSPRS Jpn. Soc. Photogramm. Remote Sens. 2018, 137, 149–162. [Google Scholar] [CrossRef]
- Lu, N.; Liang, S.L.; Huang, G.H.; Qin, J.; Yao, L.; Wang, D.D.; Yang, K. Hierarchical bayesian space-time estimation of monthly maximum and minimum surface air temperature. Remote Sens. Environ. 2018, 211, 48–58. [Google Scholar] [CrossRef]
- Wang, P.J.; Tang, J.X.; Ma, Y.P.; Wu, D.R.; Yang, J.Y.; Jin, Z.F.; Huo, Z.G. Mapping threats of spring frost damage to tea plants using satellite-based minimum temperature estimation in China. Remote Sens. 2021, 13, 2713. [Google Scholar] [CrossRef]
- Kotikot, S.M.; Flores, A.; Griffin, R.E.; Sedah, A.; Nyaga, J.; Mugo, R.; Limaye, A.; Irwin, D.E. Mapping threats to agriculture in East Africa: Performance of MODIS derived LST for frost identification in Kenya’s tea plantations. Int. J. Appl. Earth Obs. Geoinf. 2018, 72, 131–139. [Google Scholar] [CrossRef]
- Hori, M. Near-daily monitoring of surface temperature and channel width of the six largest Arctic rivers from space using GCOM-C/SGLI. Remote Sens. Environ. 2021, 263, 112538. [Google Scholar] [CrossRef]
- Yu, B.; She, J.; Liu, G.X.; Ma, D.Y.; Zhang, R.; Zhou, Z.W.; Zhang, B. Coal fire identification and state assessment by integrating multitemporal thermal infrared and InSAR remote sensing data: A case study of Midong Districts, Urumqi, China. JSPRS Jpn. Soc. Photogramm. Remote Sens. 2022, 190, 144–164. [Google Scholar] [CrossRef]
- Hu, T.; Renzullo, L.J.; van Dijk, A.I.J.M.; He, J.; Tian, S.Y.; Xu, Z.H.; Zhou, J.; Liu, T.J.; Liu, Q.H. Monitoring agricultural drought in Australia using MTSAT-2 land surface temperature retrievals. Remote Sens. Environ. 2020, 236, 111419. [Google Scholar] [CrossRef]
- Wang, J.; Yan, Z.Q. Rapid rises in the magnitude and risk of extreme regional heat wave events in China. Weather Clim. Extrem. 2021, 34, 100379. [Google Scholar] [CrossRef]
- Cao, D.R.; Xu, K.; Huang, Q.L.; Tam, C.Y.; Chen, S.; He, Z.Q.; Wang, W.Q. Exceptionally prolonged extreme heat waves over South China in early summer 2020: The role of warming in the tropical Indian Ocean. Atmos. Res. 2022, 278, 106335. [Google Scholar] [CrossRef]
- Wan, Z.M.; Zhang, Y.L.; Zhang, Q.C.; Li, Z.L. Validation of the land-surface temperature products retrieved from Terra Moderate Resolution Imaging Spectroradiometer data. Remote Sens. Environ. 2002, 83, 163–180. [Google Scholar] [CrossRef]
- Sulla-Menashe, D.; Friedl, M.A. User Guide to Collection 6 MODIS Land Cover (MCD12Q1 and MCD12Q2) Product. 2018. Available online: https://lpdaac.usgs.gov/documents/101/MCD12_User_Guide_V6.pdf (accessed on 7 July 2021).
- Lu, R.Y.; Xu, K.; Chen, R.D.; Chen, W.; Li, F.; Lv, C.Y. Heat waves in summer 2022 and increasing concern regarding heat waves in general. Atmos. Ocean. Sci. Lett. 2023, 16, 100290. [Google Scholar] [CrossRef]
- Li, X.; Wang, P.J.; Tang, J.X.; Yang, J.Y.; Ma, Y.P.; Wu, D.R.; Huo, Z.G. Method on heat damage identification of tea plants and threshold verification over tea regions in Southern Yangtze River and South China. Chin. J. Ecol. 2024, 43, 1183–1191. [Google Scholar]
- Mirzargar, M.; Whitaker, R.T.; Kirby, R.M. Curve boxplot: Generalization of boxplot for ensembles of curves. IEEE Trans. Vis. Comput. Graph. 2014, 20, 2654–2663. [Google Scholar] [CrossRef]
- Niu, L.X.; van Gelder, P.H.A.J.M.; Zhang, C.K.; Guan, Y.Q.; Vrijling, J.K. Statistical analysis of phytoplankton biomass in coastal waters: Case study of the Wadden Sea near Lauwersoog (The Netherlands) from 2000 to 2009. Ecol. Inform. 2015, 30, 12–19. [Google Scholar] [CrossRef]
- Uniyal, B.; Dietrich, J.; Vasilakos, C.; Tzoraki, O. Evaluation of SWAT simulated soil moisture at catchment scale by field measurements and Landsat derived indices. Agric. Water Manag. 2017, 193, 55–70. [Google Scholar] [CrossRef]
- Rao, W.Q.; Qu, Y.; Gao, L.R.; Sun, X.; Wu, Y.F.; Zhang, B. Transferable network with Siamese architecture for anomaly detection in hyperspectral images. Int. J. Appl. Earth Obs. Geoinf. 2022, 106, 102669. [Google Scholar] [CrossRef]
- Schwertman, N.C.; Owens, M.A.; Adnan, R. A simple more general boxplot method for identifying outliers. Comput. Stat. Data Anal. 2004, 47, 165–174. [Google Scholar] [CrossRef]
- Blank, P.S.; Sjomeling, C.M.; Backlund, P.S.; Yergey, A.L. Use of cumulative distribution functions to characterize mass spectra of intact proteins. J. Am. Soc. Mass Spectrom. 2002, 13, 40–46. [Google Scholar] [CrossRef]
- Bartolino, V.; Maiorano, L.; Colloca, F. A frequency distribution approach to hotspot identification. Popul. Ecol. 2011, 53, 351–359. [Google Scholar] [CrossRef]
- Park, S.R.; Kolouri, S.; Kundu, S.; Rohde, G.K. The cumulative distribution transform and linear pattern classification. Appl. Comput. Harmon. Anal. 2018, 45, 616–641. [Google Scholar] [CrossRef]
- Wang, P.J.; Li, X.; Tang, J.X.; Yang, J.Y.; Ma, Y.P.; Wu, D.R.; Huo, Z.G. Determining the critical threshold of meteorological heat damage to tea plants based on MODIS LST products for tea planting areas in China. Ecol. Inform. 2023, 77, 102235. [Google Scholar] [CrossRef]
- Rao, Y.H.; Liang, S.L.; Wang, S.D.; Yu, Y.Y.; Song, Z.; Zhou, Y.; Shen, M.G.; Xu, B.Q. Estimating daily average surface air temperature using satellite land surface temperature and top-of-atmosphere radiation products over the Tibetan Plateau. Remote Sens. Environ. 2019, 234, 111462. [Google Scholar] [CrossRef]
- Sun, L.; Chen, Z.X.; Gao, F.; Anderson, M.C.; Song, L.S.; Wang, L.M.; Hu, B.; Yang, Y. Reconstructing daily clear-sky land surface temperature for cloudy regions from MODIS data. Comput. Geosci. 2017, 105, 10–20. [Google Scholar] [CrossRef]
- Diaz, V.; Perez, G.A.C.; Van Lanen, H.A.J.; Solomatine, D.; Varouchakis, E.A. An approach to characterize spatio-temporal drought dynamics. Adv. Water Resour. 2020, 137, 103512. [Google Scholar] [CrossRef]
- Quan, J.L.; Chen, Y.H.; Zhan, W.F.; Wang, J.F.; Voogt, J.; Wang, M.J. Multi-temporal trajectory of the urban heat island centroid in Beijing, China based on a Gaussian volume model. Remote Sens. Environ. 2014, 149, 33–46. [Google Scholar] [CrossRef]
- Han, Z.M.; Huang, Q.; Huang, S.Z.; Leng, G.Y.; Bai, Q.J.; Liang, H.; Wang, L.; Zhao, J.; Fang, W. Spatial-temporal dynamics of agricultural drought in the Loess Plateau under a changing environment: Characteristics and potential influencing factors. Agric. Water Manag. 2021, 244, 106540. [Google Scholar] [CrossRef]
- Ding, T.; Ke, Z.J. Characteristics and changes of regional wet and dry heat wave events in China during 1960–2013. Theor. Appl. Climatol. 2015, 122, 651–665. [Google Scholar] [CrossRef]
- Li, J.; Ding, T.; Jia, X.L.; Zhao, X.C. Analysis on the extreme heat wave over China around Yangtze River region in the summer of 2013 and its main contribution factors. Adv. Meteorol. 2015, 2015, 706713. [Google Scholar] [CrossRef]
- Chyi, D.; He, L.F. Stage characteristics and mechanisms of extreme high temperature in China in summer of 2022. J. Appl. Meteor. Sci. 2023, 34, 385–399. [Google Scholar] [CrossRef]
- Huntley, B.; Collingham, Y.C.; Willis, S.G.; Green, R.E. Potential impacts of climatic change on European breeding birds. PLoS ONE 2008, 3, e1439. [Google Scholar] [CrossRef] [PubMed]
- Watts, M.J.; Fordham, D.A.; Akçakaya, H.R.; Aiello-Lammens, M.E.; Brook, B.W. Tracking shifting range margins using geographical centroids of metapopulations weighted by population density. Ecol. Modell. 2013, 269, 61–69. [Google Scholar] [CrossRef]
- Verbesselt, J.; Zeileis, A.; Herold, M. Near real-time disturbance detection using satellite image time series. Remote Sens. Environ. 2012, 123, 98–108. [Google Scholar] [CrossRef]
- Xin, Q.C.; Olofsson, P.; Zhu, Z.; Tan, B.; Woodcock, C.E. Toward near real-time monitoring of forest disturbance by fusion of MODIS and Landsat data. Remote Sens. Environ. 2013, 135, 234–247. [Google Scholar] [CrossRef]
- Meroni, M.; Fasbender, D.; Rembold, F.; Atzberger, C.; Klisch, A. Near real-time vegetation anomaly detection with MODIS NDVI: Timeless vs. accuracy and effect of anomaly computation options. Remote Sens. Environ. 2019, 212, 508–521. [Google Scholar] [CrossRef]
- Li, J.; Wang, Z.L.; Wu, X.S.; Chen, J.; Guo, S.L.; Zhang, Z.X. A new framework for tracking flash drought events in space and time. Catena 2020, 194, 104763. [Google Scholar] [CrossRef]
- Zhang, P.Z.; Ban, Y.F.; Nascetti, A. Learning U-Net without forgetting for near real-time wildfire monitoring by the fusion of SAR and optical time series. Remote Sens. Environ. 2021, 261, 112467. [Google Scholar] [CrossRef]
- Wang, P.J.; Gao, F.; Masek, J.G. Operational data fusion framework for building frequent Landsat-like imagery. IEEE Trans. Geosci. Remote Sens. 2014, 52, 7353–7365. [Google Scholar] [CrossRef]
- Chu, D.; Shen, H.F.; Guan, X.B.; Chen, J.M.; Li, X.H.; Li, J.; Zhang, L.P. Long time-series NDVI reconstruction in cloud-prone regions via spatio-temporal tensor completion. Remote Sens. Environ. 2021, 264, 112632. [Google Scholar] [CrossRef]
- Sun, L.; Gao, F.; Xie, D.H.; Anderson, M.C.; Chen, R.Q.; Yang, Y.; Yang, Y.; Chen, Z.X. Reconstructing daily 30 m NDVI over complex agricultural landscapes using a crop reference curve approach. Remote Sens. Environ. 2021, 253, 112156. [Google Scholar] [CrossRef]
- Zhao, W.; Duan, S.B. Reconstruction of daytime land surface temperatures under cloud-covered conditions using integrated MODIS/Terra land products and MSG geostationary satellite data. Remote Sens. Environ. 2020, 247, 111931. [Google Scholar] [CrossRef]
- Song, L.S.; Bateni, S.M.; Xu, Y.H.; Xu, T.R.; He, X.L.; Seo, J.K.; Liu, S.M.; Ma, M.G.; Yang, Y. Reconstruction of remotely sensed daily evapotranspiration data in cloudy-sky conditions. Agric. Water Manag. 2021, 255, 107000. [Google Scholar] [CrossRef]
- Gao, F.; Hilker, T.; Zhu, X.; Anderson, M.A.; Masek, J.; Wang, P.; Yang, Y. Fusing Landsat and MODIS data for vegetation monitoring. IEEE Geosci. Remote Sens. Mag. 2015, 3, 47–60. [Google Scholar] [CrossRef]
- Qian, Y.L.; Yang, Z.W.; Di, L.P.; Rahman, M.S.; Tan, Z.Y.; Xue, L.; Gao, F.; Yu, E.G.; Zhang, X.Y. Crop growth condition assessment at county scale based on heat-aligned growth stages. Remote Sens. 2019, 11, 2439. [Google Scholar] [CrossRef]
- Gao, F.; Anderson, M.A.; Hively, W.D. Detecting cover crop end-of-season using VENµS and Sentinel-2 satellite imagery. Remote Sens. 2020, 12, 3524. [Google Scholar] [CrossRef]
- Knipper, K.R.; Kustas, W.P.; Anderson, M.C.; Alsina, M.M.; Hain, C.R.; Alfieri, J.G.; Prueger, J.H.; Gao, F.; Mckee, L.G.; Sanchez, L.A. Using high-spatiotemporal thermal satellite ET retrievals for operational water use and stress monitoring in a California vineyard. Remote Sens. 2019, 11, 2124. [Google Scholar] [CrossRef]
- Knipper, K.R.; Kustas, W.P.; Anderson, M.C.; Alfieri, J.G.; Prueger, J.H.; Hain, C.R.; Gao, F.; Yang, Y.; Mckee, L.G.; Nieto, H.; et al. Evapotranspiration estimates derived using thermal-based satellite remote sensing and data fusion for irrigation management in California vineyards. Irrig. Sci. 2019, 37, 431–449. [Google Scholar] [CrossRef]
- Yang, Z.D.; Lu, N.M.; Shi, J.M.; Zhang, P.; Dong, C.H.; Yang, J. Overview of FY-3 payload and ground application system. IEEE Trans. Geosci. Remote Sens. 2012, 50, 4846–4853. [Google Scholar] [CrossRef]
- Bessho, K.; Date, K.; Hayashi, M.; Ikeda, A.; Imai, T.; Inoue, H.; Kumagai, Y.; Miyakawa, T.; Murata, H.; Ohno, T.; et al. An Introduction to Himawari-8/9—Japan’s New-Generation Geostationary Meteorological Satellites. J. Meteorol. Soc. Jpn. 2016, 94, 151–183. [Google Scholar] [CrossRef]
Figure 1.
Study area and spatial distribution of the four major tea planting areas in China. The gray regions are areas unsuitable for tea planting, and the grid cells with green color are the locations of tea gardens extracted from the MODIS land cover product (MCD12Q1).
Figure 1.
Study area and spatial distribution of the four major tea planting areas in China. The gray regions are areas unsuitable for tea planting, and the grid cells with green color are the locations of tea gardens extracted from the MODIS land cover product (MCD12Q1).

Figure 2.
Schematic diagram of spatiotemporal tracking of LST-weighted heat damage (HD) centroids. The grid cells with different grayscales represent the intensity of HD in the first and second columns (Steps 1 and 2); the darker the shade of gray, the greater the HD intensity. The red dots are the identified LST-weighted HD centroids at each point in time in the second and third columns (Steps 2 and 3).

Figure 3.
Violin plots of heat damage (HD) pixel ratios in the tea gardens of mainland China from 2002 to 2022 (panel a shows results for the entire mainland area of China [CHN] and the four different tea regions; panel b shows the annual dynamics). The upper and lower boundaries in the black polygons indicate the 25th and 75th percentiles of HD ratios, respectively; the lower and upper whiskers indicate the minimum and maximum HD ratios, respectively; the black lines and red points within the boxes are the median and mean values, respectively; the black points are outliers. NYR = region north of the Yangtze River; SYR = region south of the Yangtze River; SWC = southwest China; SC = South China.

Figure 4.
Daily dynamics of heat damage (HD) ratios from June through August in 2013 (a) and 2022 (b) over the entire tea planting region of mainland China. The three black horizontal lines in each panel are the monthly average values of HD ratios. ** denotes a significant test of 0.01.
Figure 4.
Daily dynamics of heat damage (HD) ratios from June through August in 2013 (a) and 2022 (b) over the entire tea planting region of mainland China. The three black horizontal lines in each panel are the monthly average values of HD ratios. ** denotes a significant test of 0.01.

Figure 5.
Daily dynamics of heat damage (HD) ratios from June through August for each tea planting area. The horizontal lines in each panel are the average HD ratios for 2013 (red lines) and 2022 (black lines). NYR = region north of the Yangtze River; SYR = region south of the Yangtze River; SWC = southwest China; SC = South China.
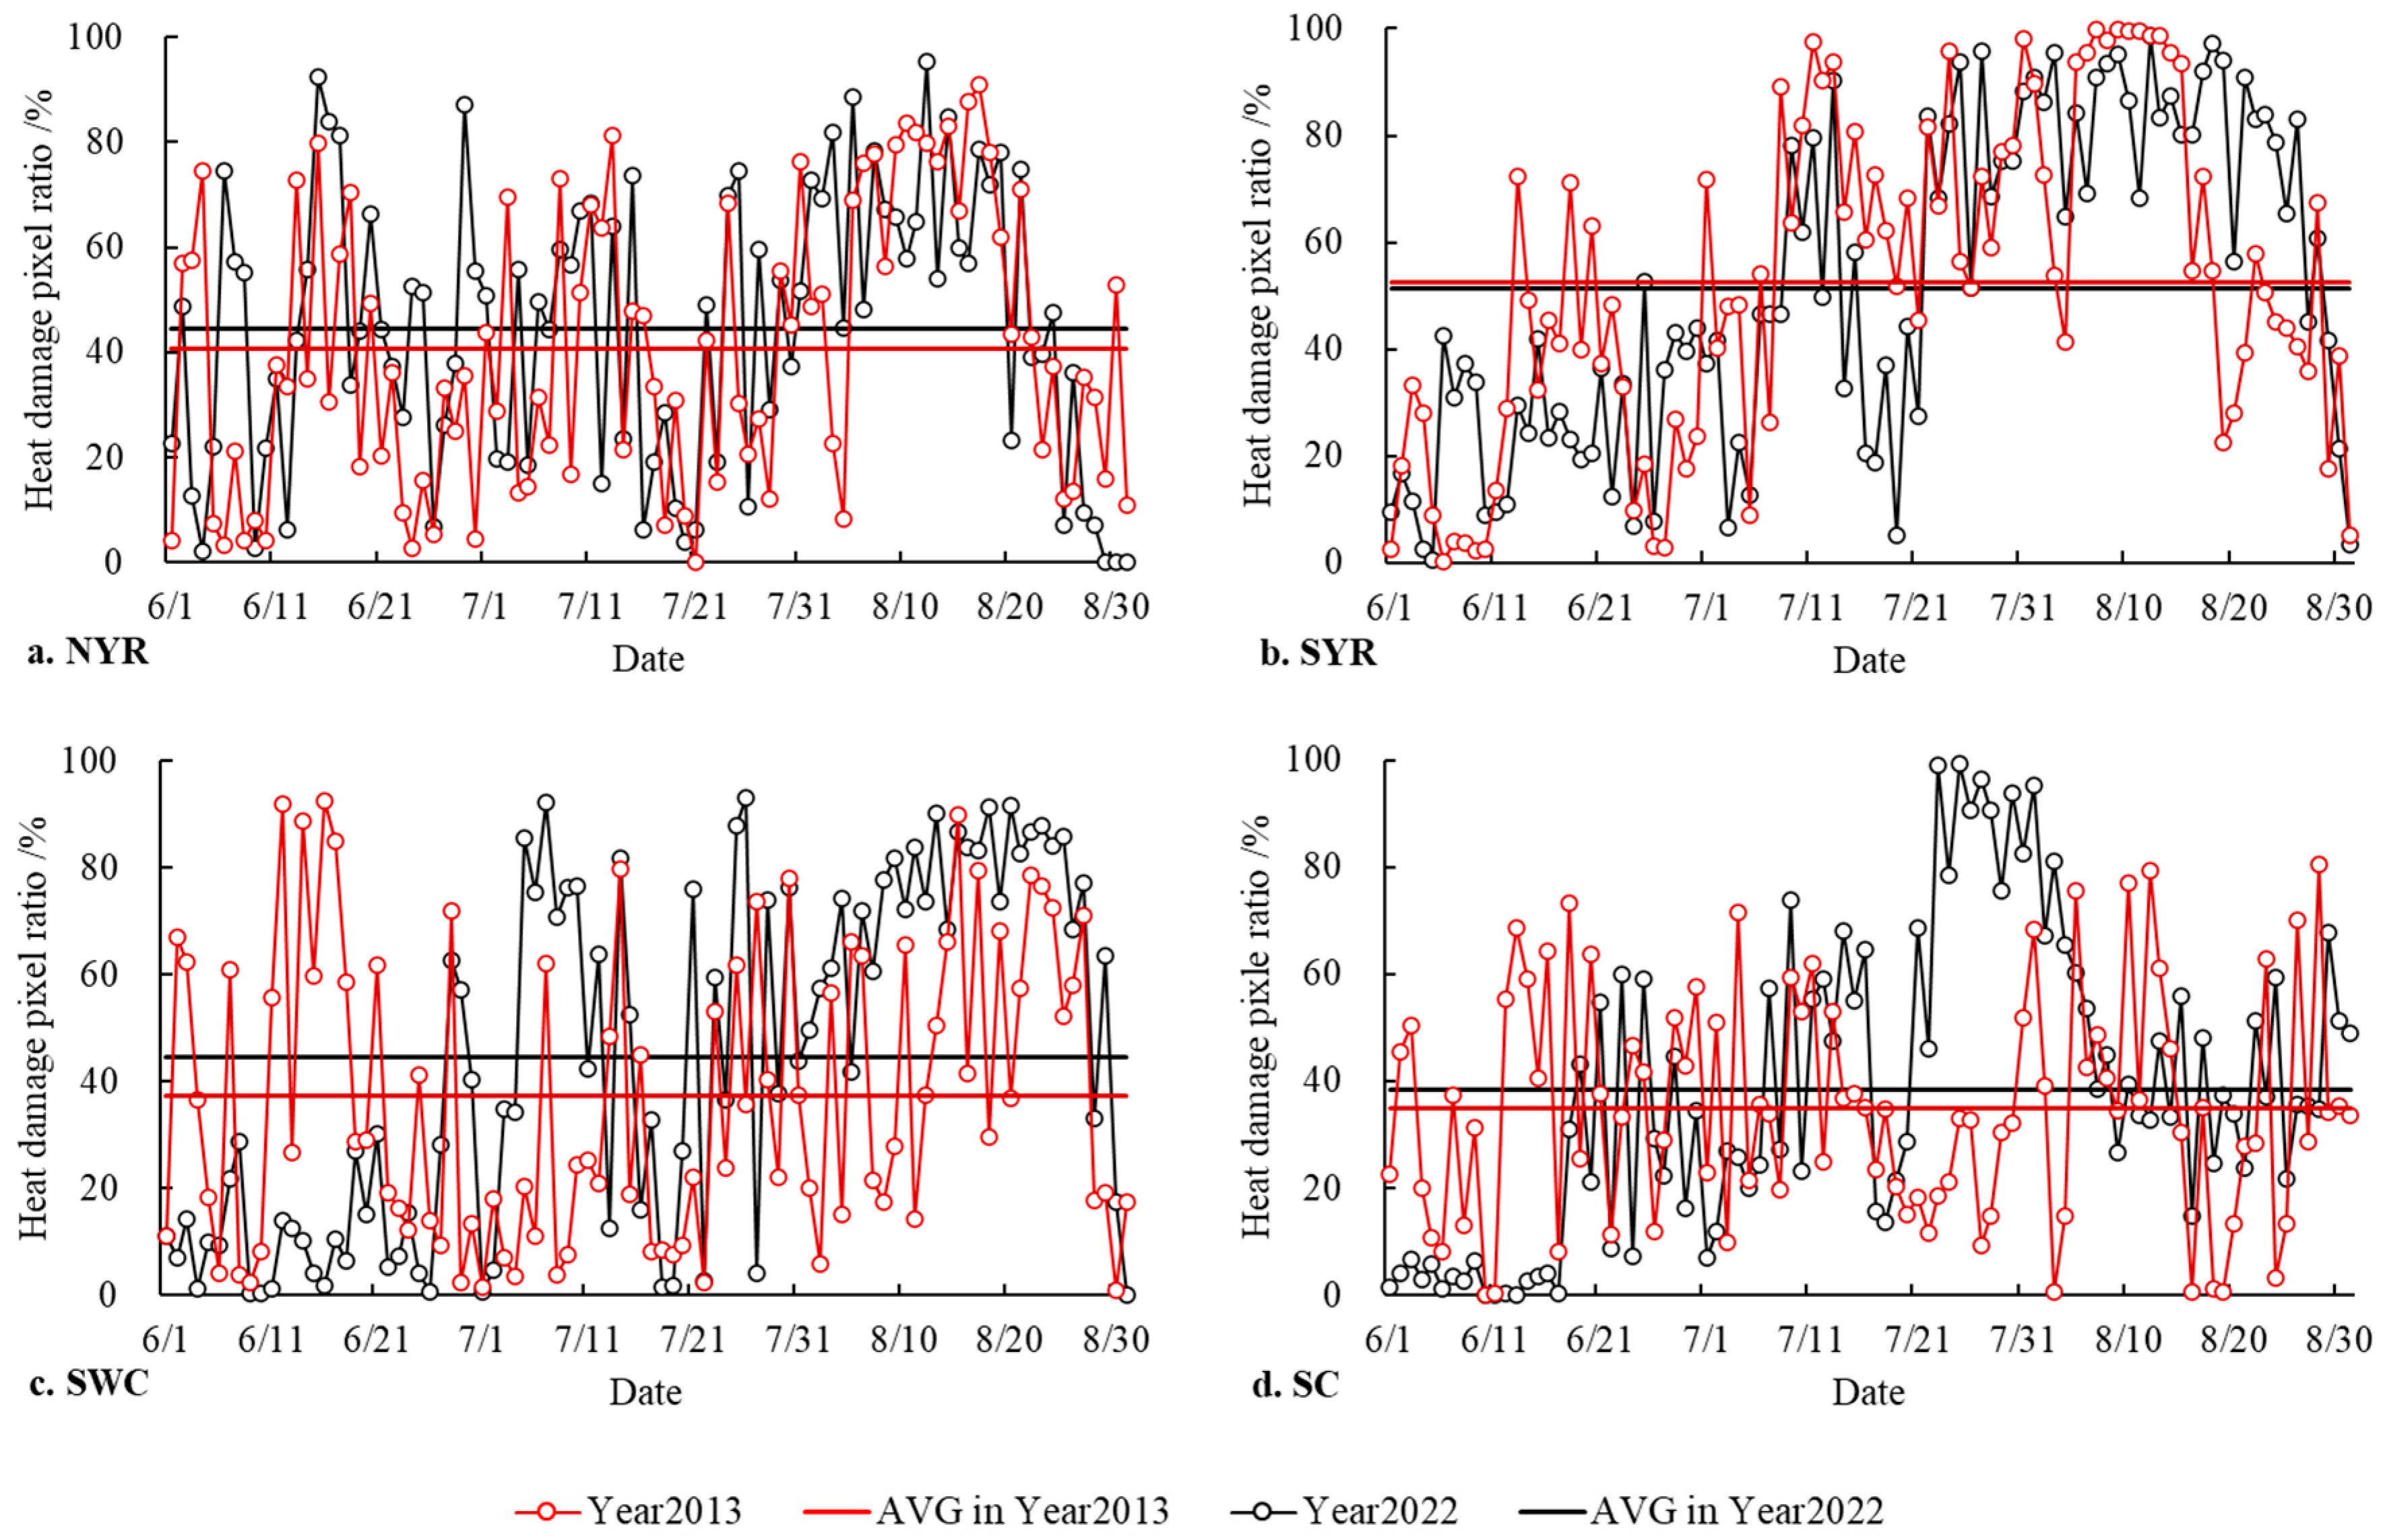
Figure 6.
Daily dynamics of heat damage (HD) ratios from June through August in 2013 (a) and 2022 (b) for each province. The first two columns on the left are the four tea planting regions and their corresponding provinces. Different shades of red indicate different HD ratio ranges. The Jiangsu (JS), Anhui (AH), and Hubei (HB) provinces were divided into two parts by the Yangtze River, namely northern (N) regions (JS_N, AH_N, and HB_N) and southern (S) regions (JS_S, AH_S, and HB_S). SD = Shandong; HEN = Henan; SN = Shaanxi; GS = Gansu; SH = Shanghai; ZJ = Zhejiang; JX = Jiangxi; HN = Hunan; SIC = Sichuan; CQ = Chongqing; YN = Yunnan; GZ = Guizhou; FJ = Fujian; GD = Guangdong; GX = Guangxi; HI = Hainan; NYR = region north of the Yangtze River; SYR = region south of the Yangtze River; SWC = southwest China; SC = South China.

Figure 7.
Spatial distribution of number of heat damage days in the tea planting regions of mainland China from June through August in 2013 (a) and 2022 (b).
Figure 7.
Spatial distribution of number of heat damage days in the tea planting regions of mainland China from June through August in 2013 (a) and 2022 (b).

Figure 8.
Spatial distribution of daily LST-weighted heat damage centroids and their spatiotemporal trajectories in the tea planting regions of mainland China from June through August in 2013 (a) and 2022 (b). Different shades of red indicate the day of the year when the geographical centroids appeared. The lighter red colors indicate earlier appearance, and the darker red colors indicate later appearance.

Figure 9.
Differences in the latitude and longitude of heat damage geographical centroids determined with and without LST weights over the tea planting regions of mainland China from June through August in 2013 (a) and 2022 (b).
Figure 9.
Differences in the latitude and longitude of heat damage geographical centroids determined with and without LST weights over the tea planting regions of mainland China from June through August in 2013 (a) and 2022 (b).
Disclaimer/Publisher’s Note: The statements, opinions and data contained in all publications are solely those of the individual author(s) and contributor(s) and not of MDPI and/or the editor(s). MDPI and/or the editor(s) disclaim responsibility for any injury to people or property resulting from any ideas, methods, instructions or products referred to in the content. |
© 2024 by the authors. Licensee MDPI, Basel, Switzerland. This article is an open access article distributed under the terms and conditions of the Creative Commons Attribution (CC BY) license (https://creativecommons.org/licenses/by/4.0/).
Share and Cite
MDPI and ACS Style
Wang, P.; Li, X.; Tang, J.; Wu, D.; Pang, L.; Zhang, Y. Critical Threshold-Based Heat Damage Evolution Monitoring to Tea Plants with Remotely Sensed LST over Mainland China. Remote Sens. 2024, 16, 1784. https://doi.org/10.3390/rs16101784
AMA Style
Wang P, Li X, Tang J, Wu D, Pang L, Zhang Y. Critical Threshold-Based Heat Damage Evolution Monitoring to Tea Plants with Remotely Sensed LST over Mainland China. Remote Sensing. 2024; 16(10):1784. https://doi.org/10.3390/rs16101784
Chicago/Turabian StyleWang, Peijuan, Xin Li, Junxian Tang, Dingrong Wu, Lifeng Pang, and Yuanda Zhang. 2024. "Critical Threshold-Based Heat Damage Evolution Monitoring to Tea Plants with Remotely Sensed LST over Mainland China" Remote Sensing 16, no. 10: 1784. https://doi.org/10.3390/rs16101784
Note that from the first issue of 2016, this journal uses article numbers instead of page numbers. See further details here.