Article

Effect of Irrigation Water Quality and Soil Compost Treatment on Salinity Management to Improve Soil Health and Plant Yield

1
Department of Civil Engineering, New Mexico State University, Las Cruces, NM 88003, USA
2
Department of Electrical Engineering, University of North Texas, Denton, TX 76203, USA
*
Author to whom correspondence should be addressed.
Water 2024, 16(10), 1391; https://doi.org/10.3390/w16101391
Submission received: 30 March 2024 / Revised: 4 May 2024 / Accepted: 9 May 2024 / Published: 13 May 2024
(This article belongs to the Special Issue Soil Water Use and Irrigation Management)

Abstract

:
Increasing soil salinity and degraded irrigation water quality are major challenges for agriculture. This study investigated the effects of irrigation water quality and incorporating compost (3% dry mass in soil) on minimizing soil salinization and promoting sustainable cropping systems. A greenhouse study used brackish water (electrical conductivity of 2010 µS/cm) and agricultural water (792 µS/cm) to irrigate Dundale pea and clay loam soil. Compost treatment enhanced soil water retention with soil moisture content above 0.280 m3/m3, increased plant carbon assimilation by ~30%, improved plant growth by >50%, and reduced NO3 leaching from the soil by 16% and 23.5% for agricultural and brackish water irrigation, respectively. Compared to no compost treatment, the compost-incorporated soil irrigated with brackish water showed the highest plant growth by increasing plant fresh weight by 64%, dry weight by 50%, root length by 121%, and plant height by 16%. Compost treatment reduced soil sodicity during brackish water irrigation by promoting the leaching of Cl and Na+ from the soil. Compost treatment provides an environmentally sustainable approach to managing soil salinity, remediating the impact of brackish water irrigation, improving soil organic matter, enhancing the availability of water and nutrients to plants, and increasing plant growth and carbon sequestration potential.

1. Introduction

Elevated soil salinity and its detrimental effects on crop yields are major global challenges for the agricultural industry [1,2,3]. A lack of good-quality irrigation water has caused soil salinity to increase in arid and semiarid regions that do not receive sufficient rainfall, such as the high plains of the United States [4,5,6]. Farmers using saline irrigation water have suffered long-term soil degradation [7], leading to economic losses due to decreased crop yield [8].
Drought and scarcity of good-quality water are global concerns on crop production; thus, using marginal-quality waters, such as brackish water and reclaimed water, provides an alternative to meet the demands of farming communities [9]. However, irrigation with saline water reduces soil infiltration and increases soil bulk density by clogging the pore spaces and continuity due to high salt content. This will lead to compaction and crust formation, changing soil structure and reducing water and air space within the soil [10,11,12]. Continuous irrigation using saline water reduces soil water holding capacity as the salts displace the soil water space and essential nutrients, altering soil chemistry [13,14,15]. Crop yield is affected by the salt composition and concentration of the irrigation water, as well as the salt tolerance level of the crop due to the osmotic effect of salt in the root zone [16,17]. When irrigation water has a high sodium adsorption ratio (SAR), the Ca2+ and Mg2+ sites in the soil can be replaced by Na+, resulting in permeability issues due to the soil losing its granular structure over time. An increase in irrigation water salinity was reported to lead to significant water consumption [18] in rice fields [19].
Methods for addressing soil salinity problems include desalinating saline water before irrigation, using salt-tolerant plants, and managing soil conditions to prevent salinization. Compost buffers against salinity spikes, making it suitable for sustainable agriculture with saline water. This method offers a cost-effective, environmentally friendly irrigation alternative, conserves freshwater, and improves soil health.
Tillage and composting notably mitigate soil compaction, improving soil aggregate stability and water flow [20]. Compost application at a 20 cm depth more effectively lowers the bulk density than surface application [21]. Compost enriches clay and loam soils with organic matter, enhances porosity, and reduces bulk density more significantly than tilling [22]. Although compost does not always correlate with higher plant yields in clay loam soils [23] compost has improved soil infiltration rates [20,21,22] and hydraulic conductivity, thus increasing soil carbon and aggregate formation [24,25].
Incorporating compost into soil is also an effective method to reduce fertilizer input. The broad use of fertilizers has caused increases in soil salinization and accumulation of heavy metals in soil and groundwater [26,27]. Compost provides essential nutrients for plant uptake with enhanced soil macronutrients (N, P, K, Ca, Mg, and S) and trace elements [28,29,30,31]. Nutrient availability, particularly organic nitrogen, requires mineralization for plant uptake. The high fungal-to-bacterial ratio (F:B) in compost can improve the efficiency of partitioning carbon into soil and plant biomass [32,33], resulting in carbon fixation into the soil and creating a regenerative and sustainable agricultural system [34,35]. The high C/N ratio in compost can combat salinity and alkalinity through sodium chelation of humic acids, reducing soil salinity effects on plant and root development [36,37,38]. Compost application reduces runoff, conserving nutrients (P, N) and preventing sediment loss in various soil types [39,40,41], thereby improving crop yields over time as compost degrades [42]. Although there are concerns that feedstock used and decomposition of composting may be sources for compost salinity [43], compost-amended soils have demonstrated a significant boost in lettuce, tomato, and blueberry growth compared to fertilizer-only controls [44].
Table S1 in Supporting Information summarizes the literature review results on using various types of compost on different soils and plants to investigate the effects of compost on soil health and plant growth. However, there are limited studies on the effectiveness of compost and application rates that maximize benefits while minimizing the risks of soil salinity increases when saline water is used for irrigation. The impacts of combined compost application and saline water irrigation on soil health have not been studied and are poorly understood. There is a lack of comprehensive studies on the environmental impacts of using compost in saline water-irrigated lands, especially regarding the leaching of nutrients to groundwater during irrigation using different water qualities.
Despite evidence that compost incorporation can mitigate soil salinity effects on plant growth and yield, there is a knowledge gap in understanding the underlying mechanisms through systematic studies. This greenhouse study aims to explore salinity management via desalinated irrigation water and compost amendment to enhance plant yield and soil fertility. It employs a mass balance approach and statistical analysis to assess the impact of irrigation water quality and compost treatment on plant growth, soil characteristics, and ion leaching. The research hypotheses are (1) compost can restore fertility, mitigate irrigation water and soil salinity effects on yield, and reduce reliance on synthetic fertilizers; (2) despite irrigation water quality, compost treatment positively influences soil leaching and groundwater quality.
The study is part of a project funded by the INFEWS (Innovations at the Nexus of Food, Energy, and Water Systems) program of the National Science Foundation (NSF) and the United States Department of Agriculture (USDA). The research conducted by the University of North Texas (UNT), New Mexico State University (NMSU), and Colorado State University (CSU), aims to improve crop yield and mitigate soil salinity by effectively integrating microbial community, hydrology, desalination, and renewable power. Two renewable energy-powered, autonomous desalination systems are operated by UNT to compare the effect of irrigation water quality and compost inoculation during the agronomic field experiments at the Brackish Groundwater National Desalination Research Facility (BGNDRF), Alamogordo, New Mexico, and the Arkansas Valley Research Center (AVRC) in Rocky Ford, Colorado.

2. Materials and Methods

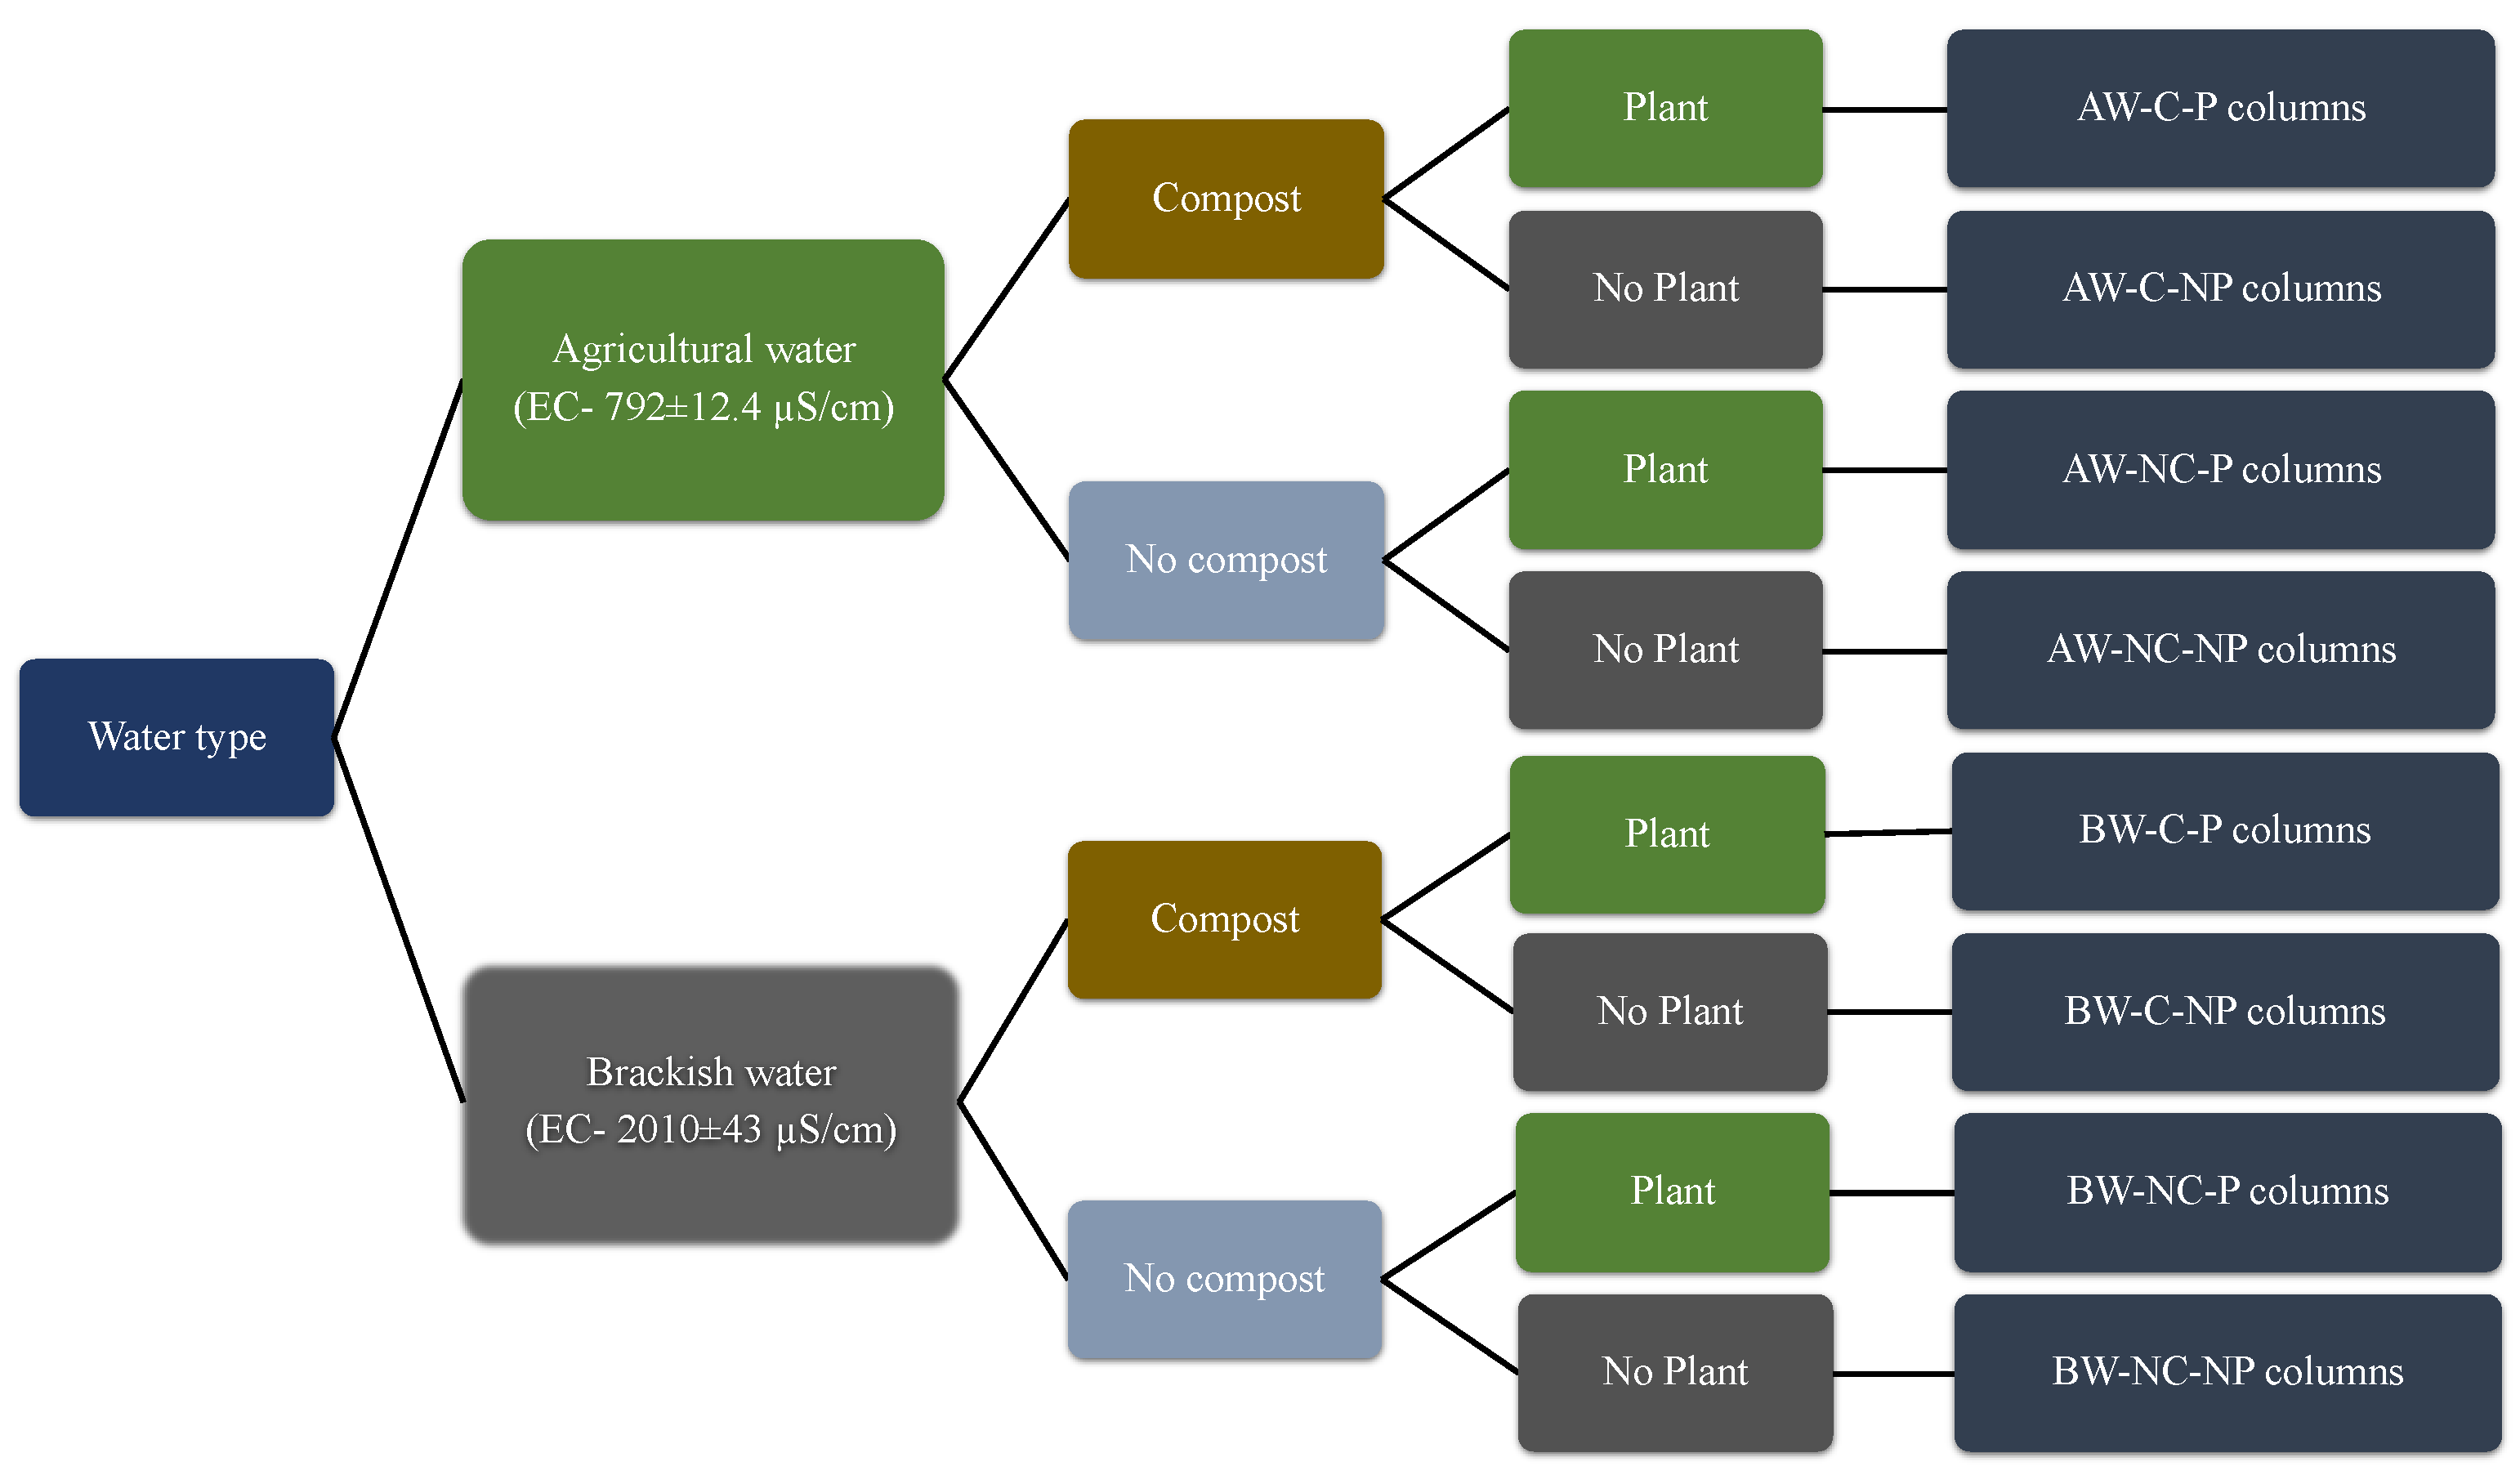
2.1. Experimental Design

A greenhouse experiment was conducted for two months with eight treatments derived from three factors and two levels: (a) two types of irrigation water, including brackish groundwater with electrical conductivity (EC) of 2.010 ± 0.043 mS/cm and agricultural water with EC of 0.792 ± 0.012 mS/cm; (b) two soil treatments—with and without incorporation of compost; and (c) with or without plants. A full factorial combination of these three factors was studied with three replicate soil columns for each treatment condition, as depicted in Figure 1. Plants were grown under indoor greenhouse conditions using AgroMax F54T5HO, GROW SPECTRUM EM-H20, mimicking natural sunlight to ensure the plants received a consistent, quantifiable amount of the light spectrum for plant growth (HTG Supply, Callery, PA, USA). Irrigation experiments were monitored and maintained at a room temperature of at least 18 °C to ensure seed germination.
Water quality parameters of the two types of irrigation water used in this study are given in Table 1 and are based on groundwater collected from BGNDRF Well-1 in Alamogordo, New Mexico. Raw water from Well-1 represents brackish water with total dissolved solids (TDSs) concentration of ~1100 mg/L and SAR of 9. The agricultural water was prepared by mixing the brackish water with desalinated Well-1 water using reverse osmosis (RO), simulating freshwater with TDS concentration of 400 mg/L and SAR of 6.4.
Prior to packing the soil columns, the compost with 70% moisture content was mixed with soil at a compost-to-soil ratio of 10% by weight (w/w), which is equivalent to ~3% w/w compost of dry weight. The compost made of plant residues was collected from a Johnson–Su composting bioreactor [45]. The physicochemical parameters of compost are summarized in Table S7. The compost bioreactor maintained an aerobic, undisturbed static composting environment for one year. Worms (Eisenia fetida) were added after the compost bioreactor temperature decreased to below 28 °C. The compost was irrigated daily to maintain 70% (w/w) moisture content throughout the composting process.
Soil for the columns was collected from the AVRC field testing plots in Rocky Ford, Colorado. AVRC soil with an initial SAR of 0.41 was collected from 0–15 cm, 15–30 cm, and 30–45 cm depths. The soil was classified as clay loam across all layers. The soil was sieved through 3 mm mesh and packed into PVC columns (50 cm height, 10 cm diameter), with each layer (0–15 cm, 15–30 cm, and 30–45 cm) carefully packed with 1500–1800 g of soil or compost-incorporated soil, following measurements to maintain a bulk density (BD) within the range of 1.35–1.40 g/cm3, matching field soil density. Gravimetric water content (GWC) was determined by drying 10 g of homogenized soil at 105 °C for 24 h, with water weight (W) calculated by subtracting dry soil weight (D) from wet soil weight (S), and BD calculated by dividing by soil volume (V). The soil columns, prepared with and without compost treatment, contained bottom holes for water leaching and lateral holes for TEROS-12 probe insertion, enabling soil volumetric water content (VWC) and EC measurements. Soil VWC (accuracy ± 0.03 m3/m3) and EC (accuracy ± 5% for 0 to 5 dS/m and ± 10% for 5–23 dS/m) of each layer were measured daily using a TEROS-12 soil moisture, temperature, and EC sensor (Meter Environment, Meter Group, Inc., Pullman, WA, USA) to monitor the change in moisture content and EC in each layer for different types of treatments.
At the start of the experiment, the soil columns (initial raw soil EC = 0.95 mS/cm) were saturated with water by adding 300 mL of respective irrigation water to the soil columns every day until water started to leach from the columns. The soil VWC ranged from 0.300 to 0.350 m3/m3 on the 6th day of irrigation. After the initial water saturation of the treatment column soil profile, ~100–150 mL of water was applied every day to maintain the soil VWC above 0.200 m3/m3. The soil columns were constructed with perforated holes along the columns and at the bottom to avoid secondary salinization because the experiments were conducted in a closed environment.
Flood irrigation was performed twice during the experiments, irrigating each column with 300 mL of respective irrigation water to the treatment presented in Figure 1, and the leached water was collected from the columns for mass balance analysis. The first flood irrigation was performed on the 6th day (six days at 300 mL per day) from the first irrigation before planting when the columns were saturated, and the second flood irrigation was conducted before harvesting on the 56th day (two days at 300 mL per day).
Dundale pea was selected for this experiment due to its shorter germination period, rapid growth under greenhouse conditions, and sensitivity to water stress and irrigation water salinity. Dundale pea was reported to have an irrigation water salinity tolerance threshold value of 0.6 mS/cm [46], which is below the EC of brackish water (2.010 ± 0.043 mS/cm) and agricultural water (0.792 ± 0.012 mS/cm) used in this study. Dundale pea seeds were sown on day 6 post-initial irrigation, following the first flood irrigation. Soil property characterization and harvest occurred after 50 days. Each column was sown with six seeds at a depth of one inch, from which four healthy seedlings were selected to continue the experiment with controlled seed quality variability.

2.2. Physicochemical Analysis of Irrigation Water, Leached Water, Soil, and Plants

The irrigation water and flood irrigation water samples were filtered using Cole-Parmer nylon chromatography syringes with 0.45 μm filters. Collected leached water samples were stored at 4 °C in a refrigerator prior to analysis, except for water samples to be analyzed for pH, EC, and alkalinity that were analyzed immediately. A benchtop multi-parameter meter (PCD 650 Oakton Instruments, Vernon Hills, IL, USA) was used for measuring pH and EC, whereas the alkalinity of the samples was measured using Hach alkalinity test kits (Hach, Loveland, CO, USA). Major anions were measured using ion chromatography (IC; Dionex ICS-2100, Thermo Fisher Scientific, Pleasanton, CA, USA; EPA method 300.0). An inductively coupled plasma optical emission spectroscopy (ICP-OES; Optima 4300 DV, PerkinElmer, Waltham, MA, USA) was used to measure the total metals and trace elements after sample acidification using EPA method 200.7.
Dissolved organic carbon (DOC, after filtering through 0.45 μm filters) was measured using a TOC-V CSH Total Organic Carbon Analyzer (Shimadzu, Kyoto, Japan), following EPA method 415.3. Full wavelength scans of the UV and visible light absorbance of the samples were performed using a spectrophotometer (DR6000; Hach Company, Loveland, CO, USA). Specific UV absorbance (SUVA) was determined by dividing the UV absorbance at 254 nm by the respective DOC concentration of the sample. The data quality was confirmed with charge balance calculations by having a percentage error of less than 10%.
All plant, soil, and water sample collection, preservation, shipping, and analyses followed the guidance of the United States Environmental Protection Agency (EPA) and standard practices.
The following equations were used for the calculations and comparisons of the results:
S A R = [ N a + ]   m e q / L C a 2 + m e q / L + M g 2 + m e q / L 2 1 / 2  
The   percentage   increase = a b b × 100 %
The   percentage   reduction = b a b × 100 % .
where a is the new value of the parameter with treatment, and b is the baseline value of the parameter without treatment.
Defining Xs as the mass of constituent X leached or retained by the soil, Xw as the mass of X in water added to the column, and Xi as the mass of X in leached water from the column, the equation for mass balance calculation of the leached water for the treatment is written as
X s = X i X w
Samples from each soil layer and each treatment were collected and homogenized by gently crushing from the outside of the sample bags. The soil samples and compost were then placed in a shipping box and stored at 4 °C in a refrigerator before being sent to WARD Laboratories, Inc. for analysis. Soil texture, pH, major ions, NO3, total-N, organic matter (OM), and organic carbon (OC) were analyzed before and after the experiments.
The compost had a pH of 7.6, a neutral pH suitable for most applications [47], a low SAR of 0.64, and a relatively low EC of 1.45 mS/cm comparable to the EC of the brackish water used in the study. The compost consisted of high OM, OC, NO3, and total-N, along with plant macronutrients and micronutrients, as shown in Table S7.
The fresh weight of the plant biomass was measured using a balance (DYMO, M25, Tarzana, CA, USA) immediately after harvesting. Plant height and root length of the plants (after washing) were measured using a meter tape after harvesting. Biomass dry weight was obtained by oven drying at 80 °C for 24–48 h until consistent weight was achieved, subtracting moisture content for dry biomass determination. Once the plants reached the constant weight, they were kept in a desiccator and reweighed (METLER PM480 DeltaRange, Medina, OH, USA). Plant tissue analysis for major cations was prepared from the replicates dried biomass analyzed for NO3 and Kjeldahl Nitrogen by the Soil and Environmental Science Lab at NMSU.
A preliminary logistics and feasibility study was conducted (without replicates) using brackish water (1.747 ± 0.015 mS/cm) and desalinated water (RO permeate of 0.333 ± 0.005 mS/cm) for irrigation with 50 mL of daily irrigation volume. The preliminary study followed the same procedures and methods as described above.

2.3. Data Analysis

The experimental data of plant growth parameters for different treatments were subject to two-way ANOVA to compare differences in treatment using MINITAB version 17.0 software package after confirming their conformity with normal distribution. The comparison of soil VWC, soil EC, soil chemical parameters, and leached mass of Na+, NO3, Cl, DOC, and other ions of different treatments was subject to three-way ANOVA to compare the effect of three factors of treatments after confirming their conformity with normal distribution. Tukey’s pairwise comparisons were performed when the null hypotheses in the ANOVA were rejected. Mean values are indicated by different superscript letters when the mean values are significantly different (p < 0.05) from each other, and when the mean values are not significantly different from each other, the mean values decrease, respectively, with descending alphabetical letters (e.g., a > b > c).

3. Results and Discussion

3.1. Impact of Compost Treatment on Soil Moisture Content and Soil EC

Table 2 presents different treatments on soil moisture (SM) as VWC and soil EC differences among treatments by layer measured from 6th day to 56th of irrigation between compost and no-compost treatment of the soil, with and without plant, and irrigated with brackish water and agricultural water. SM was maintained above 0.200 m3/m3 in each soil layer during the study (for a detailed trend graph, refer to Figures S1 and S2 in Supporting Information). Compost treatment was a significant factor on SM for the top (0–15 cm) and bottom soil layers (30–45 cm) where the lower SM values were obtained for compost-treated columns for the topsoil layer due to increased infiltration. Plant, irrigation water type, and interaction of compost with plant impacted the differences in SM in the middle layer (15–30 cm) of soil where the lower SM values were obtained for brackish water irrigated columns with plants. Compost-treated columns with both irrigation water demonstrated a higher SM (>0.280 m3/m3) for the bottom layer of soil (Table 2, Figure S1b,d and S2b,d) compared to the top and middle layers of the soil from day 4 of irrigation to 42 days of irrigation. A similar trend was observed for the BW-NC-P (recall notation in Figure 1) columns (Figure S1c) and during the preliminary study with brackish water and RO permeate for irrigation (Table S2). Agricultural water did not reduce water flow; thus, the SM did not fluctuate over time compared to brackish water, where water flow and infiltration were reduced due to higher water EC (Figure S2).
Significantly higher SM was recorded in the middle and bottom layers of the soil in the columns with compost and without plants (p-value (CxP) = 0.000) despite the irrigation water type. Similar types of soil treatment and the presence of plants demonstrated insignificant differences in SM for the top and bottom layers of soil irrespective of the irrigation water type as denoted by the same superscript letters. The lowest values of SM for the bottom layer were measured for no-compost and no-plant columns for agricultural water and brackish water irrigation. The soil showed increased SM with 0.300 m3/m3 in the top layer and reduced SM to less than 0.250 m3/m3 in the bottom and middle layers for the BW-NC-NP columns (Figure S1a). These results may be due to the reduced water flow and infiltration caused by a high SAR of 4.4 ± 0.2 for the leached water (Table 3).
Soil aggregate stability could be a factor in the presence of plant roots and enhanced root penetration, which was indicated by increased root length (Table 6). Plant growth and compost treatment improved the water infiltration at the two top layers and resulted in high SM in the bottom layer of soil. Compost treatment improved the water holding capacity manifested by increased SM (>0.275 m3/m3) in the bottom layer of soil for planted columns compared to no-compost-treated columns (~0.250 m3/m3) due to higher OM in the soil (Table 4). Similar results were observed during the study using varying types of compost by Mazumder et al. [47]. Organic matter is responsible for improving soil structure conditions by increasing water adsorption and enhancing pore size and connectivity in soil.
Soil EC was recorded below 3.0 mS/cm for agricultural water irrigated columns, whereas soil EC was above 3.0 mS/cm for brackish water irrigated columns. Compost is a significant factor in increasing soil EC in the middle and bottom layers of soil regardless of the water type (p-value (C) = 0.000). Irrigation water type was a significant factor in soil EC for all three layers of soil, where brackish water irrigated columns measured with higher soil EC compared to agricultural water irrigated columns (p-value (C) = 0.000). The interaction of irrigation water type with plant and compost together increased the soil EC in the middle and bottom layers of the soil regardless of the irrigation water type (p (IWxP and CxIW) < 0.05). The compost-treated columns with plants measured 3.5 mS/cm in the bottom layer, whereas composted no-plants columns had 3.0 mS/cm due to the mineralization of compost by root penetration of plants [48]. The average plant root length in these columns was recorded as 37 ± 1 cm at the end of the experiment. The BW-NC-NP columns increased soil EC from 2.7 to 3.9 mS/cm in the top layer of the soil (Figure S3a). This trend caused reduced water flow and lowered SM, as shown in Figure S1.
Significantly higher soil EC values were measured in the middle and bottom layers for the compost-treated columns irrespective of the plant growth and irrigation water (p-value (C) = 0.000). The soil EC fluctuated until 20 days as the initial soil EC of 3.16 ± 0.07, 3.74 ± 0.30, and 4.38 ± 0.12 mS/cm for brackish water and 2.59 ± 0.08, 3.40 ± 0.04, and 4.31 ± 0.05 mS/cm for agricultural water for top, middle, and bottom layers, respectively. The soil EC was high for compost-treated columns before irrigation for both types of irrigation water due to soluble salts (1.45 mS/cm) in compost, which is in the desired range and will not affect the plants due to salinity (Figures S3 and S4, Table S7) [49,50]. Soil EC had a higher value of 3.06 ± 0.35 mS/cm for brackish water irrigation over agricultural water for compost-treated columns. Soil EC of all three soil layers showed higher values for brackish water columns compared to agricultural water columns except for the middle and bottom layers of AW-C-P columns. A similar trend was observed during the preliminary study using RO permeate and brackish water for irrigation, which also showed higher soil EC for compost–brackish water columns (Table S3). Sodicity stress was not observed in the plant growth parameters (Table S8 and Table 6), suggesting that carboxylic groups in the compost could have chelated Na+ and reduced the Na+ toxicity associated with brackish water irrigation [36,37,38].

3.2. Impact of Compost Treatment on Leaching of Ions and Organics from Soil

The total ions leached, DOC, and SAR values from the soil columns during both flood irrigation events for all treatments are summarized in Table 3. Compost treatment was a significant factor in increasing the NO3, DOC, and SAR of the soil after 56 days of irrigation, irrespective of the irrigation water type. The growth of plants positively impacted the leaching of Cl and Na+ for both brackish and agricultural water irrigated columns (p < 0.05) (Table 3). Interactions of plant presence and compost exhibited a significant effect on the leaching of DOC, Ca2+, Mg2+, and K+ from the irrigated columns after 56 days and thus impacted soil SAR. On the other hand, interactions of irrigation water quality and plant presence significantly affected the leaching of NO3, Na+, and DOC (p < 0.05) (Table 3). Significant amounts of DOC and Na+ leached from the soil in the columns without compost and plants, as denoted by different superscript letters. The highest mass of NO3 and Cl leached was recorded as 1012 ± 34 mg and 604 ± 11 mg, respectively, for the BW-NC-NP columns. The BW-C-NP columns exhibited the highest leaching mass of Na+, Ca2+, K+, and DOC measured at 1114 ± 92 mg, 1293 ± 53 mg, 65 ± 4 mg, and 248 ± 13 mg, respectively. The leaching of Cl and DOC from the BW-C-P columns demonstrated the lowest mass of 426 ± 80 mg and 72 ± 16 mg, with a reduction of 41.8% and 84.7% when compared to the columns without compost amendment and plants, potentially due to the significance of plants (on Cl leaching) and compost factors.
The AW-C-P columns showed the lowest Mg2+ and Ca2+ mass leached, 197 ± 10 mg and 623 ± 29 mg, respectively. The lowest mass of NO3 leached was 570 ± 50 mg from the BW-C-NP columns. Compost alone did not influence the leaching of ions; rather, compost and plant treatment simultaneously reduced the leaching of Cl and NO3 for agricultural water irrigation in contrast with brackish water irrigation. This was indicated by the lowest values of Cl and NO3, respectively, 448 ± 44 mg and 593 ± 33 mg, for the agricultural irrigated columns. The compost-treated columns demonstrated significantly lower NO3 leaching than no-compost treatment (Table 5), The mass of NO3 leached was significantly lower in BW-C-P and BW-C-NP columns at 570 ± 50 mg and 759 ± 7 mg when compared to BW-NC-P and BW-NC-NP columns at 1012 ± 34 mg and 996 ± 110 mg, respectively (p-value (C) = 0.000). Plant presence increased the leaching of NO3 (759 ± 7 mg), compared to compost-incorporated columns without plants (570 ± 50 mg), which may be due to the mobilization of NO3 in the root zone. Plant growth reduced the leaching of NO3 for agricultural water irrigated columns by more than 25%, in contrast to the brackish water columns (Table 5). According to a previous study, loss of nutrients (P and N) from sandy and clay loam soil with runoff was significantly reduced by compost treatment [39,40,41]. Our study using clay loam soil with compost incorporation observed a similar trend, which was also observed during our preliminary study with different irrigation waters (Figure S17). A higher mass of Na+ was leached from BW-C-NP columns with compost treatment (1114 ± 92 mg), and Cl leaching was high with the presence of plants for both types of irrigation water (Figures S18 and S19).
A significantly higher mass of Ca2+ was leached from brackish water columns as the input irrigation water had Ca2+ ~ 62 mg/L (p-value (IW) = 0.000). Calcium is an essential plant nutrient as it contributes to building cell walls and membranes [51], but excessive calcium in the root zone can lead to calcium toxicity by affecting other nutrient uptake and reducing plant growth [52,53]. The lowest leached mass of Ca2+ corresponds to the AW-C-P columns due to plant uptake (Table S4). Magnesium is vital for the function of cellular enzymes and amino acid synthesis [54]; a slightly lower mass of Mg2+ was leached, likely due to plant uptake. K+ is essential for plants to maintain the movement of water and nutrients in plant tissue and is associated with enzyme activation for adenosine triphosphate (ATP) production and regulating photosynthesis [55]. Excess K+ in soil, however, can reduce the availability of Mg2+ and other nutrients [56,57]. The current study demonstrated that the presence of plants and compost treatment reduced the leaching of K+ from 65 ± 4 mg to 20 ± 2 mg for brackish water irrigation and from 47 ± 2 mg to 27 ± 2 mg for agricultural water irrigation.
There were no statistical differences among the treatments or the interactions among treatments for the mass of Cl leached except for the presence of plants (p-value (P) = 0.002). An insignificant reduction in the mass of Cl leached was measured when the plants were present with compost and irrigation water. A similar insignificant trend was observed for Na+ ion and DOC; however, the reduction in leaching by plants was significant for both types of irrigation water (p-value (P)= 0.000). This observation could be due to the plant uptake of these ions (Table S4).
The plant growth metrics were high for the BW-C-P columns where the SAR value was 5.6 ± 0.2. Soil with SAR greater than 13 is classified as sodic soil [12], which affects plant growth and yield [58]. Both types of irrigation water demonstrated significantly lower SAR values at the end of the experiment for the columns with plants than the columns without plants for no-compost columns, whereas opposite results were obtained for compost-treated columns (p-value (CxIWxP) = 0.012). The SAR of irrigation water (Table 1) did not affect plant yield (Table 6). The high leaching of DOC was calculated at 248 ± 13 mg and 245 ± 15 mg for the BW-C-P columns and AW-C-P columns, respectively, potentially due to the high organic content of compost compared to columns with plants (72 ± 16 mg and 118 ± 8 mg, respectively). The compost analysis of this study indicated that the OM of compost was 16.6% (Table S7), 6.3% increase in OM in compost-incorporated soil (Table S5). A reduction in leaching of Na+, K+, and DOC was associated with plant growth, regardless of the soil treatment, potentially due to plant uptake. There was no significant difference in SAR at the initial stage of irrigation for the first flood irrigation on the sixth day of irrigation due to compost incorporation. The leaching of ions from two flood irrigation events and the leaching or retaining of ions are shown in mass balance graphs for each ion (Figures S5–S16).
The UV254 and SUVA analysis of leached water using two qualities of irrigation water is shown in Figure 2. SUVA is a useful parameter for estimating the dissolved aromatic carbon content in aquatic systems as an indicator of humic acids [59,60]. The UV254 and SUVA results were higher during the initial 6 days of irrigation, and the values decreased during 7th–56th days of irrigation after planting. The values were slightly higher for compost-treated columns. For no-compost incorporated columns during the 7th–56th days of irrigation, SUVA values were less than two, indicating a high fraction of non-humic matter. The SUVA values were higher than 2.0 and less than 4.0 for compost treatment for both irrigation periods, indicating the leaching of a mixture of aquatic humic and non-humic matter, and low-to-high-molecular-weight substances even after 56 days of irrigation. Humic substances favor plant growth by improving nutrient uptake, reducing the need for nitrate fertilizers, solubilizing minerals, enhancing soil structure, and increasing soil water holding capacity in addition to chelating Na+ to reduce the Na toxicity to plants [38,61].

3.3. Impact of Compost Treatment on Soil Compositions

The organic matter (OM) and organic carbon (OC) percentages of the columns with different treatments and the percentage increase in OM and OC from the initial soil are summarized in Table 4. The contribution of OM and OC from the compost was subtracted from the calculation. Compost incorporation enhanced the amount of available OM in soil. The highest OM and OC percentages were calculated as 22.9% and 8.4%, respectively, for the BW-C-P columns. The lowest OM and OC percentages were calculated as 15.1% and 3.9%, respectively, for the BW-NC-NP columns and AW-NC-NP columns. The OM and OC increased significantly by >25% and 30%, respectively, for compost-treated columns, regardless of the presence of plants, while decreasing in the columns without compost incorporation. Compost amendment was a significant factor for the observed increase in OM and OC (p-value = 0.000) regardless of the irrigation water type. The columns with plants exhibited an increase in the percentage of OC (0.2%) and OM (0.4%), regardless of compost treatment; however, it is not significant (p-value = 0.682 and 0.592, respectively). These results indicate the carbon fixation potential of plants and the slow decaying of compost. Leaching of OC and OM from the soil was observed with irrigation for no-compost columns. In contrast to BW-NC-P columns, AW-NC-P columns exhibited slight increases in OM and OC from 15.5 ± 0.8% to 15.8 ± 1.2% and from 3.9 ± 0.1% to 4.1 ± 0.5%, respectively, for no-compost columns, whereas there was a reduction for compost-treated columns. This observation may be due to the leaching of DOC from columns (Table 3), as indicated by SUVA analysis (Figure 2). Compost incorporation of soil caused an increase of 6.3% and 24.2% in OM and OC, respectively, compared to the bare soil (Table S5).
The mass of NO3, total-N, Na+, and Cl in the three soil layers for different treatments is illustrated in Figure 3. Compost incorporation and the presence of plants were significant factors in the availability of NO3 and total-N in the soil in each layer. Compost treatments maintained and increased the availability of NO3 and total-N in the soil irrespective of the water type (p < 0.05) (Table S6). Compost-treated soil had significantly higher NO3 content in soil compared to no-compost columns except for the columns irrigated with agricultural water without compost and plants. The BW-NC-NP columns recorded lower NO3 with the value of 13.0 ± 3.7 mg in the bottom layer (30–45 cm). Lower soil NO3 was measured for the columns without plants due to higher leaching of NO3 from the columns. A similar trend was obtained for the mass of total-N in the soil of all the layers, ranging from 2390 to 2824 mg for compost-treated columns and from 1015 to 1507 mg for no-compost columns with brackish water irrigation. Table S5 shows the compost treatment did not increase NO3 in soil; however, Figure 3 shows a higher NO3 in soil due to compost treatment, resulting in an increase in total-N in soil by 15.9%. The incorporation of compost increased fungi and bacteria inoculation in soil and resulted in enhanced microbial growth and activity for NO3 assimilation [35,36,37]. Significantly higher concentrations of total-N and NO3 were recorded for the compost-treated columns for both irrigation water types (p < 0.05); in addition, compost treatment mitigated the difference between the two types of irrigation water (Table S6).
The columns irrigated with brackish water had significantly higher Na+ (above 442 ± 29 mg) than agricultural water irrigated columns (less than 257 ± 10 mg) where the irrigation water type manifested as a significant factor (p < 0.05) (Table S6). The mass of Na+ in the soil was higher in the topsoil layer and reduced with the increasing depth for all treatments. Significantly higher mass of Na+ was measured in all three soil layers ranging from 246 ± 55 mg to 764 ± 142 mg for brackish water irrigated columns compared to agricultural water columns (from 136 ± 2 mg to 347 ± 45 mg) due to high Na+ input of 307 mg/L (p < 0.05) (Table S6). The presence of plants showed a significant influence on built-up Na+ in each layer of the soil when agricultural water was used for irrigation of the plants (p < 0.05) (Table S6). There was a significant difference in the mass of Cl in the top layer due to the impact of irrigation water type and plant growth, whereas plant growth alone impacted the middle and bottom layers of the soil (p < 0.05). There was an increasing trend in the mass of Cl with increasing soil depth for the columns with plants. This trend was statistically significant for both types of irrigation water, as the presence of plants assisted in reducing the Cl in lower soil layers (p < 0.05) (Table S6). This can be explained by leached water as more ions leached from the columns without plants. The mass of Cl in the columns with plants increased with increasing depth regardless of the irrigation water type, where 94.1 ± 31.0 mg and 80.1 ± 24.6 mg were measured in the bottom layer of compost-incorporated columns and 19.4 ± 1.3 and 26.6 ± 22.3 mg for no-compost incorporated columns for both types of irrigation water. The results show that compost significantly boosts NO3 and total-N in soil, enhancing microbial nutrient assimilation. The study reveals that brackish water increases soil Na+ levels more than agricultural water, indicating the importance of compost treatment and water quality in managing soil nutrient dynamics and salinity.

3.4. Impact of Compost Treatment on Reduction in Nutrient Leaching

The effect of compost incorporation and types of irrigation water on the percentage reduction in NO3 leaching are shown in Table 5. The leaching of NO3 decreased for compost amended and no-plant columns by 40.5% and 16.1% when irrigated using brackish and agricultural water, respectively. The BW-C-NP columns showed compost limited the leaching of NO3 from the soil over agricultural water. Low-salinity water irrigation (i.e., agricultural water) might contaminate the groundwater as it leaches out the ions and NO3 from the soil over-fertilized for many years. There was a slight change in NO3 reduction, regardless of the type of irrigation water when plants were present. This result was observed in other studies as compost treatment significantly reduced the loss of nutrients (P & N) due to runoff from sandy and clay loam soil [39,41]. These results can be corroborated by observing the mass of NO3 and total-N in the soil at the end of the experiment (Figure 3). According to the preliminary study, compost treatment also reduced the leaching of NO3 by 36.5% and 9.7%, respectively, for the columns without and with plants during brackish water irrigation. Compost treatments have been observed to prevent the deterioration of groundwater quality by reducing the leaching of NO3, the use of NO3 fertilizers, the slow release of NO3 by mineralization, and the availability of mobile NO3 [62]. The highest leaching of NO3 was recorded when RO permeate was used for irrigation (Figure S17 and Table S9).

3.5. Impact of Plants on Nutrient Leaching

The percentage reduction in NO3 leaching due to compost and plant presence using different types of irrigation water is summarized in Table 5. The percentage leaching of NO3 was higher for the planted columns irrigated with brackish water than agricultural water, potentially because the plant growth increased the mobilization and leaching of NO3. The leaching characteristics in the soils associated with plants resulted in a reduction in NO3 leaching for agricultural water irrigated columns. The AW-C-P columns reduced the leaching of NO3 by 34.1%. When there was no compost, the columns with plants resulted in reduced leaching of NO3 by 25.5%. The highest leaching of NO3 was also measured for the columns with compost and plants in the preliminary study when RO permeate was used for irrigation (Table S10).

3.6. Impact of Compost on Plant Yield, Soil, and Leaching of Ions from the Soil Profile

The mass, height, and root length of harvested plants for four different treatments are summarized in Table 6. The BW-C-P columns measured the highest fresh weight of biomass, plant height, and root length of 18 ± 2.0 g, 132 ± 3 cm, and 42 ± 2 cm, respectively. The treatments without compost using brackish water irrigation resulted in a lower crop yield in the BW-NC-P columns with fresh weight, plant height, and root length of 11 ± 2.3 g, 114 ± 11.9 cm, and 19 ± 0.4 cm, respectively. The agricultural water irrigation in this study demonstrated crop yields lower than the BW-C-P columns with the highest fresh weight of biomass, dry weight of biomass, root length, and plant height of 15 ± 4.2 g, 3.2 ± 0.9 g, 37 ± 1 cm, and 128 ± 14.6 cm, respectively, for the AW-C-P columns. The lowest values for fresh weight, weight of dry biomass, plant height, and root length were 10 ± 2.0 g, 1.87 ± 0.2 g, 118 ± 8.6 cm, and 33 ± 5 cm, respectively, for the AW-NC-P columns. Compost impacted the dry biomass, wet biomass, and root length of biomass, while the irrigation water type and interaction of irrigation water type and compost affected the root length. There was no statistical significance for plant biomass growth results on compost-treated soil with respect to the columns irrigated with agricultural water (as denoted by the shared common superscript letters).
Compost soil treatment resulted in a statistically significant increase in root length for brackish and agricultural water irrigated columns (p-values of 0.000). Compost incorporation demonstrated >50% increase in fresh weight, dry biomass, and root length over no-compost soil for both types of irrigation water. Similar results were obtained by Roghanian et al. [63] for dry weight and stem height and by Duong [37] for shoot biomass, root elongation, and plant growth for compost-treated soil. Compost soil treatment increased plant biomass yield (Table 3; Figure 2), likely due to reducing the effect of soil salinity by chelating sodium on the carboxylic sites of humic substances and ensuring nutrient availability by minimizing nutrient leaching as also observed in other studies [36,62,64].
The BW-C-P columns resulted in a significant 121.1% higher root length than the BW-NC-P columns. Agricultural water irrigation increased root length for no-compost-treated columns over brackish water irrigation by 73.7%. This observation may be due to the direct toxicity of sodium damaging roots when brackish water is used for irrigation [65]. This effect on the root length was indicated by the Na+ in plant tissue of 7959 mg/L (Table S4). However, compost-treated columns did not show any impact of water type on root length or other plant growth parameters as compost treatment helped to withstand the osmotic effect in brackish water irrigated columns, although Na+ was 8190 mg/L in the plant tissues; a similar tendency was reported by [36,64]. Root length increased in compost-treated columns over no-compost columns because compost increased soil aggregate stability [66]. Brackish water irrigation with soil compost treatment improved plant growth characteristics over agricultural water irrigation.
Table 6. Differences in mean ± standard deviation for the plant growth analysis of plants of different treatments (two-way ANOVA).
Irrigation Water TypeSoil TreatmentFresh Weight of Biomass (g)Dry Biomass (g)Plant HeightRoot Length (cm)
(cm)
Impact of compost-treated soil on different types of water irrigation and percentage increase in the plant growth measures in harvested plants
Brackish waterNo compost11 ± 2.3 ab2.1 ± 0.3 a114 ± 11.9 a19 ± 0.4 c
Brackish waterCompost18 ± 2.0 a3.1 ± 0.8 a132 ± 3 a42 ± 2 a
Compost/No compost63.60%50.00%15.80%121.10%
Agricultural waterNo compost10 ± 2.0 b1.87 ± 0.2 a118 ± 8.6 a33 ± 5 b
Agricultural waterCompost15 ± 4.2 ab3.2 ± 0.9 a128 ± 14.6 a37 ± 1 ab
Compost/No compost50.00%50.00%8.50%12.10%
p-valueC0.0060.0100.0580.000
IW0.2460.8901.0000.015
CxIW0.6880.6800.5270.000
Impact on percentage increase in the plant growth measures in harvested plants with varying irrigation water types
Agricultural water/Brackish water (No-compost columns)−9.10%0.00%3.50%73.70%
Agricultural water/ Brackish water
(Compost-treated columns)
−16.70%0.00%−3.00%−13.50%
Note: Mean values indicated by different superscript letters are significantly different from each other (p < 0.05) and mean values a < b < c, n = 3 replicates. p-value; C—significance of compost; P—significance of plants; IW—significance of irrigation water type; and x shows the interaction between the factors.

4. Conclusions

Increasing soil salinity and deteriorating water quality pose major challenges to agriculture globally. Developing environmentally friendly methods is crucial to manage soil salinity and boost crop productivity. This study aimed to investigate the impact of compost incorporation on plant growth and soil health as a non-chemical green treatment. Greenhouse experiments demonstrated that compost treatment was effective in improving the growth and yield of plants by greater than 50%, enhancing water retention and infiltration, the release of nutrients for plant uptake, retention of NO3 by reducing leaching, reduction in Na+ and Cl by leaching, and increasing soil OM (above 30%) and OC (above 25%) by plant carbon fixing and microbial activity. Compost treatment reduced leaching of NO3 by over 20% regardless of the type of irrigation water, which is indicated by high NO3 and total-N in the soil at the end of the experiment. Thus, compost can help prevent the deterioration of groundwater by regulating the percolation of NO3 from the soil. Compost incorporation assisted in reducing the adverse impact of soil salinity by percolating Na+ and Cl during brackish water irrigation. Humic substances, leached from compost-treated columns even after 56 days of irrigation, reduce the leaching of nutrients from the soil while also chelating Na+ to reduce the Na toxicity of plants. Low-salinity water is recommended to remediate soil salinity conditions; however, it may increase leaching nutrients (NO3) from the over-fertilized soil, causing contamination of groundwater and negatively impacting plant growth.
The research highlighted the need for further investigation into how compost reduces NO3 leaching and addresses soil salinity. Future studies will examine the practicality and effects of mixing compost into the top 0–15 cm of soil under both greenhouse and field conditions, especially for salt-sensitive and high-value crops.

Supplementary Materials

The following supporting information can be downloaded at https://www.mdpi.com/article/10.3390/w16101391/s1. Table S1: Summary of the literature review on compost-related studies. Table S2: Soil moisture content analysis of different treatments in different layers (preliminary study). Table S3: Soil electrical conductivity analysis of different treatments in different layers (preliminary study). Table S4: Plant tissue analysis. Table S5: Soil chemical parameters. Table S6: Differences in mean ± standard deviation (SD) for the ions and nutrients in soil layers of different treatments (three-way ANOVA) for brackish water irrigated columns. Table S7: Physicochemical parameters of compost. Table S8: Impact of compost and different irrigation water types on biomass. Table S9: Percentage reduction in NO3 leaching by compost with different types of irrigation water (preliminary study). Table S10: Percentage reduction in NO3 leaching by plant with different types of irrigation water (preliminary study). Figure S1: Soil moisture content trend of different treatments during irrigation using brackish water. Figure S2: Soil moisture content trend of different treatments during irrigation using agricultural water. Figure S3: Soil EC trend of different treatments during the irrigation using brackish water. Figure S4: Soil EC trend of different treatments during the irrigation using agricultural water. Figure S5: Mass balance of NO3 in greenhouse experimental columns (a) during first 6 days of irrigation, (b) during 7th–56th days of irrigation, and (c) percentage of mass of NO3 leached during different irrigation periods. The columns with plant treatment were planted on the 7th day for brackish water irrigated columns. Figure S6: Mass balance of Cl in greenhouse experimental columns (a) during first 6 days of irrigation, (b) during 7th–56th days of irrigation, and (c) percentage of mass of Cl leached during different irrigation periods. The columns with plant treatment were planted on the 7th day for brackish water irrigated columns. Figure S7: Mass balance of Na+ in greenhouse experimental columns (a) during first 6 days of irrigation, (b) during 7th–56th days of irrigation, and (c) percentage of mass of Na+ leached during different irrigation periods. The columns with plant treatment were planted on the 7th day for brackish water irrigated columns. Figure S8: Mass balance of NO3 in greenhouse experimental columns (a) during first 6 days of irrigation, (b) during 7th–56th days of irrigation, and (c) percentage of mass of NO3 leached during different irrigation periods. The columns with plant treatment were planted on the 7th day for agricultural water irrigated columns. Figure S9: Mass balance of Cl in greenhouse experimental columns (a) during first 6 days of irrigation, (b) during 7th–56th days of irrigation, and (c) percentage of mass of Cl leached during different irrigation periods. The columns with plant treatment were planted on the 7th day for agricultural water irrigated columns. Figure S10: Mass balance of Na+ in greenhouse experimental columns (a) during first 6 days of irrigation, (b) during 7th–56th days of irrigation, and (c) percentage of mass of Na+ leached during different irrigation periods. The columns with plant treatment were planted on the 7th day for agricultural water irrigated columns. Figure S11: Mass balance of NO3 in greenhouse experimental columns (a) during first 6 days of irrigation, (b) during 7th–56th days of irrigation, and (c) percentage of mass of NO3 leached during different irrigation periods. The columns with plant treatment were planted on the 7th day for compost-treated columns. Figure S12: Mass balance of Cl in greenhouse experimental columns (a) during first 6 days of irrigation, (b) during 7th–56th days of irrigation, and (c) percentage of mass of Cl leached during different irrigation periods. The columns with plant treatment were planted on the 7th day for compost-treated columns. Figure S13: Mass balance of Na+ in greenhouse experimental columns (a) during first 6 days of irrigation, (b) during 7th–56th days of irrigation, and (c) percentage of mass of Na+ leached during different irrigation periods. The columns with plant treatment were planted on the 7th day for compost-treated columns. Figure S14: Mass balance of NO3 in greenhouse experimental columns (a) during first 6 days of irrigation, (b) during 7th–56th days of irrigation, and (c) percentage of mass of NO3 leached during different irrigation periods. The columns with plant treatment were planted on the 7th day for plant-treated columns. Figure S15: Mass balance of Cl in greenhouse experimental columns (a) during first 6 days of irrigation, (b) during 7th–56th days of irrigation, and (c) percentage of mass of Cl leached during different irrigation periods. The columns with plant treatment were planted on the 7th day for plant-treated columns. Figure S16: Mass balance of Na+ in greenhouse experimental columns (a) during first 6 days of irrigation, (b) during 7th–56th days of irrigation, and (c) percentage of mass of Na+ leached during different irrigation periods. The columns with plant treatment were planted on the 7th day for plant-treated columns. Figure S17: Mass of NO3 leached from different treatments. The columns with plant treatment were planted on the 7th day. Figure S18: Mass of Cl leached from different treatments. The columns with plant treatment were planted on the 7th day (preliminary study). Figure S19: Mass of Na+ leached from different treatments. The columns with plant treatment were planted on the 7th day (preliminary study). References [67,68,69,70] are cited in the Supplementary Materials.

Author Contributions

Conceptualization, S.S., D.J., M.A., B.S. and P.X.; methodology, S.S., D.J. and P.X.; validation, S.S., D.J., M.A. and P.X.; formal analysis, S.S., D.J. and P.X.; investigation, S.S., D.J. and P.X.; resources, D.J. and P.X.; data curation, S.S.; writing—original draft preparation, S.S., D.J. and P.X.; writing—review and editing, S.S., D.J., M.A. and P.X.; visualization, S.S.; supervision, D.J. and P.X.; project administration, P.X.; funding acquisition, M.A., D.J. and P.X. All authors have read and agreed to the published version of the manuscript.

Funding

Funding support was provided by the Innovations at the Nexus of Food, Energy, and Water Systems (INFEWS) program of the National Science Foundation under award number 1856052 to the University of North Texas (UNT), New Mexico State University (NMSU), and Colorado State University (CSU).

Data Availability Statement

Data are contained within the article and Supplementary Materials.

Acknowledgments

The Brackish Groundwater National Desalination Research Facility (BGNDRF) provided well water, and UNT provided desalinated water from the UNT GreenDesal desalination unit at BGNDRF. UNT and CSU provided soil from the Arkansas Valley Research Center in Rocky Ford, Colorado.

Conflicts of Interest

The authors declare no conflicts of interest.

References

  1. Pitman, M.G.; Läuchli, A. Global impact of salinity and agricultural ecosystems. In Salinity: Environment-Plants-Molecules; Springer: Dordrecht, The Netherlands, 2002; pp. 3–20. [Google Scholar]
  2. Phour, M.; Sindhu, S.S. Soil Salinity and Climate Change: Microbiome-Based Strategies for Mitigation of Salt Stress to Sustainable Agriculture. In Climate Change and Microbiome Dynamics: Carbon Cycle Feedbacks; Springer: Cham, Switzerland, 2023; pp. 191–243. [Google Scholar]
  3. Khasanov, S.; Kulmatov, R.; Li, F.; van Amstel, A.; Bartholomeus, H.; Aslanov, I.; Sultonov, K.; Kholov, N.; Liu, H.; Chen, G. Impact assessment of soil salinity on crop production in Uzbekistan and its global significance. Agric. Ecosyst. Environ. 2023, 342, 108262. [Google Scholar] [CrossRef]
  4. Brewster, J. Flowering and Seed Production in Overwintered Cultivars of Bulb Onions: I. Effects of Different Raising Environments, Temperatures and Daylengths. J. Hortic. Sci. 1982, 57, 93–101. [Google Scholar] [CrossRef]
  5. Corwin, D.L. Climate change impacts on soil salinity in agricultural areas. Eur. J. Soil Sci. 2021, 72, 842–862. [Google Scholar] [CrossRef]
  6. Pratt, R.C.; Velasco-Cruz, C.; Darapuneni, M.; Montgomery, R.; Grant, L. Southwest-adapted maize germplasm as a potential genetic resource for selection of salinity tolerant cultivars. Crop Sci. 2022, 62, 286–300. [Google Scholar] [CrossRef]
  7. Hussain, M.I.; Farooq, M.; Muscolo, A.; Rehman, A. Crop diversification and saline water irrigation as potential strategies to save freshwater resources and reclamation of marginal soils—A review. Environ. Sci. Pollut. Res. 2020, 27, 28695–28729. [Google Scholar] [CrossRef]
  8. Welle, P.D.; Mauter, M.S. High-resolution model for estimating the economic and policy implications of agricultural soil salinization in California. Environ. Res. Lett. 2017, 12, 094010. [Google Scholar] [CrossRef]
  9. Cavalcante, E.S.; Lacerda CFd Costa, R.N.T.; Gheyi, H.R.; Pinho, L.L.; Bezerra, F.M.S.; de Oliveira, A.C.; Canjá, J.F. Supplemental irrigation using brackish water on maize in tropical semi-arid regions of Brazil: Yield and economic analysis. Sci. Agrícola 2021, 78, 1–9. [Google Scholar] [CrossRef]
  10. Hillel, D. Salinity Management for Sustainable Irrigation: Integrating Science, Environment, and Economics; World Bank Publications: Washington, DC, USA, 2000. [Google Scholar]
  11. Anikwe, M. Soil Management for enhanced crop productivity. In Proceedings of the 57th Annual General Meeting of the Association of Deans of Agriculture in Nigerian Universities (ADAN), Abakaliki, Nigeria, 15–18 June 2015. [Google Scholar]
  12. Mohanavelu, A.; Naganna, S.R.; Al-Ansari, N. Irrigation induced salinity and sodicity hazards on soil and groundwater: An overview of its causes, impacts and mitigation strategies. Agriculture 2021, 11, 983. [Google Scholar] [CrossRef]
  13. Ben-Hur, M.; Shainberg, I.; Bakker, D.; Keren, R. Effect of soil texture and CaCO3 content on water infiltration in crusted soil as related to water salinity. Irrig. Sci. 1985, 6, 281–294. [Google Scholar] [CrossRef]
  14. Kemper, W.; Rosenau, R. Aggregate stability and size distribution. In Methods of Soil Analysis: Part 1 Physical and Mineralogical Methods; American Society of Agronomy, Inc.: Madison, WI, USA, 1986; Volume 5, pp. 425–442. [Google Scholar]
  15. Tessema, N.; Yadeta, D.; Kebede, A.; Ayele, G.T. Soil and irrigation water salinity, and its consequences for agriculture in Ethiopia: A systematic review. Agriculture 2022, 13, 109. [Google Scholar] [CrossRef]
  16. Fornes, F.; Belda, R.M.; Carrión, C.; Noguera, V.; García-Agustín, P.; Abad, M. Pre-conditioning ornamental plants to drought by means of saline water irrigation as related to salinity tolerance. Sci. Hortic. 2007, 113, 52–59. [Google Scholar] [CrossRef]
  17. Ludwiczak, A.; Osiak, M.; Cárdenas-Pérez, S.; Lubińska-Mielińska, S.; Piernik, A. Osmotic stress or ionic composition: Which affects the early growth of crop species more? Agronomy 2021, 11, 435. [Google Scholar] [CrossRef]
  18. Ning, S.; Zhou, B.; Wang, Q.; Tao, W. Evaluation of irrigation water salinity and leaching fraction on the water productivity for crops. Int. J. Agric. Biol. Eng. 2020, 13, 170–177. [Google Scholar] [CrossRef]
  19. Beecher, H. Effect of saline water on rice yields and soil properties in the Murrumbidgee Valley. Aust. J. Exp. Agric. 1991, 31, 819–823. [Google Scholar] [CrossRef]
  20. Kranz, C.N.; McLaughlin, R.A.; Johnson, A.; Miller, G.; Heitman, J.L. The effects of compost incorporation on soil physical properties in urban soils–A concise review. J. Environ. Manag. 2020, 261, 110209. [Google Scholar] [CrossRef] [PubMed]
  21. Cogger, C.; Hummel, R.; Hart, J.; Bary, A. Soil and redosier dogwood response to incorporated and surface-applied compost. HortScience 2008, 43, 2143–2150. [Google Scholar] [CrossRef]
  22. Mohammadshirazi, F.; McLaughlin, R.A.; Heitman, J.L.; Brown, V.K. A multi-year study of tillage and amendment effects on compacted soils. J. Environ. Manag. 2017, 203, 533–541. [Google Scholar] [CrossRef] [PubMed]
  23. Weindorf, D.C.; Zartman, R.E.; Allen, B. Effect of compost on soil properties in Dallas, Texas. Compost. Sci. Util. 2006, 14, 59–67. [Google Scholar] [CrossRef]
  24. Aggelides, S.; Londra, P. Effects of compost produced from town wastes and sewage sludge on the physical properties of a loamy and a clay soil. Bioresour. Technol. 2000, 71, 253–259. [Google Scholar] [CrossRef]
  25. Masmoudi, S.; Magdich, S.; Rigane, H.; Medhioub, K.; Rebai, A.; Ammar, E. Effects of compost and manure application rate on the soil physico-chemical layers properties and plant productivity. Waste Biomass Valorization 2020, 11, 1883–1894. [Google Scholar] [CrossRef]
  26. Gates, T.K.; Cody, B.M.; Donnelly, J.P.; Herting, A.W.; Bailey, R.T.; Mueller Price, J. Assessing selenium contamination in the irrigated stream–aquifer system of the Arkansas River, Colorado. J. Environ. Qual. 2009, 38, 2344–2356. [Google Scholar] [CrossRef] [PubMed]
  27. Jayakumar, M.; Surendran, U.; Raja, P.; Kumar, A.; Senapathi, V. A review of heavy metals accumulation pathways, sources and management in soils. Arab. J. Geosci. 2021, 14, 2156. [Google Scholar] [CrossRef]
  28. Butler, T.J.; Han, K.J.; Muir, J.P.; Weindorf, D.C.; Lastly, L. Dairy manure compost effects on corn silage production and soil properties. Agron. J. 2008, 100, 1541–1545. [Google Scholar] [CrossRef]
  29. Chatterjee, N.; Flury, M.; Hinman, C.; Cogger, C.G. Chemical and Physical Characteristics of Compost Leachates. A Review Report Prepared for the Washington State Department of Transportation; Washington State University: Puyallup, WA, USA, 2013. [Google Scholar]
  30. Zlotopolski, V. Magnetic treatment reduces water usage in irrigation without negatively impacting yield, photosynthesis and nutrient uptake in lettuce. Int. J. Appl. Agric. Sci. 2017, 3, 117–122. [Google Scholar] [CrossRef]
  31. Ho, T.T.K.; Le, T.H.; Tran, C.-S.; Nguyen, P.-T.; Thai, V.-N.; Bui, X.-T. Compost to improve sustainable soil cultivation and crop productivity. Case Stud. Chem. Environ. Eng. 2022, 6, 100211. [Google Scholar] [CrossRef]
  32. Malik, A.A.; Chowdhury, S.; Schlager, V.; Oliver, A.; Puissant, J.; Vazquez, P.G.; Jehmlich, N.; von Bergen, M.; Griffiths, R.I.; Gleixner, G. Soil fungal: Bacterial ratios are linked to altered carbon cycling. Front. Microbiol. 2016, 7, 1247. [Google Scholar] [CrossRef]
  33. Sun, L.; Ataka, M.; Kominami, Y.; Yoshimura, K.; Kitayama, K. A constant microbial C/N ratio mediates the microbial nitrogen mineralization induced by root exudation among four co-existing canopy species. Rhizosphere 2021, 17, 100317. [Google Scholar] [CrossRef]
  34. Johnson, D.C. The influence of soil microbial community structure on carbon and nitrogen partitioning in plant/soil ecosystems. PeerJ Preprints 2017. [Google Scholar] [CrossRef]
  35. Rashid, M.I.; Mujawar, L.H.; Shahzad, T.; Almeelbi, T.; Ismail, I.M.; Oves, M. Bacteria and fungi can contribute to nutrients bioavailability and aggregate formation in degraded soils. Microbiol. Res. 2016, 183, 26–41. [Google Scholar] [CrossRef]
  36. El Hasini, S.; De Nobili, M.; El Azzouzi, M.; Azim, K.; Douaik, A.; Laghrour, M.; El Idrissi, Y.; El Alaoui El Belghiti, M.; Zouahri, A. The influence of compost humic acid quality and its ability to alleviate soil salinity stress. Int. J. Recycl. Org. Waste Agric. 2020, 9, 21–31. [Google Scholar]
  37. Duong, T.T.T. Compost Effects on Soil Properties and Plant Growth. Ph.D. Thesis, School of Agriculture, Food and Wine, Adelaide, Australia, 2013. [Google Scholar]
  38. Malik, Z.; Malik, N.; Noor, I.; Kamran, M.; Parveen, A.; Ali, M.; Sabir, F.; Elansary, H.O.; El-Abedin, T.K.Z.; Mahmoud, E.A.; et al. Combined Effect of Rice-Straw Biochar and Humic Acid on Growth, Antioxidative Capacity, and Ion Uptake in Maize (Zea mays L.) Grown Under Saline Soil Conditions. J. Plant Growth Regul. 2023, 42, 3211–3228. [Google Scholar] [CrossRef]
  39. Mohammadshirazi, F.; Brown, V.; Heitman, J.; McLaughlin, R. Effects of tillage and compost amendment on infiltration in compacted soils. J. Soil Water Conserv. 2016, 71, 443–449. [Google Scholar] [CrossRef]
  40. Faucette, L.; Jordan, C.; Risse, L.; Cabrera, M.; Coleman, D.; West, L. Evaluation of stormwater from compost and conventional erosion control practices in construction activities. J. Soil Water Conserv. 2005, 60, 288–297. [Google Scholar]
  41. Favaretto, N.; Cherobim, V.F.; de Medeiros Silveira, F.; Timofiecsyk, A.; Skalitz, R.; Barth, G.; Pauletti, V.; Dieckow, J.; Vezzani, F.M. Can application of liquid dairy manure onto no-tillage oxisols reduce runoff, sediment, phosphorus, and nitrogen losses over 9 years of natural rainfall? Geoderma 2022, 405, 115406. [Google Scholar] [CrossRef]
  42. Sullivan, D.; Fransen, S.; Bary, A.; Cogger, C. Fertilizer nitrogen replacement value of food residuals composted with yard trimmings, paper or wood wastes. Compost. Sci. Util. 1998, 6, 6–18. [Google Scholar] [CrossRef]
  43. Hoitink, H.A.; Grebus, M.E. Status of biological control of plant diseases with composts. Compost. Sci. Util. 1994, 2, 6–12. [Google Scholar] [CrossRef]
  44. Reddy, N.; Crohn, D.M. Compost induced soil salinity: A new prediction method and its effect on plant growth. Compost. Sci. Util. 2012, 20, 133–140. [Google Scholar] [CrossRef]
  45. Johnson, D. Johnson Su Bioreactor. March 2016. Available online: https://www.youtube.com/watch?v=DxUGk161Ly8 (accessed on 18 November 2022).
  46. Duzdemir, O.; Kurunc, A.; Unlukara, A. Response of pea (Pisum sativum) to salinity and irrigation water regime. Bulg. J. Agric. Sci. 2009, 15, 400–409. [Google Scholar]
  47. Mazumder, P.; Akhil, P.; Khwairakpam, M.; Mishra, U.; Kalamdhad, A.S. Enhancement of soil physico-chemical properties post compost application: Optimization using Response Surface Methodology comprehending Central Composite Design. J. Environ. Manag. 2021, 289, 112461. [Google Scholar] [CrossRef]
  48. Malik, A.; Fatima, Q.U.A.; Umer, T.; Nazeer, S.; Irum, A.; Ullah, G.; Butt, B.; Khan, A.A.; Saddozai, U.K.; Ullah, S.; et al. Manure additions in different texture soils to enhance maize root penetration. Pak. J. Biotechnol. 2023, 20, 139–145. [Google Scholar] [CrossRef]
  49. Laboratory, A.A.S. Compost Analysis Report; The Pennsylvania State University: University Park, PA, USA, 2019. [Google Scholar]
  50. Crohn, D.M. Assessing Compost Quality for Agriculture ANR publication 8514; University of California: Richmond, CA, USA, 2016; p. 12. [Google Scholar]
  51. Prajapati, J. The essential nutrient element for the crop. Int. J. All Res. Writ. 2019, 1, 17–22. [Google Scholar]
  52. White, P.J.; Broadley, M.R. Calcium in plants. Ann. Bot. 2003, 92, 487–511. [Google Scholar] [CrossRef] [PubMed]
  53. Weng, X.; Li, H.; Ren, C.; Zhou, Y.; Zhu, W.; Zhang, S.; Liu, L. Calcium regulates growth and nutrient absorption in poplar seedlings. Front. Plant Sci. 2022, 13, 887098. [Google Scholar] [CrossRef] [PubMed]
  54. Shaul, O. Magnesium transport and function in plants: The tip of the iceberg. Biometals 2002, 15, 307–321. [Google Scholar] [CrossRef] [PubMed]
  55. Pagliari, P.; Kaiser, D.; Rosen, C.; Lamb, J. The Nature of Phosphorus in Soils; Nutrient Management, University of Minnesota Extension: St Paul, MN, USA, 2017; FO-6795-C. [Google Scholar]
  56. Selvaraj, V.; Sankar, J. Characterisation of magnesium toxicity, its influence on amino acid synthesis pathway and biochemical parameters of tea. Res. J. Phytochem. 2010, 4, 67–77. [Google Scholar]
  57. Chaudhry, A.H.; Nayab, S.; Hussain, S.B.; Ali, M.; Pan, Z. Current understandings on magnesium deficiency and future outlooks for sustainable agriculture. Int. J. Mol. Sci. 2021, 22, 1819. [Google Scholar] [CrossRef]
  58. Davis, J.G.; Waskom, R.M.; Bauder, T.A. Managing Sodic Soils. 2012. Available online: https://extension.colostate.edu/topic-areas/agriculture/managing-sodic-soils-0-504/ (accessed on 9 March 2023).
  59. Weishaar, J.L.; Aiken, G.R.; Bergamaschi, B.A.; Fram, M.S.; Fujii, R.; Mopper, K. Evaluation of specific ultraviolet absorbance as an indicator of the chemical composition and reactivity of dissolved organic carbon. Environ. Sci. Technol. 2003, 37, 4702–4708. [Google Scholar] [CrossRef] [PubMed]
  60. Wu, X.; Zhao, X.; Wu, W.; Hou, J.; Zhang, W.; Tang, D.K.H.; Zhang, X.; Yang, G.; Zhang, Z.; Yao, Y.; et al. Biotic and abiotic effects of manganese salt and apple branch biochar co-application on humification in the co-composting of hog manure and sawdust. Chem. Eng. J. 2024, 482, 149077. [Google Scholar] [CrossRef]
  61. Mayhew, L. Humic substances in biological agriculture. Acres 2004, 34, 54–61. [Google Scholar]
  62. Amlinger, F.; Peyr, S.; Geszti, J.; Dreher, P.; Karlheinz, W.; Nortcliff, S. Beneficial Effects of Compost Application on Fertility and Productivity of Soils; Federal Ministry for Agriculture and Forestry, Environment and Water Management (Lebensministerium.at): Wien, Austria, 2007; 173p. [Google Scholar]
  63. Roghanian, S.; Hosseini, H.M.; Savaghebi, G.; Halajian, L.; Jamei, M.; Etesami, H. Effects of composted municipal waste and its leachate on some soil chemical properties and corn plant responses. Int. J. Agric. Res. Rev. 2012, 2, 801–814. [Google Scholar]
  64. Hanay, A.; Büyüksönmez, F.; Kiziloglu, F.M.; Canbolat, M.Y. Reclamation of saline-sodic soils with gypsum and MSW compost. Compost. Sci. Util. 2004, 12, 175–179. [Google Scholar] [CrossRef]
  65. UC-IPM. University of California Statewide Integrated Pest Management Program (UC IPM). Nutrient and Mineral Excesses, Salinity, and Salt Toxicity. 2021. Available online: https://ipm.ucanr.edu/PMG/GARDEN/ENVIRON/salttoxicity.html (accessed on 9 March 2023).
  66. Cogger, C.G. Potential compost benefits for restoration of soils disturbed by urban development. Compost. Sci. Util. 2005, 13, 243–251. [Google Scholar] [CrossRef]
  67. Dubey, S.; Mondal, R. Effect of amendments and saline irrigation water on soil properties and yields of rice and wheat in a highly sodic soil. J. Agric. Sci. 1994, 122, 351–357. [Google Scholar] [CrossRef]
  68. Giusquiani, P.; Pagliai, M.; Gigliotti, G.; Businelli, D.; Benetti, A. Urban Waste Compost: Effects on Physical, Chemical, and Biochemical Soil Properties; American Society of Agronomy, Crop Science Society of America, and Soil Science Society of America: Madison, WI, USA, 1995; Volume 24, pp. 175–182. [Google Scholar]
  69. Schulz, H.; Dunst, G.; Glaser, B. Positive effects of composted biochar on plant growth and soil fertility. Agron. Sustain. Dev. 2013, 33, 817–827. [Google Scholar] [CrossRef]
  70. Tan, S.; Su, X.; Jiang, X.; Yao, W.; Chen, S.; Yang, Q.; Ning, S. Irrigation salinity affects water infiltration and hydraulic parameters of red soil. Agronomy 2023, 13, 2627. [Google Scholar] [CrossRef]
Figure 1. Treatment combinations of the greenhouse experiment with triplicate soil columns for each condition and the notations for the columns. Note: EC stands for electrical conductivity of water.
Water 16 01391 g001
Figure 2. Organic analysis in terms of UV254 (1/cm) and specific UV absorbance (SUVA) (L/mg·m) in leached water from different treatments during (a) brackish water irrigation and (b) agricultural water irrigation.
Water 16 01391 g002
Figure 3. Mass of (a) NO3, (b) total-N, (c) Na+, and (d) Cl in soil layers at the end of the irrigation experiment for different treatment combinations.
Water 16 01391 g003
Table 1. Water quality parameters of irrigation water.
Irrigation WaterpHECTDSAlkalinitySARNa+Ca2+Mg2+K+ClNO3SO42−
(mS/cm)(mg/L)(mg/L as CaCO3) (mg/L)
Brackish water8.052.01010882909.030761.915.72.229.30.5664
Agricultural water7.080.7924131606.413021.85.55.316.90.24233
Table 2. Soil moisture content (SM) in VWC and soil EC (mean ± standard deviation) using three-way ANOVA.
Irrigation Water TypeSoil TreatmentPlantSoil Electrical Conductivity (mS/cm)Soil Moisture Content (m3/m3)
0–15 cm15–30 cm30–45 cm0–15 cm15–30 cm30–45 cm
Brackish waterNo compostNo plant3.000 ± 0.554 ab2.401 ± 0.235 d2.557 ± 0.280 d0.252 ± 0.037 a0.237 ± 0.012 b0.245 ± 0.012 c
Brackish waterCompostNo plant2.752 ± 0.505 b2.942 ± 0.287 b3.541 ± 0.399 ab0.242 ± 0.019 abc0.246 ± 0.014 a0.300 ± 0.014 a
Brackish waterNo compostPlant2.930 ± 0.597 ab2.756 ± 0.296 bc3.063 ± 0.336 c0.231 ± 0.015 bc0.222 ± 0.014 d0.275 ± 0.021 b
Brackish waterCompostPlant3.058 ± 0.350 a3.666 ± 0.364 a3.668 ± 0.498 a0.230 ± 0.013 c0.224 ± 0.009 d0.280 ± 0.016 b
Agricultural waterNo compostNo plant2.249 ± 0.243 c2.090 ± 0.388 e2.245 ± 0.376 e0.252 ± 0.023 a0.248 ± 0.011 a0.257 ± 0.023 c
Agricultural waterCompostNo plant2.076 ± 0.267 c2.430 ± 0.414 d3.209 ± 0.650 c0.244 ± 0.024 abc0.253 ± 0.008 a0.300 ± 0.016 a
Agricultural waterNo compostPlant2.112 ± 0.384 c1.852 ± 0.123 f2.167 ± 0.203 e0.246 ± 0.027 ab0.234 ± 0.015 bc0.271 ± 0.024 b
Agricultural waterCompostPlant2.277 ± 0.301 c2.670 ± 0.298 c3.320 ± 0.497 bc0.230 ± 0.015 c0.228 ± 0.008 cd0.283 ± 0.028 a
p-valueC0.0010.0940.5010.0000.0000.000
P0.0000.0000.1150.0000.0010.452
IW0.0830.0000.0000.0000.0000.200
CxP0.9650.0010.0000.0000.3120.000
CxIW0.1610.0160.5520.0390.0060.457
IWxP0.2120.7460.3660.0000.0020.145
CxIWxP0.1260.3150.8470.4490.0030.048
Note: Mean values indicated by different superscript letters are significantly different from each other (p < 0.05) and a—higher mean value; b—lower mean value, n = 3 replicates; p-value; C—significance of compost; P—significance of plants; IW—significance of irrigation water type; and x shows the interaction between the factors.
Table 3. Differences in mean ± standard deviation for the leached ions and DOC and SAR values from columns of different treatments (three-way ANOVA).
Irrigation WaterSoil TreatmentPlant Total Mass of Leaching (mg) SAR in 6 Days (Before Planting)SAR after 56 Days of Irrigation
NO3ClNa+Ca2+Mg2+K+DOC
Brackish waterNo compostNo plant1012 ± 34 ab604 ± 11 a991 ± 37 ab952 ± 24 abc248 ± 12 bc37 ± 4 bcd133 ± 15 b1.8 ± 0.1 a4.4 ± 0.2 b
Brackish waterNo compostPlant996 ± 110 abc488 ± 42 ab694 ± 64 bc1206 ± 114 a392 ± 16 a40 ± 3 bc80 ± 1 cd1.9 ± 0.1 a3.3 ± 0.2 c
Brackish waterCompostNo plant570 ± 50 d562 ± 39 ab1114 ± 92 a1293 ± 53 a309 ± 16 b65 ± 4 a248 ± 13 a1.8 ± 0.1 a4.2 ± 0.3 b
Brackish waterCompostPlant759 ± 7 cd426 ± 80 ab855 ± 133 ab999 ± 133 ab152 ± 19 d20 ± 2 f72 ± 16 d2.0 ± 0.0 a5.6 ± 0.2 a
Agricultural waterNo compostNo plant1078 ± 155 a525 ± 31 ab524 ± 33 cd717 ± 22 bc219 ± 13 cd34 ± 1 cde121 ± 14 bc1.7 ± 0.0 a2.6 ± 0.2 d
Agricultural waterNo compostPlant804 ± 124 bcd494 ± 49 ab345 ± 23 d696 ± 53 bc222 ± 21 cd24 ± 2 ef84 ± 5 cd2.0 ± 0.1 a2.2 ± 0.1 de
Agricultural waterCompostNo plant910 ± 78 abc553 ± 20 ab504 ± 15 cd826 ± 26 bc229 ± 4 c47 ± 2 b245 ± 15 a2.0 ± 0.1 a2.1 ± 0.1 e
Agricultural waterCompostPlant593 ± 33 d448 ± 44 ab391 ± 61 d623 ± 29 c197 ± 10 cd27 ± 2 def118 ± 8 bcd1.7 ± 0.1 a3.3 ± 0.2 c
p-valueC0.0000.2070.3230.4020.0000.0040.0000.7680.000
P0.0100.0020.0000.2000.3220.0000.0000.2140.003
IW0.7400.7390.0000.0000.0000.0010.3480.9260.000
CxP0.2750.3090.8670.0020.0000.0000.0000.1560.000
CxIW0.0540.3360.4820.6270.0010.2490.1160.8980.000
IWxP0.0000.2280.0360.3650.6870.1080.0340.1870.188
CxIWxP0.1030.7710.3680.0820.0000.0000.3780.0850.012
Note: Mean values indicated by different superscript letters are significantly different from each other (p < 0.05) and mean value a > b > c value, n = 3 replicates. The mean values sharing common letters are not significantly different from each other. p-value; C—significance of compost; P—significance of plants; IW—significance of irrigation water type; and x shows the interaction between the factors.
Table 4. Differences in mean ± standard deviation (three-way ANOVA) and impact of compost treatment on organic matter and organic carbon percentage of soil (mean value of different soil layers for different types of irrigation water).
Irrigation WaterSoil
Treatment
PlantOrganic
Matter (%)
Increase OM from Raw Soil (%)Organic
Carbon (%)
Increase OC from Raw Soil (%)
Brackish waterNo compostNo plant15.1 ± 0.1 b−7.93.9 ± 0.1 b−15.5 *
Brackish waterCompostNo plant22.5 ± 0.6 a29.48.2 ± 0.3 a43.3
Brackish waterNo compostPlant15.5 ± 0.6 b−54.1 ± 0.1 b−12.1 *
Brackish waterCompostPlant22.9 ± 1.3 a32.18.4 ± 0.6 a47.3
Agricultural waterNo compostNo plant15.5 ± 0.8 b−5.0 *3.9 ± 0.3 b−15.6 *
Agricultural waterCompostNo plant22.3 ± 2.1 a28.57.6 ± 1.0 a32.7
Agricultural waterNo compostPlant15.8 ± 1.2 b−3.4 *4.1 ± 0.5 b−12.1 *
Agricultural waterCompostPlant22.2 ± 1.5 a27.77.4 ± 0.4 a30.2
p-valueC0.000 0.000
P0.592 0.682
CxP0.840 0.814
CxIW0.405 0.126
CxIWxP0.840 0.702
Note: * Negative value for percentage indicates the reduction. OM and OC of initial soil were calculated, and the increases in OM and OC percentage after 56 days of irrigation with different treatments were calculated using the initial soil content as a basic value separately for compost-treated soil (Soil/Compost (w/w after moisture correction = 9.7:0.3)) and no-compost-treated soil after moisture correction. Mean values indicated by different superscript letters are significantly different from each other (p < 0.05) and a—higher mean value and b—lower mean value, n = 3 replicates. p-value; C—significance of compost; P—significance of plants; IW—significance of irrigation water type; and x shows the interaction between the factors.
Table 5. Percentage reduction in NO3 leaching by compost with different types of irrigation water.
Irrigation WaterSoil TreatmentPlantTotal Mass of NO3 Irrigated (mg)Total Mass of NO3 Leached Water (mg)Total Mass of NO3 Leached from Soil (mg)Leaching Reduction by Compost
(%)
Impact of compost on NO3 leaching reduction for brackish water irrigation
Brackish waterNo compostNo plant3.6975971.0
Brackish waterCompostNo plant3.6581577.940.5
Brackish waterNo compostPlant3.6994990.0
Brackish waterCompostPlant3.6760756.723.6
Impact of compost on NO3 leaching reduction for agricultural water irrigation
Agricultural waterNo compostNo plant1.810781076.5
Agricultural waterCompostNo plant1.8906903.716.1
Agricultural waterNo compostPlant1.8804802.4
Agricultural waterCompostPlant1.8598595.925.7
Impact of plant on NO3 leaching reduction for brackish water irrigation
Brackish waterNo compostNo plant3.6975970.9
Brackish waterNo compostPlant3.6994990.0−2.0 *
Brackish waterCompostNo plant3.6581577.9
Brackish waterCompostPlant3.6760756.7−30.9 *
Impact of plant on NO3 leaching reduction for agricultural water irrigation
Agricultural waterNo compostNo plant1.810781076.6
Agricultural waterNo compostPlant1.8804802.525.5
Agricultural waterCompostNo plant1.8906903.8
Agricultural waterCompostPlant1.8598595.934.1
Note: * Negative value for percentage indicates the increased leaching.
Disclaimer/Publisher’s Note: The statements, opinions and data contained in all publications are solely those of the individual author(s) and contributor(s) and not of MDPI and/or the editor(s). MDPI and/or the editor(s) disclaim responsibility for any injury to people or property resulting from any ideas, methods, instructions or products referred to in the content.

