
Using a Public Preference Questionnaire and Eye Movement Heat Maps to Identify the Visual Quality of Rural Landscapes in Southwestern Guizhou, China
1
Academy of Arts & Design, Tsinghua University, Beijing 100084, China
2
Faculty of Architecture, Civil and Transportation Engineering, Beijing University of Technology, Beijing 100124, China
*
Author to whom correspondence should be addressed.
Land 2024, 13(5), 707; https://doi.org/10.3390/land13050707
Submission received: 10 April 2024
/
Revised: 7 May 2024
/
Accepted: 16 May 2024
/
Published: 17 May 2024
(This article belongs to the Special Issue Exploring Multisensory Landscapes: 2023 Visual Resource Stewardship Conference)
Abstract
:Rural landscapes serve as important platforms to determine the landscape characteristics (LCs) of rural areas, demonstrating the landscape characteristics specific to certain regions to the public. However, the development trend of urban and rural areas is continuous and impacts the characteristics of rural landscapes, which directly affects the public’s visual experience and landscape perception. In order to improve the characteristics of rural landscapes, this study evaluates and analyzes their visual quality based on public preferences and eye movement heat maps. The results show that most subjects have a high preference for horizontal, open-view rural landscapes with fields and landform features as the dominant landscape elements. This study also found that the combination of strip-like or planar settlement buildings with regional characteristics and landform features has an active impact on the visual quality of rural landscapes. These results show that rural landscapes characterized by scattered settlement buildings without significant regional characteristics, horizontally curved roads, bridges, and other human-made landscape elements, and mixed and disorderly vegetation have low landscape preference, which degrades their visual quality. These research results provide crucial suggestions for landscape managers to protect and renew rural landscape features.
1. Introduction
1.1. Research on Rural Landscape Characteristics
“Rural” as a regional concept refers to all areas except urbanized areas and primitive no-man’s land [1]. In 1992, the World Heritage Committee added cultural landscapes to the “Operational Guidelines”, allowing these landscapes to be included in the “World Heritage List”. The “Convention for the Protection of the World Cultural and Natural Heritage” became the first international legal instrument to recognize and protect cultural landscapes; these include three subcategories [2], and rural landscapes belong to the “organically evolved, continuously evolving landscape” subcategory. Rural landscapes, especially those transformed by humans, are typical cultural landscapes. They represent cultural heritage and “the joint work of humankind and nature” [3].
Rural areas are continuously evolving landscapes, and most rural areas are still undergoing continuous development and change [4]. Rural landscape elements represent the material basis of rural landscape composition and determine the contextual characteristics of the landscape environment [5]. Rural landscape features are characteristic patterns shaped by specific natural, architectural, and cultural elements, and have clear and consistent external physical representations [6]. Changes in the original characteristics of the rural natural environment and landscape, if not properly managed and controlled, will result in a decline in the visual quality of the rural landscape [7].
However, while rural landscape engineering projects improve production and living conditions because they all follow the same set of standards and lack ecological landscape construction theory and technical guidance [8], rural landscape construction ignores regional differences and suppresses local flavor and regional characteristics; in addition, over the past few decades, with the rapid development of society and urban expansion, the landscape in rural areas has been gradually changed and threatened by ecological damage and environmental pollution, and the service functions of rural ecosystems have been severely limited [9]. On the other hand, rural tourism has undergone unprecedented development, and the countryside has gradually become the most popular type of tourist destination among urban residents for leisure and recreation [10]. It is clear that rural landscapes are currently facing conflicting problems. They must not only resist the homogenization of landscape features and the destruction of ecological and visual environments, but also possess regional characteristics that make them attractive tourism destinations.
1.2. Literature Review
1.2.1. Landscape Characteristics and Their Evaluation
Landscape characteristics are defined as “unique, recognizable, and consistent patterns of elements in a landscape that make one landscape different from another, rather than better or worse” [11]. Different elements in a landscape are independent of each other, and their combination to form a unique scene give the landscape its so-called “character” [12]. Landscape elements are individual features in the landscape that can be spatially delineated [13]. They are combined with land cover and land use to form landscape patterns, which dictate the characteristics [14] and functions of the area [15].
Research on Landscape Character Assessment (LCA) began in the UK to improve the accuracy of the character description process (including the identification, classification, and zoning of features) and provide technical support for spatial decision-making [11]. Landscape Character Assessment is considered a tool for the dynamic management of regional characteristics [16]. Landscape changes considerably affect the visual aspects of a landscape [17], and landscape features, which can be used to quantitatively describe and identify scenes, can be used to further measure human preferences and improve visual quality [18]. Yuncai Wang et al. [5] reviewed the literature on the evaluation of rural landscape characteristics and summarized five types of characteristic evaluation indicators, namely landscape elements (climate, terrain, soil, vegetation, water bodies, farmland, buildings, etc.), morphology (landscape pattern index, etc.), and functional (land use, openness, convenience, comfort, etc.), visual (openness, uniqueness, orderliness, coordination, neatness, etc.), and socioeconomic indicators (population density, the proportion of the population engaged in agricultural production, the proportion of income from tourism in villages and towns, etc.). In their research on landscape perception and evaluation, Tveit et al. [19] identified nine key visual concepts (management, history, coherence, interference, visual scale, complexity, imageability, naturalness, and ephemerality) and proposed a four-level framework related to visual feature assessment: concepts > dimensions > landscape attributes > indicators. Their identification of visual features is consistent with ELC and has been put to use in several studies [20,21]. The evaluation and analysis of rural landscape characteristics in this study is based on the elements of rural landscapes and the visual quality of spatial scenes.
1.2.2. Landscape Perception and Visual Quality
In this study, we assess public landscape perception in various spatial scenes of rural landscapes through a multi-angle depiction of environmental perception. Landscape spatial perception can be divided into two categories: physical perception (vision, hearing, touch, smell) and psychological perception (preference, psychological feelings) [5]. In this study, physical perception is based on visual observation, with existing research showing that “more than 80% of all external things that humans obtain come from vision” [22], while psychological perception pertains to differences in the public’s rural landscape preferences based on psychological feelings.
Theories on the relationship between perception and preference include the biophilia hypothesis proposed by Wilson in 1984 [23], the Gestalt principle of visual perception proposed by Kovka et al. [24], and the prospect–refuge theory proposed by Appleton in 1975 [25]. However, the most widely used is the perception model proposed by Kaplan in 1989 [26]. It contains four information variables (mystery, complexity, readability, and coherence) [27] that are predictors of environmental preferences, among which complexity represents the content of the scene. The diversity, richness, and coherence of a landscape’s elements impact the public’s interest in the landscape. The unity and coherence of each landscape element in terms of shape, size, and texture determine the land use and nature of a region [26]. While there is an element of mystery in a scene with a hidden message [28], more information can be learned when there is consistency between conditions and by walking into the scene.
The visual quality of a landscape is determined by assessing the relationships between the impacts of landscape objects’ physical attributes on human perception [29], and the public’s visual landscape preferences are considered for the psychological evaluation of human–environment interactions [30]. At the same time, the visual quality of a landscape is considered synonymous with its esthetic value. These can be tested based on public evaluation or objective characteristics. Existing research has proven that assessing the public perception of landscapes is an important step towards sustainable management [31,32].
In recent decades, China’s rapid urbanization and industrialization have promoted tremendous changes in the structure of the rural agricultural industry, farming production methods, spatial organization, and rural living environments [33]. Rural development has entered a new stage of transformation and agricultural modernization. The adjustment of agricultural structure in rural areas will inevitably lead to the reconstruction of rural landscapes, economies, and societies. Landscape features and functions are undergoing a transformation from production spaces to consumption spaces. Urban fringe areas and villages with advantages in terms of land and environmental resources are continuing to use agriculture. To promote changes in rural landscapes, increase economic income, and improve the quality of human settlements to achieve optimal life satisfaction, it is necessary to adjust the structure of the agricultural sector and choose different planting types [34]. Over the past decade, China has been making efforts to improve rural life and the economy by reassessing land use [35]. In academia, research has focused on the impacts of rural land use and agricultural transformation on rural landscape patterns and functions, classification and evaluation, tourism and rural landscape planning, optimization and reconstruction, management, development models, and other aspects [36,37,38,39,40], as well as in-depth analyses of agricultural structural transformation’s impacts on rural landscapes and residents’ life satisfaction [41]. At the same time, the protection of traditional rural landscapes is not only affected by exogenous driving factors such as top-down policies and tourism, but also by endogenous driving factors originating from rural social and cultural backgrounds, including social and cultural vitality. There is a strong positive correlation with the integrity of traditional rural landscapes; compared with exogenous driving factors (top–down regulatory policies and tourism development), endogenous driving factors (i.e., the connection between people and the environment) have a greater impact on residents’ commitment to the protection of traditional rural landscapes, and cognition, intention, and behavior have a more pervasive and positive impact [42].
In China, since the 19th National Congress of the Communist Party of China, rural revitalization has become a contemporary focus. At the same time, cultural tourism plays an important role in rural revitalization. Rural landscapes are important rural tourism destinations and can reflect the unique characteristics of a region. They not only allow tourists to experience the local rural style or culture, but can also induce a “love affair” with the rural landscape. Therefore, the visual quality of rural landscapes has become an important factor affecting the visitor experience. However, among the studies on rural revitalization in China, only a few have focused on the impact of the visual dimension of rural landscapes on the visitor experience, resulting in a lack of understanding of its importance and the need for its protection among policymakers. Therefore, it is necessary to carry out visual evaluation research on rural landscapes. Through this type of evaluation, we can determine the “active” and “passive” areas of the landscape, and then propose relevant countermeasures to improve landscape quality and enhance landscape value or ecosystem services [43]. The purposes of this study are as follows:
- (1)
- The classification and type identification of rural landscape features in Southwest China;
- (2)
- Determining the public’s preference for visual quality based on the rural landscape characteristics of Southwest China;
- (3)
- Determining the landscape characteristics and population characteristics that affect rural landscape preferences in Southwest China.
2. Materials and Methods
2.1. Study Area
The study area is the countryside on the west side of the Gui’an metropolitan area in Southwest China, most of which is used for agriculture and forestry. This area has rich rural landscape features, such as plateau landforms, rural settlements, fields, vegetation, etc. (Figure 1).
2.2. Study Methods
The theory of landscape perception states that there is an interactive relationship between the public and the landscape. The public is the subject of perception, and the landscape is the perceived object; that is, the spatial physical characteristics and related attributes presented by the perceived object are related to the psychological feelings and preferences of the public. Among the results of this interaction, the physical characteristics of the space are one of the most important factors affecting the visual quality of the landscape. The unique plateau landforms in Southwest China and the rural settlements built on these natural landforms collectively demonstrate the style of the regional rural landscape. However, rural landscapes are composed of natural and artificial landscape elements, and some artificial elements have a certain negative impact on the public’s visual satisfaction [44]. Therefore, based on the landscape preference theory, this study proposes taking the public as the evaluation subject of landscape visual quality, and uses a Likert scale to determine the public’s preference for rural landscapes. The Likert scale is a widely used tool in social science research for measuring attitudes [45]. Upon establishing a bipolar scale, subjects were asked to select a value that expressed their assessment of the visual quality of a series of rural landscape pictures.
Eye movement heat map: People’s preferences for landscapes are closely related to their visual observation behavior [46]; based on this, our study used an eye-tracking device to record eye movement heat maps generated based on the visual behavior of the subjects. This allowed us to determine the areas of the pictures where the subjects’ visual attention was focused. This intuitively revealed the different landscape elements that the subjects were drawn to. We then characterized what types of landscape features and elements had a visual impact on the subjects. Specifically, pictures obtained on site were used as stimuli to awaken the subjects’ “landscape sense” through representative sample scenes [47,48] and to identify the public’s perception of the visual quality of rural landscape spatial characteristics as well as the landscape elements that they were drawn to.
2.3. The First Step
Material collection: During a high-speed train journey, a Go-Pro 9 camera was used to record images of the area, and a picture was extracted from the collected image material every 2 s to ensure that the extracted pictures covered all of the rural landscape features in the study area. A final number of 60 rural landscape feature pictures were extracted using this method.
Landscape feature identification in rural areas of southwestern Guizhou: This study classified the landscape characteristics of the extracted images based on landforms, land use types, vegetation, human-made structures, etc., and finally determined twelve categories. Each category contained five images of the same type, for a total of sixty images (See Appendix A). Upper-case LC was used as the code, and the numbers after the code represent each type of landform. LC-1 represents a “field landscape surrounded by mountains”. For the sake of our scientific research, there were at least 5 pictures of each type of landscape feature, numbered LC-1-1, LC-1-2, LC-1-3, … LC-1-5. Table 1 shows a picture of each type with its code and label.
2.4. The Second Step
Questionnaire and eye movement experiment: The present study first used a questionnaire scale to identify the rural landscape space, determined the visual quality status of the landscape space through a subjective method, and then used eye movements to identify the areas that the subjects were focused on. Research conducted by Lappi shows that data recorded by an eye tracker can tell us what subjects see, but not how they felt when watching [49]. Therefore, this study combined a questionnaire with the eye movement experiment, thereby enabling a more accurate and comprehensive visual quality assessment of rural landscape features.
The first stage of this study was the questionnaire survey, which consisted of two steps. Step A comprised basic information on the subjects who filled in the questionnaire, including their gender, age, education, type of work, location, frequency of going to the countryside, etc.; 8 items that are closely related to this study; and question items. Step B was a picture survey using the Likert scale, whereby subjects were invited to view and rate each rural landscape scene picture, with scores ranging from −2 to 2. Passive numbers represent passive rural landscape scenes, and active numbers represent active rural landscape scenes. The degrees of expression were as follows: −2—dislike the scene the most, −1—dislike the scene, 0—neutral, 1—like the scene, 2—favorite scene (Figure 2). Wartmann effectively verified that the Likert scale method can be used to determine the factors that affect visual quality as perceived by the public [50]. Mundher et al. [51] and Hangyu Gao et al. [52] used a Likert scale to divide landscape characteristics into two groups: active and passive.
The second stage of this study was the eye-tracking experiment, which involved subjects viewing rural landscape pictures. The subjects sat in front of the eye-tracking equipment monitor, with the distance between their eyes and the monitor screen kept at 70-80 cm, and visual calibration was performed. Afterwards, the subjects viewed the experimental samples for 5 s each. The pictures with the participants’ preferred landscape elements circled were collected and processed to obtain a hand-drawn heat map, which was used to analyze and identify the landscape features that affect the visual quality of the landscape.
This survey was carried out from September to October 2023, and a total of 246 valid questionnaires and pictures of participants’ landscape feature preferences were collected. SPSS 27.0 was used to analyze the questionnaire data. At the same time, Begaze software (Version 3.2) in combination with the eye tracker was used to generate a heat map of the subjects’ focus; in addition, the regional ranges of different landscape elements in each map were drawn separately in ArcMap 10.7 (Figure 3) to facilitate the analysis and statistics.
3. Results
3.1. Demographic Description
As shown in Table 2, 246 participants completed the questionnaire, including 131 women, accounting for 53.26%, and 115 men, accounting for 46.74%. Regarding age groups, most of the participants were under 26, and there were 125 people between 27 and 35 years old, accounting for 50.81%. In terms of education level, 202 respondents had received higher education, including 156 undergraduates, accounting for 63.42%, and 46 graduate students and above, accounting for 18.70%. A total of 64.23% (n = 158) of the respondents lived in cities, and there was one respondent who had lived there for less than a year; however, only forty-three respondents had been to rural areas in southwestern Guizhou, accounting for 17.48%, and only 6.3% (n = 15) had never been to rural areas. To summarize, the respondents were mostly female, highly educated, and non-local individuals living in cities. They had a certain understanding of and familiarity with the countryside, but had limited knowledge of the study area.
3.2. Photo Survey
The landscape pictures selected in this study were measured using a five-point Likert scale ranging from -2 to 2. Based on this standard, the average value of landscape visual quality was obtained after the 60 pictures of the questionnaire were ranked according to their scores (Table 3). Among them, the number of pictures representing active landscape visual quality (N = 29) was slightly lower than the number of pictures representing passive landscape visual quality (N = 31). The absolute average values of active and passive landscape visual quality pictures are not greater than 1. The highest score for active landscape visual quality pictures is 0.87, and the lowest score for passive landscape visual quality pictures is -0.64. These results show that the respondents’ overall visual perception of the rural landscape is within an acceptable range, indicating that people are generally satisfied with the overall rural landscape. Subsequently, according to the subjects’ ratings of the rural landscape pictures (Table A1), the pictures with the top six active and passive landscape visual quality scores, namely LC-6-3, LC-1-2, LC-9-4, LC-3-2, LC-3-3, and LC-3-5 (active landscape visual quality pictures) and LC-7-2, LC-8-4, LC-4-3, LC-4-4, and LC-4-5 (passive landscape visual quality pictures), were selected and an overall analysis of landscape visual quality trends was conducted.
It can be seen from Table A1 that in the active landscape visual quality group, the six pictures selected come from four groups; three are from group 3 (LC-3-2 = 0.68, LC-3-3 = 0.66, LC-3-5 = 0.64), showing the landscape characteristics of “plateau landforms and roadside strip settlement buildings”, and the other three are from group 6, group 1, and group 9. The common feature of these three groups is that natural landform features form the background of landscape space and occupy the main part of the picture. At the same time, the proportion of the landscape spatial composition is coordinated. However, in the passive landscape visual quality group, the six selected pictures come from four groups, with the “plateau landform settlements and curved rural roads” group having the worst visual quality; however, most of the photos have active landscape visual quality. Similar landscape features in the quality group, especially group 4, lack effective landscape management, resulting in the foreground vegetation elements being too messy and disordered. At the same time, there is a lack of effective interaction between the dominant landscape elements, represented by mountains and settlement buildings, in the scene. The transition and connection cause a fragmentation in visual perception, resulting in a significant reduction in the subjects’ preference for landscapes.
Table A2 shows the differences in average visual quality between groups. It is clear that the pictures with fields as the main landscape features are all classified in the active landscape visual quality group, except LC-12-2. On the contrary, mountains, as natural landscape elements that express regional characteristics, and different landscape features formed through a combination of different elements, have opposite visual qualities; specifically, mountains as a landscape background, when combined with water elements, show active visual quality. It can be seen that water elements are of great significance in improving the visual appeal of rural landscapes [52], and mountains alone or as the dominant landscape elements combined with artificial landscape elements, such as settlement buildings, roads, bridges, etc., were used in the assessment of passive landscape visual quality.
3.3. The Impact of Heat Maps and Landscape Features on Visual Quality Assessment
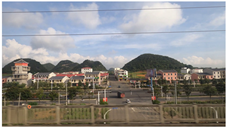
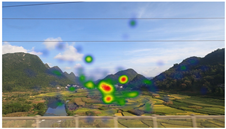
Heat maps intuitively present the areas that subjects pay attention to and the duration and intensity of focus on these areas. Red areas represent a greater preference for specific or dominant landscape elements in the scene. The subjects’ preferences for landscape elements are accurately reflected in the pictures in Table A3 and the heat maps obtained after recording the subjects’ attention; Table A3 includes the active and passive visual quality of the pictures provided in Table A1. In the active landscape visual quality group, the red areas of the heat maps are concentrated on fields, landforms, and settlement buildings, indicating the subjects’ perception of the visual characteristics of these three types of landscape elements. They show a high preference for landscapes, although some plants are also in the red area, and the intensity of attention is slightly lower than that paid to fields, landforms, and settlement buildings. At the same time, from the perspective of landscape spatial composition, active visual quality pictures show open-space scenes. The outlines of different types of landscape elements in these spaces are clear, the number of landscape elements is moderate, and the area of each element in the space is moderate; this highlights that the dominant elements and those with distinctive characteristics in the landscape space make the visual experience of the space holistic and provide a sense of coordination.
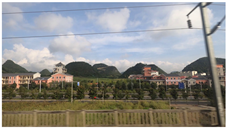
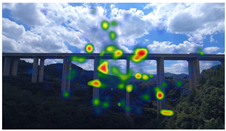
In the passive landscape visual quality group, except for group 12 (field landscape), all groups lack field landscapes as the dominant elements in the space. The areas that subjects pay attention to are relatively scattered, but the landscape elements they pay attention to are more natural elements, such as the mountains and the sky. There are relatively few settlement buildings. On the one hand, the proportion of settlement building areas in these images is small, and on the other, humans have an innate preference for natural elements [53]. This is similar to the results of the active group. However, due to the influence of spatial composition in images in group 8, the bridge connecting the mountains becomes a focal landscape element that attracts visual attention because it occupies an important position in the space and spans the left and right sides. In group 12, although the dominant elements in the space are landforms and fields, there is a certain number of small features and many types of landscape elements within the field landscape which distract the subjects’ visual focus; at the same time, different types of landscape elements detract from the overall sense and order of the landscape composition, making the landscape space cluttered and disorderly. From the perspective of landscape spatial composition, passive and active visual quality pictures both represent open-space scenes; thus, it is clear that the complexity and recognizability of spatial scenes will affect the visual preferences of viewers. To a certain extent, for rural landscapes, the openness of visual space is less important than the sense of order and integrity.
3.4. Related Factors That Affect Visual Quality
Based on the aforementioned mean grouping, the reliability of the active and passive visual quality of the two groups was examined separately. The results of the reliability test are more than 0.7, within the valid range of values (Table 4); the normality of the survey sample was also tested with regard to gender. Then, we determined the rationality of the analysis and research. According to the results shown in Table 5, the Kolmogorov–Smirnov significance values of the active and passive groups are both greater than 0.05 (p > 0.05), which indicates that the null hypothesis can be accepted. These results meet the requirements of normal distribution.
A t-test and one-way ANOVA were used for analysis. The t-test, as shown in Table 6 and Table 7, shows that the two factors that affect active and passive visual quality are whether the subject has visited the study area before and whether the subject is a local resident. However, these effects are limited to certain groups of images of specific landscape features.
Subsequently, single-factor analysis was conducted on the data. Limited by the number of subjects, the 46–55 and above-55 age groups were combined to form an above-46 age group. One-way ANOVA was used to study the effects of the four different age groups on A, C, F, I, and P0S, as well as D, G, H, L and NEG. As shown in Table 8, participants of different ages show significance (p > 0.05) for I and H, which means that the four participant age groups show consistency in their assessment of both groups I and H and there is no difference between their perception of these groups; therefore, no post hoc test analysis was required. The other items affected by the four participant age groups are A (field landscape surrounded by mountains), C (plateau landform and roadside strip settlements), F (fields and landform landscape), P0S, D (plateau landforms and scattered settlement buildings), G (plateau landform settlements and winding rural roads), L (field landscape), and NEG. A total of eight items showed significance (p < 0.05), which means that the four groups of participants of different ages show significant differences in how they perceive A, C, F, POS, D, G, L, and NEG, which requires specific post hoc analysis.
As can be seen from Table 9, the above variance analysis found that participants of different ages showed differences in their perception of eight sample groups: A, C, F, ACT, D, G, L, and PAS. Specifically, the multiple comparison (Bonferroni) correction method was performed.
From the perspective of the active picture group, picture group A shows a significance level of 0.05 (F = 3.173, p = 0.025), and an obvious difference is reflected in “Age group 3 > Age group 4”. Regarding the significance level of picture groups C and F, the values are 0.01 (F = 4.178, p = 0.007) and 0.05 (F = 3.173, p = 0.025). Significant differences are reflected in “Age group 2 > Age group 4”.
From the perspective of the passive picture group, picture group D shows significance at the 0.05 level (F = 3.448, p = 0.017), and an obvious difference is reflected in “Age group 2 > Age group 3”. Picture group G shows significance at the 0.05 level (F =3.049, p = 0.029), and a significant difference is reflected in “Age 2 Group > Age 4 Group”; and picture group L shows a significance level of 0.01 (F = 4.619, p = 0.004), with a significant difference reflected in “Age group 2 > Age group 3; Age group 2 > Age group 4”.
From the above data analysis, it can be seen that among the four age groups, age groups 2 and 3 have the strongest characteristics, and age group 4 is more significant than age group 1. In the active picture group, the C, F, and ACT picture groups show obvious characteristics, with age group 2 being more significant than age group 4. In the passive picture group, the D, L, and PAS picture groups show obvious characteristics, with age being group 2 more significant than age group 3. It can be seen that perception among age group 3 is stronger than among age groups 4 and 1 for the passive picture group (Figure 4a–d), and overall, subjects in age groups 2 and 3 are more likely to be attracted to landscape features. In both the active and passive picture groups, age group 2 is stable in terms of perception, while age groups 3 and 4 show significant differences (Figure 4e–h). In the active picture group, age group 4 is considerably more significant than age group 3, while in the passive picture group, age group 3 is considerably more significant than age group 4.
4. Discussion
4.1. The Impact of Landscape Elements on the Visual Quality of Rural Landscapes
This study demonstrates that landscape elements play an important role in influencing the public perception of visual quality. Specifically, the active visual quality identified by the public, primarily characterized by fields, transforms into passive visual quality, primarily characterized by mixed vegetation or artificial structures. In the active landscape visual quality group, field landscape elements are important influencing factors of visual quality. Fields represent a specific form of agricultural landscape; they not only provide economic value, but also provide various ecosystem services (ESs) to society, as well as other substantial benefits [54]. Secondly, cultural ecosystem services that provide recreational, esthetic, and spiritual benefits can also be established in relation to these landscape elements [55].
In the passive landscape visual quality group, vegetation and landscape elements are the dominant elements of the landscape scene; they are not popular in the rural landscape of the study area and provide an unpleasant visual experience [44]. However, the reason vegetation was perceived to impart passive visual quality in this study was due to low vegetation density and its disordered distribution in the near field. At the same time, there are few types of human-made landscape elements, and their distribution is scattered. They lack unity in form and color as well as regional characteristics. The dominance of human-made landscape elements in the spatial scene detracts from the quality of the space and directly affects the viewer’s senses, which, in turn, leads to feelings of disgust and reduces their preference for such landscapes.
Compared to human-made landscapes, natural landscapes generated a higher consensus among respondents, possibly because humans have lived in natural environments for most of their evolutionary history. The human perception of the natural environment is very similar. On the other hand, human-made landscapes are easily influenced by culture; individuals from different cultural groups have different perceptions of human-made landscapes, thus leading to considerable differences in esthetic judgments [56].
4.2. The Impact of Visual Characteristics on the Visual Quality of Rural Landscapes
This study utilized nine key visual characteristics based on the landscape perception theory proposed by Tevit and selected some of these key characteristics to analyze the visual quality of rural landscapes.
In the active visual quality group, the landscape elements presented in the spatial scene have orderly characteristics, creating a comfortable visual experience for the public. From the perspective of spatial composition and landscape element composition, the spatial composition is balanced and the landscape elements in the space form a rhythmic repetition and are clear and organized, achieving visual coherence, unity, and complexity. Landscapes with visual images perceived in this way are preferred over those that appear disorderly [57]. At the same time, existing research shows that individual preferences are directly related to the openness of the space. Respondents prefer landscape scenes with high openness and a high sense of order [58].
However, in the passive visual quality group, the spatial scene presents diverse, intricately intertwined, and disorderly landscape elements, such as a disorganized combination of vegetation and human-made landscape elements, forming a relatively low degree of visual openness and thereby causing the public to have a passive visual experience. The visual openness of the five passive visual quality groups is worse than that of the active visual quality group. The public preference for such landscapes is also reduced due to their generally lower level of openness. At the same time, this diversity, complexity, and disorder in landscape elements conform with the complexity of visual characteristics [21]. However, Kaplan and other scholars conducted further analyses and research and divided complexity into ordered and disordered categories [27]. Ordered complexity creates visually rich variety in a scene, while disordered complexity is perceived as chaos [59]. Therefore, the visual quality of landscapes dominated by a single type of vegetation or patches of vegetation is better than other landscapes in the passive visual quality group (LC-11). Interference with the visual features of the landscape is another contributing element to passive visual quality. Interference is usually represented by elements in the landscape that lack contextual suitability and coherence [60]. In the passive visual quality group, major interference factors come from the overall spatial environment being uncoordinated, are abrupt, and indirectly become visual pollutants in artificial landscape elements, such as vegetation, single objects, construction, etc. Therefore, on the one hand, the existence of these elements will distract the public’s visual focus, and on the other hand, it will disrupt the coherence of the spatial continuity narrative, thereby producing an unpleasant visual experience.
4.3. The Impact of Subjects’ Demographic Characteristics on Preferences
This study shows that, to a certain extent, there are differences in preferences for landscape characteristics due to the influence of the demographics of the population, such as whether they are residents, whether they have visited the study area before, and the age of the subjects; these influencing factors are reflected in both the active and passive visual quality groups. Specifically, residents of the southwest Guizhou region and those who have visited this area can be regarded as familiar with the environment. Existing research results show that familiarity is important in visual landscape evaluation, primarily relating to the existing place and the participant’s current place of residence [61]. The relationship between people and places has been identified by relevant research as an important factor affecting visual landscape preference [62], among which familiarity with landscape types is a key element [63]. Regarding age, existing studies have found that landscape preference changes with age [64,65], and this conclusion was verified in this study. The difference is that existing research shows that preference differences affecting landscape characteristics mainly manifest between generations, such as between children and older people [66]. In the current research results, the analyzed preference differences have a certain degree of consistency with existing research results, but new situations have also emerged, such as different age groups having opposite feelings about the same types of landscape features. However, there is a lack of evidence to verify the reasons for the differences between the two age groups in terms of active versus passive picture quality.
5. Conclusions
This study uses a public preference survey combined with an eye movement heat map method to evaluate the visual quality of rural landscapes in southwestern Guizhou, China. This study shows that in the current reality of rapid urban and rural development, protecting the unique features of rural areas is of great value and significance. Research shows that topography, landforms, and field landscape elements play an important role in the rural landscape characteristics of southwestern Guizhou, China, contributing significantly to improving the overall visual quality of the region. Although the public shows an aversion to vegetation in terms of visual quality, vegetation elements play an irreplaceable role in rural landscapes. There are two reasons for this aversion to vegetation. On the one hand, participants dislike disordered vegetation and a lack of proper planning. On the other hand, cultural elements in rural landscapes have a significant passive impact on the visual experience of the landscape. It is crucial to reasonably and skillfully integrate artificial landscape elements into rural environments to supplement and improve these environments instead of damaging them.
Author Contributions
Methodology, X.Y.; Software, X.Y.; Resources, Y.S.; Supervision, Y.S.; Data curation, X.Y.; Writing—original draft, X.Y. All authors have read and agreed to the published version of the manuscript.
Funding
This research received no external funding.
Data Availability Statement
The original contributions presented in the study are included in the article, further inquiries can be directed to the corresponding author.
Acknowledgments
The authors are indebted to the reviewers and editors for their valuable comments and suggestions.
Conflicts of Interest
The authors declare no conflicts of interest.
Appendix A
Figure A1.
Groups of landscape characters. Note: n-1, n-2, n-3, n-4, n-5 (n = 1, 2, 3,…,12) represent different sampled images of the same landscape type.
Figure A1.
Groups of landscape characters. Note: n-1, n-2, n-3, n-4, n-5 (n = 1, 2, 3,…,12) represent different sampled images of the same landscape type.


Table A1.
The six pictures with the highest scores in the active group and the six pictures with the lowest scores in the passive group.
Table A1.
The six pictures with the highest scores in the active group and the six pictures with the lowest scores in the passive group.
| Photos | ||
|---|---|---|
| Active Landscape Visual Quality |  |  |
| Mean = 0.87 (LC-6-3) | Mean = 0.83 (LC-1-2) | |
 |  | |
| Mean = 0.79 (LC-9-4) | Mean = 0.68 (LC-3-2) | |
 |  | |
| Mean = 0.66 (LC-3-3) | Mean = 0.64 (LC-3-5) | |
| Passive Landscape Visual Quality |  |  |
| Mean = −0.64 (LC-7-2) | Mean = −0.57 (LC-8-4) | |
 |  | |
| Mean = −0.48 (LC-4-3) | Mean = −0.39 (LC-4-4) | |
 |  | |
| Mean = −0.33 (LC-4-5) | Mean = −0.28 (LC-12-2) | |
Table A2.
Pictures in each group sorted by mean score.
| Group | Landscape Character | Code | Individual Mean Value | Average Value | |
|---|---|---|---|---|---|
| Active Landscape Visual Quality | 6 | Field and landform landscape | LC-6-1 | 0.57 | 0.606 |
| LC-6-2 | 0.61 | ||||
| LC-6-3 | 0.87 | ||||
| LC-6-4 | 0.45 | ||||
| LC-6-5 | 0.53 | ||||
| 1 | Field landscape surrounded by mountains | LC-1-1 | 0.18 | 0.514 | |
| LC-1-2 | 0.83 | ||||
| LC-1-3 | 0.673 | ||||
| LC-1-4 | 0.42 | ||||
| LC-1-5 | 0.51 | ||||
| 9 | Plateau landform natural landscape | LC-9-1 | 0.36 | 0.486 | |
| LC-9-2 | 0.25 | ||||
| LC-9-3 | 0.48 | ||||
| LC-9-4 | 0.79 | ||||
| LC-9-5 | 0.55 | ||||
| 3 | Plateau landforms and roadside strip settlement buildings | LC-3-1 | 0.22 | 0.438 | |
| LC-3-2 | 0.68 | ||||
| LC-3-3 | 0.66 | ||||
| LC-3-4 | −0.01 | ||||
| LC-3-5 | 0.64 | ||||
| 2 | Natural landforms, fields, and settlement landscapes | LC-2-1 | 0.18 | 0.26 | |
| LC-2-2 | 0.24 | ||||
| LC-2-3 | 0.33 | ||||
| LC-2-4 | 0.15 | ||||
| LC-2-5 | 0.38 | ||||
| 5 | Settlement and landscape | LC-5-1 | 0.08 | 0.086 | |
| LC-5-2 | 0.12 | ||||
| LC-5-3 | −0.01 | ||||
| LC-5-4 | −0.02 | ||||
| LC-5-5 | 0.26 | ||||
| Moderate Visual Quality (M = 0) | |||||
| Passive Landscape Visual Quality | 7 | Plateau landform settlements and winding rural roads | LC-7-1 | −0.26 | −0.272 |
| LC-7-2 | −0.64 | ||||
| LC-7-3 | −0.18 | ||||
| LC-7-4 | −0.03 | ||||
| LC-7-5 | −0.25 | ||||
| 8 | Viaduct connecting mountains | LC-8-1 | −0.21 | −0.244 | |
| LC-8-2 | −0.15 | ||||
| LC-8-3 | −0.11 | ||||
| LC-8-4 | −0.57 | ||||
| LC-8-5 | −0.18 | ||||
| 4 | Plateau landforms and scattered settlement buildings | LC-4-1 | −0.05 | −0.242 | |
| LC-4-2 | 0.04 | ||||
| LC-4-3 | −0.48 | ||||
| LC-4-4 | −0.39 | ||||
| LC-4-5 | −0.33 | ||||
| 12 | Field landscape | LC-12-1 | −0.11 | −0.15 | |
| LC-12-2 | −0.28 | ||||
| LC-12-3 | −0.18 | ||||
| LC-12-4 | −0.06 | ||||
| LC-12-5 | −0.12 | ||||
| 10 | Field and settlement landscape | LC-10-1 | 0.01 | −0.05 | |
| LC-10-2 | −0.08 | ||||
| LC-10-3 | −0.02 | ||||
| LC-10-4 | −0.05 | ||||
| LC-10-5 | −0.11 | ||||
| 11 | Settlement and plant landscape | LC-11-1 | −0.01 | −0.028 | |
| LC-11-2 | −0.04 | ||||
| LC-11-3 | −0.02 | ||||
| LC-11-4 | −0.03 | ||||
| LC-11-5 | −0.04 | ||||
Table A3.
Heat map analysis to identify key features and elements of visual quality.
| Photos Collected | Eye Tracking Analysis (Heat Map) | |
|---|---|---|
| Active Landscape Visual Quality |  |  |
| 1. Group (Mean), Landscape Character | 6 (LC-6-3, Mean = 0.87), Fields and natural landscapes | |
 |  | |
| 2. Group (Mean), Landscape Character | 1 (LC-1-2, Mean = 0.83), Field landscape surrounded by mountains | |
 |  | |
| 3. Group (Mean), Landscape Character | 9 (LC-9-4, Mean = 0.79), Plateau landform natural landscape | |
 |  | |
| 4. Group (Mean), Landscape Character | 3 (LC-3-2, Mean = 0.68), Plateau landforms and roadside strip settlement buildings | |
 |  | |
| 5. Group (Mean), Landscape Character | 3 (LC-3-3, Mean = 0.66), Plateau landforms and roadside strip settlement buildings | |
 |  | |
| 6. Group (Mean), Landscape Character | 3 (LC-3-5, Mean = 0.64), Plateau landforms and roadside strip settlement buildings | |
| Moderate Visual Quality (M = 0) | ||
| Passive Landscape Visual Quality |  |  |
| 1. Group (Mean), Landscape Character | 7 (LC-7-2, Mean = −0.64), Plateau landform settlements and winding rural roads | |
 |  | |
| 2. Group (Mean), Landscape Character | 8 (LC-8-4, Mean = −0.57), Viaduct connecting mountains | |
 |  | |
| 3. Group (Mean), Landscape Character | 4 (LC-4-3, Mean = −0.48), Plateau landforms and scattered settlement buildings | |
 |  | |
| 4. Group (Mean), Landscape Character | 4 (LC-4-4, Mean = −0.39), Plateau landforms and scattered settlement buildings | |
 |  | |
| 5. Group (Mean), Landscape Character | 4 (LC-4-5, Mean = −0.33), Plateau landforms and scattered settlement buildings | |
 |  | |
| 6. Group (Mean), Landscape Character | 12 (LC-12-2, Mean = −0.28), Field landscape | |
Note: Eye Tracking Analysis (Heat map) is a record that characterizes the visual behavior of participants when viewing images.
References
- Lu, B.; Chen, W. A preliminary study on rural landscape gardens in China. Urban Plan. Foumm. 2000, 6, 66–68, 80. [Google Scholar]
- Brumann, C.; Gfeller, A.É. Cultural landscapes and the UNESCO World Heritage List: Perpetuating European dominance. Int. J. Herit. Stud. 2022, 28, 147–162. [Google Scholar] [CrossRef]
- UNESCO. Operational Guidelines for the Implementation of the World Heritage Convention; WHC 08/1; UNESCO: Paris, France, 2008. [Google Scholar]
- Jane, L.; Han, F. Rural landscapes. Chin. Landsc. Archit. 2012, 28, 19–21. [Google Scholar]
- Wang, Y.; Chen, Z.; Cheng, Y. The Representation System of Rural Landscape Character and Personality in the New Era. Landsc. Archit. 2021, 28, 10713. [Google Scholar]
- Zakariya, K.; Ibrahim, P.H.; Abdul Wahab, N.A. Conceptual Framework of Rural Landscape Character Assessment to Guide Tourism Development in Rural Areas. J. Constr. Dev. Ctries. 2019, 24, 85–99. [Google Scholar] [CrossRef]
- Arriaza, M.; Cañas-Ortega, J.; Cañas-Madueño, J.; Ruiz-Aviles, P. Assessing the visual quality of rural landscapes. Landsc. Urban Plan. 2004, 69, 115–125. [Google Scholar] [CrossRef]
- Yun, W.-J.; Yu, Z.-R. Ecological landscaping strategy of rural land consolidation in China. Trans. Chin. Soc. Agric. Eng. 2011, 27, 1–6. [Google Scholar]
- Gu, X.-K.; Chen, B.-M. Method and application of landscape ecological evaluation of land consolidation: A case of land consolidation project in Jianghan Plain. China Land Sci. 2008, 22, 58–62. [Google Scholar]
- Chen, Z.; Xu, F. Driving factors and mechanism of rural tourist destination development: Evidence from Changsha city. Econ. Geogr. 2019, 39, 231–239. [Google Scholar]
- Swanwick, C. Landscape character assessment. In Guidance for England and Scotland; Countryside Agency, Scottish Natural Heritage: Edinburgh, UK, 2002. [Google Scholar]
- Mundher, R.; Bakar, S.A.; Al-Helli, M.; Gao, H.; Al-Sharaa, A.; Yusof, M.T.; Maulan, S.; Aziz, A. Visual Aesthetic Quality Assessment of Urban Forests: A Conceptual Framework. Urban Sci. 2022, 6, 79. [Google Scholar] [CrossRef]
- Golobič, M.; Penko Seidl, N.; Bevk, T.; Pipan, T.; Krošelj, M.; Kostanjšek, B.; Ažman, T.; Hudoklin, J.; Simič, S.; Gritli, L. Redevelopment and Digitisation of the Regional Distribution of Landscape Types and Outstanding Landscapes in Slovenia: First Interim Report; Biotechnical Faculty, Department of Landscape Architecture: Ljubljana, Slovenia, 2022. [Google Scholar]
- Marušič, I.; Ogrin, D.; Jančič, M. Regionalna Razdelitev Krajinskih Tipov v Sloveniji. Metodološke Osnove; Ministry of Environment and Spatial Planning, RSS Office for Spatial Planning; Department of Landscape Architecture, Biotechnical Faculty, University of Ljubljana: Ljubljana, Slovenia, 1998; p. 120. [Google Scholar]
- Kuan, A. The modern social conception of Slovene space. Geogr. Zb. 1997, 37, 106–167. [Google Scholar]
- Wascher, D.M. European Landscape Character Areas—Typologies, Cartography and Indicators for the Assessment of Sustainable Landscapes. In Landscape Europe; Final Project Report as Deliverable from the EU’s Accompanying Measure Project European Landscape Character Assessment Initiative (ELCAI), Funded under the 5th Framework Programme on Energy, Environment and Sustainable Development (4.2.2); Wageningen Environmental Research: Wageningen, The Netherlands, 2005; pp. 36–40. [Google Scholar]
- Gobster, P.H.; Nassauer, J.I.; Daniel, T.C.; Fry, G. The shared landscape: What does aesthetics have to do with ecology? Landsc. Ecol. 2007, 22, 959–972. [Google Scholar] [CrossRef]
- Mundher, R.; Bakar, S.A.; Maulan, S.; Yusof, M.T.; Al-Sharaa, A.; Aziz, A.; Gao, H. Aesthetic Quality Assessment of Landscapes as a Model for Urban Forest Areas: A Systematic Literature Review. Forests 2022, 13, 991. [Google Scholar] [CrossRef]
- Tveit, M.; Ode, Å.; Fry, G. Key concepts in a framework for analysing visual landscape character. Landsc. Res. 2006, 31, 229–255. [Google Scholar] [CrossRef]
- Martín, B.; Ortega, E.; Otero, I.; Arce, R. Landscape character assessment with GIS using map-based indicators and photographs in the relationship between landscape and roads. J. Environ. Manag. 2016, 180, 324–334. [Google Scholar] [CrossRef] [PubMed]
- Fry, G.; Tveit, M.S.; Ode, Å.; Velarde, M.D. The ecology of visual landscapes: Exploring the conceptual common ground of visual and ecological landscape indicators. Ecol. Indic. 2009, 9, 933–947. [Google Scholar] [CrossRef]
- Ozcelik, E.; Karakus, T.; Kursun, E.; Cagiltay, K. An eye-tracking study of how color coding affects multimedia learning. Comput. Educ. 2009, 53, 445–453. [Google Scholar] [CrossRef]
- Wilson, E.O. Biophilia; Harvard University Press: Cambridge, MA, USA, 1984. [Google Scholar]
- Kaymaz, I.C. Landscape perception. In Landscape Planning; Ozyavuz, M., Ed.; IntechOpen: London, UK, 2012; pp. 251–276. [Google Scholar]
- Appleton, J. Landscape evaluation: The theoretical vacuum. Trans. Inst. Br. Geogr. 1975, 66, 120–123. [Google Scholar] [CrossRef]
- Kaplan, R.; Kaplan, S. The Experience of Nature: A Psychological Perspective; Cambridge University Press: New York, NY, USA, 1989. [Google Scholar]
- Kaplan, R.; Kaplan, S.; Ryan, R.L. With People in Mind: Design and Management of Everyday Nature; Island: Washington, DC, USA, 1998. [Google Scholar]
- Van den Berg, A.E.; Jorgensen, A.; Wilson, E.R. Evaluating restoration in urban green spaces: Does setting type make a difference? Landsc. Urban Plan. 2014, 127, 173–181. [Google Scholar] [CrossRef]
- Daniel, T.C. Whither scenic beauty? Visual landscape quality assessment in the 21st century. Landsc. Urban Plan. 2001, 54, 267–281. [Google Scholar] [CrossRef]
- Pals, R.; Steg, L.; Siero, F.W.; van der Zee, K.I. Development of the PRCQ: A measure of perceived restorative characteristics of zoo attractions. J. Environ. Psychol. 2009, 29, 441–449. [Google Scholar] [CrossRef]
- Lee, K.; Son, Y. Exploring landscape perceptions of Bukhansan National Park according to the degree of visitors’ experience. Sustainability 2017, 9, 1306. [Google Scholar] [CrossRef]
- Chiesura, A. The role of urban parks for the sustainable city. Landsc. Urban Plan. 2004, 68, 129–138. [Google Scholar] [CrossRef]
- Liu, Y.S.; Li, Y.H. Revitalize the world’s countryside. Nature 2017, 548, 275–277. [Google Scholar] [CrossRef] [PubMed]
- Wang, X.C.; Dong, X.B.; Liu, H.M.; Wei, H.; Fan, W.; Lu, N.; Xu, Z.; Ren, J.; Xing, K. Linking land use change, ecosystem services and human well-being: A case study of the Manas River Basin of Xinjiang, China. Ecosyst. Serv. 2017, 27, 113–123. [Google Scholar] [CrossRef]
- Liu, Y.; Fang, F.; Li, Y. Key issues of land use in China and implications for policy making. Land Use Policy 2014, 40, 6–12. [Google Scholar] [CrossRef]
- Vaca, R.A.; Rodiles-Hernández, R.; Ochoa-Gaona, S.; Taylor-Aquino, N.E.; Obregon-Viloria, R.; Diaz-Garcia, D.A.; Navarrete-Gutierrez, D.A. Evaluating and supporting conservation action in agricultural landscapes of the Usumacinta River Basin. J. Environ. Manag. 2019, 230, 392–404. [Google Scholar] [CrossRef] [PubMed]
- Liu, B.; Wang, Y. Theoretical base and evaluating indicator system of rural landscape assessment in China. Chin. Landsc. Archit. 2002, 18, 76–79. [Google Scholar]
- Xie, H.; Liu, L.; Li, L. Preliminary study on the correlative problem of the rural landscape planning. Chin. Landsc. Archit. 2003, 19, 39–41. [Google Scholar]
- Arnaiz, S.C.; Schmitz, M.F.; Herrero, J.C.; Gutiérrez-Angonese, J.F.D.C.; Pineda, F.D.; Montes, C. Identifying socio-ecological networks in rural-urban gradients: Diagnosis of a changing cultural landscape. Sci. Total Environ. 2018, 612, 625–635. [Google Scholar] [CrossRef]
- Kirchner, M.; Schmidt, J.; Kindermann, G.; Kulmer, V.; Mitter, H.; Prettenthaler, F.; Rüdisser, J.; Schauppenlehner, T.; Schönhart, M.; Strauss, F.; et al. Ecosystem services and economic development in Austrian agricultural landscapes: The impact of policy and climate change scenarios on tradeoffs and synergies. Ecol. Econ. 2015, 109, 161–174. [Google Scholar] [CrossRef]
- Yang, C.; Tan, S.; Yue, H.; Hu, Y. Influence of Agricultural Structure Transformation on Village Landscape and Residents Satisfaction: A case Study of Jiuling Village in Chongqing. South Archit. 2022, 3, 88–97. [Google Scholar]
- Jia, Z.; Gao, M.; Xu, S.; Lyu, Y.; Feng, J.; Zhou, Z.; Yu, T.; Wu, W. Sociocultural vitality versus regulation policy and tourism development in preservation of traditional rural landscape: A case from Guizhou, China. Int. J. Sustain. Dev. World Ecol. 2021, 28, 179–192. [Google Scholar] [CrossRef]
- Chen, Y.; Wang, X.-D.; Wang, P.-F. Analysis and thought on the rural landscape research in China. Chin. Agric. Sci. Bull. 2011, 27, 297–300. [Google Scholar]
- Schroeder, H.W.; Daniel, T. Preferred features of urban parks and forests. J. Arboric. 1982, 8, 317–322. [Google Scholar] [CrossRef]
- Likert, R. A Technique for the Measurement of Attitudes. Arch. Psychol. 1932, 22, 55. [Google Scholar]
- Zhou, X.; Cen, Q.; Qiu, H. Effects of urban waterfront park landscape elements on visual behavior and public preference: Evidence from eye-tracking experiments. Urban For. Urban Green. 2023, 82, 127889. [Google Scholar] [CrossRef]
- Bishop, I.D.; Rohrmann, B. Subjective responses to simulated and real environments: A comparison. Landsc. Urban Plan. 2003, 65, 261–277. [Google Scholar] [CrossRef]
- Fujisaki, I.; Mohammadi-Aragh, M.J.; Evans, D.L.; Moorhead, R.J.; Irby, D.W.; Roberts, S.D.; Grado, S.C.; Schultz, E.B. Comparing forest assessment based on computer visualization versus videography. Landsc. Urban Plan. 2007, 81, 146–154. [Google Scholar] [CrossRef]
- Lappi, O. Eye Tracking in the Wild: The Good, the Bad and the Ugly. J. Eye Mov. Res. 2015, 8, 1. [Google Scholar] [CrossRef]
- Wartmann, F.M.; Frick, J.; Kienast, F.; Hunziker, M. Factors influencing visual landscape quality perceived by the public. Results from a national survey. Landsc. Urban Plan. 2021, 208, 104024. [Google Scholar] [CrossRef]
- Mundher, R.; Al-Sharaa, A.; Al-Helli, M.; Gao, H.; Abu Bakar, S. Visual Quality Assessment of Historical Street Scenes: A Case Study of the First “Real” Street Established in Baghdad. Heritage 2022, 5, 3680–3704. [Google Scholar] [CrossRef]
- Gao, H.; Abu Bakar, S.; Maulan, S.; Mohd Yusof, M.J.; Mundher, R.; Zakariya, K. Identifying Visual Quality of Rural Road Landscape Character by Using Public Preference and Heatmap Analysis in Sabak Bernam, Malaysia. Land 2023, 12, 1440. [Google Scholar] [CrossRef]
- Hartig, T.; Evans, G.W.; Jamner, L.D.; Davis, D.S.; Gärling, T. Tracking restoration in natural and urban field settings. J. Environ. Psychol. 2003, 23, 109–123. [Google Scholar] [CrossRef]
- Zhang, W.; Ricketts, T.H.; Kremen, C.; Carney, K.; Swinton, S.M. Ecosystem services and dis-services to agriculture. Ecol. Econ. 2007, 64, 253–260. [Google Scholar] [CrossRef]
- Millennium Ecosystem Assessment. Ecosystems and Human Well-Being: Synthesis; Island Press: Washington, DC, USA, 2005. [Google Scholar]
- Wang, R.; Zhao, J.; Liu, Z. Consensus in visual preferences: The effects of aesthetic quality and landscape types. Urban For. Urban Green. 2016, 20, 210–217. [Google Scholar] [CrossRef]
- Lückmann, K.; Lagemann, V.; Menzel, S. Landscape Assessment and Evaluation of Young People: Comparing nature-orientated habitat and engineered habitat preferences. Environ. Behav. 2011, 45, 86–112. [Google Scholar] [CrossRef]
- Zhang, G.; Yang, J.; Wud, G.; Hu, X. Exploring the interactive influence on landscape preference from multiple visual attributes: Openness, richness, order, and depth. Urban For. Urban Green. 2021, 65, 127363. [Google Scholar] [CrossRef]
- Hanyu, K. Visual properties and affective appraisals in residential areas in daylight. J. Environ. Psychol. 2000, 20, 273–284. [Google Scholar] [CrossRef]
- Ode, Å.; Tveit, M.S.; Fry, G. Capturing Landscape Visual Character Using Indicators: Touching Base with Landscape Aesthetic Theory. Landsc. Res. 2008, 33, 89–117. [Google Scholar] [CrossRef]
- Sklenicka, P.; Molnarova, K. Visual Perception of Habitats Adopted for Post-Mining Landscape Rehabilitation. Environ. Manag. 2010, 46, 424–435. [Google Scholar] [CrossRef]
- Walker, A.J.; Ryan, R.L. Place attachment and landscape preservation in rural New England: A Maine case study. Landsc. Urban Plan. 2008, 86, 141–152. [Google Scholar] [CrossRef]
- Dearden, P. Factors influencing landscape preferences: An empirical investigation. Landsc. Plan. 1984, 11, 293–306. [Google Scholar] [CrossRef]
- Balling, J.D.; Falk, J.H. Development of Visual Preference for Natural Environments. Environ. Behav. 1982, 14, 5–28. [Google Scholar] [CrossRef]
- Zube, E.H.; Pitt, D.; Evans, G.W. A lifespan developmental study of landscape assessment. J. Environ. Psychol. 1983, 3, 115–128. [Google Scholar] [CrossRef]
- Howley, P. Landscape aesthetics: Assessing the general publics’ preferences towards rural landscapes. Ecol. Econ. 2011, 72, 161–169. [Google Scholar] [CrossRef]
Figure 1.
The location of the study area.

Figure 2.
Likert scale used in this study.

Figure 3.
Classification of landscape elements in the scene.

Figure 4.
Analysis of visual perception bias of participants in different age groups towards different photo groups.
Figure 4.
Analysis of visual perception bias of participants in different age groups towards different photo groups.

Table 1.
Each group with their LCs.
| Group | Landscape Character | Code | Photo Example |
|---|---|---|---|
| A | Field landscape surrounded by mountains | LC-1-1 |  |
| B | Natural landforms, fields, and settlement landscapes | LC-2-1 | 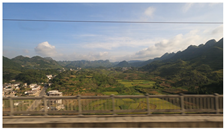 |
| C | Plateau landforms and roadside strip settlement buildings | LC-3-1 |  |
| D | Plateau landforms and scattered settlement buildings | LC-4-1 |  |
| E | Settlement and landscape | LC-5-1 | 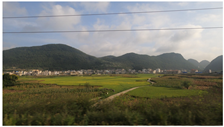 |
| F | Fields and landform landscape | LC-6-1 |  |
| G | Plateau landform settlements and winding rural roads | LC-7-1 |  |
| H | Viaduct connecting mountains | LC-8-1 | 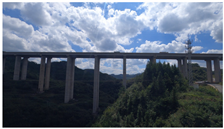 |
| I | Plateau landform natural landscape | LC-9-1 |  |
| J | Field and settlement landscape | LC-10-1 |  |
| K | Settlement and plant landscape | LC-11-1 |  |
| L | Field landscape | LC-12-1 |  |
Table 2.
Questionnaire demographic data.
| Item | Category | Frequency N | Percent % |
|---|---|---|---|
| Place of residence | Urban area | 158 | 64.23% |
| Suburban area | 62 | 25.20% | |
| Rural area | 26 | 10.57% | |
| Gender | Male | 115 | 46.74% |
| Female | 131 | 53.26% | |
| Age | 18 to 25 | 53 | 21.54% |
| 26 to 35 | 125 | 50.81% | |
| 36 to 45 | 37 | 15.04% | |
| 46 to 55 | 19 | 5.69% | |
| Above 55 | 12 | 6.91% | |
| Education level | Junior high school or below | 3 | 1.22% |
| Junior high school | 6 | 2.44% | |
| High school | 35 | 14.23% | |
| Bachelor’s degree | 156 | 63.42% | |
| Master’s degree or higher | 46 | 18.70% | |
| Type of work | Student | 48 | 19.51% |
| Self-employed | 102 | 41.46% | |
| Private sector employee | 73 | 29.67% | |
| Government department employee | 23 | 9.35% | |
| Has previously visited Gui’an metropolitan area | Yes | 43 | 17.48% |
| No | 203 | 82.52% | |
| Resident | Yes | 31 | 12.60% |
| No | 215 | 87.39% | |
| Frequency of visits to rural areas | Less than one a year | 15 | 6.10% |
| 2 times a year | 180 | 73.17% | |
| 3 to 5 times a year | 45 | 18.29% | |
| More than 5 times a year | 6 | 2.43% |
Table 3.
Images sorted by average rating.
| Active Landscape Visual Quality | Passive Landscape Visual Quality | ||||
|---|---|---|---|---|---|
| No. | Photo Codes | Mean Value | No. | Photo Codes | Mean Value |
| 1 | LC-6-3 | 0.87 | 1 | LC-7-2 | −0.64 |
| 2 | LC-1-2 | 0.83 | 2 | LC-8-4 | −0.57 |
| 3 | LC-9-4 | 0.79 | 3 | LC-4-3 | −0.48 |
| 4 | LC-3-2 | 0.68 | 4 | LC-4-4 | −0.39 |
| 5 | LC-3-3 | 0.66 | 5 | LC-4-5 | −0.33 |
| 6 | LC-3-5 | 0.64 | 6 | LC-12-2 | −0.28 |
| 7 | LC-1-3 | 0.63 | 7 | LC-7-1 | −0.26 |
| 8 | LC-6-2 | 0.61 | 8 | LC-7-5 | −0.25 |
| 9 | LC-6-1 | 0.57 | 9 | LC-8-1 | −0.21 |
| 10 | LC-9-5 | 0.55 | 10 | LC-7-3 | −0.18 |
| 11 | LC-6-5 | 0.53 | 11 | LC-8-5 | −0.18 |
| 12 | LC-1-5 | 0.51 | 12 | LC-12-3 | −0.18 |
| 13 | LC-9-3 | 0.48 | 13 | LC-8-2 | −0.15 |
| 14 | LC-6-4 | 0.45 | 14 | LC-12-5 | −0.12 |
| 15 | LC-1-4 | 0.42 | 15 | LC-8-3 | −0.11 |
| 16 | LC-4-2 | 0.04 | 16 | LC-12-1 | −0.11 |
| 17 | LC-2-5 | 0.38 | 17 | LC-10-5 | −0.11 |
| 18 | LC-9-1 | 0.36 | 18 | LC-10-2 | −0.08 |
| 19 | LC-2-3 | 0.33 | 19 | LC-12-4 | −0.06 |
| 20 | LC-5-5 | 0.26 | 20 | LC-4-1 | −0.05 |
| 21 | LC-9-2 | 0.25 | 21 | LC-10-4 | −0.05 |
| 22 | LC-2-2 | 0.24 | 22 | LC-11-2 | −0.04 |
| 23 | LC-3-1 | 0.22 | 23 | LC-11-5 | −0.04 |
| 24 | LC-1-1 | 0.18 | 24 | LC-7-4 | −0.03 |
| 25 | LC-2-1 | 0.18 | 25 | LC-11-4 | −0.03 |
| 26 | LC-2-4 | 0.15 | 26 | LC-10-3 | −0.02 |
| 27 | LC-5-2 | 0.12 | 27 | LC-11-3 | −0.02 |
| 28 | LC-5-1 | 0.08 | 28 | LC-5-4 | −0.02 |
| 29 | LC-10-1 | 0.01 | 29 | LC-3-4 | −0.01 |
| 30 | LC-5-3 | −0.01 | |||
| 31 | LC-11-1 | −0.01 | |||
Table 4.
Results of reliability statistical analysis.
| Visual Quality | Valid (N) | N of Items | Reliability Cronbach’s Alpha |
|---|---|---|---|
| Active Landscape Visual Quality | 246 | 30 | 0.956 |
| Passive Landscape Visual Quality | 246 | 30 | 0.948 |
| Total reliability (Cronbach’s Alpha) for 60 photos | 0.962 | ||
Table 5.
Results of normality tests.
| Group | N | Mean | Std. | Skewness | Kurtosis | Kolmogorov–Smirnov Test | |
|---|---|---|---|---|---|---|---|
| Statistic D | p | ||||||
| A | 246 | 0.837 | 0.202 | 0.036 * | −0.229 | 0.218 | 0.000 *** |
| C | 246 | 0.667 | 0.18 | 0.023 * | −0.08 | 0.231 | 0.000 *** |
| F | 246 | 0.869 | 0.223 | 0 *** | −0.314 | 0.183 | 0.000 *** |
| I | 246 | 0.786 | 0.194 | 0.166 | −0.382 | 0.203 | 0.000 *** |
| Active Landscape Visual Quality Group | 246 | 0.79 | 0.15 | −0.078 | −0.438 | 0.099 | 0.000 *** |
| D | 246 | −0.403 | 0.118 | 0.004 ** | −0.117 | 0.328 | 0.000 *** |
| G | 246 | −0.635 | 0.2 | 0.086 | 0.14 | 0.223 | 0.000 *** |
| H | 246 | −0.554 | 0.182 | 0.533 | 1.458 | 0.259 | 0.000 *** |
| L | 246 | −0.272 | 0.109 | 0.042 * | −0.857 | 0.352 | 0.000 *** |
| Passive Landscape Visual Quality Group | 246 | −0.466 | 0.123 | 0.412 | 1.011 | 0.096 | 0.000 *** |
* p < 0.05, ** p < 0.01, *** p < 0.001.
Table 6.
Visitor and non-visitor variables: t-test results.
| Group | Variable | N | Mean | Std. | Mean Value Difference | Difference 95% CI | t | df | p |
|---|---|---|---|---|---|---|---|---|---|
| A | Non-visitor | 203 | 0.82 | 0.2 | −0.09 | −0.151~−0.019 | −2.549 | 244 | 0.011 * |
| Visitor | 43 | 0.91 | 0.21 | ||||||
| Total | 246 | 0.84 | 0.2 | ||||||
| C | Non-visitor | 203 | 0.66 | 0.18 | −0.03 | −0.091~0.029 | −1.229 | 244 | 0.22 |
| Visitor | 43 | 0.69 | 0.18 | ||||||
| Total | 246 | 0.67 | 0.18 | ||||||
| F | Non-visitor | 203 | 0.86 | 0.22 | −0.05 | −0.119~0.028 | −1.229 | 244 | 0.22 |
| Visitor | 43 | 0.91 | 0.23 | ||||||
| Total | 246 | 0.87 | 0.22 | ||||||
| I | Non-visitor | 203 | 0.77 | 0.19 | −0.12 | −0.181~−0.056 | −3.729 | 244 | 0.000 *** |
| Visitor | 43 | 0.88 | 0.19 | ||||||
| Total | 246 | 0.79 | 0.19 | ||||||
| Active Landscape Visual Quality Group | Non-visitor | 203 | 0.78 | 0.15 | −0.07 | −0.119~−0.021 | −2.826 | 244 | 0.005 ** |
| Visitor | 43 | 0.85 | 0.15 | ||||||
| Total | 246 | 0.79 | 0.15 | ||||||
| D | Non-visitor | 203 | −0.41 | 0.12 | −0.04 | −0.077~0.001 | −1.909 | 244 | 0.057 |
| Visitor | 43 | −0.37 | 0.13 | ||||||
| Total | 246 | −0.4 | 0.12 | ||||||
| G | Non-visitor | 203 | −0.65 | 0.19 | −0.08 | −0.142~−0.011 | −2.286 | 244 | 0.023 * |
| Visitor | 43 | −0.57 | 0.24 | ||||||
| Total | 246 | −0.63 | 0.2 | ||||||
| H | Non-visitor | 203 | −0.57 | 0.16 | −0.1 | −0.184~−0.020 | −2.49 | 48.819 | 0.016 * |
| Visitor | 43 | −0.47 | 0.26 | ||||||
| Total | 246 | −0.55 | 0.18 | ||||||
| L | Non-visitor | 203 | −0.28 | 0.1 | −0.07 | −0.106~−0.036 | −3.983 | 244 | 0.000 *** |
| Visitor | 43 | −0.21 | 0.13 | ||||||
| Total | 246 | −0.27 | 0.11 | ||||||
| Passive Landscape Visual Quality Group | Non-visitor | 203 | −0.48 | 0.11 | −0.07 | −0.127~−0.016 | −2.603 | 48.742 | 0.012 * |
| Visitor | 43 | −0.41 | 0.17 | ||||||
| Total | 246 | −0.47 | 0.12 |
* p < 0.05, ** p < 0.01, *** p < 0.001.
Table 7.
Non-resident and resident variables: t-test results.
| Group | Variable | N | Mean | Std. | Mean Value Difference | Difference 95% CI | t | df | p |
|---|---|---|---|---|---|---|---|---|---|
| A | Non-resident | 215 | 0.83 | 0.21 | −0.06 | −0.138~0.015 | −1.593 | 244 | 0.112 |
| Resident | 31 | 0.89 | 0.16 | ||||||
| Total | 246 | 0.84 | 0.2 | ||||||
| C | Non-resident | 215 | 0.66 | 0.18 | −0.08 | −0.145~−0.010 | −2.266 | 244 | 0.024 * |
| Resident | 31 | 0.74 | 0.18 | ||||||
| Total | 246 | 0.67 | 0.18 | ||||||
| F | Non-resident | 215 | 0.87 | 0.22 | −0.02 | −0.101~0.068 | −0.394 | 244 | 0.694 |
| Resident | 31 | 0.88 | 0.25 | ||||||
| Total | 246 | 0.87 | 0.22 | ||||||
| I | Non-resident | 215 | 0.77 | 0.19 | −0.09 | −0.162~−0.017 | −2.433 | 244 | 0.016 * |
| Resident | 31 | 0.86 | 0.19 | ||||||
| Total | 246 | 0.79 | 0.19 | ||||||
| Active Landscape Visual Quality Group | Non-resident | 215 | 0.78 | 0.15 | −0.06 | −0.118~−0.005 | −2.151 | 244 | 0.032 * |
| Resident | 31 | 0.84 | 0.13 | ||||||
| Total | 246 | 0.79 | 0.15 | ||||||
| D | Non-resident | 215 | −0.4 | 0.12 | −0.01 | −0.056~0.034 | −0.487 | 244 | 0.627 |
| Resident | 31 | −0.39 | 0.13 | ||||||
| Total | 246 | −0.4 | 0.12 | ||||||
| G | Non-resident | 215 | −0.64 | 0.2 | 0 | −0.079~0.073 | −0.08 | 244 | 0.936 |
| Resident | 31 | −0.63 | 0.19 | ||||||
| Total | 246 | −0.63 | 0.2 | ||||||
| H | Non-resident | 215 | −0.55 | 0.18 | 0.01 * | −0.060~0.078 | 0.249 | 244 | 0.804 |
| Resident | 31 | −0.56 | 0.21 | ||||||
| Total | 246 | −0.55 | 0.18 | ||||||
| L | Non-resident | 215 | −0.27 | 0.11 | 0.01 * | −0.028~0.054 | 0.628 | 244 | 0.53 |
| Resident | 31 | −0.28 | 0.11 | ||||||
| Total | 246 | −0.27 | 0.11 | ||||||
| Passive Landscape Visual Quality Group | Non-resident | 215 | −0.47 | 0.12 | 0 | −0.045~0.048 | 0.082 | 244 | 0.935 |
| Resident | 31 | −0.47 | 0.12 | ||||||
| Total | 246 | −0.47 | 0.12 |
* p < 0.05.
Table 8.
ANOVA test results for the active and passive visual quality group.
| Group | Variable | N | Mean | Std. | F | p |
|---|---|---|---|---|---|---|
| A | 18 to 25 years old | 53 | 0.82 | 0.19 | 3.173 | 0.025 * |
| 26 to 35 years old | 125 | 0.85 | 0.2 | |||
| 36 to 45 years old | 37 | 0.89 | 0.21 | |||
| Above 46 years old | 31 | 0.75 | 0.19 | |||
| Total | 246 | 0.84 | 0.2 | |||
| C | 18 to 25 years old | 53 | 0.65 | 0.17 | 4.178 | 0.007 ** |
| 26 to 35 years old | 125 | 0.7 | 0.18 | |||
| 36 to 45 years old | 37 | 0.68 | 0.18 | |||
| Above 46 years old | 31 | 0.57 | 0.18 | |||
| Total | 246 | 0.67 | 0.18 | |||
| F | 18 to 25 years old | 53 | 0.87 | 0.2 | 3.173 | 0.025 * |
| 26 to 35 years old | 125 | 0.9 | 0.21 | |||
| 36 to 45 years old | 37 | 0.85 | 0.25 | |||
| Above 46 years old | 31 | 0.77 | 0.24 | |||
| Total | 246 | 0.87 | 0.22 | |||
| I | 18 to 25 years old | 53 | 0.76 | 0.2 | 2.301 | 0.078 |
| 26 to 35 years old | 125 | 0.81 | 0.2 | |||
| 36 to 45 years old | 37 | 0.79 | 0.18 | |||
| Above 46 years old | 31 | 0.72 | 0.17 | |||
| Total | 246 | 0.79 | 0.19 | |||
| Active Landscape Visual Quality Group | 18 to 25 years old | 53 | 0.77 | 0.14 | 5.162 | 0.002 ** |
| 26 to 35 years old | 125 | 0.82 | 0.15 | |||
| 36 to 45 years old | 37 | 0.8 | 0.15 | |||
| Above 46 years old | 31 | 0.7 | 0.14 | |||
| Total | 246 | 0.79 | 0.15 | |||
| D | 18 to 25 years old | 53 | −0.42 | 0.12 | 3.448 | 0.017 * |
| 26 to 35 years old | 125 | −0.38 | 0.12 | |||
| 36 to 45 years old | 37 | −0.45 | 0.11 | |||
| Above 46 years old | 31 | −0.41 | 0.11 | |||
| Total | 246 | −0.4 | 0.12 | |||
| G | 18 to 25 years old | 53 | −0.63 | 0.18 | 3.049 | 0.029 * |
| 26 to 35 years old | 125 | −0.6 | 0.22 | |||
| 36 to 45 years old | 37 | −0.69 | 0.18 | |||
| Above 46 years old | 31 | −0.7 | 0.17 | |||
| Total | 246 | −0.63 | 0.2 | |||
| H | 18 to 25 years old | 53 | −0.54 | 0.16 | 1.278 | 0.283 |
| 26 to 35 years old | 125 | −0.54 | 0.2 | |||
| 36 to 45 years old | 37 | −0.61 | 0.18 | |||
| Above 46 years old | 31 | −0.56 | 0.17 | |||
| Total | 246 | −0.55 | 0.18 | |||
| L | 18 to 25 years old | 53 | −0.28 | 0.1 | 4.619 | 0.004 ** |
| 26 to 35 years old | 125 | −0.25 | 0.11 | |||
| 36 to 45 years old | 37 | −0.31 | 0.1 | |||
| Above 46 years old | 31 | −0.31 | 0.1 | |||
| Total | 246 | −0.27 | 0.11 | |||
| Passive Landscape Visual Quality Group | 18 to 25 years old | 53 | −0.47 | 0.11 | 3.809 | 0.011 * |
| 26 to 35 years old | 125 | −0.44 | 0.13 | |||
| 36 to 45 years old | 37 | −0.51 | 0.11 | |||
| Above 46 years old | 31 | −0.5 | 0.11 | |||
| Total | 246 | −0.47 | 0.12 |
* p < 0.05, ** p < 0.01.
Table 9.
The results of post hoc multiple comparison test of the active and passive visual quality groups.
Table 9.
The results of post hoc multiple comparison test of the active and passive visual quality groups.
| Group | (I) Variable | (J) Variable | (I) Mean | (J) Mean | Dif (I–J) | p |
|---|---|---|---|---|---|---|
| A | 1 | 2 | 0.819 | 0.851 | −0.032 | 1 |
| 1 | 3 | 0.819 | 0.886 | −0.068 | 0.683 | |
| 1 | 4 | 0.819 | 0.748 | 0.07 | 0.71 | |
| 2 | 3 | 0.851 | 0.886 | −0.035 | 1 | |
| 2 | 4 | 0.851 | 0.748 | 0.103 | 0.064 | |
| 3 | 4 | 0.886 | 0.748 | 0.138 | 0.028 * | |
| C | 1 | 2 | 0.649 | 0.696 | −0.047 | 0.64 |
| 1 | 3 | 0.649 | 0.676 | −0.027 | 1 | |
| 1 | 4 | 0.649 | 0.574 | 0.075 | 0.374 | |
| 2 | 3 | 0.696 | 0.676 | 0.02 | 1 | |
| 2 | 4 | 0.696 | 0.574 | 0.122 | 0.004 ** | |
| 3 | 4 | 0.676 | 0.574 | 0.101 | 0.115 | |
| F | 1 | 2 | 0.868 | 0.901 | −0.033 | 1 |
| 1 | 3 | 0.868 | 0.849 | 0.019 | 1 | |
| 1 | 4 | 0.868 | 0.768 | 0.1 | 0.269 | |
| 2 | 3 | 0.901 | 0.849 | 0.052 | 1 | |
| 2 | 4 | 0.901 | 0.768 | 0.133 | 0.017 * | |
| 3 | 4 | 0.849 | 0.768 | 0.081 | 0.791 | |
| I | 1 | 2 | 0.758 | 0.813 | −0.054 | 0.516 |
| 1 | 3 | 0.758 | 0.789 | −0.031 | 1 | |
| 1 | 4 | 0.758 | 0.723 | 0.036 | 1 | |
| 2 | 3 | 0.813 | 0.789 | 0.024 | 1 | |
| 2 | 4 | 0.813 | 0.723 | 0.09 | 0.121 | |
| 3 | 4 | 0.789 | 0.723 | 0.067 | 0.935 | |
| Active Landscape Visual Quality Group | 1 | 2 | 0.774 | 0.815 | −0.042 | 0.502 |
| 1 | 3 | 0.774 | 0.8 | −0.026 | 1 | |
| 1 | 4 | 0.774 | 0.703 | 0.07 | 0.205 | |
| 2 | 3 | 0.815 | 0.8 | 0.015 | 1 | |
| 2 | 4 | 0.815 | 0.703 | 0.112 | 0.001 ** | |
| 3 | 4 | 0.8 | 0.703 | 0.097 | 0.042 * | |
| D | 1 | 2 | −0.415 | −0.382 | −0.033 | 0.532 |
| 1 | 3 | −0.415 | −0.449 | 0.034 | 1 | |
| 1 | 4 | −0.415 | −0.413 | −0.002 | 1 | |
| 2 | 3 | −0.382 | −0.449 | 0.066 | 0.016 * | |
| 2 | 4 | −0.382 | −0.413 | 0.031 | 1 | |
| 3 | 4 | −0.449 | −0.413 | −0.036 | 1 | |
| G | 1 | 2 | −0.63 | −0.605 | −0.025 | 1 |
| 1 | 3 | −0.63 | −0.686 | 0.056 | 1 | |
| 1 | 4 | −0.63 | −0.703 | 0.073 | 0.622 | |
| 2 | 3 | −0.605 | −0.686 | 0.082 | 0.169 | |
| 2 | 4 | −0.605 | −0.703 | 0.098 | 0.083 | |
| 3 | 4 | −0.686 | −0.703 | 0.017 | 1 | |
| H | 1 | 2 | −0.543 | −0.541 | −0.003 | 1 |
| 1 | 3 | −0.543 | −0.605 | 0.062 | 0.679 | |
| 1 | 4 | −0.543 | −0.561 | 0.018 | 1 | |
| 2 | 3 | −0.541 | −0.605 | 0.065 | 0.355 | |
| 2 | 4 | −0.541 | −0.561 | 0.02 | 1 | |
| 3 | 4 | −0.605 | −0.561 | −0.044 | 1 | |
| L | 1 | 2 | −0.279 | −0.25 | −0.03 | 0.548 |
| 1 | 3 | −0.279 | −0.308 | 0.029 | 1 | |
| 1 | 4 | −0.279 | −0.31 | 0.03 | 1 | |
| 2 | 3 | −0.25 | −0.308 | 0.059 | 0.022 * | |
| 2 | 4 | −0.25 | −0.31 | 0.06 | 0.032 * | |
| 3 | 4 | −0.308 | −0.31 | 0.002 | 1 | |
| Passive Landscape Visual Quality Group | 1 | 2 | −0.467 | −0.444 | −0.023 | 1 |
| 1 | 3 | −0.467 | −0.512 | 0.045 | 0.492 | |
| 1 | 4 | −0.467 | −0.497 | 0.03 | 1 | |
| 2 | 3 | −0.444 | −0.512 | 0.068 | 0.018 * | |
| 2 | 4 | −0.444 | −0.497 | 0.052 | 0.19 | |
| 3 | 4 | −0.512 | −0.497 | −0.015 | 1 |
Variables (I–J) 1, 2, 3, and 4, respectively, represent the following groups: 18 to 25 years old, 26 to 35 years old, 36 to 45 years old, and over 46 years old. * p < 0.05, ** p < 0.01.
Disclaimer/Publisher’s Note: The statements, opinions and data contained in all publications are solely those of the individual author(s) and contributor(s) and not of MDPI and/or the editor(s). MDPI and/or the editor(s) disclaim responsibility for any injury to people or property resulting from any ideas, methods, instructions or products referred to in the content. |
© 2024 by the authors. Licensee MDPI, Basel, Switzerland. This article is an open access article distributed under the terms and conditions of the Creative Commons Attribution (CC BY) license (https://creativecommons.org/licenses/by/4.0/).
Share and Cite
MDPI and ACS Style
Yao, X.; Sun, Y. Using a Public Preference Questionnaire and Eye Movement Heat Maps to Identify the Visual Quality of Rural Landscapes in Southwestern Guizhou, China. Land 2024, 13, 707. https://doi.org/10.3390/land13050707
AMA Style
Yao X, Sun Y. Using a Public Preference Questionnaire and Eye Movement Heat Maps to Identify the Visual Quality of Rural Landscapes in Southwestern Guizhou, China. Land. 2024; 13(5):707. https://doi.org/10.3390/land13050707
Chicago/Turabian StyleYao, Xuhui, and Yan Sun. 2024. "Using a Public Preference Questionnaire and Eye Movement Heat Maps to Identify the Visual Quality of Rural Landscapes in Southwestern Guizhou, China" Land 13, no. 5: 707. https://doi.org/10.3390/land13050707
Note that from the first issue of 2016, this journal uses article numbers instead of page numbers. See further details here.