
Predictive Modelling and Optimization of the Mechanical Properties of Laser-Coated NB/SiC/Ni Welds Using an ANFIS
College of Arts and Design, Jimei University, 185 Yinjiang Rd., Jimei District, Xiamen 361021, China
*
Author to whom correspondence should be addressed.
Metals 2024, 14(5), 585; https://doi.org/10.3390/met14050585
Submission received: 13 April 2024
/
Revised: 9 May 2024
/
Accepted: 13 May 2024
/
Published: 16 May 2024
(This article belongs to the Special Issue Advanced Applications of Artificial Intelligence in Metallic Materials Processing)
Abstract
:In the present work, predictive modelling and optimization with the adaptive network based fuzzy inference system (ANFIS) modelling of the mechanical properties of laser-coated NB/SiC/Ni welds was studied based on the Taguchi design by laser cladding. An ANFIS model based on a Sugeno type fuzzy inference system was developed for predicting the hardness properties of SiC/BN/Ni welds by laser cladding with experimental data required for network training and prediction. Based on analysis of variance, three important factors were taken as inputs for the fuzzy logic inferences, while the hardness properties were taken as the output of the ANFIS. The microstructure of welds was analysed using scanning electron microscopy with an energy-dispersive X-Ray spectrometer. Highly developed leaf-like dendrites and eutectic crystals were found in some areas of the melting zone for the BN/SiC/Ni weld, which was significantly hardened. The ANFIS model based on Taguchi’s design provides a better pattern of response because the predicted and experimental values were highly similar. As a result, a satisfactory result was achieved between the predicted and experimental values of hardness in laser-coated NB/SiC/Ni welds, whereby the success and validity of the method was verified.
1. Introduction
The protective capabilities of metal-matrix composite coatings for hard-surface environments with resistance to higher temperatures, abrasion, corrosion, impact, and fatigue have been of great interest in industrial applications. This is particularly true in areas such as cutting tools, turbine blades, engine valves, etc. There has recently been a strong attraction to the use of ceramic matrix composites (including carbides, nitrides, and borides) on metals and non-ferrous alloys, as these materials have a combination of properties that have been proven to be excellent protective materials in additive manufacturing [1,2]. These hard alloys can be effectively used to improve the mechanical properties of metal-matrix composites. Silicon carbide alloys, with their high melting point and high hardness, are of great significance for sandpaper, grinding wheels, and cutting tools, where they have long been used by manufacturers for equipment such as bearings in high-temperature environments, heated machine parts, automotive brakes, and even knife-sharpening tools [3,4,5,6,7]. Therefore, they are widely used in harsh environments such as those with high temperatures, abrasion, corrosion, shock, and fatigue [8,9,10]. But silicon carbide alloys are high in hardness and brittleness, which make them difficult to machine. A number of disadvantages of silicon carbide have been noted, including reduced strength, uneven distribution, concentration of heat stress, and crack nucleation, especially in the case of coatings with high volume fractions of silicon carbide, thus limiting the application of silicon carbides. Therefore, typical silicon carbide alloys are hardly able to meet the requirements of workpieces in harsh working environments [11,12,13]. With these challenges, various surface-strengthening techniques have been investigated, containing metal matrix composites with transition alloys and intermediates because of their good wettability and ductility [14,15,16,17]. Many of the existing publications have addressed the use of transition alloy materials for manufacturing metal–ceramic coatings by using laser cladding [18,19]. These transition alloys are equipped with a binder phase that protects the carbide from oxidation and decomposition [20,21,22,23,24,25]. They add binder phase materials to form metal–ceramic composite layers by laser cladding, which reduces the structural defects of highly brittle carbides during the cladding process. For example, Li et al. investigated the fabrication of mirrors made of silicon carbide ceramics through additive manufacturing methods using material extrusion and laser cladding. The experimental results show that optical elements of silicon carbide with more complex structures can be manufactured, which is difficult to achieve with conventional ceramic moulding and sintering techniques [26]. Li et al. developed the microstructure, the mechanism of formation, and the properties of Ti + SiC based on the Ti6Al4V substrate via laser cladding [27]. Yin et al. studied composite ceramics of layered porous SiCnw-Si3N4 with favourable electromagnetically absorbing properties. The increase in solid loading decreased the apparent porosity and improved flexural strength and fracture toughness [28]. Zhou et al. investigated the preparation of Si3N4 ceramics with carbon fibres reinforced with the pyrolytic carbon (PyC)/SiC phase using the gel casting method. The results indicated that the chemically compatible of carbon fibres with Si3N4 matrix at high temperatures was remarkably enhanced by introducing the PyC/SiC phase [29]. Mazumder et al. studied a series of Si3N4-SiCnw and MgF2-added Si3N4-SiCnw composites that were manufactured at 1650 °C using hot press sintering [30]. The process of laser melting of SiC/Si composite coatings on Si-SiC ceramic substrates was investigated by Lusquiños et al. The results showed that the use of SiC + SiO2 mixed powders caused serious damage to the substrate material, while the use of SiC + Si mixed powders resulted in good coatings without causing damage to the substrate [31]. Zheng et al. described the laser cladding of Al + SiC powders on a AZ91D magnesium alloy in terms of microstructure and wear properties. The results indicated that the hardness of the surface of the cladding deposit was higher than that of the substrate. It increased with the increase in SiC content in the cladding deposits. The results show that the surface hardness of the cladding layer was higher than that of the substrate, which increased with the increase in SiC content in the cladding layer. Meanwhile, the in situ-synthesised SiC particle composite coatings significantly improved the wear resistance [32]. Sun et al. concentrated on the process of manufacturing BN materials and the application of BN composite coatings, in which h-BN has remarkable mechanical properties [33]. Based on the above literature, many studies have shown that the use of binder phase additives in metal matrix composites in highly hard environments has the potential to ameliorate the susceptibility of ceramic-reinforced coatings to laser cladding, whereas much of the research on ceramic–metal composites has been directed towards the characterisation of silicon carbide composites in one binder phase. However, studies on the mechanical properties of transition alloys and intermediates both used in metal-matrix composites, especially in silicon carbide composites, are still limited [6,34,35,36,37,38]. Silicon carbide is very hard coat because of its susceptibility to sublimation at high temperatures. Therefore, it is desirable to extend some useful transition and intermediate alloys to high-carbon silicon, which can be further explored in depth to improve the properties of silicon carbide composites. In this study, layered structural dispersants such as boron nitride and nickel-based alloys into silicon carbide composites that can enhance the properties of ceramic–metal silicon carbide composites based on the concept of weak boundary phase of carbide are introduced. Moreover, the influence of and relationship of process parameters with mechanical properties, such as modelling, cannot be studied systematically and accurately. However, the laser cladding process and cemented carbide composites both are highly nonlinear, multivariate, strongly coupled, and complex processes with large stochastic uncertainties that often require empirical decisions with less-than-optimal results. Due to the dynamic and non-linear behaviour of data, they cannot fully describe the complex relationships between data. There is a need for several new attempts. The uncertainty of ceramic–metal composites is well solved by developing an several predictive models using soft programming techniques such as artificial neural networks, fuzzy logic, adaptive network-based fuzzy inference systems, etc., so that the complex welding problems, such as parameter–property relationships, predicting and monitoring the quality of welded joints, designing welding process parameters, controlling weld shaping, tracking weld beads, and detecting welding defects, can be solved [39,40,41,42,43,44,45,46,47,48,49,50,51,52]. There are, however, some drawbacks to them, such as poor global search capability and long training time. Furthermore, fuzzy logic interference systems that depend on the knowledge and experience of specialised experts can hardly give satisfactory results when there is not enough information in the database of knowledge [53,54,55,56,57,58,59,60]. Therefore, the above discussion leads us to propose an improved adaptive neuro-fuzzy inference system in this paper. This is because it is a mixture of artificial intelligence techniques and a blend of fuzzy logic and artificial neural networks. The ANFIS integrates the advantages of the fuzzy inference system, which is easily expressed in fuzzy linguistic terms, with the self-learning ability of artificial neural networks by making full use of their strengths. However, the optimisation and modelling of metal–ceramic composites applied to the welding process were already available in the literature. However, the optimisation and modelling of the properties of BN/SiC/Ni welds by laser cladding using ANFIS in Taguchi’s method do not appear to have been reported.
In this study, laser cladding of ceramic–metal composite coatings on substrates is carried out by applying artificial intelligence with the aim of providing valuable insights into the mechanical properties of BN/SiC/Ni deposits. The mechanical properties of laser-coated welds are improved by optimization design and artificial intelligence, while an ANFIS algorithm based on Taguchi’s experiments is developed to model the hardness behaviour of the coatings. The influence of microstructural evolution, hardness properties, and modelling of BN/SiC/Ni coatings with different parameters in laser welding is analysed. Furthermore, the hardness properties of laser BN/SiC/Ni welds are modelled using the ANFIS based on the parametric design to understand the response pattern of the experimental domain. A better understanding of the hardness properties is gained through the prediction of ANFIS, which allows us to determine the effects of various variables on hardness by simulating the hardening behaviour of BN/SiC/Ni welds.
2. Experimental Design and Analysis
2.1. Materials and Preparations
The experimental equipment of laser cladding consisted of a YLS-3000 fibre laser (Paris, France), six-axis robotic arm, laser water cooler, and PLC control system, as shown in Figure 1a. In addition, the experiments of laser cladding used the laser via nozzle shown in Figure 1b, where powder 1, a Ni-based powder, and powder 2, a BN-based powder, were mixed in a mixing chamber using nitrogen, which was coaxially fed to the SiC powder pre-positioned on the substrate to produce a fused layer, resulting in a BN/SiC/Ni weld. Transition metals such as nickel-based and BN-based powders were used in laser cladding and formed silicon carbide composite welds, which improved the properties of high-hardness silicon carbide [23,24,28,30]. The size of the base metal was 40 mm × 20 mm × 10 mm. Microhardness tests were conducted using an AVK-C1 hardometer made by Mitutoyo (Kawasaki, Japan). The test was carried out on the entire weld bead, including the molten zone, heat-affected zone, and the base material, with a total of 14 points, while the hardness calculation was mainly measured in the molten zone for modelling calculations. Table 1 lists the BN/SiC/Ni mixtures in this study, where the substrates were 40Cr and #45 steel, the NB powders were 0–30%, the SiC powder was 70–100%, the Ni powder was 0–30%, the laser power was 2400–2800 W, the carrier flow rate was 1400–1800 mL/min, the travel speed was 2–6 mm/s, and the stand-off distance was 40–50 mm.
2.2. Experimental Design and Layout
With laser cladding, a number of controlled variables are required in order to minimize unwanted defects in the weld. If the variables are chosen poorly, voids, cracks, and dissolved SiC can be generated, leading to weld characteristics that cannot be controlled. However, the variables of laser cladding come to play significant roles in the behaviour of the weld. This is because the laser cladding process involves many variables that affect the properties of the weld. Therefore, the variables of laser cladding must be controlled. A total of 18 experiments were conducted while using two- and three-layer arrays of L18 orthogonal tables that could accommodate many design factors simultaneously to obtain sufficient experimental information. Table 1 shows the factors and levels in Taguchi’s design, which contains eight factors of A, B, C, D, E, F, G, and H. One level 2 factor and seven level 3 factors were assigned to the orthogonal array. It was a matrix of fractional factors that ensured a balanced comparison of the levels of any factor or interaction between factors. These factors and their alternative levels that were used in the experiment are listed in Table 2. In this study, the Taguchi method provided minimal sensitivity to various causes of variation and optimized the control parameters by using orthogonal arrays over the entire parameter space, thereby yielding high-quality products with development and manufacturing costs. To evaluate the impact of each factor on the response, Taguchi recommended the use of a form of response transformation known specifically as the signal-to-noise ratio (S/N), which measures quality with emphasis on variation [26]. In this study, the logarithmic transformation was applied to the case where smaller was better, for example, the amount of wear on the clad welds. The S/N ratio based on the loss functions was calculated from Equation (1):
where is the mean and Si is the standard deviation of the ith trial, while m is the predefined value of 18 trails, measured in decibels. Table 2 calculates the S/N ratio and gives a summary of the mean and standard deviation for each variable. Each trial was repeated three times for wear volume, which was analysed for rank order and maximal values using mean value analysis with the S/N ratio. Analysis of variance (ANOVA) was likewise used once again to identify significant factors for each of the quality characteristics. Subsequently, predictions of quality characteristics were made using these factors incorporated into the ANFIS model.
2.3. Adaptive Network Based Fuzzy Inference System
The adaptive neuro-fuzzy inference system (ANFIS), introduced by Jang in 1993 [53], which has gained remarkable attention from researchers, is a hybrid forecasting model that uses both neural networks and fuzzy logic, and is a method for generating mapping relationships between inputs and outputs. ANFIS provides highly efficient models for approximation not only in neuro-fuzzy systems, but also in various other machine learning techniques. Thus, the shortcomings of neural network black boxes that are unable to explain decisions and the weaknesses of fuzzy logic, where learning relies on personal experience, can be overcome. In ANFIS, the learning ability of artificial neural networks and the decision-making mechanisms of fuzzy logic are integrated. ANFIS, like artificial neural networks, utilises a training dataset to achieve sample learning of the rule base in the fuzzy logic system. The prediction of mechanical properties of welding using an ANFIS has the advantages of fast modelling and high prediction accuracy, providing an effective way to solve the problems of difficult prediction models and low prediction accuracy due to the highly nonlinear nature of the welding process. Figure 2 depicts the architecture of ANFIS. It can be deduced from Figure 2 that the network consisted of three inputs (X1, X2, X3), where each input was organized by three membership functions. In addition, the layer containing 27 fuzzy rules and the output layer were useful for building the model. The total number of nodes in the first layer can be calculated as the result of the product of 3 (number of inputs) and 3 (number of fuzzy functions). The number of nodes in the other layers (layers 2–4) is associated with the number of fuzzy rules (27). For Figure 2, the basic structure of the ANFIS model is shown. In this example, a five-layer neural network that simulates the operation of a fuzzy inference system, as shown in Figure 3, is used. Figure 2 shows the topology of the proposed ANFIS for the hardness yield. Each node in the same layer of the architecture, as shown in Figure 2, has a similar function. Square nodes indicate nodes with adjustable parameters, and circular nodes indicate nodes without adjustable parameters. For more details on the implementation of the ANFIS network, refer to the literature [39,53]. ANFIS uses membership functions for several sets while employing the linear functions of Sugeno type for the rule output. Various types of membership functions (MFs) are used, such as triangular, trapezoidal, Gaussian, and bell functions. As an example of the Gaussian type of MF, the mathematical equation is:
where Gauss’s one-dimensional graph is the shape of the characteristic symmetric solution “bell curve”; a is the height of the curve’s peaks; b represents the coordinates of the centre of the peaks; and c is the standard deviation, which characterises the width of the bell shape. ANFIS performed all the five essential processes of fuzzy control, i.e., input layer, membership layer, fuzzification layer, normalisation layer, and defuzzification, which constitute an adaptive neuro-fuzzy system, by using a learning algorithm of neural networks that automatically extracted rules from the source data of the input and output samples. Its model structure was merged by adaptive network and fuzzy inference system, which inherited the explainability of the fuzzy inference system and the learning ability of the adaptive network in terms of the predictive power of the model, which was able to modify the parameters of the system according to previous knowledge so as to make the output of the system closer to the real output. The architecture of the neuro-fuzzy model consisted of five unique adaptive layers. The T-S fuzzy model was proposed by Takagi and Sugeno in 1985. This model was subsequently referred to as the Sugeno fuzzy model. It is a nonlinear model that expresses the dynamic properties of composite systems, and is also the most commonly used fuzzy inference model. Figure 2 shows a neural network with five layers in which the ANFIS model was trained. The input values, such as SiC, laser power, and travel speed, were converted to fuzzy values by means of a membership function. As an example of a simple fuzzy inference system, a first-order model of fuzzy Sugeno with a typical rule base, containing two If–Then rules, can be expressed as follows:
where xi (i = 1, 2, …, s)is the antecedent input; A1s, B1s, and C1s are the membership functions; and f(x1,x2,…,xs) represents the outputs in the consequent part. Typically, yi = f(x1,x2,…,xs) is a polynomial. The following is a brief description of the Sugeno first-order model with two input variables.
Rule i: If x1 is A1s, x2 is B1s,…, and xs is Cis; then yi = f(x1,x2,…,xn) i = 1, 2, …, M
Layer 1: The inputs x1, x2, x3 are fuzzified by means of a membership function, which is transformed to obtain the degree of membership of the linguistic types A1, A2, A3, B1, B2, B3, C1, C2, C3 (e.g., large, medium, small) in the interval [0,1]. The output of layer 1, Oij, can be expressed as
where μij is the jth membership function for the input Xi.
Layer 2: The firing intensity of each rule is derived by the product of the membership degrees of each rule; the weight function wi for the next layer is defined.
Oi2 = wi = µAi(x1)µBi(x2) µCi(x3), i = 1, 2, 3
Layer 3: The firing intensity of each rule obtained from layer 2 is normalised to denote the firing weight of that rule in the whole rule database.
Layer 4: the results of a calculated output of a linear combinator of the input functions using normalised weights.
Layer 5: The output of the calculation is the sum of the results of the linear combination of the normalized weights of each rule.
In this paper, the parameters in the model are classified into premise and outcome parameters, which were learnt by the back propagation algorithm with least squares calculation. Least squares were used in the forward propagation process to evaluate the subsequent parameters, whereas the backward propagation process updated the premise parameters. There are two important steps in executing an ANFIS model, which are training and testing the data. The total number of experimental data points to be used in constructing the ANFIS model is 36. In this study, 25 training data and 11 test data were used. The root mean square error (RMSE) function was employed to examine the performance of the training model by applying it to this network. Its computational formula was as follows:
where M is the total number of training samples, di is the actual output value, and yi is the output value in the training algorithm of ANFIS.
3. Experimental Results and Discussion
3.1. Experimental Design Based on Orthogonal Array
Table 2 shows the results of the L18 experiments, which were used to evaluate the microhardness of the NB/SiC/Ni alloy welds by calculating the S/N ratio of the experimental values with standard deviations. In a similar way, the microhardness results of the microhardness tester can also be seen in Figure 4. The experimental results show a significant difference in microhardness compared to the substrate, with an increase of about 3 times or more, which indicates a good hardening effect. The results of the tests on the hardness of various coatings are given in Table 2, where various patterns and EDS analysis of wear can be visualised. The distributions of hardness for tests 4, 9, 13, and 14 were 376.8 ± 7.8 HV, 721.2 ± 23.6 HV, 356.4 ± 13.9 HV, and 754.6 ± 34.2 HV, respectively, indicating that they improved significantly. The hardness values of the cladding layers in 40Cr and #45 steels were 603 HV and 606 HV, respectively. There was almost no difference between the two. Also, in trials 6, 9, 12, and 14, the hardness yields exceeded 600 HV, i.e., the higher the S/N ratio, the better the hardened properties, while in trials 4, 10, 13, and 16, the hardness values were lower than 400 HV, i.e., the lower the S/N ratio, the smaller the hardness values. Figure 5 shows the distribution of the lowest and the highest hardness yields in 18 groups of BN/SiC/Ni welds for both substrates, including the melting zone, the heat-affected zone, and the substrate. Three distinct sizes of hardness are shown for the zones such as the melted zone, heat-affected zone, and substrate. The metallographic structures of the three zones of the cladding are in good agreement with each other. It is clear that the addition of SiC increased the hardness of the coating. The increase in hardness can be mainly attributed to the dissolution of BN and SiC in the liquid phase, which resulted in an increase in the volume fraction of carbon–boride formed during the laser cladding process.
3.2. Microstructure of the Weld Zone for Laser-Coated NB/SiC/Ni Welds by Laser Cladding
A magnified 2000X SEM picture of the microstructures in the cross-section of each of the laser-coated NB/SiC/Ni weld can be seen in Figure 6, which shows that the molten zone of the weld was characterised by various sizes of grains. During the laser cladding process, different forms of carbides and precipitates were generated in the composite coatings due to the differences in the carbide, nitride, and nickel content of the molten pool. There were large white areas and small black areas in the melting zone, whereas in the lower-hardness areas, coarse crystalline with plate-like grains grew, and in the higher-hardness areas, the particles were fine, with white carbide structure. Unfortunately, this study has failed to avoid partial dissolution of silicon carbide on the molten pool. This is due to the different temperature gradient of the melt pool between the white and dark zones, which affects the corresponding structure of the solidification zone by cladding welds. In addition, Table 3 lists the results of the EDS data for the typical areas labelled Tests 4, 9, 13, and 14 in Figure 7, where the elemental intensities analysed by EDS are those detected at the laser-coated surface in Figure 6. The powder is pre-positioned SiC on the substrate by laser cladding, where the coaxial powders are melt-mixed with the substrate. The SEM micrographs of the laser coatings are shown in Figure 6a, labelled Test 4, where large grains can be seen, with plate-like coarse grains growing within the weld zone along with crystalline structures of Si particles at the grain boundaries. The chemical compositions of the BN/SiC/Ni welds obtained by EDS are listed in Table 3. In EDS, the elements O and Fe are higher, C is lower, and Ni and Si are even lower. The cross-section of the cladding zone shown in Figure 6b indicates that Test 9 contained obvious dissolved black Si dendrites, no pores or cracks, and irregularly distributed aggregates in the lower-left region, while the white region contained fine precipitated carbides and the lower-right region had some incompletely melted Si. The thickness of the melt layer was about 4–6 µm, much smaller than the thicknesses produced by the other fractions. Comparing Figure 6a with Table 2, it is clear that Figure 6b is harder. Furthermore, the EDS analysis shows that Figure 6b had fewer Si and C elements, but more O and Ni elements than Figure 6a. This is because the temperature gradient in the melt pool was different, which affected the solidification time during deposits, thereby resulting in different corresponding structures. As shown in Figure 6c, the grain growth was complete, but some of the black particles did not melt and accumulated at the grain boundaries, where pin-like eutectic crystals can be seen in the grains, as shown in the white part of the SEM micrograph. Typical areas labelled Test 13 in Figure 6c and the EDS results are shown in Table 3. An analysis of the distribution of elements in the melting zone by X-ray diffraction shows that the white areas were rich in O and Fe, while C, Si, and Ni were less abundant, mainly iron oxide (Fe2O3), h-BN, γ-(Ni, Fe), B4C, and iron silicide (Fe2Si) [12]. As shown in Figure 6d, most of the plate-like carbides and a few unmelted SiC and BN particles are clearly visible in the zone, which contained iron clusters in grey colour and precipitated carbides when melted. It was the hardest of the 18 groups. The analysis of test 14 by EDS is shown in Table 3. In the molten region, O decreased to 5.250% and Ni increased to 1.050, while the remaining elements showed little change, which was not evidenced by the EDS analysis. Therefore, it seems to be necessary to use the microstructure of the molten zone as a support for the results.
3.3. Effect of Designing with Ternary SiC/BN/Ni Mixtures on Hardness Yields
In order to solve the problem of the mixture ratio of three materials using mixture design, the mixture properties of lased cladding were effectively controlled. The effects of the three mixture powders, including SiC, BN, and Ni alloys, were considered in turn to determine the relationships between the hardness and the variables and to determine the nature of the hardness. For a better visualization of the effect of each component in the three SiC, BN, and Ni blends, the various hypsographic maps using a mixture design are shown in Figure 8, which shows how the three factors (SiC, BN, and Ni) affected the SiC, BN, and Ni hardness response of the clads that yielded desirable values. Figure 8 shows the region of the ternary contour plot, which gives an insight into the appropriate proportioning of the three component mixtures of SiC, BN, and Ni on the welds of the cladding. As shown in Figure 8a, the triangular response surface showing the effects of SiC, BN, and Ni at fixed control factors and levels for the laser cladding was generated by a linear mixture. The response plots show that the hardness was highest with a 100% increase in SiC, which decreased slightly with the increase in BN. There was a tendency for the upper-left region to have higher hardness, while the lower-right region had lower hardness. Similarity, the plots in Figure 8b showed the response surface with contour plots for the effects of SiC, BN, and Ni that were generated by a linear mixture. It displays a contour plot of the hardness using a linear mixture, where the red areas had higher hardness values and the blue areas had lower hardness values. Clearly, the optimum zone of 70–90 wt% SiC 10–30 wt% BN and 10–20 wt% Ni provided the desirable zone for the mixture design. However, the decrease in hardness was due to the addition of proper amounts of the Ni element into the WC/Ni/Co blend, but this hardness increased when the amount of SiC powder increased. In summary, the graphically shown contour areas of linear mixtures show the desired value of 606 HV, and a mixture of 67% SiC, 17% BN, and 17% Ni was picked. In the triangular contour plot, the area highlighted red is ideal for individual powder components and mixture powder components on the pattern of hardness, which had a greater impact on the expected output for different combinations of mixture components than the other highlighted areas.
3.4. The Analysis of Variance of Laser-Coated BN/SiC/Ni Welds
The effects of the mean values reflect the importance of the relative performance between each of the control factorial levels. The S/N ratios were calculated based on the mean values of levels 1, 2, and 3 for each factor in Figure 5. The ranking of the mean responses and the effects of the magnitude on the experimental results were evaluated. Their S/N ratio was effective in terms of detecting important factors of laser cladding that affected weld quality. The factors affecting the hardness values of the laser cladding layers are shown in Table 4. The ordering of the parameters affecting the hardness values is further shown as C, G, E, H, B, F, D, and A. Also, as seen in Table 4, A2, B2, C3, D1, E1, F2, G3, and H3 had the highest S/N values, with a maximal effect on the hardness values, i.e., they were the optimum values. Furthermore, a further analysis of variance based on Equations (10) and (11) was carried out on Table 5 to validate the significance of the control factors in Table 4. The aim of the analysis of variance (ANOVA) was to investigate the design parameters of laser-coated BN/SiC/Ni welds with significant effects on the hardness yields of the deposit. These contribution rates could be used to assess the importance of each factor to the hardness that is relevant. The total sum of squares, SST, for the ANOVA was:
where Zi is the correlative Z response for the ith trial, is the total average of the associated hardness responses, and n is the number of trials. SSK is the sum of the squares for the control factor k of the trial, where k = A, B…H, was computed as
where is the average response for jth level of Factor k, and is the number of repetitions of each level of Factor k. The estimated variance of Factor k, MSK, is the ratio of SSK to its degrees of freedom (DOF), and the estimated variance of random error is called the mean squared error, or MSE, which is the ratio of SSE to its degrees of freedom. Then, the F-ratio is simply the ratio of MSK to MSE. Hence, the ratio (percentage) of contribution of factor k is a highly significant indicator for comparing the contribution of factors. The higher the ratio of contribution, the greater the overall variance of the effect. Table 5 shows the mean squares of the eight control factors, which illustrate the effect of each factor on the variance. Notices that were more important based on the results of Equations (10) and (11) are shown in AVOVA. Compared with the contribution of the error factor (7.62%), we chose the most important SiC wt% (C), laser power (E), and travelling speed (G), while the substrate (A), BN wt% (B), Ni wt% (D), carrier gas (F), and spacing (H) had smaller percentages, as shown in Table 5. The percentage of explainable variation in these important parameters overall was 77.58%. We reconfirmed the most important factors obtained from the average factor analysis as shown in Table 4. These important factors were further incorporated into the ANFIS prediction of the hardness of laser-coated welds.
3.5. Confirm Run and Their Optimization on the Hardness Properties
Three repetitions of each test were carried out in different areas of the melting zone in order to estimate the optimum performance of the welds for all the tests. Table 2 lists the results and the S/N ratios obtained using the formulae fulfilling the “larger-the-better” property. Table 4 shows the computation of the response of the S/N ratio in the orthogonal array experiment using mean value analysis. Apparently, a higher S/N ratio displays better properties of the laser-coated BN/SiC/Ni welds. That is, the higher the S/N ratio, the more important the factor. As shown in Table 4, the optimal value for each factor was derived from the maximum S/N value for each level of the factor. The optimal setting for the factorial levels is A2B2C3D1E1F2G3H3. The optimal factors for the spraying process were a substrate of #45 steel, 15 wt% BN, 70 wt% SiC, 0 wt% Ni, laser power of 2400 W, carrier gas of 1600 mL/min, travel speed of 6 mm/s, and stand-off distance of 50 mm. Of all the 18 sets of orthogonal array experiments, we chose the 9th group, with a pessimistic colour, which was better in the first nine sets, and the 14th group, with a dark-blue colour, which was better in the last nine sets. These were compared with the optimal group with a brown colour. As shown in Figure 9, the higher the hardness, the closer it was to the right side of the chart. Using a Gaussian plot, the thinnest solid curve shown on the right side of Figure 9 indicates the best test, which produced the greatest hardness with very little deviation. It is evident that the optimum setting of the control factors was remarkably robust to variability, demonstrating that the reproducibility was good.
3.6. Analysis of ANFIS Model
In this paper, a predictive model is created using first-order TSK-type fuzzy rules. Different numbers of membership functions were tried using subtractive clustering method to obtain the best model of ANFIS. The MATLAB R2021 software package was used. However, the membership function of the Gaussian type was optimally used. To understand the performance of ANFIS, Figure 10 shows the prediction of the hardness of the fuzzy system with an adaptive network, which was executed by passing the three important parameters based on ANOVA, i.e., SiC%, laser power, and travel speed, using laser-coated welding. As shown in Figure 3, the fuzzy logic system has a rule base which contains three inputs (SiC%, laser power, and travel speed) and one output (microhardness). It was applied to the fuzzy logic system which was trained by the neural network, shown graphically above the first rule in Figure 10, with a database of 20 rules. By applying logic rules and Mamdani reasoning procedures, multiple logic rules were fired to give fuzzy linguistic values for the output response. The model can be used to predict the hardness values of laser-coated welds. For example, the inputs were SiC (70 wt%), laser power (2400 W), and travel speed (4 mm/s), respectively, whilst the predicted value of microhardness was 603 HV. As shown in Figure 11a, using a neural network to train a fuzzy system yielded an ANFIS model containing a fuzziness layer, a rule-base layer, a normalisation layer, an inference layer, and a total output layer. Furthermore, the rule base of the fuzzy system was optimised by the subtractive clustering method, completing the ANFIS model. An example of the training data is shown in Figure 11b, where the results of the root mean square error (RMSE) of the hardness response of the ANFIS model to the training and test data is shown. The fuzzy system was trained by the neural network 1000 times, which resulted in the smallest RMSEs of 1.23085 and 1.49378, respectively. Furthermore, the ANFIS predictor fit a distribution curve of the actual data, where the ANFIS prediction and the actual values formed a diagonal straight line, as shown in Figure 11c,d. The predicted and experimental values were remarkably similar, indicating that the model was reliable. The error for many of the validation tests was less than 3%, while the maximum error was 9.40%. However, the distribution of prediction errors for ANFIS fluctuated steadily, with only three prediction errors exceeding the standard deviation of the experimental values by more than 5%. A comparison of the experimental data with the ANFIS predictions is shown in Figure 12, which verifies that the average error of the ANFIS predictions was 4.625%. It is, therefore, concluded that the developed ANFIS model is an effective model for decision makers to predict the hardness characteristics of laser-coated BN/SiC/Ni welds.
3.7. The Predictor of Surface Response Using an ANFIS
A three-dimensional graph of the prediction was made using ANFIS model. As shown in Figure 13, the effect of each working parameter on the hardness response can be understood using three important variables, i.e., SiC, laser power, and travel speed, based on ANOVA. Figure 13a shows the relationship between the hardness with respect to SiC and the laser power. At high laser powers near 2800 W, the hardness was 350 HV at the lower level when the SiC was below 10 per cent, while it rose to a higher level of 700 HV when the SiC was near 20 wt%. Meanwhile, the laser power approaching 2600 W and SiC near 20 wt% resulted in a hardness of about 400 HV. As shown in Figure 13b, the hardness was lower at a scanning speed of 4–6 mm/s when the laser power was 2400 w. In addition, when the laser power was in the range of 2500–2700 W, the hardness was more than 600 HV, whereas the hardness increased with the increase in laser power to reach more than 700 HV when the scanning speed was nearly 6 mm/s. As shown in Figure 13c, the hardness in relation to the ratio of SiC and scanning speed is evident. If both the SiC and scanning speed were low, the hardness was relatively lower at 350 HV. When the travel speed was 2–4 mm/s, the hardness rose to 550 HV with increasing SiC. Yet, when the travel speed was 5–6 mm/s, the hardness rose slowly from 450 HV to 550 HV with 0–10 wt% SiC, and stays at 580–600 HV with 10–30 wt% SiC. Based on the aforementioned graphs, the resulting contours showed considerably more curvature, indicating that the hardness curvature had a complex nature of correlation with SiC, laser power, and travel speed, which could not be formulated mathematically. These graphs show that the larger hardness values mostly fell near the design boundary. Also, it was observed by scanning electron microscopy that the welds at the boundary conditions produced finer structures and harder surface coatings, thus satisfying the desired hardened layer. The above graphs clearly show that it is feasible to understand the relationship between the response and the variables, whilst at the same time, it is easy characterise the nature of the coatings in the design zone, which can then yield more information about the nature of the cladding system.
4. Concluding Remarks
In this study, the mechanical properties of the welds with laser-coated NB/SiC/Ni were predicted and optimised using an ANFIS based on Taguchi’s design. ANFIS models were available to model the hardness behaviour of welds. By using orthogonal array experiments, the effect of control factors on welds was determined. Based on ANOVA, three important factors, i.e., SiC, laser power, and travel speed were used as inputs for fuzzy logic reasoning, while hardness properties were used as outputs for ANFIS. The microstructure of the melting zone consisted mainly of dendritic crystals, with denser grey areas near the grain boundaries, while the grains in the heat-affected zone were significantly coarsened. Yet, the high-iron zone was mainly composed of iron oxides, borides, and a small amount of molten nickel composites for the laser-coated BM/SiC/Ni welds. The difference in hardness attributes compared to the substrate was significant, increasing by a factor of about 3, which indicated good hardness properties. The relationship between the important parameters and the hardness of the laser melting zone was constructed using an ANFIS. An ANFIS model based on a Sugeno-type fuzzy inference system for predicting the hardness properties of welded coatings was developed using experiments with SiC/BN/Ni coatings used in laser cladding as well as experimental data required for the training and testing of neural networks. The algorithm used artificial neural networks with learning abilities by training the network in combination with least squares. The RMSEs obtained for the training data and testing data in predicting of hardness response using an ANFIS model were 1.23085 and 1.49378 after 1000 epochs of computation, respectively. Meanwhile, a comparison of the experimental data with the ANFIS predictions verified that the mean error of the ANFIS predictions was 4.625%. The response patterns of the ANFIS clearly show that it was viable to understand the relationship between the response and the variables, while also making it easy to determine the nature of the coating in the design domain. A comparison of experimental and simulation results showed that it was effective. The ANFIS model may be applied to the prediction of mechanical properties of welded joints, which will be able to map the nonlinear relationship between inputs and outputs with high prediction accuracy.
Author Contributions
Data curation, formal analysis, software (optimization), validation, writing, and proofreading—original draft, Z.Z.; data curation, formal analysis, experiment and procedure, software (simulations), validation, and proofreading—original draft, J.C.; conceptualization, resources, supervision, project administration, data curation, formal analysis, validation, writing, proofreading—original draft, and review and editing, M.-D.J. All authors have read and agreed to the published version of the manuscript.
Funding
The authors gratefully acknowledge financial support from the Industry University Cooperative Education Projects of the Ministry of Education (202102100020; 202102391031; 231103231121958); Undergraduate Education and Teaching Reform Research Project of Fujian Province (No. FBJG20220194); Key Project of Xiamen Social Science Federation (2024B31) and Key Issues of Xiamen Humanities and Social Sciences Research Centre (2022H6031).
Data Availability Statement
The raw data supporting the conclusions of this article will be made available by the authors on request.
Conflicts of Interest
The authors declare no conflict of interest.
References
- Suryanarayanan, R. Plasma Spraying: Theory and Applications; World Scientific: Singapore, 1993. [Google Scholar]
- Sun, G.; Zhou, R.; Lu, J.; Mazumder, J. Evaluation of defect density, microstructure, residual stress, elastic modulus, hardness and strength of laser-deposited AISI 4340 steel. Acta Mater. 2015, 84, 172–189. [Google Scholar] [CrossRef]
- Wang, W.-L.; Bi, J.-Q.; Wang, S.-R.; Sun, K.-N.; Du, M.; Long, N.-N.; Bai, Y.-J. Microstructure and mechanical properties of alumina ceramics reinforced by boron nitride nanotubes. J. Eur. Ceram. Soc. 2011, 31, 2277–2284. [Google Scholar] [CrossRef]
- Li, X.C.; Stampfl, J.; Prinz, F.B. Mechanical and thermal expansion behavior of laser deposited metal matrix composites of Invar and TiC. Mater. Sci. Eng. A Struct. 2000, 282, 86–90. [Google Scholar] [CrossRef]
- Babout, L.; Brechet, Y.; Maire, E.; Fougeres, R. On the competition between particle fracture and particle decohesion in metal matrix composites. Acta Mater. 2004, 52, 4517–4525. [Google Scholar] [CrossRef]
- Shu, D.; Li, Z.; Zhang, K.; Yao, C.; Li, D.; Dai, Z. In situ synthesized high volume fraction WC reinforced Ni-based coating by laser cladding. Mater. Lett. 2017, 195, 178–181. [Google Scholar] [CrossRef]
- Zhang, J.; Lei, J.; Gu, Z.; Tantai, F.; Tian, H.; Han, J.; Fang, Y. Effect of WC-12Co content on wear and electrochemical corrosion properties of Ni-Cu/WC-12Co composite coatings deposited by laser cladding. Surf. Coat. Technol. 2020, 393, 125807. [Google Scholar] [CrossRef]
- Song, C.; Liu, X.; Ye, F.; Liu, Y.; Cheng, L. Mechanical and dielectric properties of SiCf/BN/SiBCN composites via different synthesis technologies. J. Eur. Ceram. Soc. 2019, 39, 4417–4423. [Google Scholar] [CrossRef]
- Pan, Y.; Liu, Y.; Zhao, M.; Wang, N.; Wang, C.; He, S.; Ye, F.; Cheng, L. Effects of oxidation temperature on microstructure and EMI shielding performance of layered SiC/PyC porous ceramics. J. Eur. Ceram. Soc. 2019, 39, 4527–4534. [Google Scholar] [CrossRef]
- Yamaguchi, T.; Hagino, H. Effects of the ambient oxygen concentration on WC-12Co cermet coatings fabricated by laser cladding. Opt. Laser Technol. 2021, 139, 106922. [Google Scholar] [CrossRef]
- Cao, Q.; Fan, L.; Chen, H.; Hou, Y.; Dong, L.; Ni, Z. Wear behavior of laser cladded WC-reinforced Ni-based coatings under low temperature. Tribol. Int. 2022, 176, 107939. [Google Scholar] [CrossRef]
- Zishan, C.; Hejun, L.; Qiangang, F.; Xinfa, Q. Tribological behaviors of SiC/h-BN composite coating at elevated temperatures. Tribol. Int. 2012, 56, 58–65. [Google Scholar] [CrossRef]
- Contin, A.; de Vasconcelos, G.; Barquete, D.M.; Campos, R.A.; Trava-Airoldi, V.J.; Corat, E.J. Laser cladding of SiC multilayers for diamond deposition on steel substrates. Diam. Relat. Mater. 2016, 65, 105–114. [Google Scholar] [CrossRef]
- Zhuang, H.; Zhang, L.; Staedler, T.; Jiang, X. Nanoscale integration of SiC/SiO2 core-shellnanocables in diamond through a simultaneous hybrid structure fabrication. Appl. Phys. Lett. 2012, 100, 193102. [Google Scholar] [CrossRef]
- Kumar, A.; Das, A.K. Evolution of microstructure and mechanical properties of Co-SiC tungsten inert gas cladded coating on 304 stainless steel. Eng. Sci. Technol. Int. J. 2021, 24, 591–604. [Google Scholar] [CrossRef]
- AKumar; Ram, R.K.; Das, A.K. Mechanical characteristics of Ti-SiC metal matrix composite coating on AISI 304 steel by gas tungsten arc (GTA) coating process. Mater. Today Proc. 2019, 17, 111–117. [Google Scholar]
- Li, Q.; Song, G.; Zhang, Y.; Lei, T.; Chen, W. Microstructure and dry sliding wear behavior of laser clad Ni-based alloy coating with the addition of SiC. Wear 2003, 254, 222–229. [Google Scholar] [CrossRef]
- Buytoz, S. Microstructural properties of SiC based hardfacing on low alloy steel. Surf. Coat. Technol. 2006, 200, 3734–3742. [Google Scholar] [CrossRef]
- Kretz, F.; Gácsi, Z.; Kovács, J.; Pieczonka, T. The electroless deposition of nickel on SiC particles for aluminum matrix composites. Surf. Coat. Technol. 2004, 180–181, 575–579. [Google Scholar] [CrossRef]
- Chen, M.; Pan, L.; Xia, X.; Zhou, W.; Li, Y. Boron nitride (BN) and BN based multiple-layer interphase for SiCf/SiC composites: A review. Ceram. Int. 2022, 48 Pt A, 34107–34127. [Google Scholar] [CrossRef]
- Richter, J.; Harabas, K. Micro-abrasion investigations of conventional and experimental supercoarse WC-(Ni, Co, Mo) composites. Int. J. Refract. Met. Hard Mater. 2019, 83, 104986. [Google Scholar] [CrossRef]
- Das, A.K.; Shariff, S.M.; Choudhury, A.R. Effect of rare earth oxide (Y2O3) addition on alloyed layer synthesized on Ti-6Al-4V substrate with Ti+SiC+h-BN mixed precursor by laser surface engineering. Tribol. Int. 2016, 95, 35–43. [Google Scholar] [CrossRef]
- Zhao, M.; Liu, Y.; Chai, N.; Qin, H.; Liu, X.; Ye, F.; Cheng, L.; Zhang, L. Effect of SiBCN content on the dielectric and EMW absorbing properties of SiBCN-Si3N4 composite ceramics. J. Eur. Ceram. Soc. 2018, 38, 1334–1340. [Google Scholar] [CrossRef]
- Mahdavi, S.; Akhlaghi, F. Effect of the SiC particle size on the dry sliding wear behavior of SiC and SiC-Gr-reinforced Al6061 composites. J. Mater. Sci. 2011, 46, 7883–7894. [Google Scholar] [CrossRef]
- Li, L.; Li, H.; Lin, H.; Zhuang, L.; Wang, S.; Feng, T.; Yao, X.; Fu, Q. Comparison of the oxidation behaviors of SiC coatings on C/C composites prepared by pack cementation and chemical vapor deposition. Surf. Coat. Technol. 2016, 302, 56–64. [Google Scholar] [CrossRef]
- Li, X.; Zhang, L.; Yin, X.; Feng, L.; Li, Q. Effect of chemical vapor infiltration of SiC on the mechanical and electromagnetic properties of Si3N4–SiC ceramic. Scr. Mater. 2010, 63, 657–660. [Google Scholar] [CrossRef]
- Li, Y.; Guo, L.; Song, Q.; Li, H.; Fu, Q.; Li, K.-Z. Oxidation pre-treatment and electrophoretic deposition of SiC nanowires to improve the thermal shock resistance of SiC coating for C/C composites. J. Alloys Compd. 2015, 636, 165–170. [Google Scholar] [CrossRef]
- Yin, S.; Jiang, Y.; Su, K.; Fang, X.; Wang, Y.; Li, Q.; Yang, J. Preparation, mechanical, dielectric and microwave absorption properties of hierarchical porous SiCnw-Si3N4 composite ceramics. J. Eur. Ceram. Soc. 2022, 42, 3820–3830. [Google Scholar] [CrossRef]
- Zhou, W.; Long, L.; Li, Y. Mechanical and electromagnetic wave absorption properties of Cf-Si3N4 ceramics with PyC/SiC interphases. J. Mater. Sci. Technol. 2019, 35, 2809–2813. [Google Scholar] [CrossRef]
- Mazumder, S.; Metselaar, H.S.C.; Sukiman, N.L.; Zulkifli, N.W.M. Friction and wear behavior of fluoride added Si3N4-SiC ceramic composites at elevated temperature. Ceram. Int. 2023, 49, 12787–12795. [Google Scholar] [CrossRef]
- Lusquiños, F.; Pou, J.; Quintero, F.; Pérez-Amor, M. Laser cladding of SiC/Si composite coating on Si-SiC ceramic substrates. Surf. Coat. Technol. 2008, 202, 1588–1593. [Google Scholar] [CrossRef]
- Zheng, B.J.; Chen, X.M.; Lian, J.S. Microstructure and wear property of laser cladding Al+SiC powders on AZ91D magnesium alloy. Opt. Lasers Eng. 2010, 48, 526–532. [Google Scholar] [CrossRef]
- Sun, X.; Zhang, J.; Pan, W.; Wang, W.; Tang, C. A review on the preparation and application of BN composite coatings. Ceram. Int. 2023, 49, 24–39. [Google Scholar] [CrossRef]
- Li, N.; Xiong, Y.; Xiong, H.; Shi, G.; Blackburn, J.; Liu, W.; Qin, R. Microstructure, formation mechanism and property characterization of Ti+SiC laser cladded coatings on Ti6Al4V alloy. Mater. Charact. 2019, 148, 43–51. [Google Scholar] [CrossRef]
- Majumdar, J.D.; Chandra, B.R.; Nath, A.K.; Manna, I. Laser composite surfacing of stainless steel with SiC. Phys. Stat. Sol. (A) 2006, 203, 2260–2265. [Google Scholar] [CrossRef]
- Lee, S.; Shin, Y.; Bae, D.; Min, B.; Park, J.; Kohyama, A. Fabrication of liquid phase sintered SiC materials and their characterization. Fusion Eng. Des. 2006, 81, 963–967. [Google Scholar] [CrossRef]
- Rebillat, F.; Lamon, J.; Guette, A. The concept of a strong interface applied to SiC/SiC composites with a BN interphase. Acta Mater. 2000, 48, 4609–4618. [Google Scholar] [CrossRef]
- Eichler, J.; Lesniak, C. Boron nitride (BN) and BN composites for high-temperature applications. J. Eur. Ceram. Soc. 2008, 28, 1105–1109. [Google Scholar] [CrossRef]
- Zadeh, L.A. Fuzzy logica personal perspective. Fuzzy Sets Syst. 2015, 281, 4–20. [Google Scholar] [CrossRef]
- Lee, J.; Um, K. A comparison in a back-bead prediction of gas metal arc welding using multiple regression analysis and artificial neural network. Opt. Lasers Eng. 2000, 34, 149–158. [Google Scholar] [CrossRef]
- Pal, S.; Pal, S.K.; Samantaray, A.K. Artificial neural network modeling of weld joint strength prediction of a pulsed metal inert gas welding process using arc signals. J. Mater. Process. Technol. 2008, 202, 464–474. [Google Scholar] [CrossRef]
- Nagesh, D.S.; Datta, G.L. Prediction of weld bead geometry and penetration in shielded metal-arc welding using artificial neural networks. J. Mater. Process. Technol. 2002, 123, 303–312. [Google Scholar] [CrossRef]
- Wang, C.-R.; Zhong, Z.-Q.; Jean, M.-D. Effect of ingredients proportions on mechanical properties in laser coated WC-blend welds. Phys. Scr. 2024, 99, 035945. [Google Scholar] [CrossRef]
- Contuzzi, N.; Casalino, G. On modelling Nd:Yag nanosecond laser milling process by neural network and multi response prediction methods. Opt.-Int. J. Light Electron Opt. 2023, 284, 170937. [Google Scholar] [CrossRef]
- Liu, M.; Duan, C.; Li, G.; Cai, Y.; Wang, F.; Li, L. Multi-response optimization of Ni-based laser cladding via principal component analysis and grey relational analysis. Opt.-Int. J. Light Electron Opt. 2023, 287, 171122. [Google Scholar] [CrossRef]
- Liu, J.C.; Ni, L.B. Prediction of laser clad parameters based on neural network. Mater. Technol. Adv. Perform. Mater. 2012, 27, 11–14. [Google Scholar] [CrossRef]
- Zhou, Z.; Du, Y.; He, G.; Xu, L.; Shu, L. Optimization and Characterization of Laser Cladding of 15-5PH Coating on 20Cr13 Stainless Steel. J. Mater. Eng. Perform. 2023, 32, 962–977. [Google Scholar] [CrossRef]
- Gao, J.; Wang, C.; Hao, Y.; Liang, X.; Zhao, K. Prediction of TC11 single-track geometry in laser metal deposition based on back propagation neural network and random forest. J. Mech. Sci. Technol. 2022, 36, 1417–1425. [Google Scholar] [CrossRef]
- Chen, L.; Yu, T.; Chen, X.; Zhao, Y.; Guan, C. Process optimization, microstructure and microhardness of coaxial laser cladding TiC reinforced Ni-based composite coatings. Opt. Laser Technol. 2022, 152, 108129. [Google Scholar] [CrossRef]
- Saeedi, R.; Razavi, R.S.; Bakhshi, S.R.; Erfanmanesh, M.; Bani, A.A. Optimization and characterization of laser cladding of NiCr and NiCr-TiC composite coatings on AISI 420 stainless steel. Ceram. Int. 2021, 47, 4097–4110. [Google Scholar] [CrossRef]
- Fang, J.-X.; Wang, J.-X.; Wang, Y.-J.; He, H.-T.; Zhang, D.-B.; Cao, Y. Microstructure evolution and deformation behavior during stretching of a compositionally inhomogeneous TWIP-TRIP cantor-like alloy by laser powder deposition. Mater. Sci. Eng. A 2022, 847, 143319. [Google Scholar] [CrossRef]
- Jiang, X.-J.; Bao, S.-J.; Zhang, L.-W.; Zhang, X.-Y.; Jiao, L.-S.; Qi, H.-B.; Wang, F. Effect of Zr on microstructure and properties of TC4 alloy fabricated by laser additive manufacturing. J. Mater. Res. Technol. 2023, 24, 8782–8792. [Google Scholar] [CrossRef]
- Jang, J.S.R. ANFIS: Adaptive-Network–Based Fuzzy Inference System. IEEE Trans. Syst. Man Cybern. 1993, 23, 665–685. [Google Scholar] [CrossRef]
- Fu, L.-L.; Yang, J.-S.; Li, S.; Luo, H.; Wu, J.-H. Artificial neural network-based damage detection of composite material using laser ultrasonic technology. Measurement 2023, 220, 113435. [Google Scholar] [CrossRef]
- Mahmood, M.A.; Popescu, A.C.; Oane, M. Bridging the analytical and artificial neural network models for keyhole formation with experimental verification in laser melting deposition: A novel approach. Results Phys. 2021, 26, 104440. [Google Scholar] [CrossRef]
- Andersen, K.; Cook, G.E.; Karsai, G.; Ramaswamy, K. Artificial neural network applied to arc welding process modeling and control. IEEE Trans Ind. Appl. 1990, 26, 824–830. [Google Scholar] [CrossRef]
- Chowdhury, S.; Anand, S. Artificial neural network based geometric compensation for thermal deformation in additive manufacturing processes. In Proceedings of the International Manufacturing Science and Engineering Conference, Blacksburg, VA, USA, 27 June 2016. [Google Scholar]
- Sudnik, W.; Radaj, D.; Erofeew, W. Computerized simulation of laser beam welding, modelling and verification. J. Phys. D Appl. Phys. 1996, 29, 2811–2817. [Google Scholar] [CrossRef]
- Zhang, Y.; Xu, Y.; Sun, Y.; Cheng, W. Surface quality optimization of laser cladding based on surface response and genetic neural network model. Surf. Topogr. Metrol. Prop. 2022, 10, 044007. [Google Scholar] [CrossRef]
- Genna, S.; Menna, E.; Rubino, G.; Trovalusci, F. Laser machining of silicon carbide: Experimental analysis and multiobjective optimization. Ceram. Int. 2023, 49, 10682–10691. [Google Scholar] [CrossRef]
Figure 1.
(a) The process of laser cladding used in this work. (b) Enlarged schematic diagram of the operation of laser cladding of a specimen.
Figure 1.
(a) The process of laser cladding used in this work. (b) Enlarged schematic diagram of the operation of laser cladding of a specimen.

Figure 2.
A framework of ANFIS model with five layers, including fuzzy membership layer, fuzzification layer, normalisation layer, defuzzification layer, and output layer.
Figure 2.
A framework of ANFIS model with five layers, including fuzzy membership layer, fuzzification layer, normalisation layer, defuzzification layer, and output layer.

Figure 3.
Three inputs and one output fuzzy inference system for laser-coated BN/SiC/Ni welds.
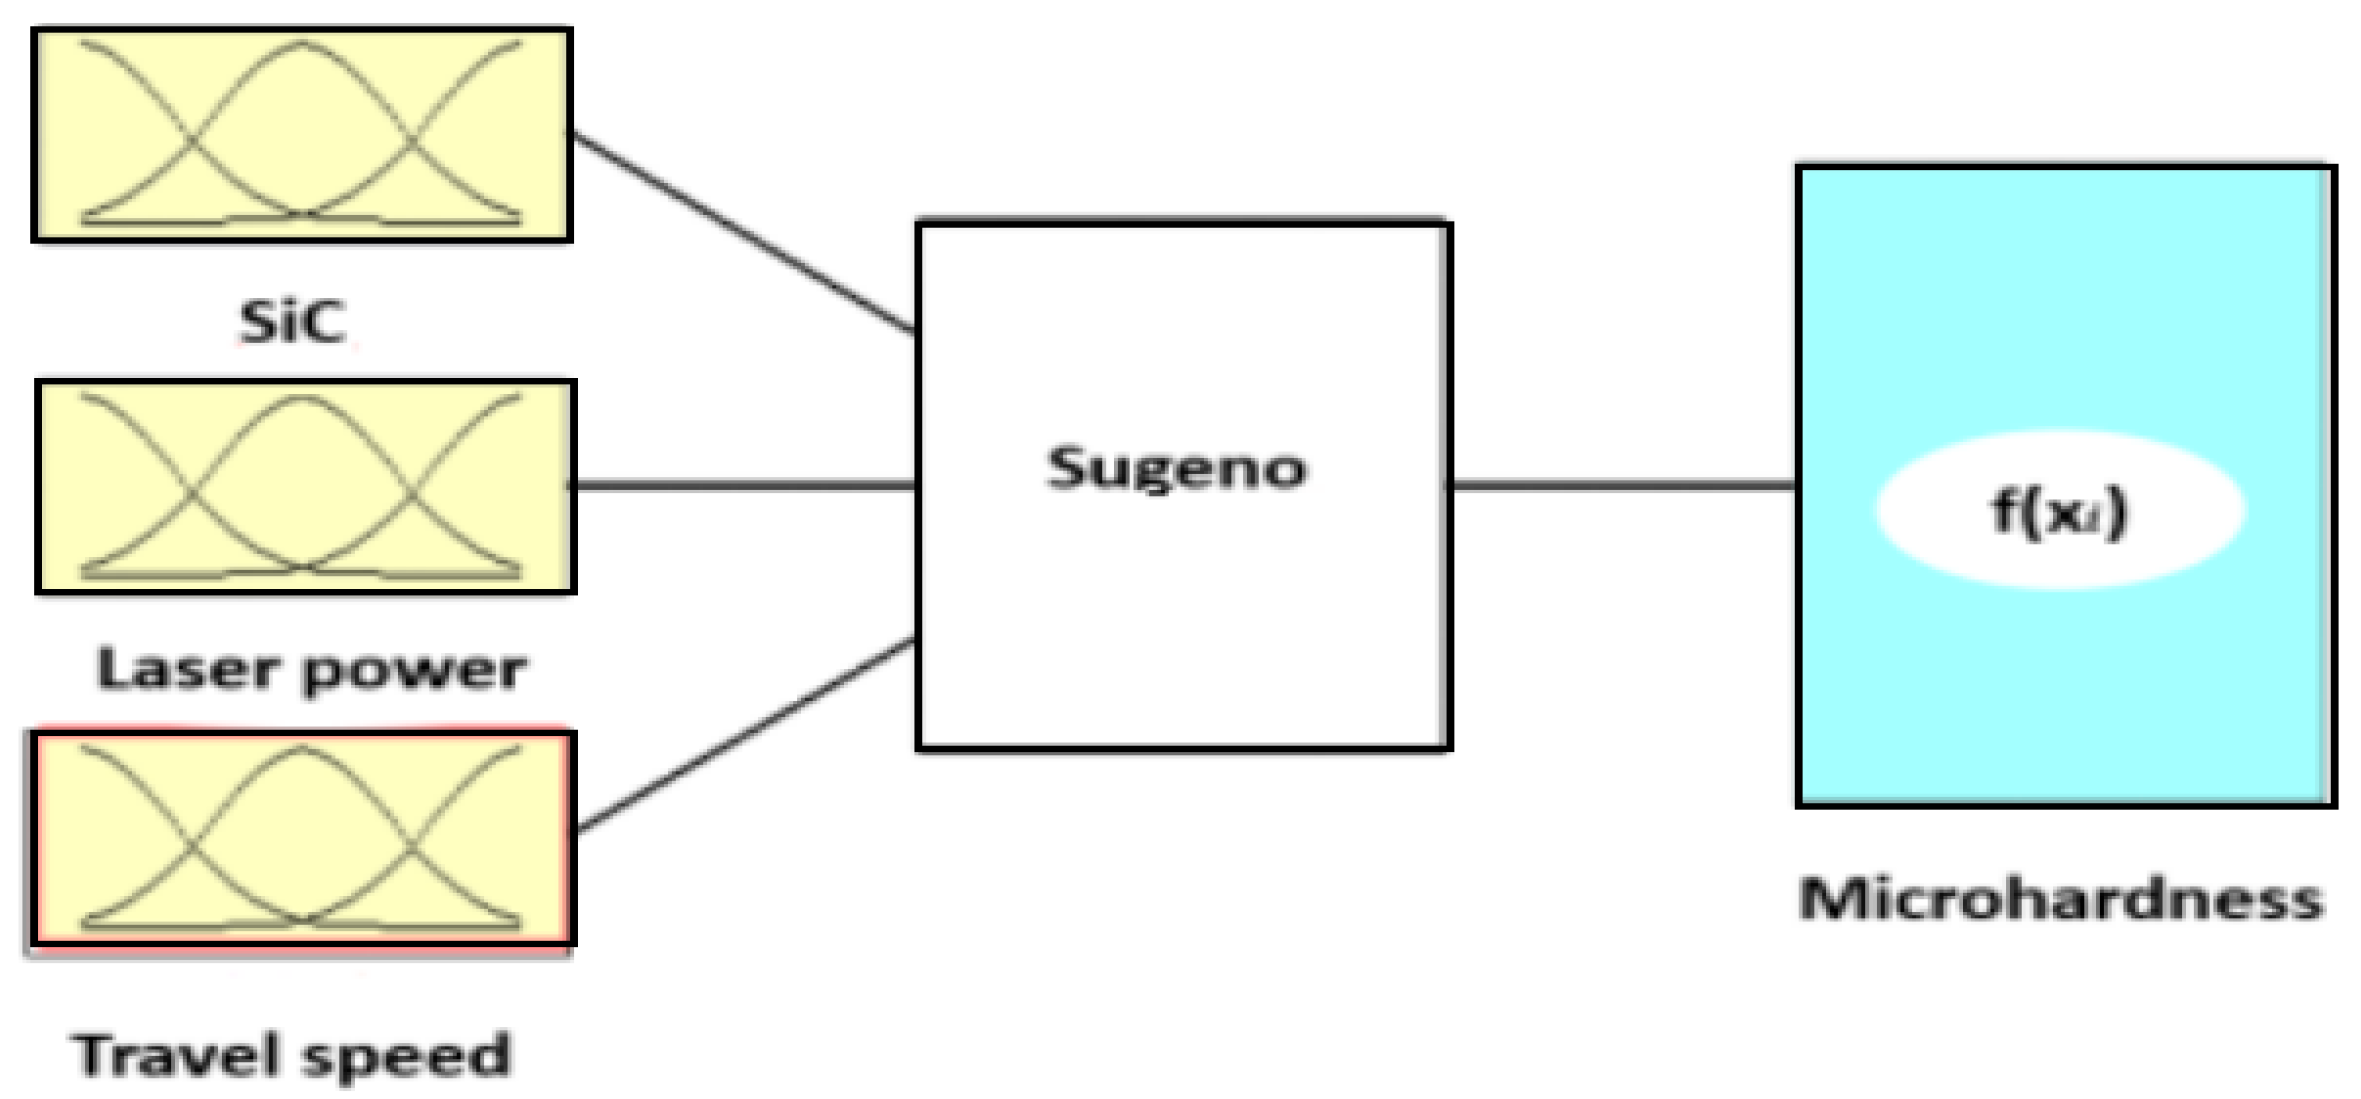
Figure 4.
Comparison of signal-to-noise ratio and histograms of microhardness with a standard deviation of laser-coated NB/SiC/Ni welds.
Figure 4.
Comparison of signal-to-noise ratio and histograms of microhardness with a standard deviation of laser-coated NB/SiC/Ni welds.

Figure 5.
The distribution of microhardness values for BN/SiC/Ni welds with tests 4, 9, 13, and 14, including the melting zone, the heat-affected zone, and the matrix.
Figure 5.
The distribution of microhardness values for BN/SiC/Ni welds with tests 4, 9, 13, and 14, including the melting zone, the heat-affected zone, and the matrix.
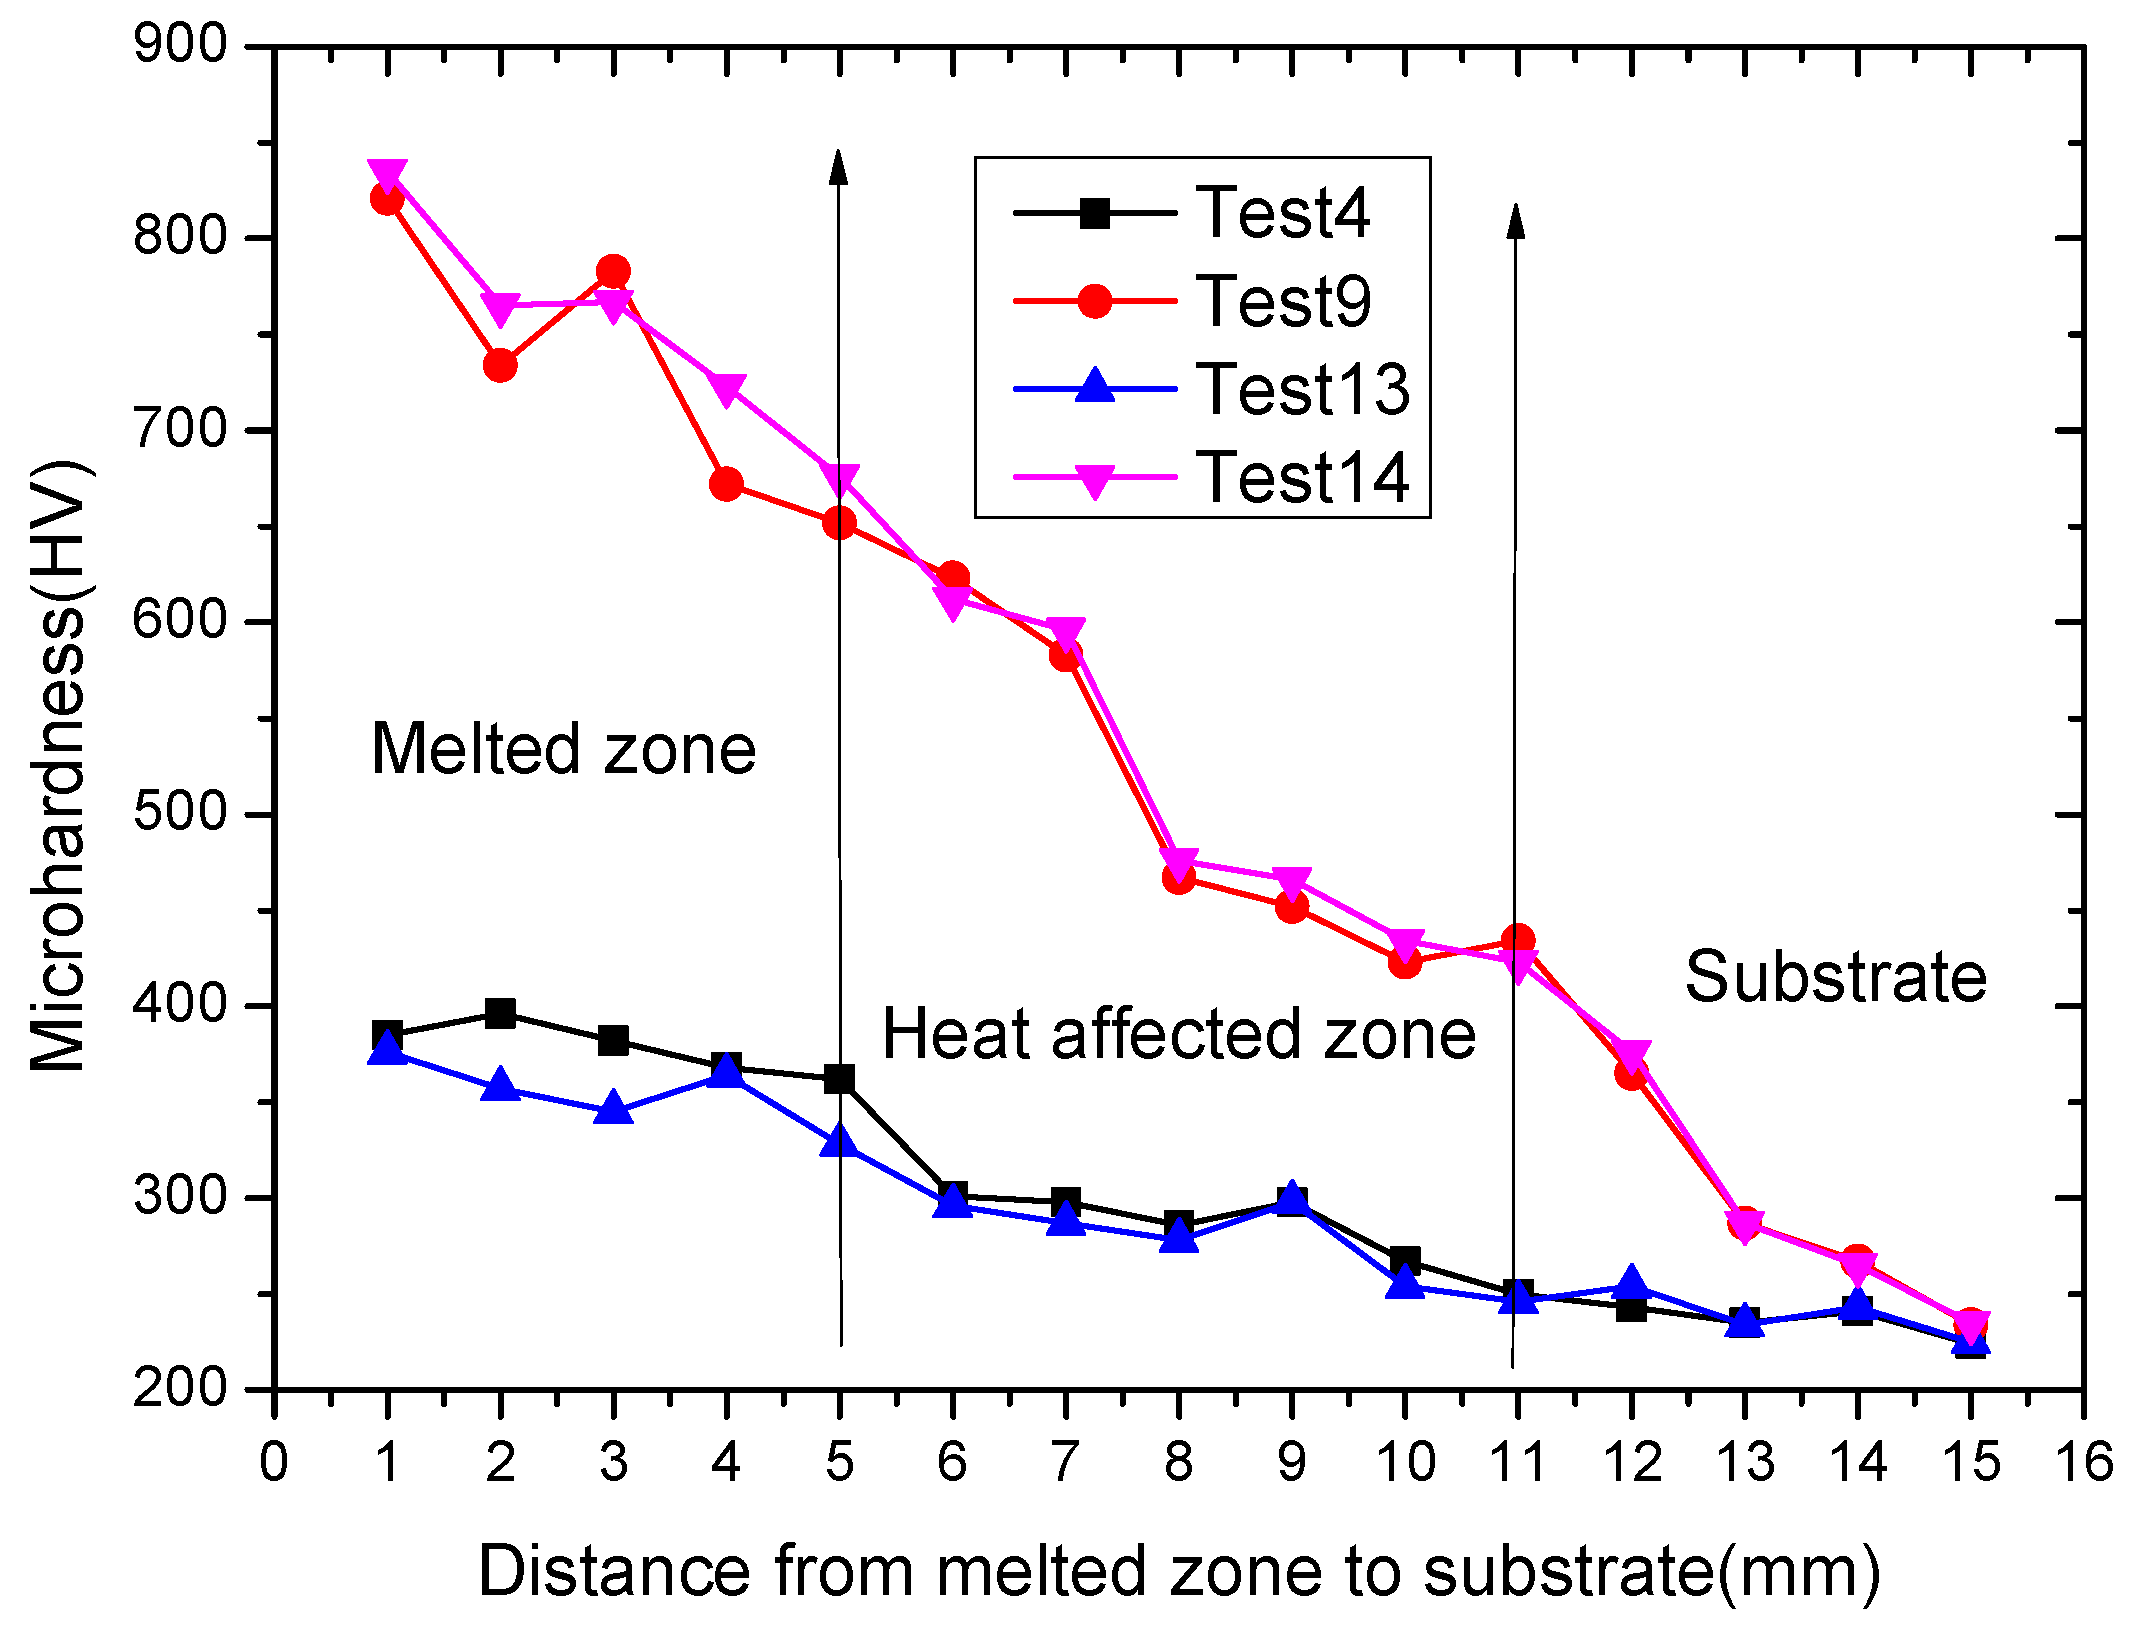
Figure 6.
SEM microstructures of various tests in the deposits by laser cladding, including (a) trial 4; (b) trial 9; (c) trial 13; and (d) trial 14.
Figure 6.
SEM microstructures of various tests in the deposits by laser cladding, including (a) trial 4; (b) trial 9; (c) trial 13; and (d) trial 14.

Figure 7.
The elemental intensity of the EDS surface analysis with Figure 6 in a laser-coated weld. (a) trial 4 (b) trial 9 (c) trial 13 (d) trial 14.
Figure 7.
The elemental intensity of the EDS surface analysis with Figure 6 in a laser-coated weld. (a) trial 4 (b) trial 9 (c) trial 13 (d) trial 14.

Figure 8.
Triangular contour plots for three mixed powder effects with a linear mixture, accounting for the effects of individual and mixed powder components, including SiC, BN, and Ni alloys for the hardness. (a) Three-dimensional surface plot. (b) Contour plot of predicted hardness.
Figure 8.
Triangular contour plots for three mixed powder effects with a linear mixture, accounting for the effects of individual and mixed powder components, including SiC, BN, and Ni alloys for the hardness. (a) Three-dimensional surface plot. (b) Contour plot of predicted hardness.
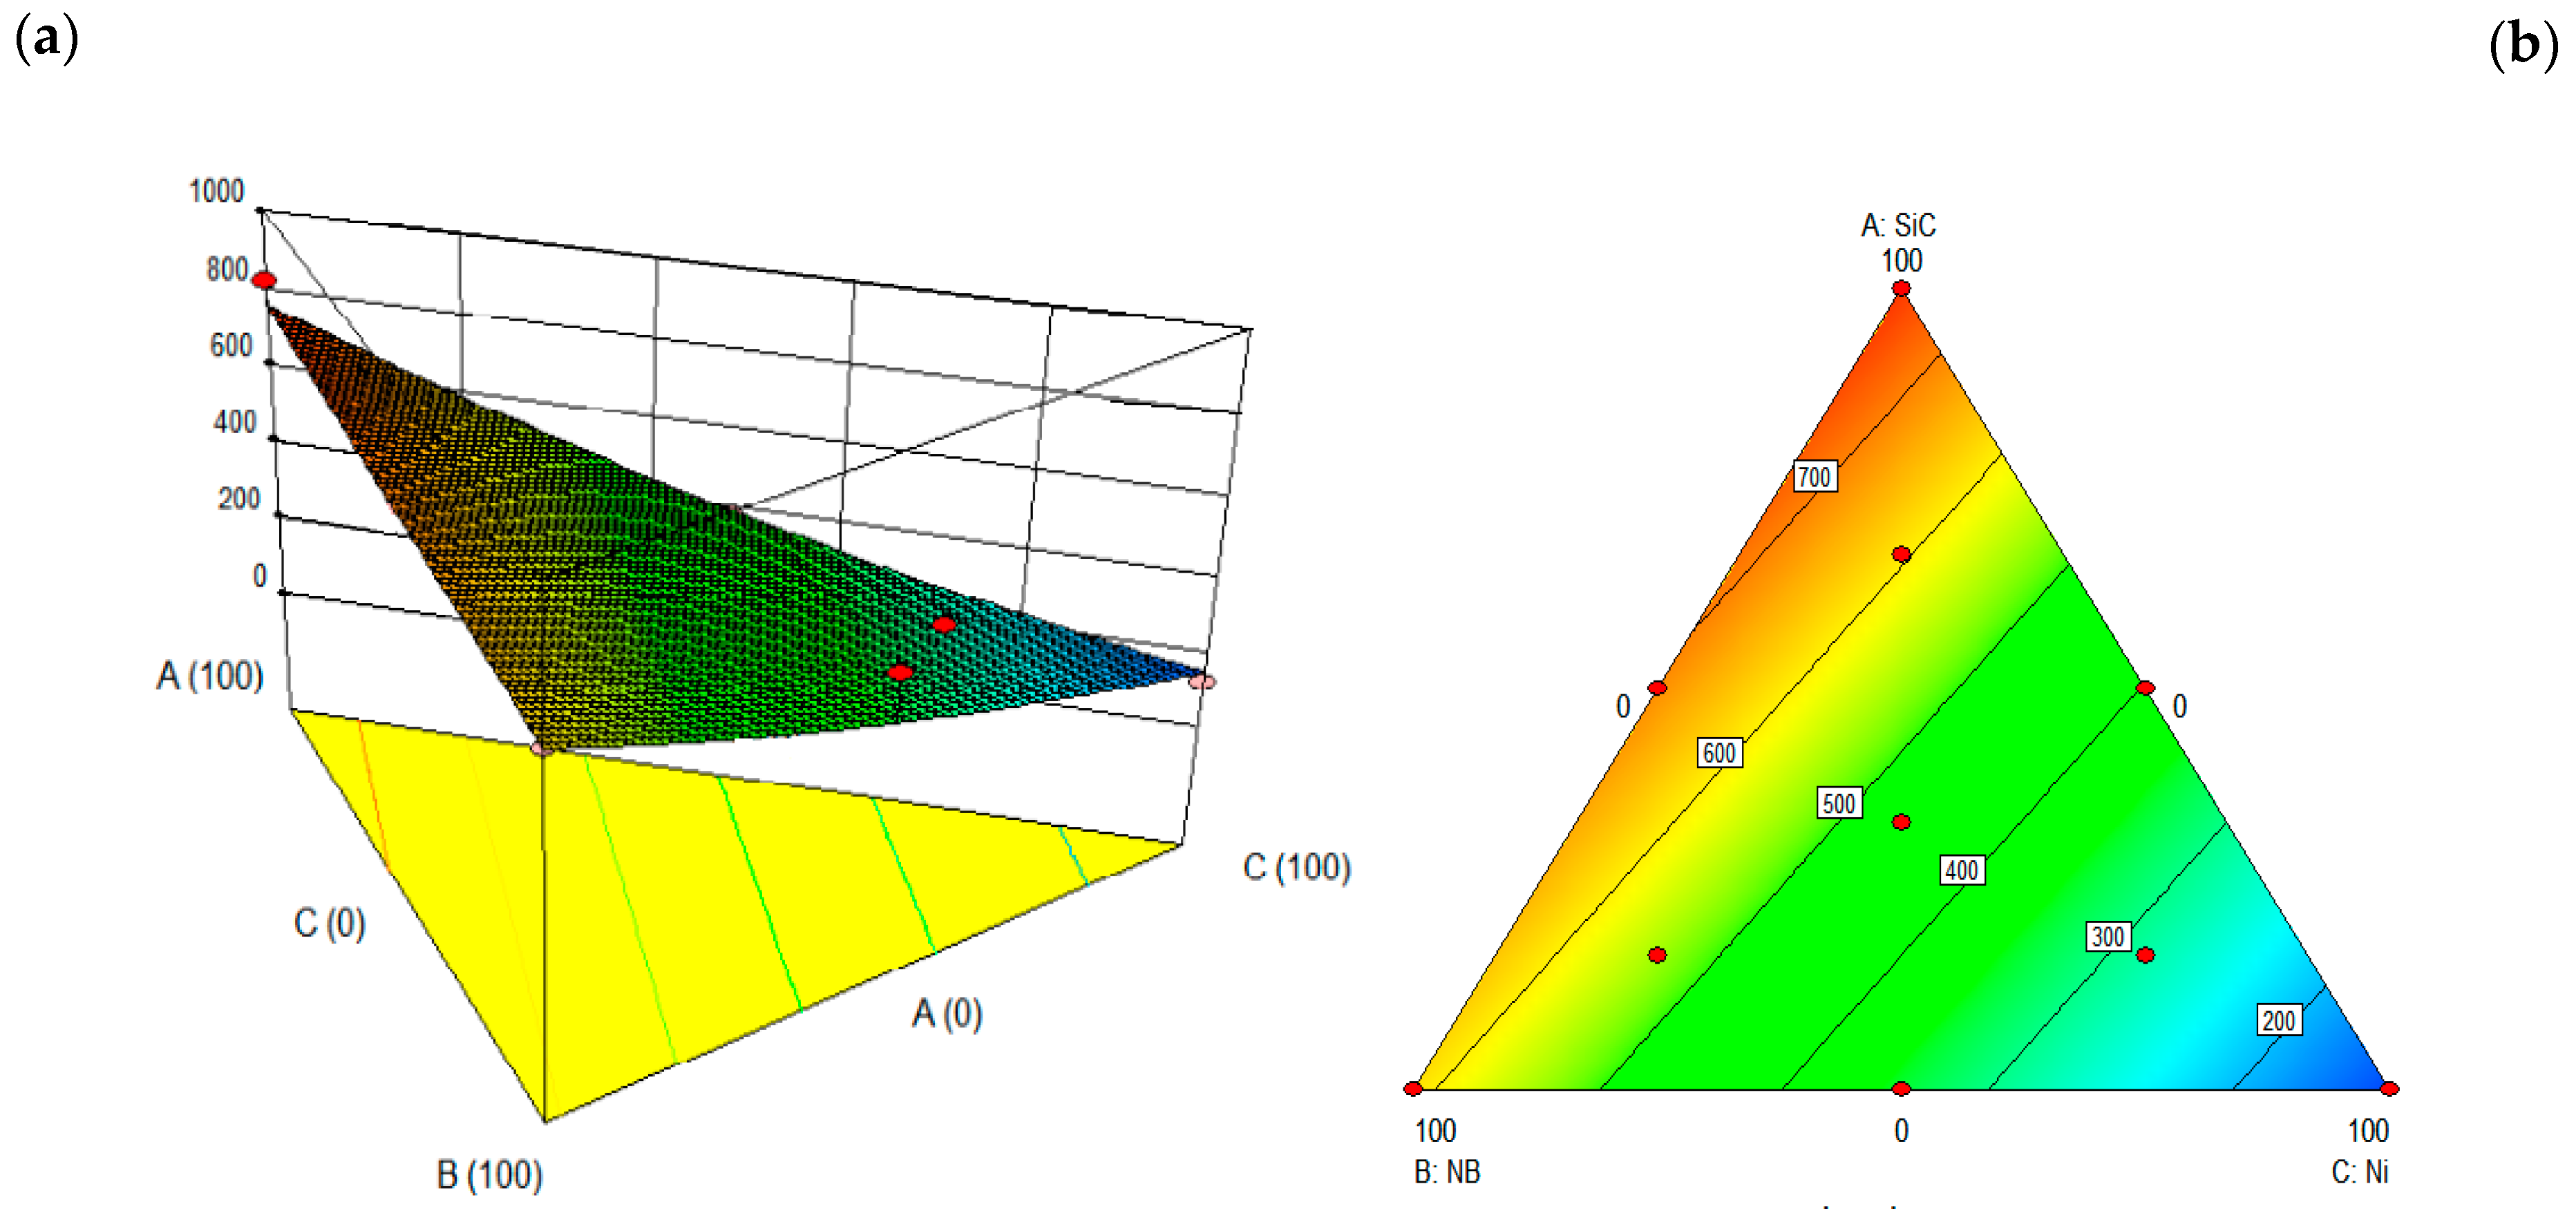
Figure 9.
Comparison of probability density for the five trials in the orthogonal table, with trial 9, trial 14, and the optimal trial.
Figure 9.
Comparison of probability density for the five trials in the orthogonal table, with trial 9, trial 14, and the optimal trial.

Figure 10.
Rule base for fuzzy logic inference using a neural network in ANFIS with 3 inputs, i.e., SiC, laser power, and travelling speed, and 1 output for micro hardness.
Figure 10.
Rule base for fuzzy logic inference using a neural network in ANFIS with 3 inputs, i.e., SiC, laser power, and travelling speed, and 1 output for micro hardness.

Figure 11.
A framework for training the ANFIS model (a), the error function of the training algorithm (b), and the plot of the training (c) and testing (d) predicted values for the ANFIS model against the experimental values.
Figure 11.
A framework for training the ANFIS model (a), the error function of the training algorithm (b), and the plot of the training (c) and testing (d) predicted values for the ANFIS model against the experimental values.

Figure 12.
The prediction results of the ANFIS model in comparison with the experimental data.

Figure 13.
Response surface plots for modelling the hardness yield of laser-coated silicon carbide/boron nitride/nickel welds using the ANFIS model. (a) SiC and laser power (b) laser power and travel speed (c) travel speed and SiC.
Figure 13.
Response surface plots for modelling the hardness yield of laser-coated silicon carbide/boron nitride/nickel welds using the ANFIS model. (a) SiC and laser power (b) laser power and travel speed (c) travel speed and SiC.


Table 1.
Control factors and their levels for butt joints.
| Symbol | Controllable Factors | Level 1 | Level 2 | Level 3 |
|---|---|---|---|---|
| A | Base metal | 40Cr steel | #45 steel | - |
| B | BN (wt%) | 0 | 15 | 30 |
| C | SiC (wt%) | 100 | 85 | 70 |
| D | Ni (wt%) | 0 | 15 | 30 |
| E | Power of laser (W) | 2400 | 2600 | 2800 |
| F | Carrier gas (mL/min) | 1400 | 1600 | 1800 |
| G | Travel speed (mm/s) | 2 | 4 | 6 |
| H | Stand-off distance (mm) | 40 | 45 | 50 |
Table 2.
An orthogonal array with six parameters and three levels and the observed response by laser cladding.
Table 2.
An orthogonal array with six parameters and three levels and the observed response by laser cladding.
| EXP | A | B | C | D | E | F | G | H | Microhardness (HV) | S/N Ratio (dB) | ||||
|---|---|---|---|---|---|---|---|---|---|---|---|---|---|---|
| H1 | H2 | H3 | Mean | St.Dev | ||||||||||
| 1 | 1 | 1 | 1 | 1 | 1 | 1 | 1 | 1 | 423 | 442 | 440 | 434.9 | 8.5 | 52.77 |
| 2 | 1 | 1 | 2 | 2 | 2 | 2 | 2 | 2 | 437 | 434 | 472 | 447.6 | 17.2 | 53.02 |
| 3 | 1 | 1 | 3 | 3 | 3 | 3 | 3 | 3 | 478 | 479 | 500 | 485.7 | 10.2 | 53.73 |
| 4 | 1 | 2 | 1 | 1 | 2 | 2 | 3 | 3 | 367 | 386 | 377 | 376.8 | 7.8 | 51.52 |
| 5 | 1 | 2 | 2 | 2 | 3 | 3 | 1 | 1 | 431 | 453 | 443 | 442.3 | 9.0 | 52.91 |
| 6 | 1 | 2 | 3 | 3 | 1 | 1 | 2 | 2 | 596 | 589 | 626 | 603.5 | 15.8 | 55.61 |
| 7 | 1 | 3 | 1 | 2 | 1 | 3 | 2 | 3 | 484 | 499 | 488 | 490.4 | 6.3 | 53.81 |
| 8 | 1 | 3 | 2 | 3 | 2 | 1 | 3 | 1 | 412 | 432 | 424 | 422.5 | 8.2 | 52.52 |
| 9 | 1 | 3 | 3 | 1 | 3 | 2 | 1 | 2 | 712 | 698 | 754 | 721.2 | 23.6 | 57.16 |
| 10 | 2 | 1 | 1 | 3 | 3 | 2 | 2 | 1 | 353 | 376 | 380 | 369.7 | 11.9 | 51.36 |
| 11 | 2 | 1 | 2 | 1 | 1 | 3 | 3 | 2 | 412 | 443 | 442 | 432.4 | 14.4 | 52.72 |
| 12 | 2 | 1 | 3 | 2 | 2 | 1 | 1 | 3 | 578 | 602 | 609 | 596.4 | 13.3 | 55.51 |
| 13 | 2 | 2 | 1 | 2 | 3 | 1 | 3 | 2 | 345 | 376 | 348 | 356.4 | 13.9 | 51.04 |
| 14 | 2 | 2 | 2 | 3 | 1 | 2 | 1 | 3 | 712 | 756 | 796 | 754.6 | 34.2 | 57.55 |
| 15 | 2 | 2 | 3 | 1 | 2 | 3 | 2 | 1 | 567 | 586 | 575 | 575.9 | 7.8 | 55.21 |
| 16 | 2 | 3 | 1 | 3 | 2 | 3 | 1 | 2 | 375 | 396 | 382 | 384.4 | 8.7 | 51.70 |
| 17 | 2 | 3 | 2 | 1 | 3 | 1 | 2 | 3 | 479 | 470 | 528 | 492.3 | 25.4 | 53.84 |
| 18 | 2 | 3 | 3 | 2 | 1 | 2 | 3 | 1 | 493 | 512 | 529 | 511.4 | 14.7 | 54.18 |
Table 3.
The chemical composition of laser-coated SiC/BN/Ni welds by weight percentage (%) of atomic concentration, as shown by EDS surface analysis in Figure 7.
Table 3.
The chemical composition of laser-coated SiC/BN/Ni welds by weight percentage (%) of atomic concentration, as shown by EDS surface analysis in Figure 7.
| No. of Trials | Atomic Concentration (%) | ||||
|---|---|---|---|---|---|
| C | O | Si | Fe | Ni | |
| Trial 4 | 5.509 | 11.820 | 0.539 | 81.580 | 0.551 |
| Trial 9 | 2.051 | 24.967 | 0.383 | 69.031 | 3.568 |
| Trial 13 | 2.746 | 3.845 | 0.342 | 92.651 | 0.337 |
| Trial14 | 2.564 | 5.259 | 0.516 | 90.611 | 1.050 |
Table 4.
The main effect of S/N ratios during the hardness of welds by laser cladding.
| A | B | C | D | E | F | G | H | |
|---|---|---|---|---|---|---|---|---|
| Level 1 | 53.67 | 53.18 | 52.03 | 53.87 | 54.44 | 53.55 | 54.60 | 53.16 |
| Level 2 | 53.68 | 53.98 | 53.76 | 53.41 | 53.24 | 54.13 | 53.81 | 53.54 |
| Level 3 | 0.00 | 53.87 | 55.23 | 53.74 | 53.34 | 53.35 | 52.62 | 54.33 |
| Effect | 0.01 | 0.79 | 3.20 | 0.46 | 1.19 | 0.79 | 1.98 | 1.17 |
| Rank | 8 | 5 | 1 | 7 | 3 | 6 | 2 | 4 |
Table 5.
An ANOVA table for S/N ratios during the hardness of welds by laser cladding.
| Control Factors | Sum of Squares | Degrees of Freedom | Mean Square | Test Ratio | Contribution |
|---|---|---|---|---|---|
| A | 0.00013 | 1.0 | 0.00013 | 0.00006 | 0.00 |
| B | 2.214 | 2.0 | 1.107 | 0.469 | 3.57 |
| C | 30.794 | 2.0 | 15.397 | 6.528 | 49.71 |
| D | 0.674 | 2.0 | 0.337 | 0.143 | 1.09 |
| E | 5.291 | 2.0 | 2.646 | 1.122 | 8.54 |
| F | 1.996 | 2.0 | 0.998 | 0.423 | 3.22 |
| G | 11.973 | 2.0 | 5.987 | 2.538 | 19.33 |
| H | 4.284 | 2.0 | 2.142 | 0.908 | 6.92 |
| Error | 4.717 | 2.0 | 2.359 | 1.000 | 7.62 |
| Total | 61.944 | 17.0 | 3.644 | 100.00 |
Disclaimer/Publisher’s Note: The statements, opinions and data contained in all publications are solely those of the individual author(s) and contributor(s) and not of MDPI and/or the editor(s). MDPI and/or the editor(s) disclaim responsibility for any injury to people or property resulting from any ideas, methods, instructions or products referred to in the content. |
© 2024 by the authors. Licensee MDPI, Basel, Switzerland. This article is an open access article distributed under the terms and conditions of the Creative Commons Attribution (CC BY) license (https://creativecommons.org/licenses/by/4.0/).
Share and Cite
MDPI and ACS Style
Zou, Z.; Chen, J.; Jean, M.-D. Predictive Modelling and Optimization of the Mechanical Properties of Laser-Coated NB/SiC/Ni Welds Using an ANFIS. Metals 2024, 14, 585. https://doi.org/10.3390/met14050585
AMA Style
Zou Z, Chen J, Jean M-D. Predictive Modelling and Optimization of the Mechanical Properties of Laser-Coated NB/SiC/Ni Welds Using an ANFIS. Metals. 2024; 14(5):585. https://doi.org/10.3390/met14050585
Chicago/Turabian StyleZou, Zhe, Juan Chen, and Ming-Der Jean. 2024. "Predictive Modelling and Optimization of the Mechanical Properties of Laser-Coated NB/SiC/Ni Welds Using an ANFIS" Metals 14, no. 5: 585. https://doi.org/10.3390/met14050585
Note that from the first issue of 2016, this journal uses article numbers instead of page numbers. See further details here.